How to Use Reference Lines
Reference lines in charts are useful for understanding trends more clearly.
This note explains how to set up reference lines in Exploratory.
Basic Usage
Setting Up Reference Lines
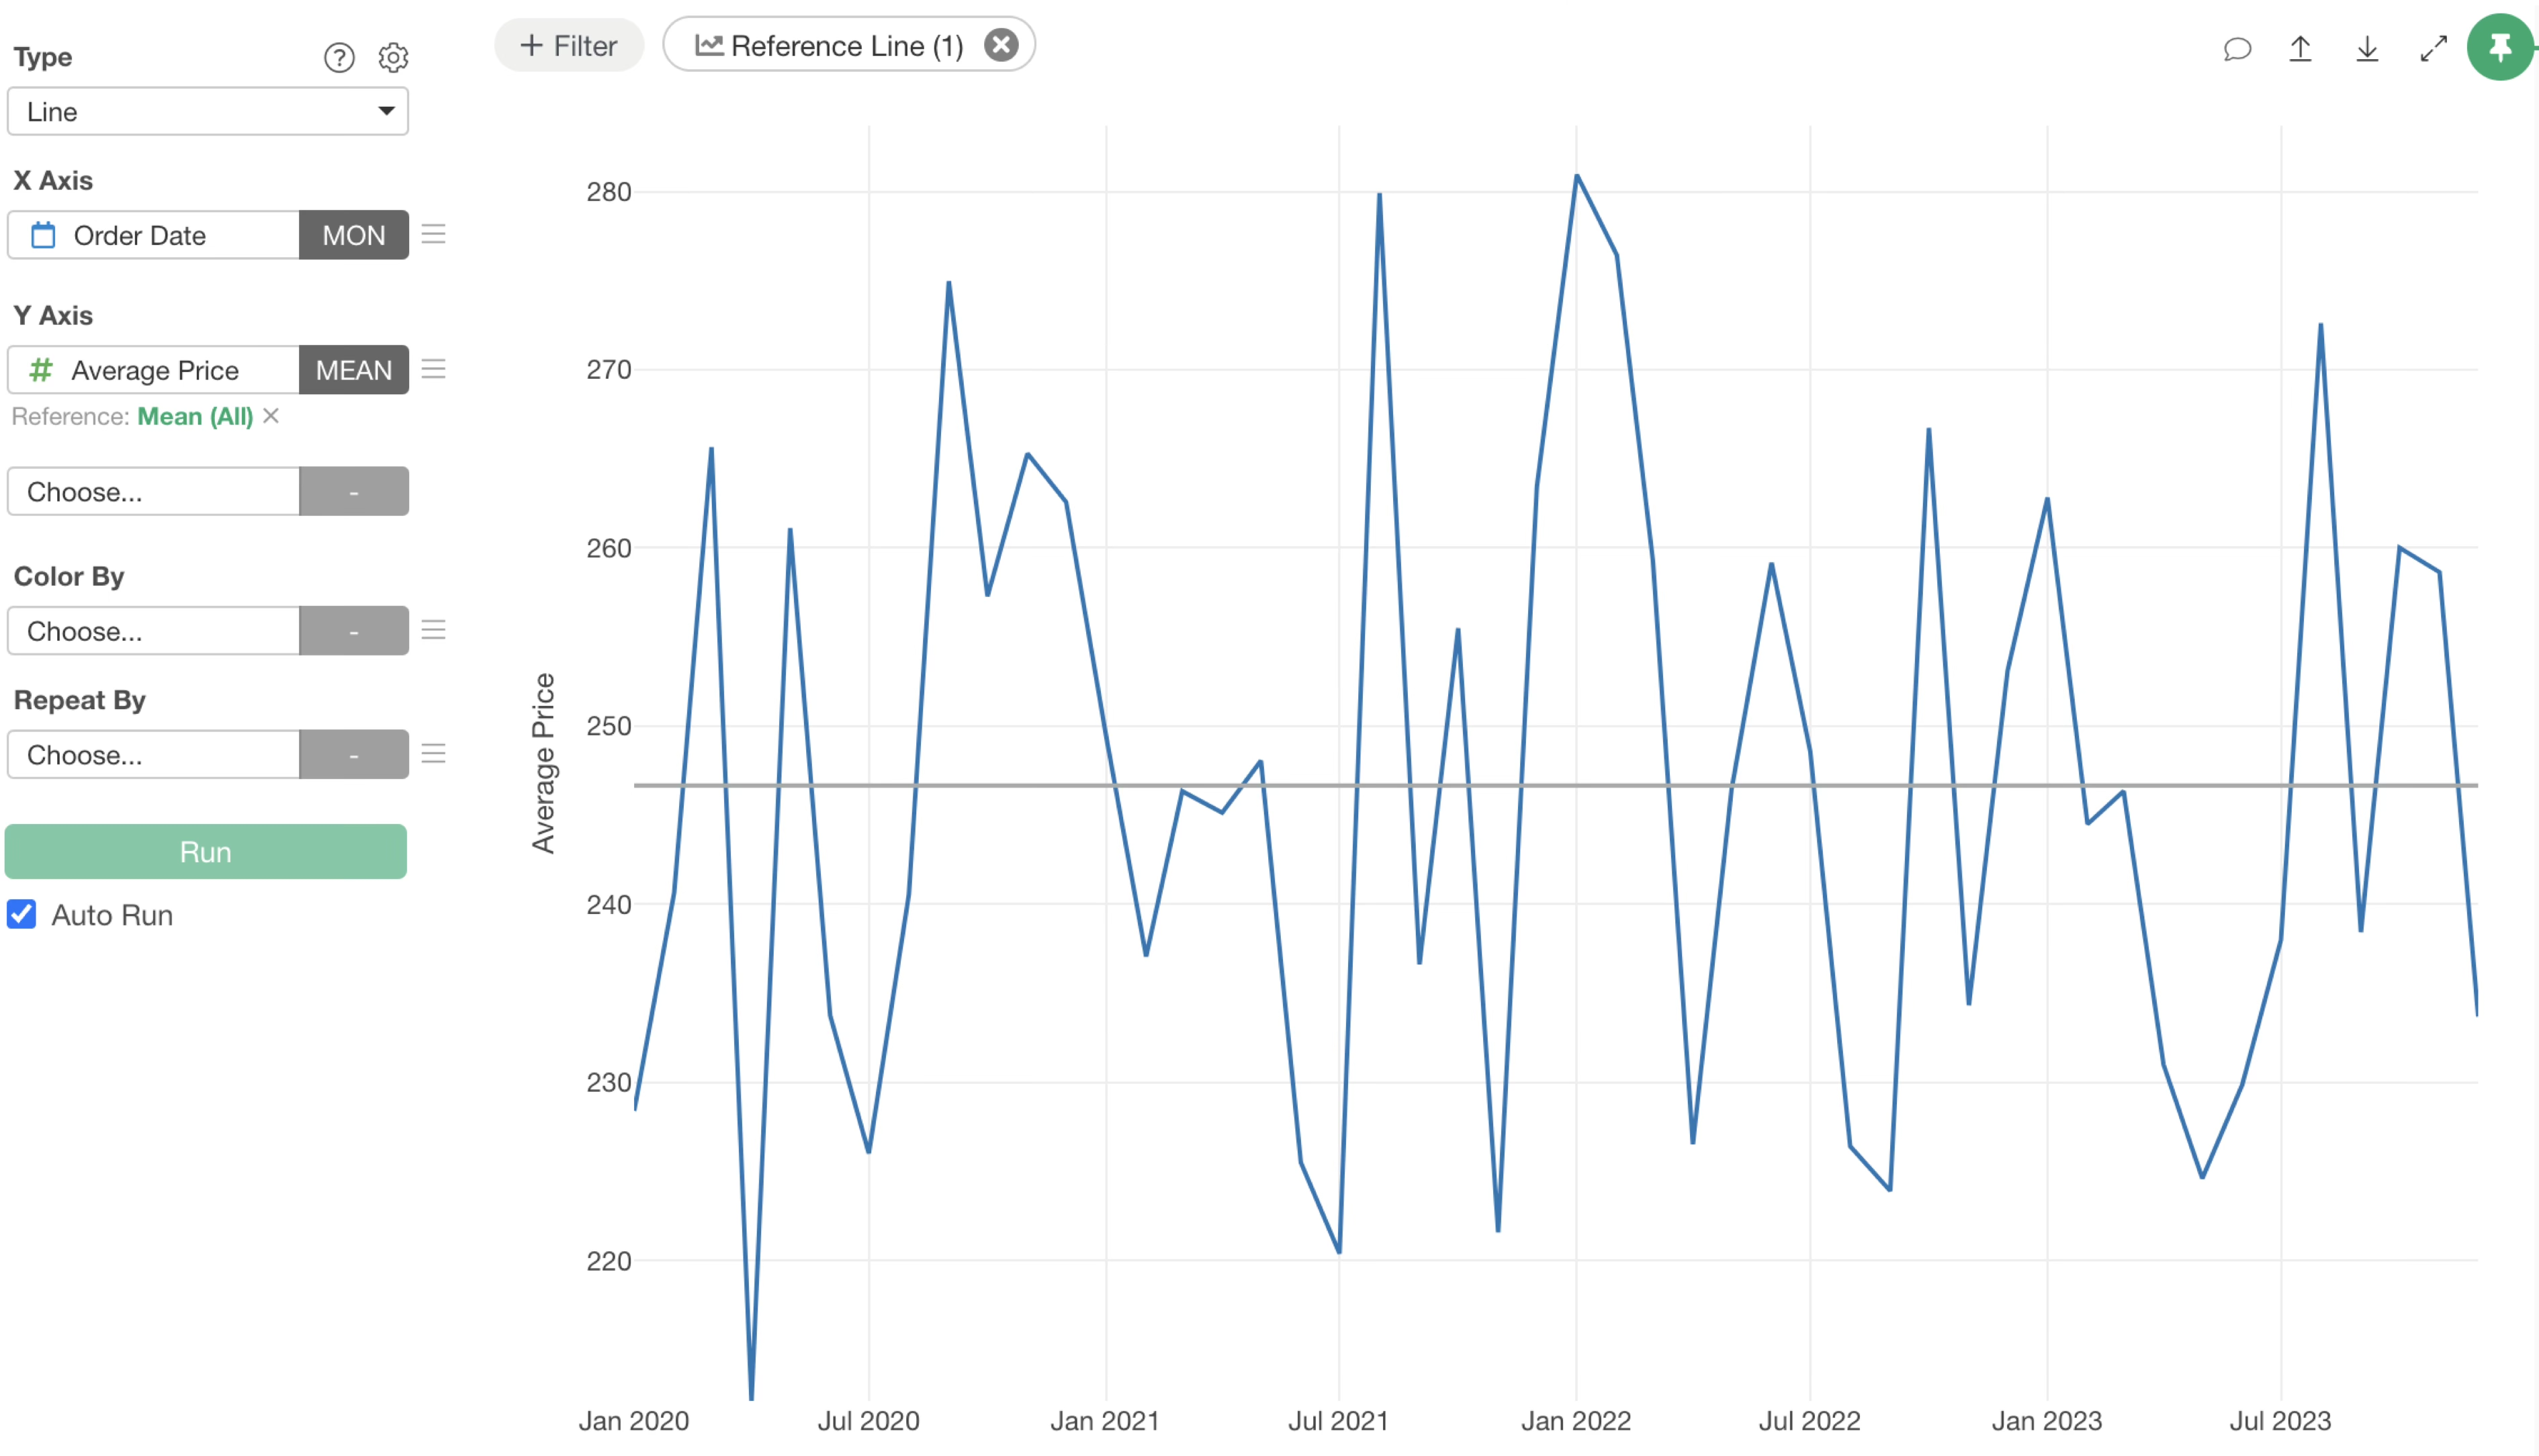
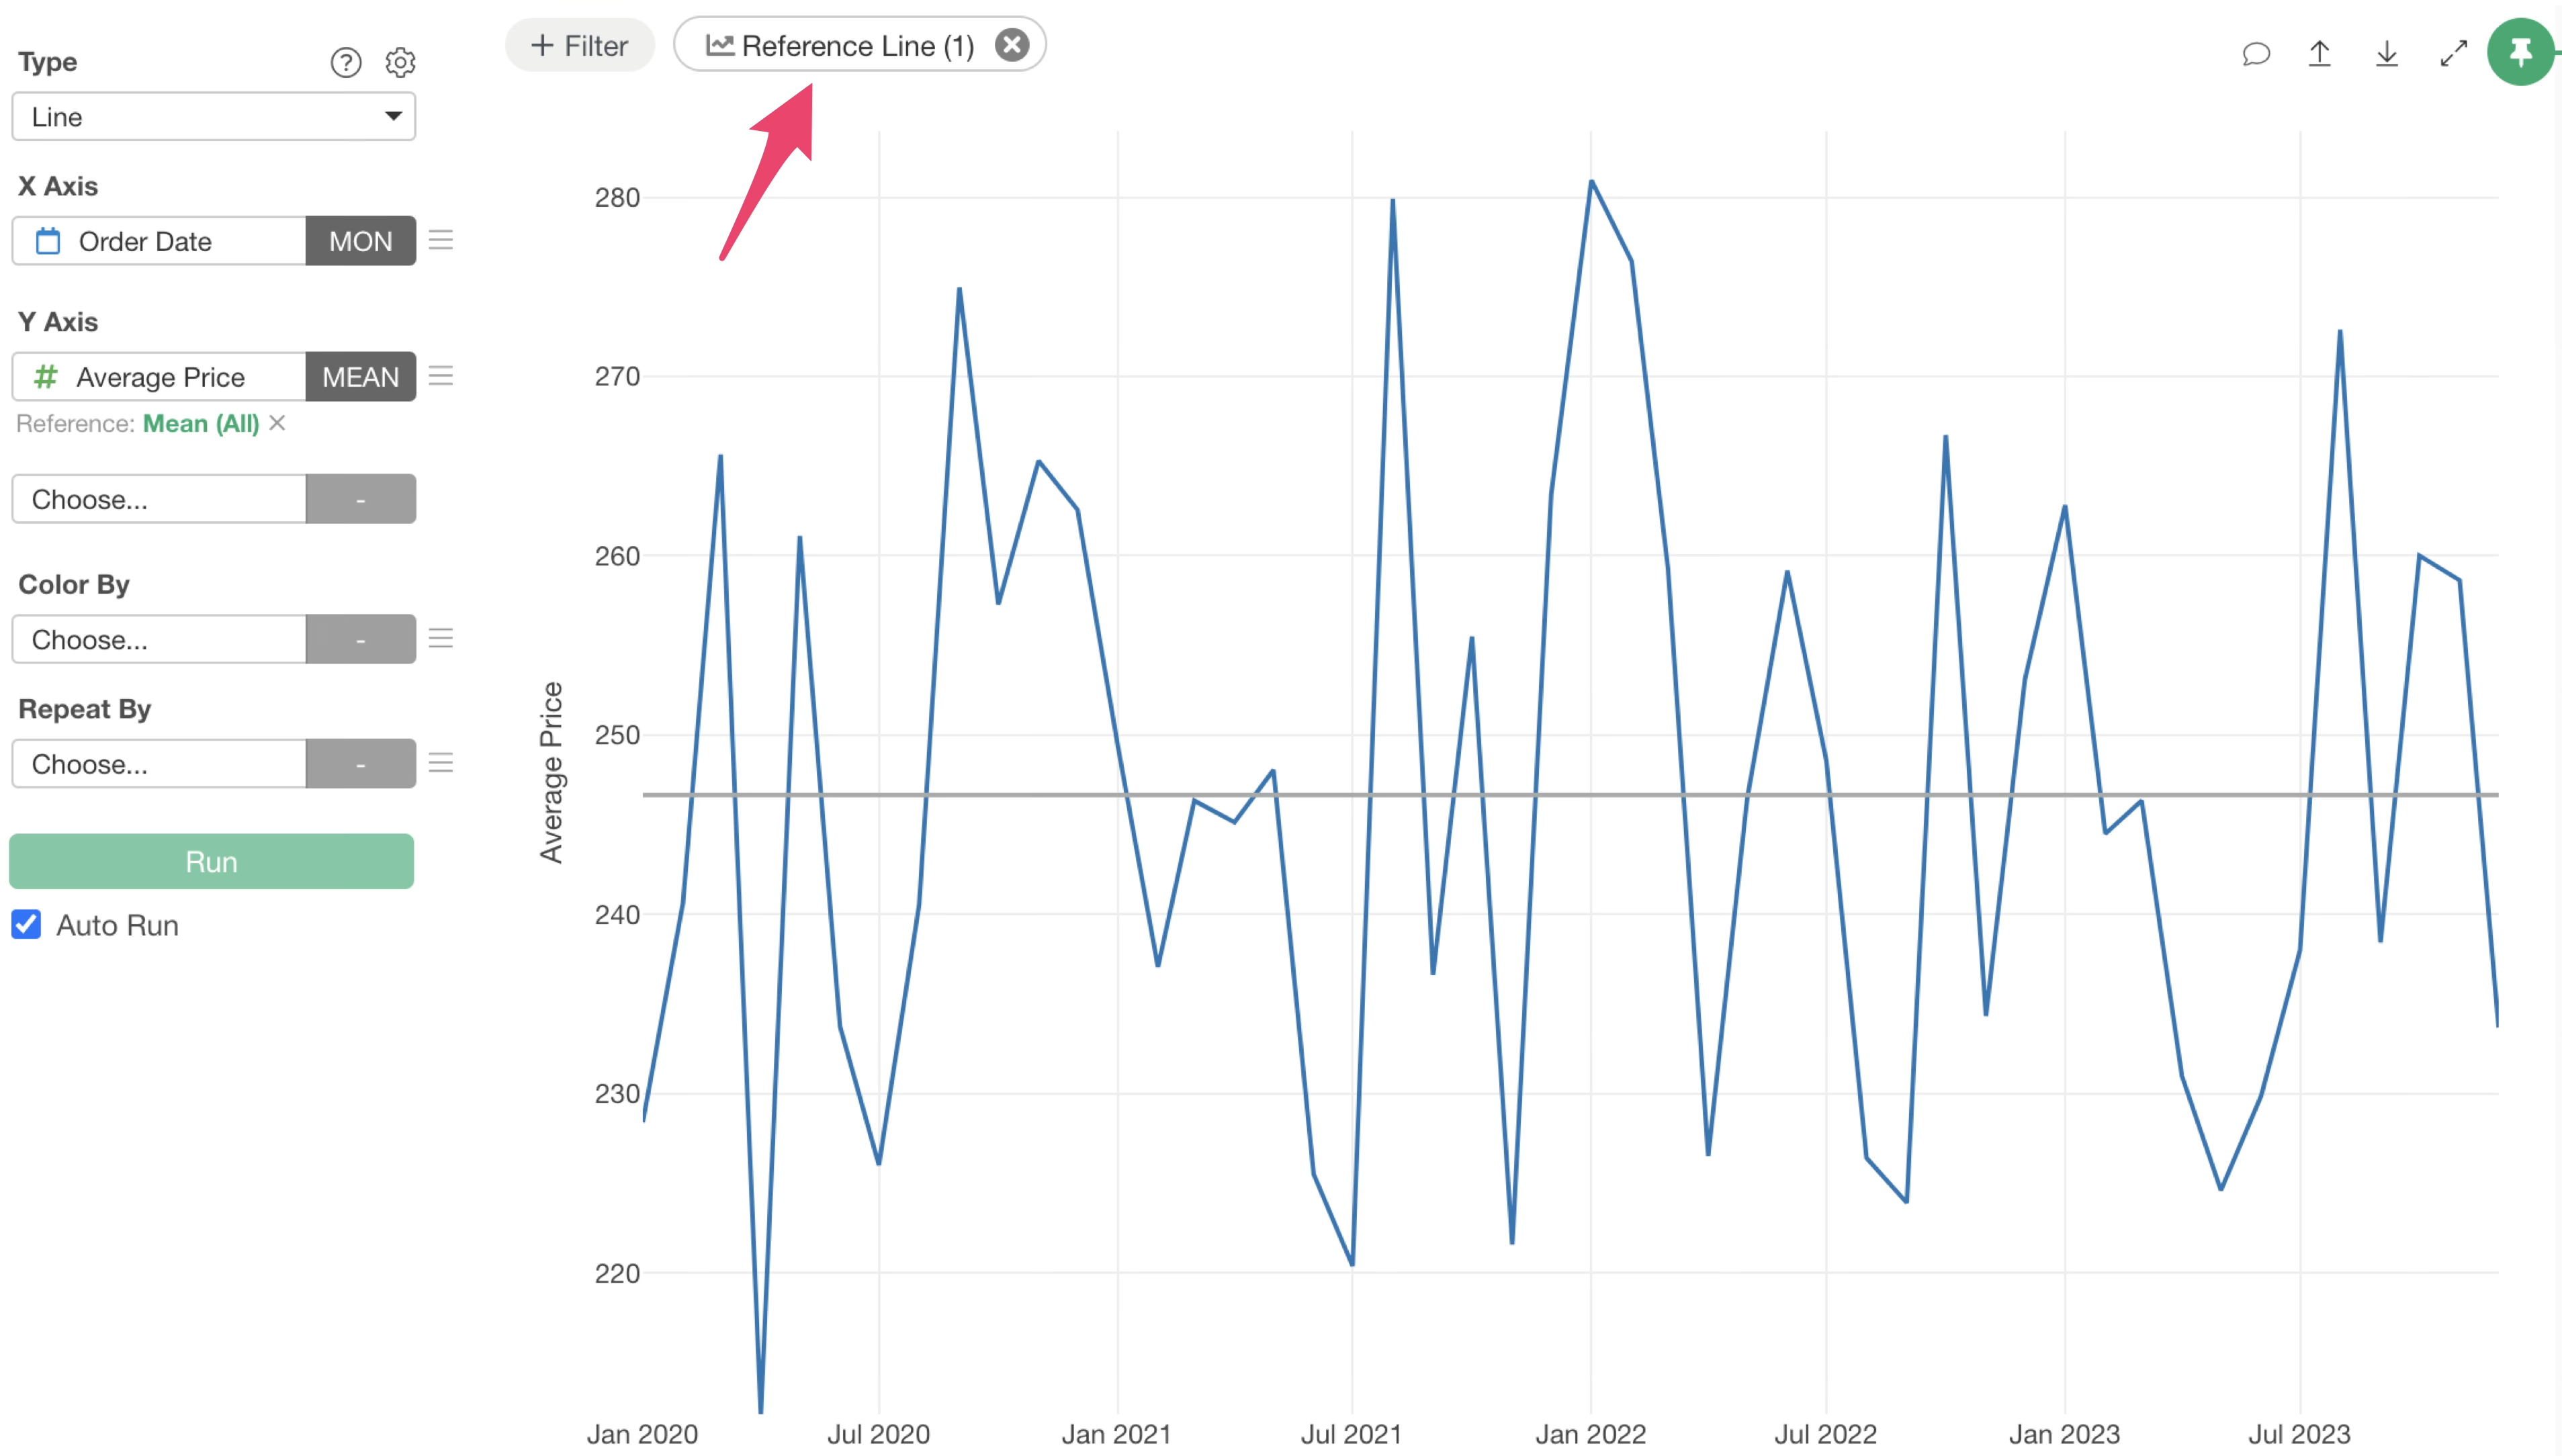
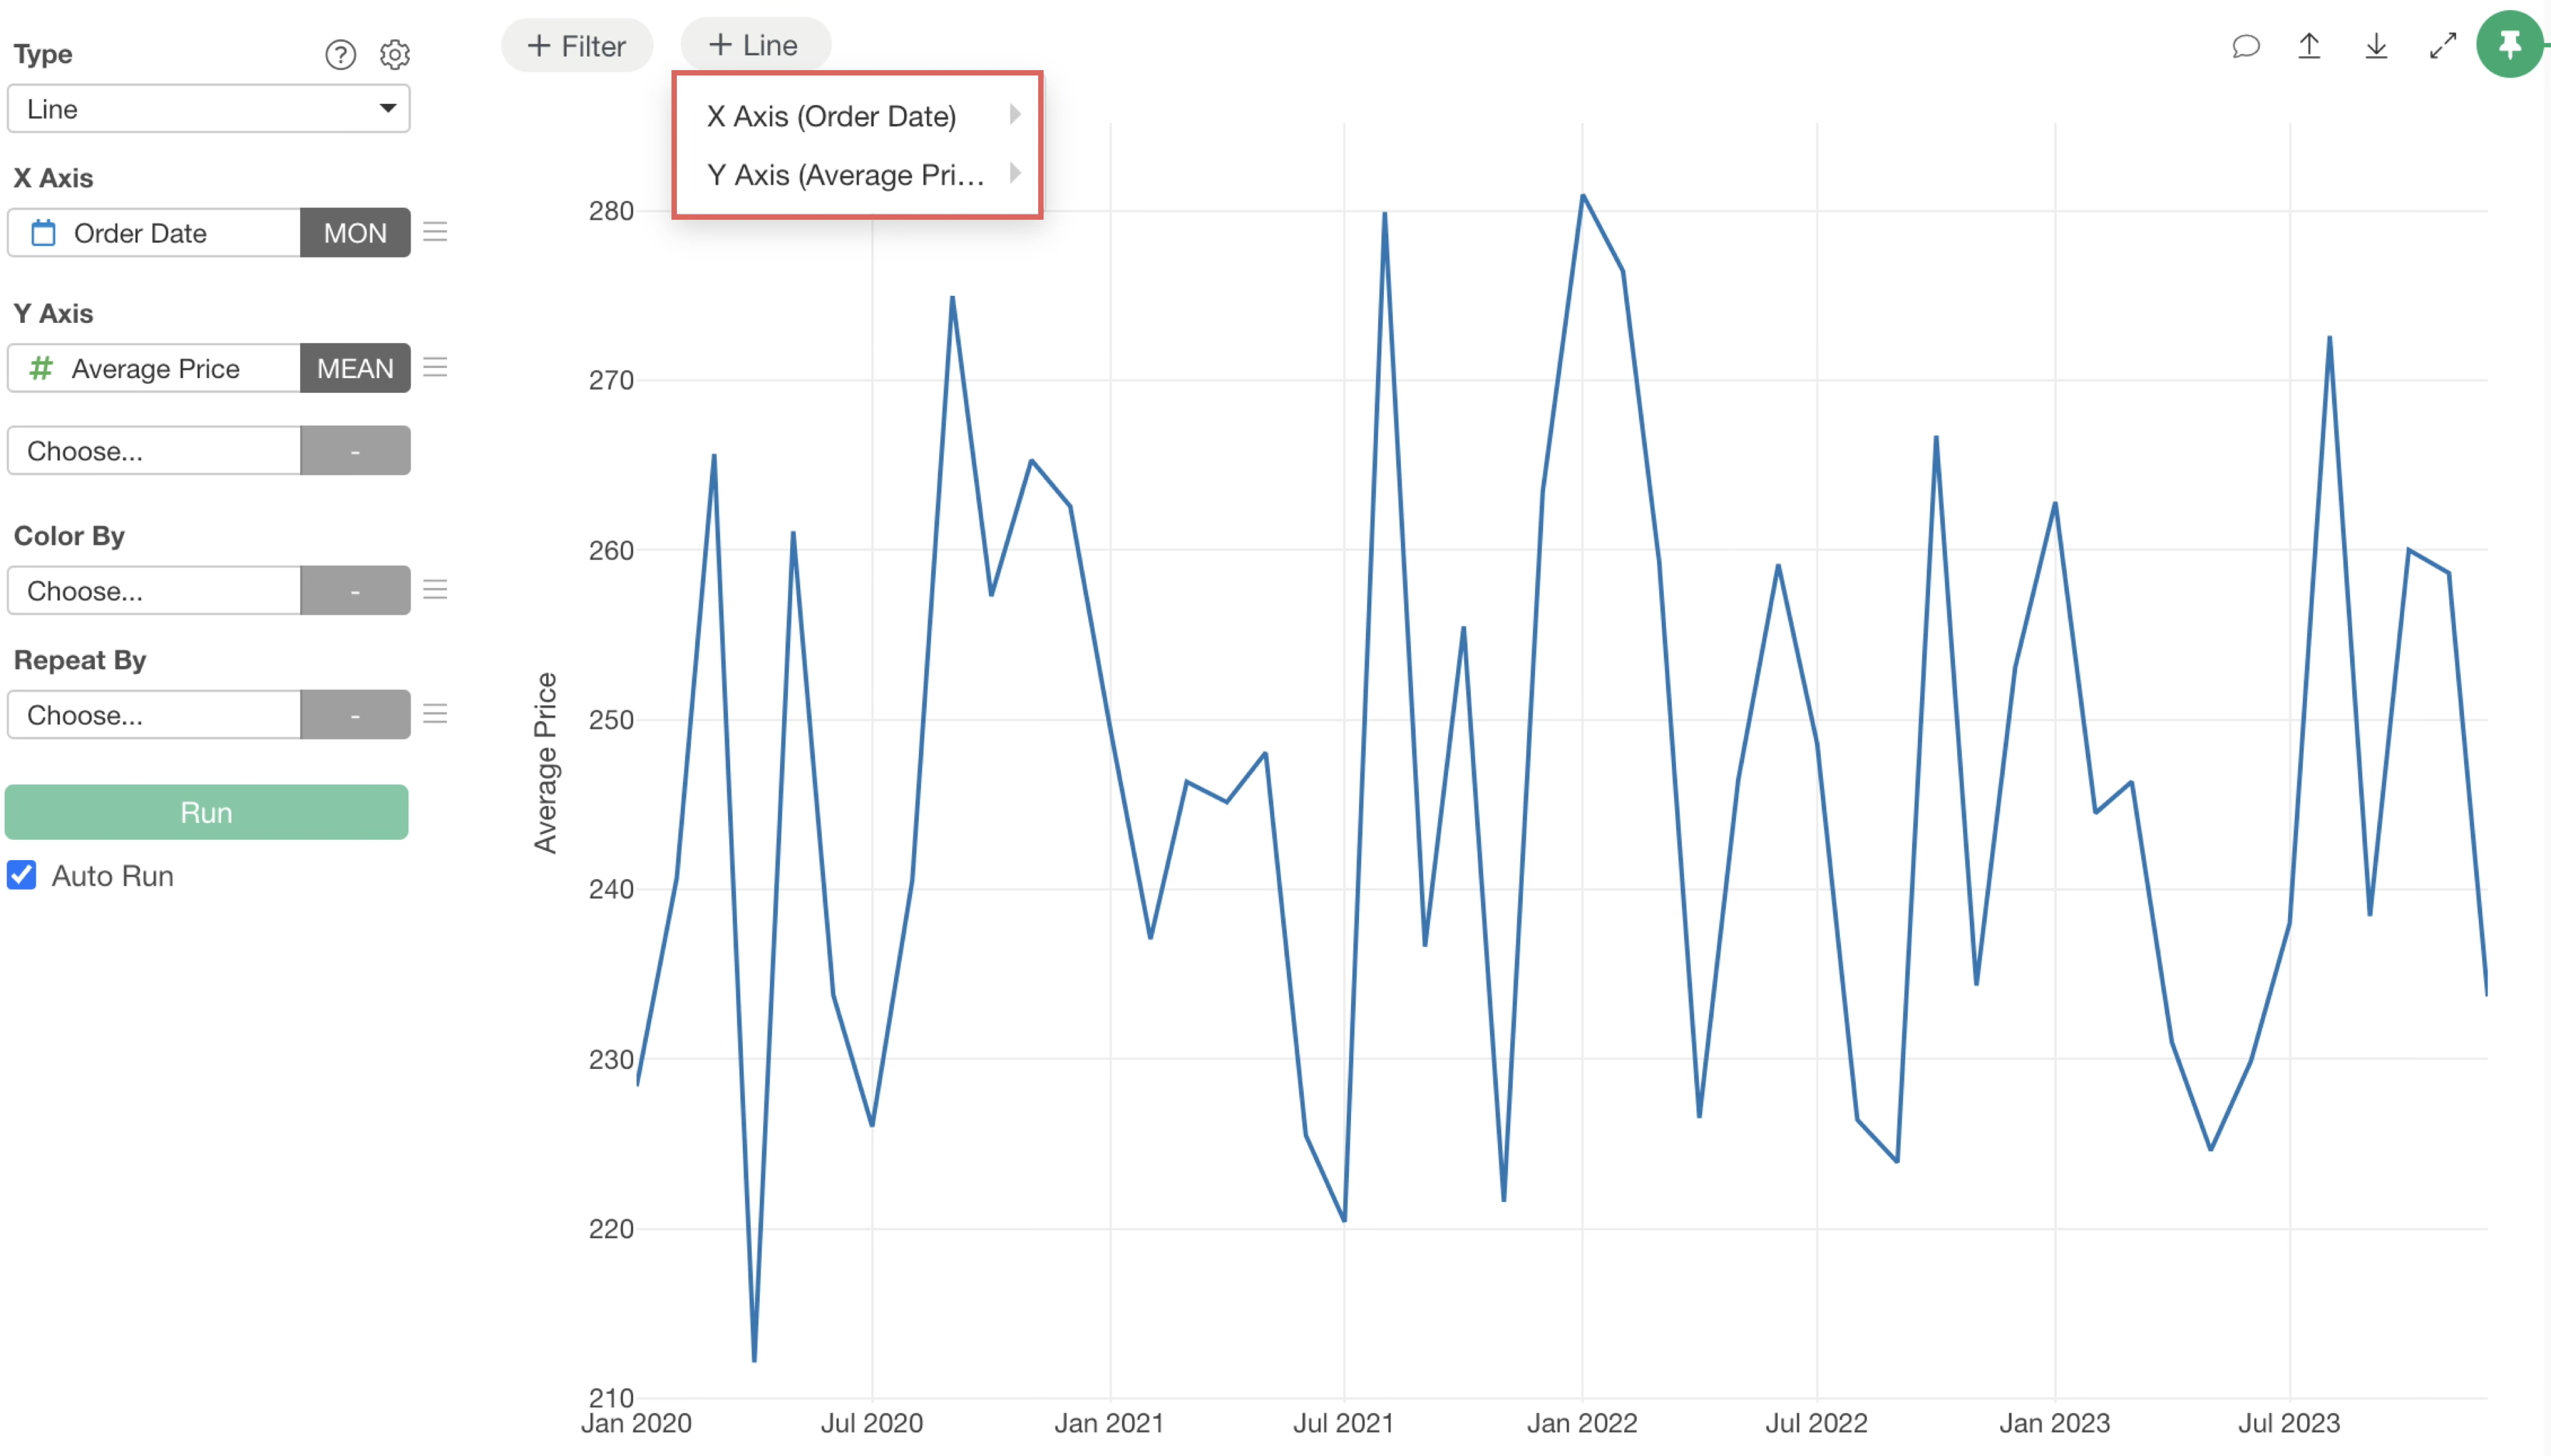
To set up a reference line, click the “Line” button at the top of the chart.
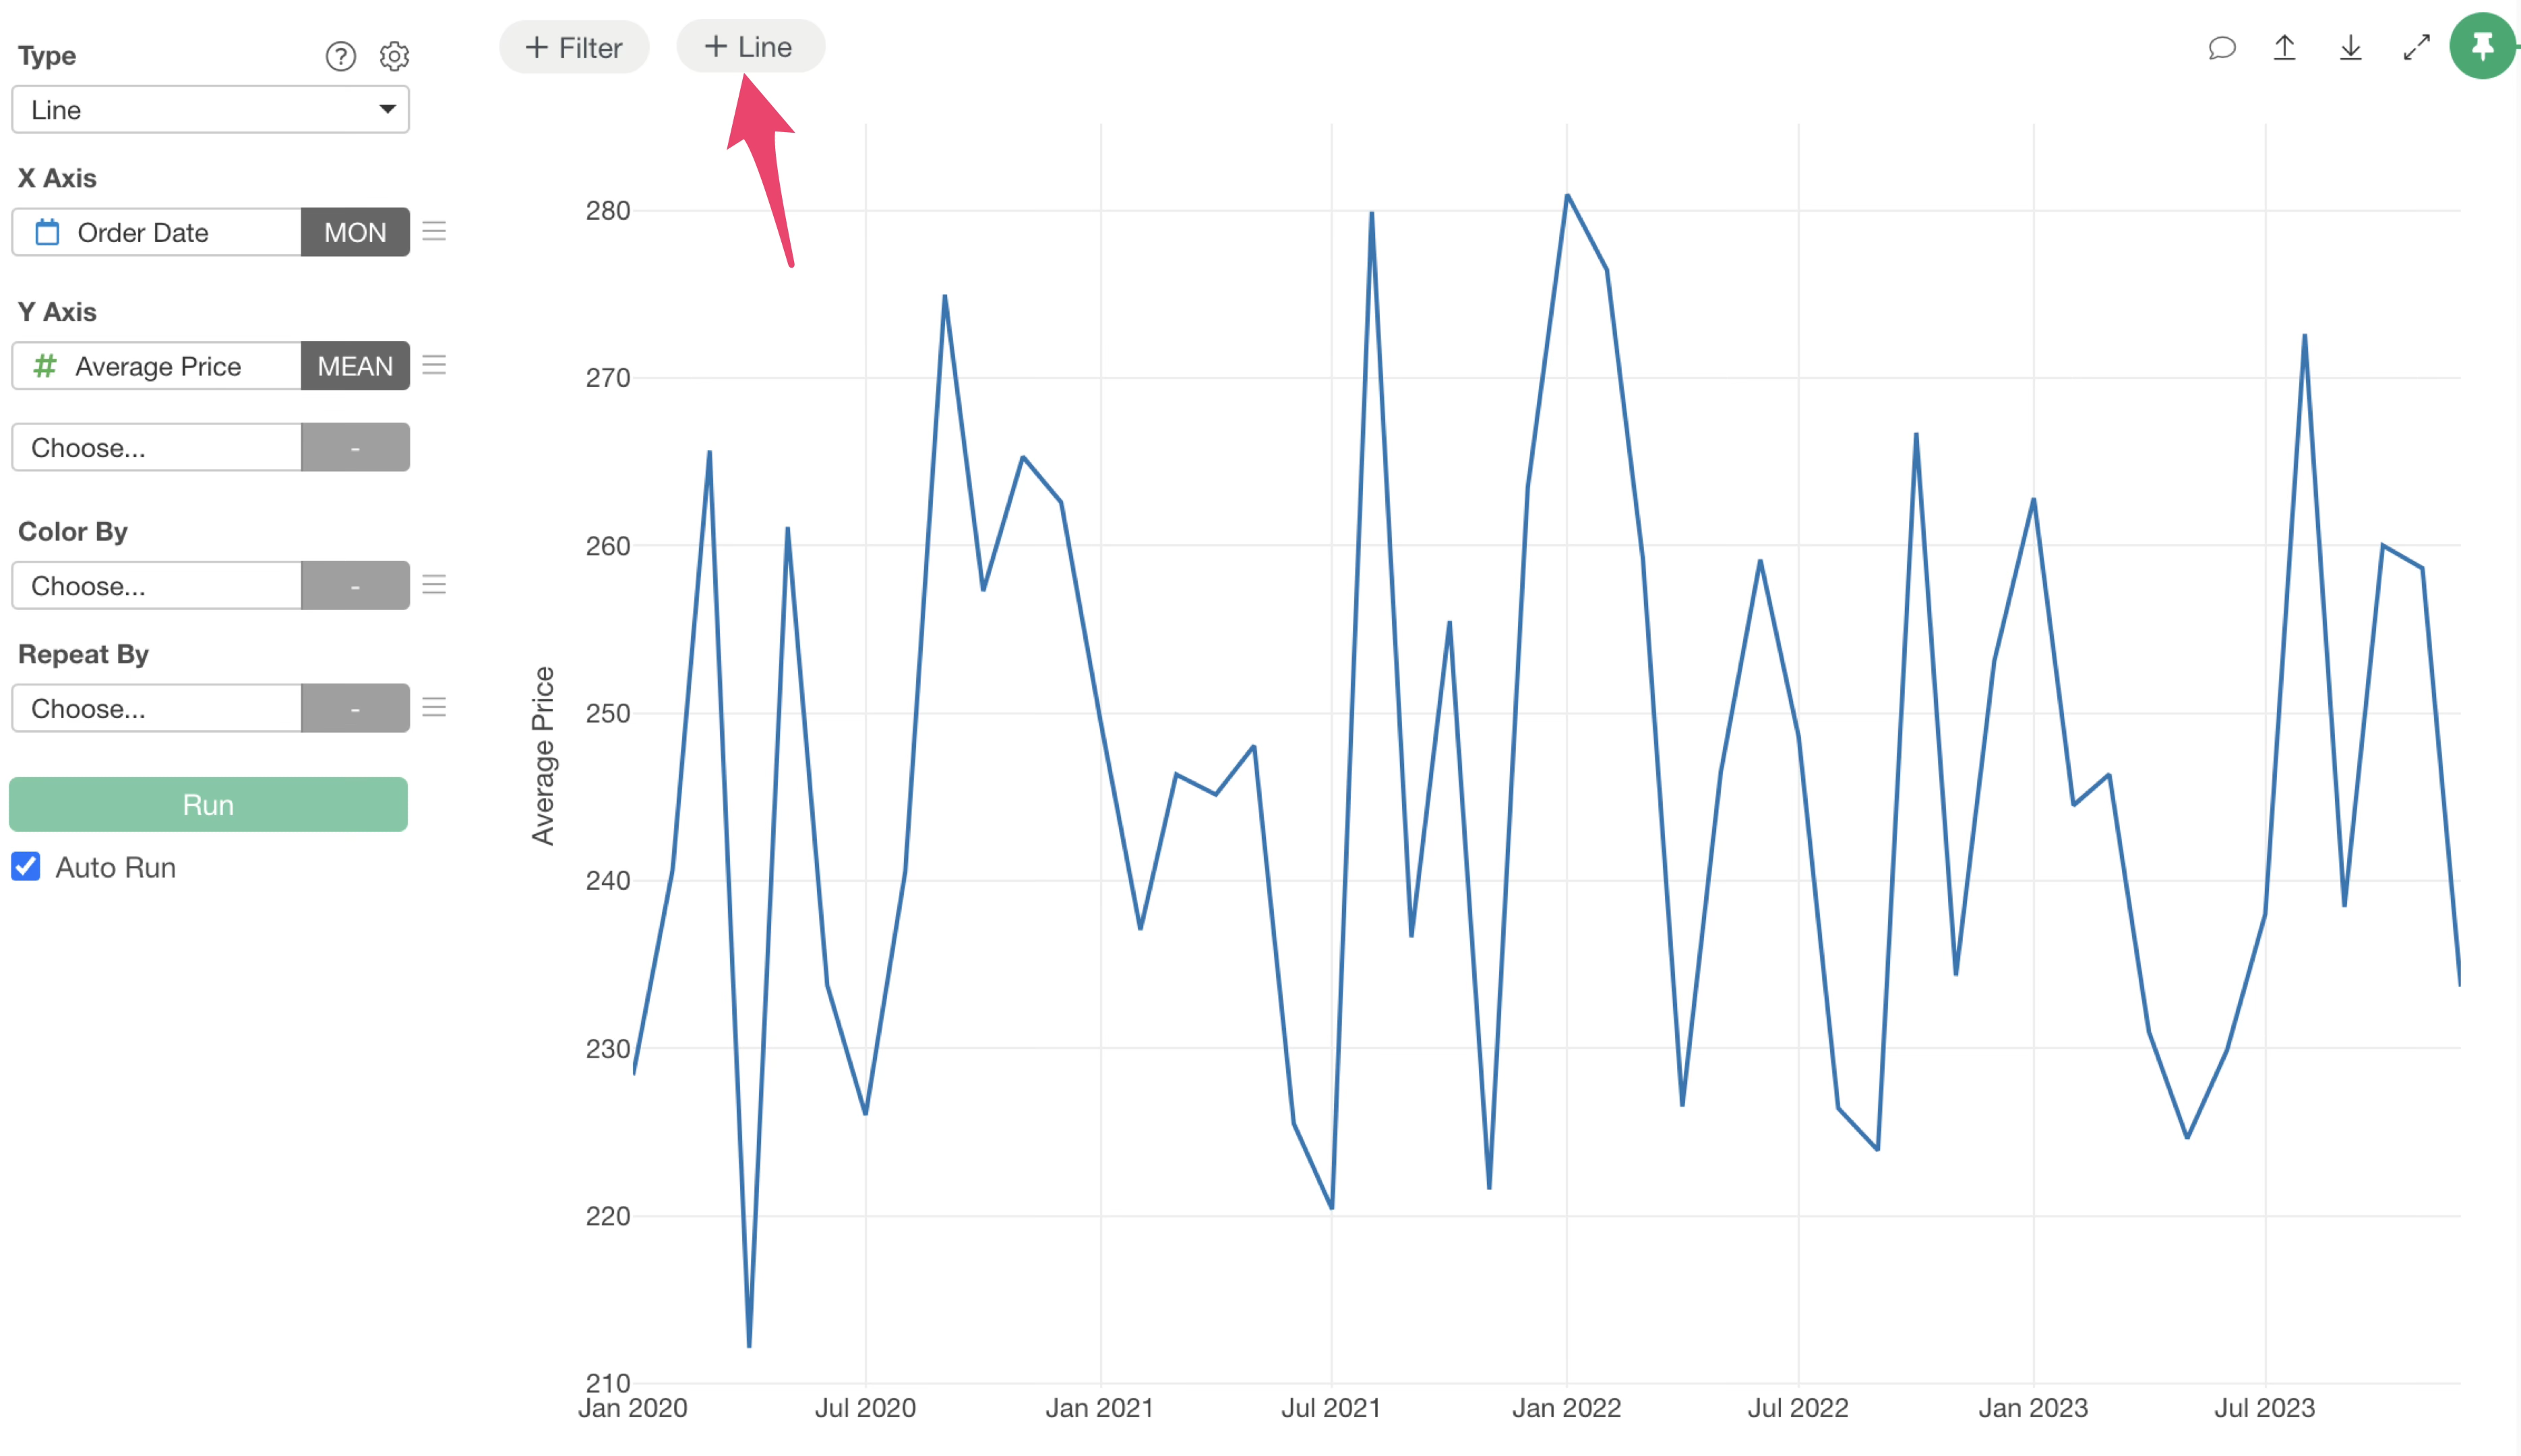
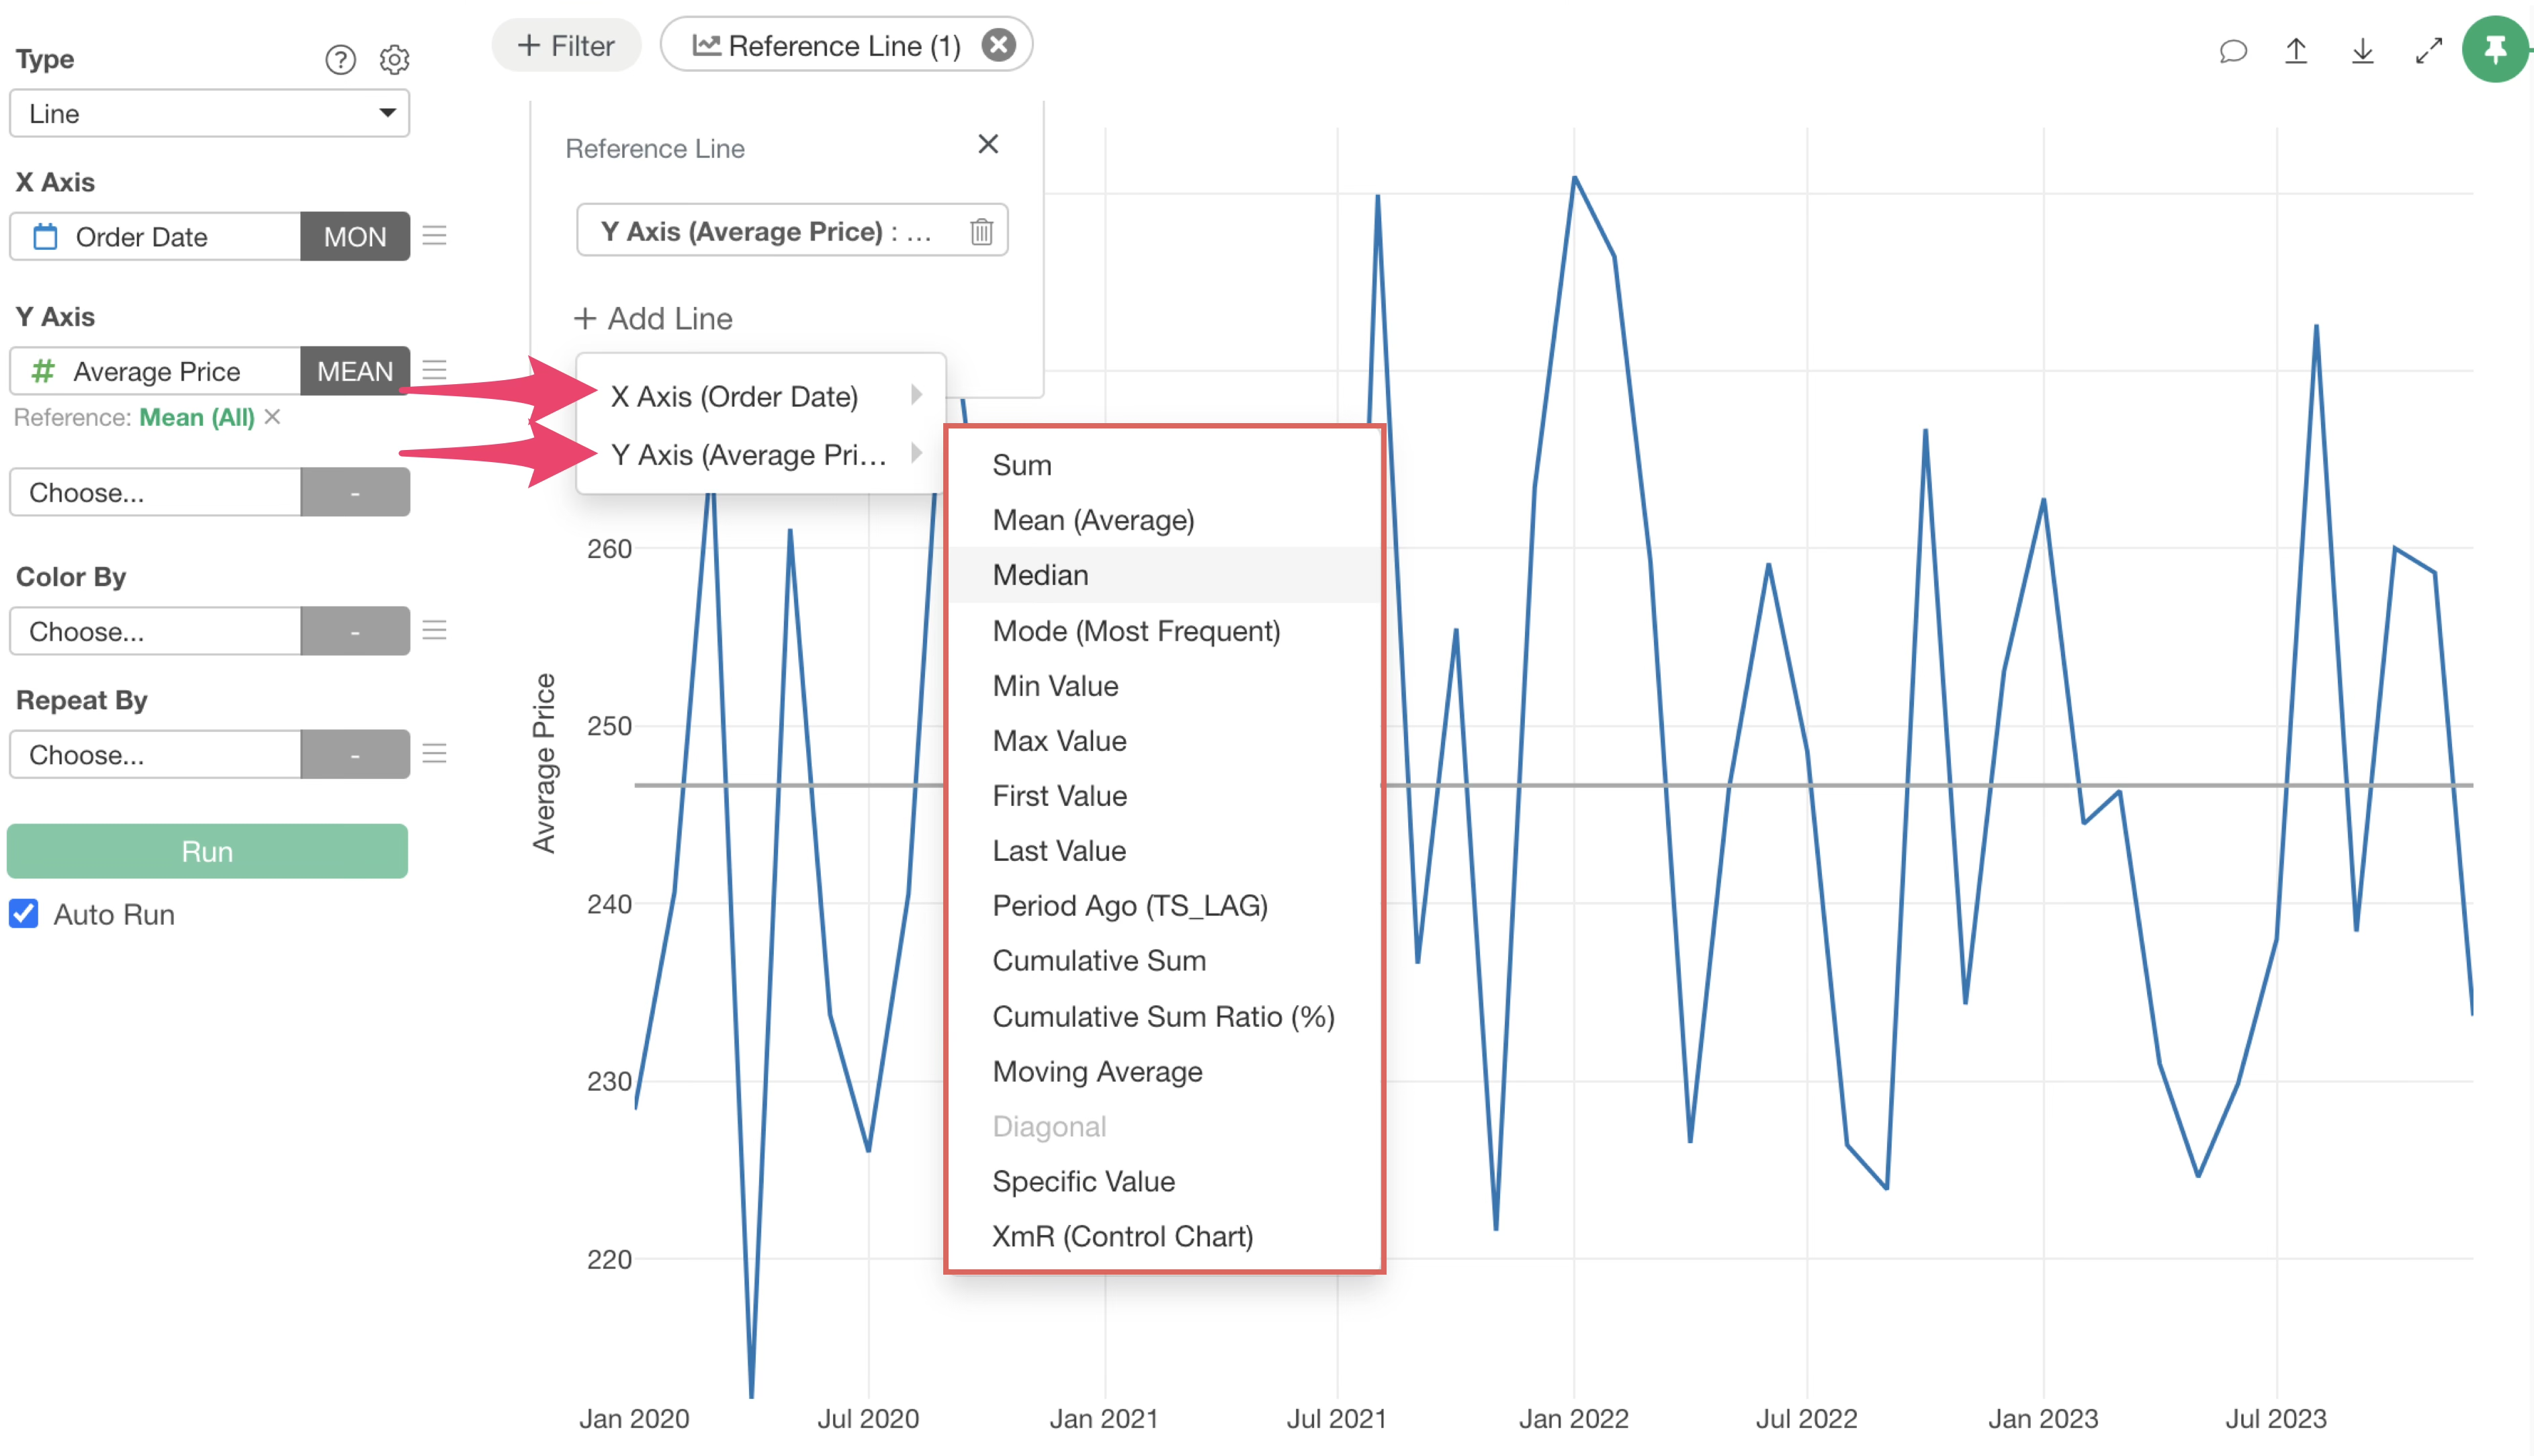
After clicking the “Line” button, a menu appears, asking whether you want to draw the reference line on the X-axis or the Y-axis.

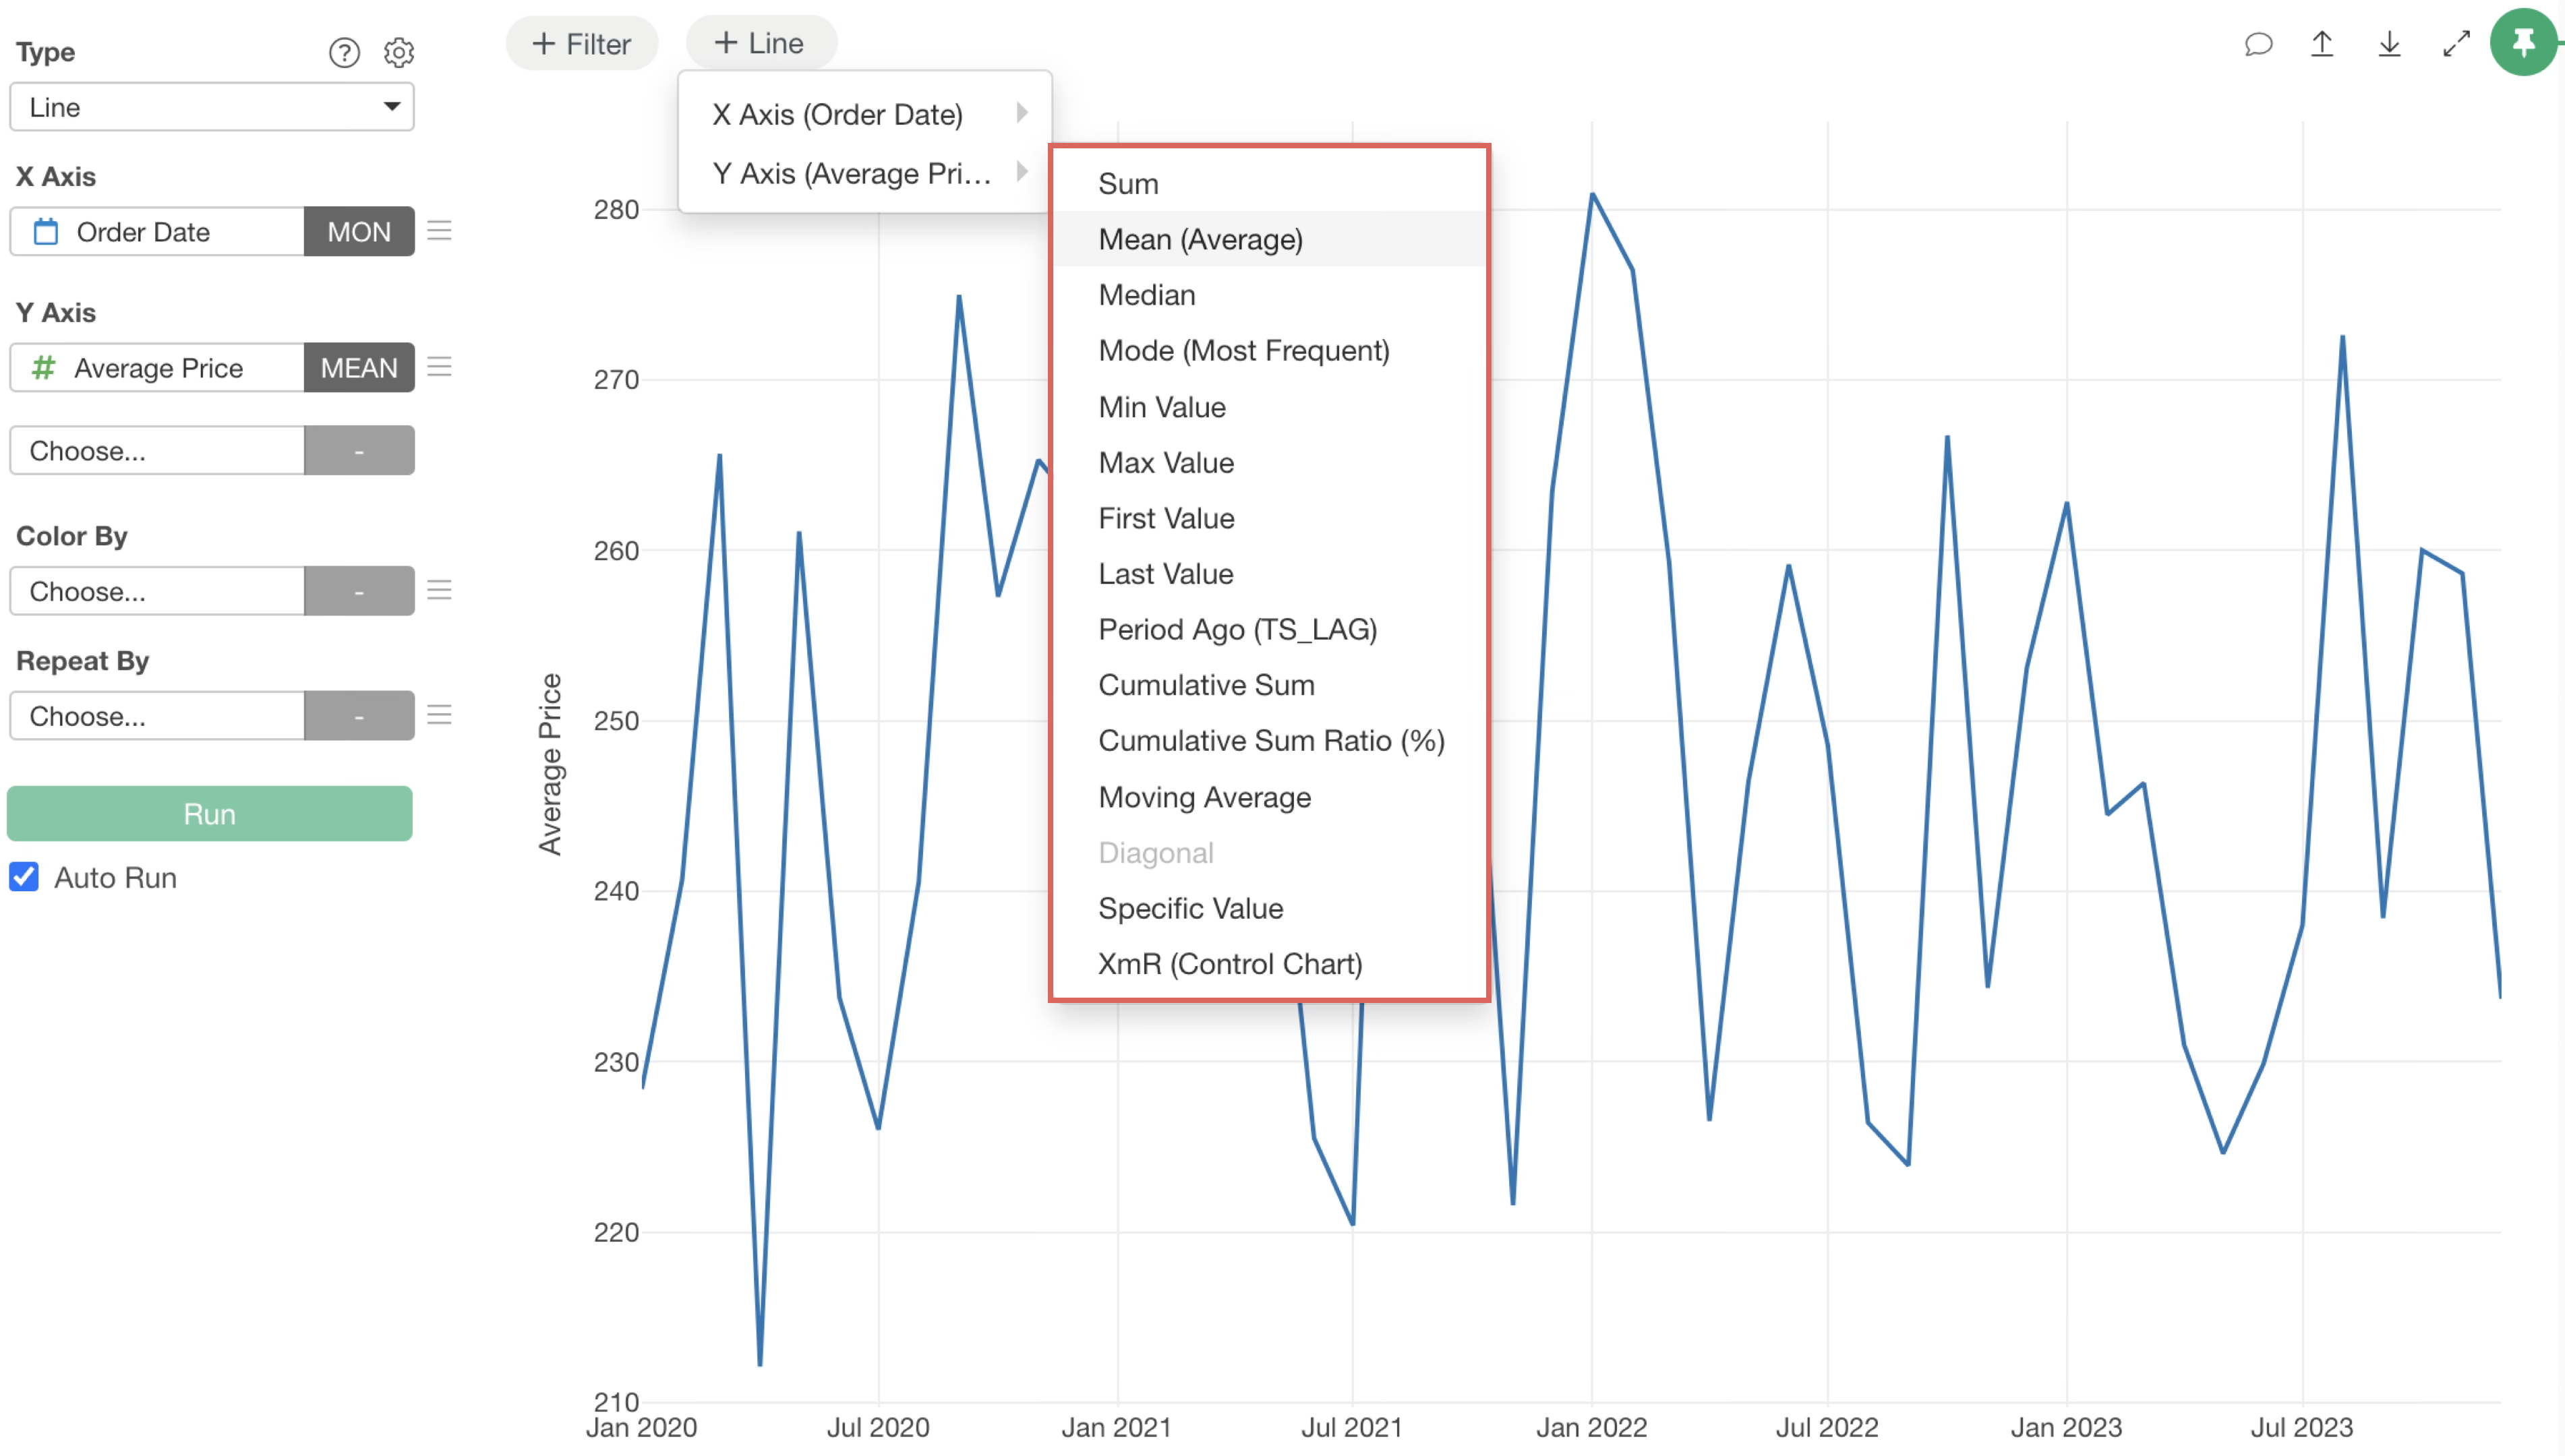
Hovering your mouse over either axis displays the available reference line types.
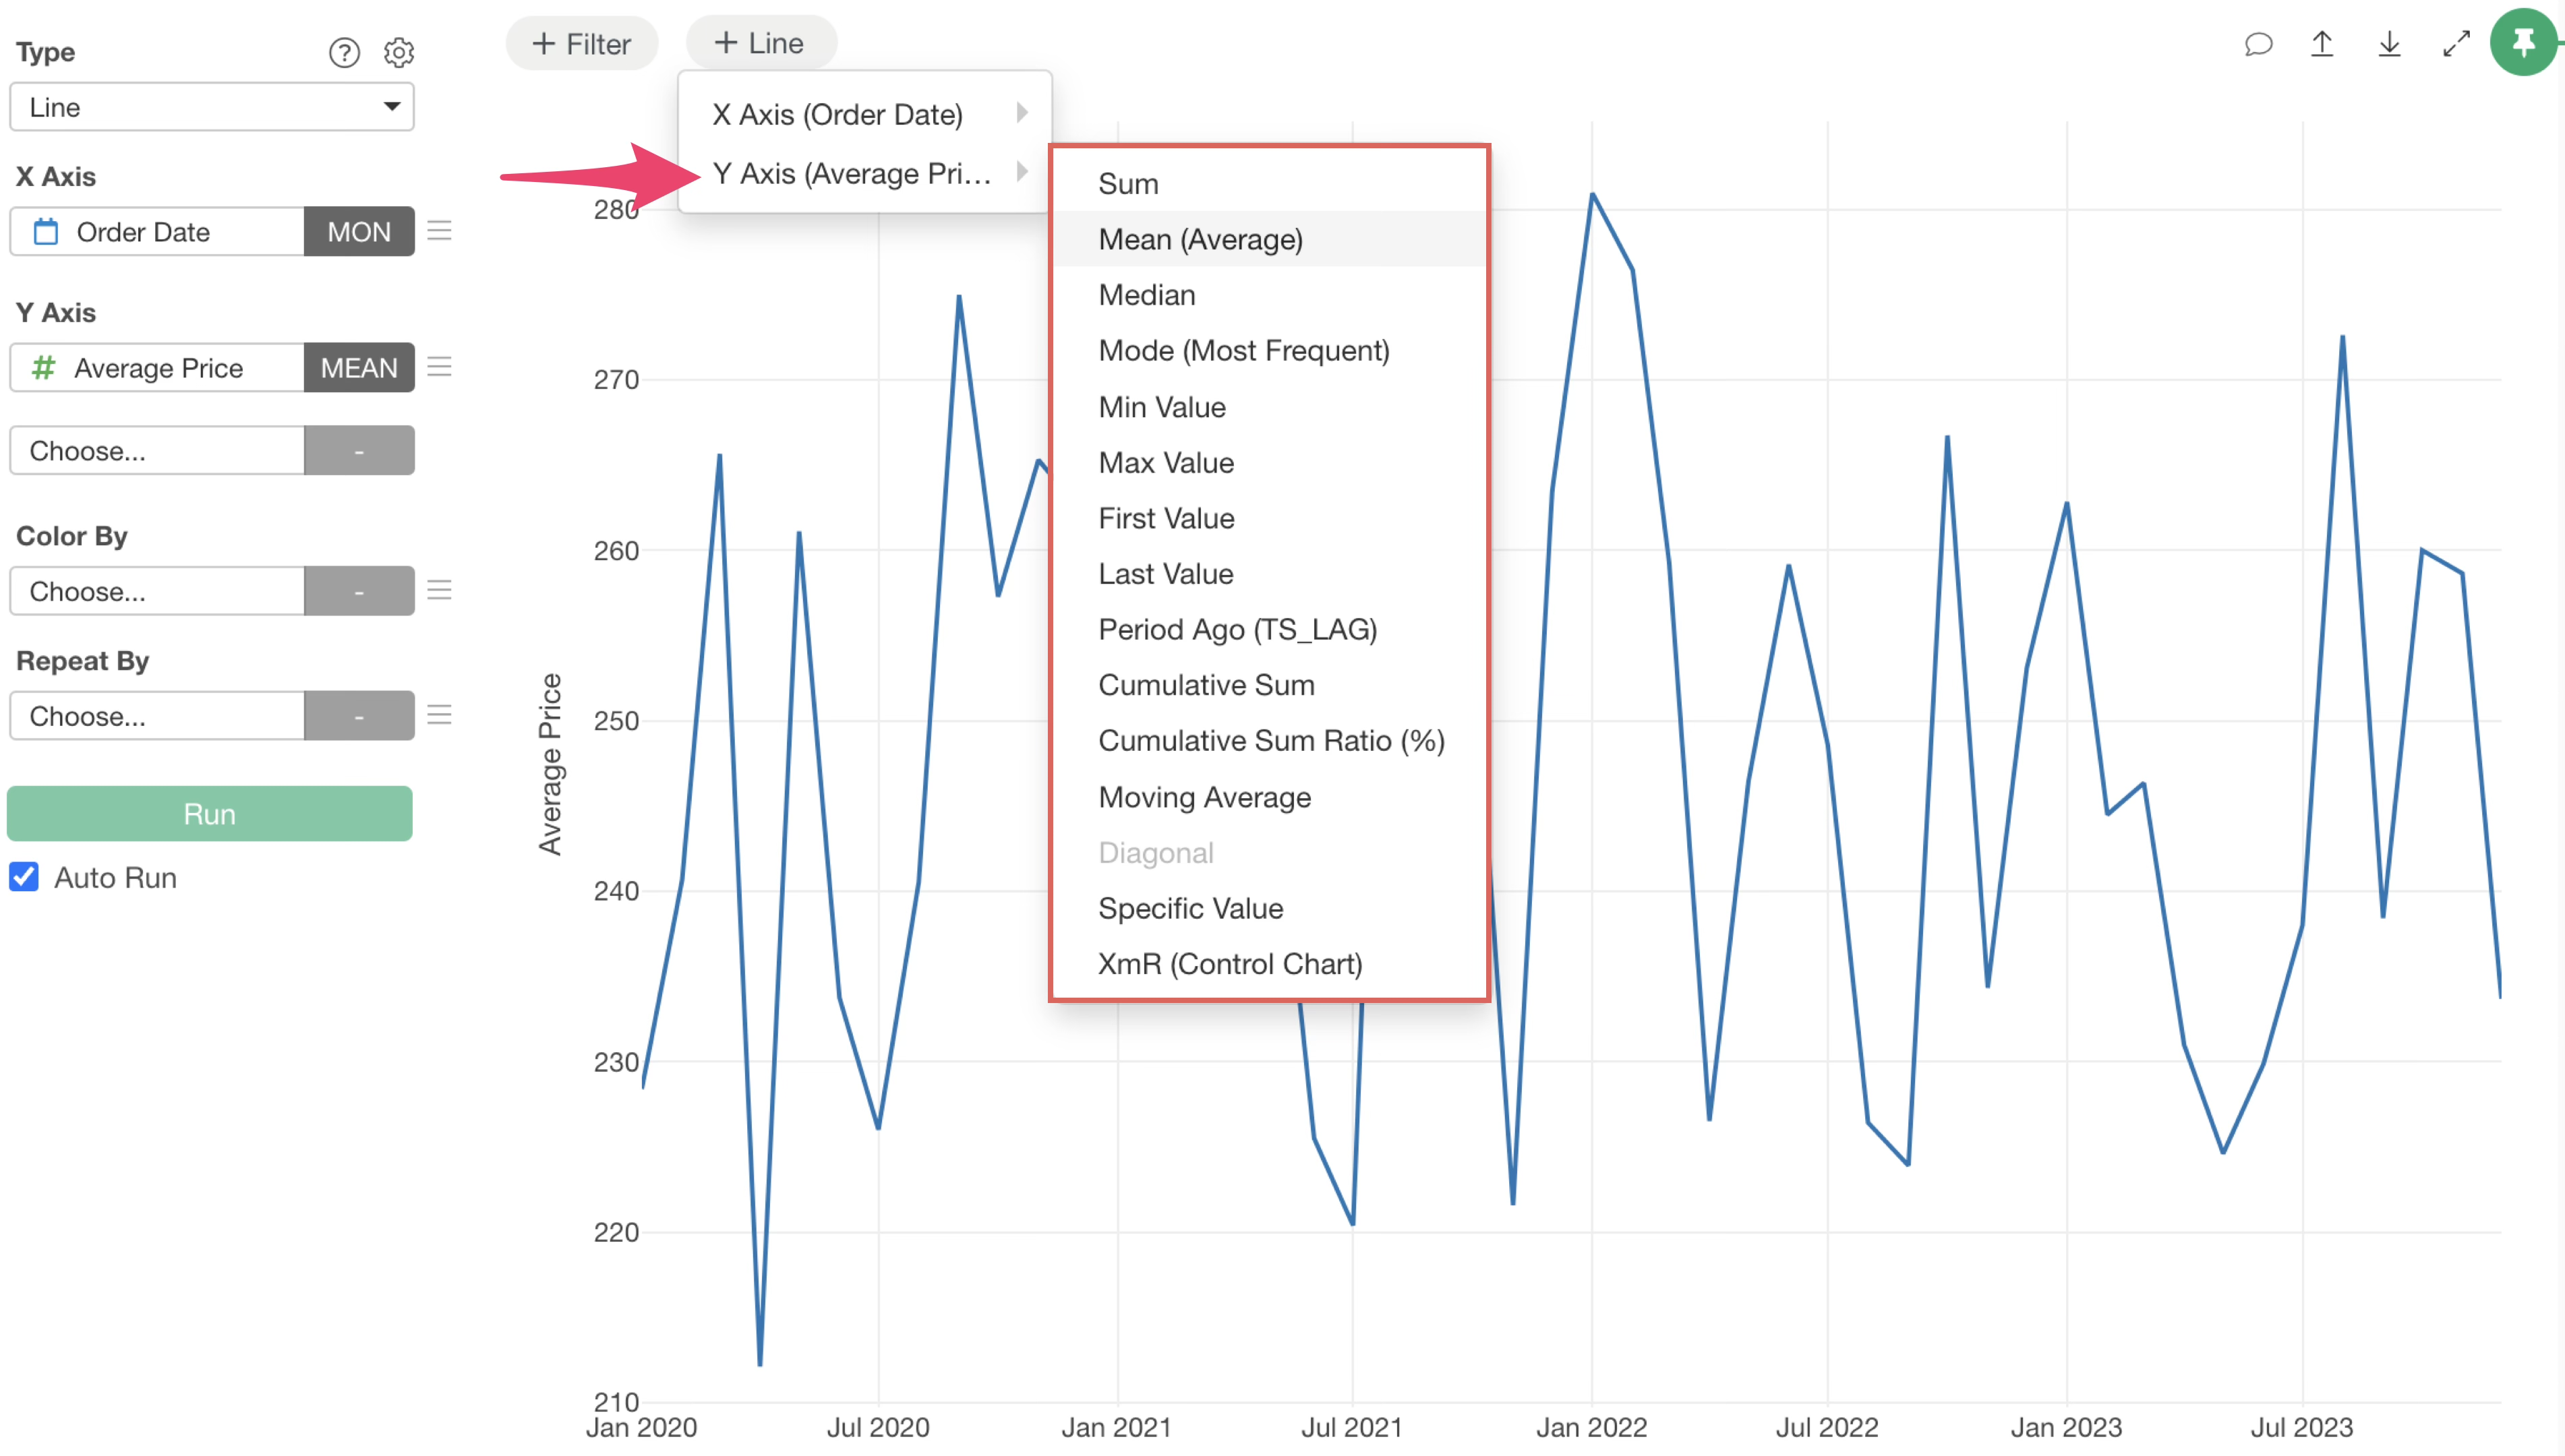
All you have to do is to select the type of reference line you want to draw.
Once a reference line is set, the “Line” button shows the number of currently configured reference lines, allowing you to check their status.
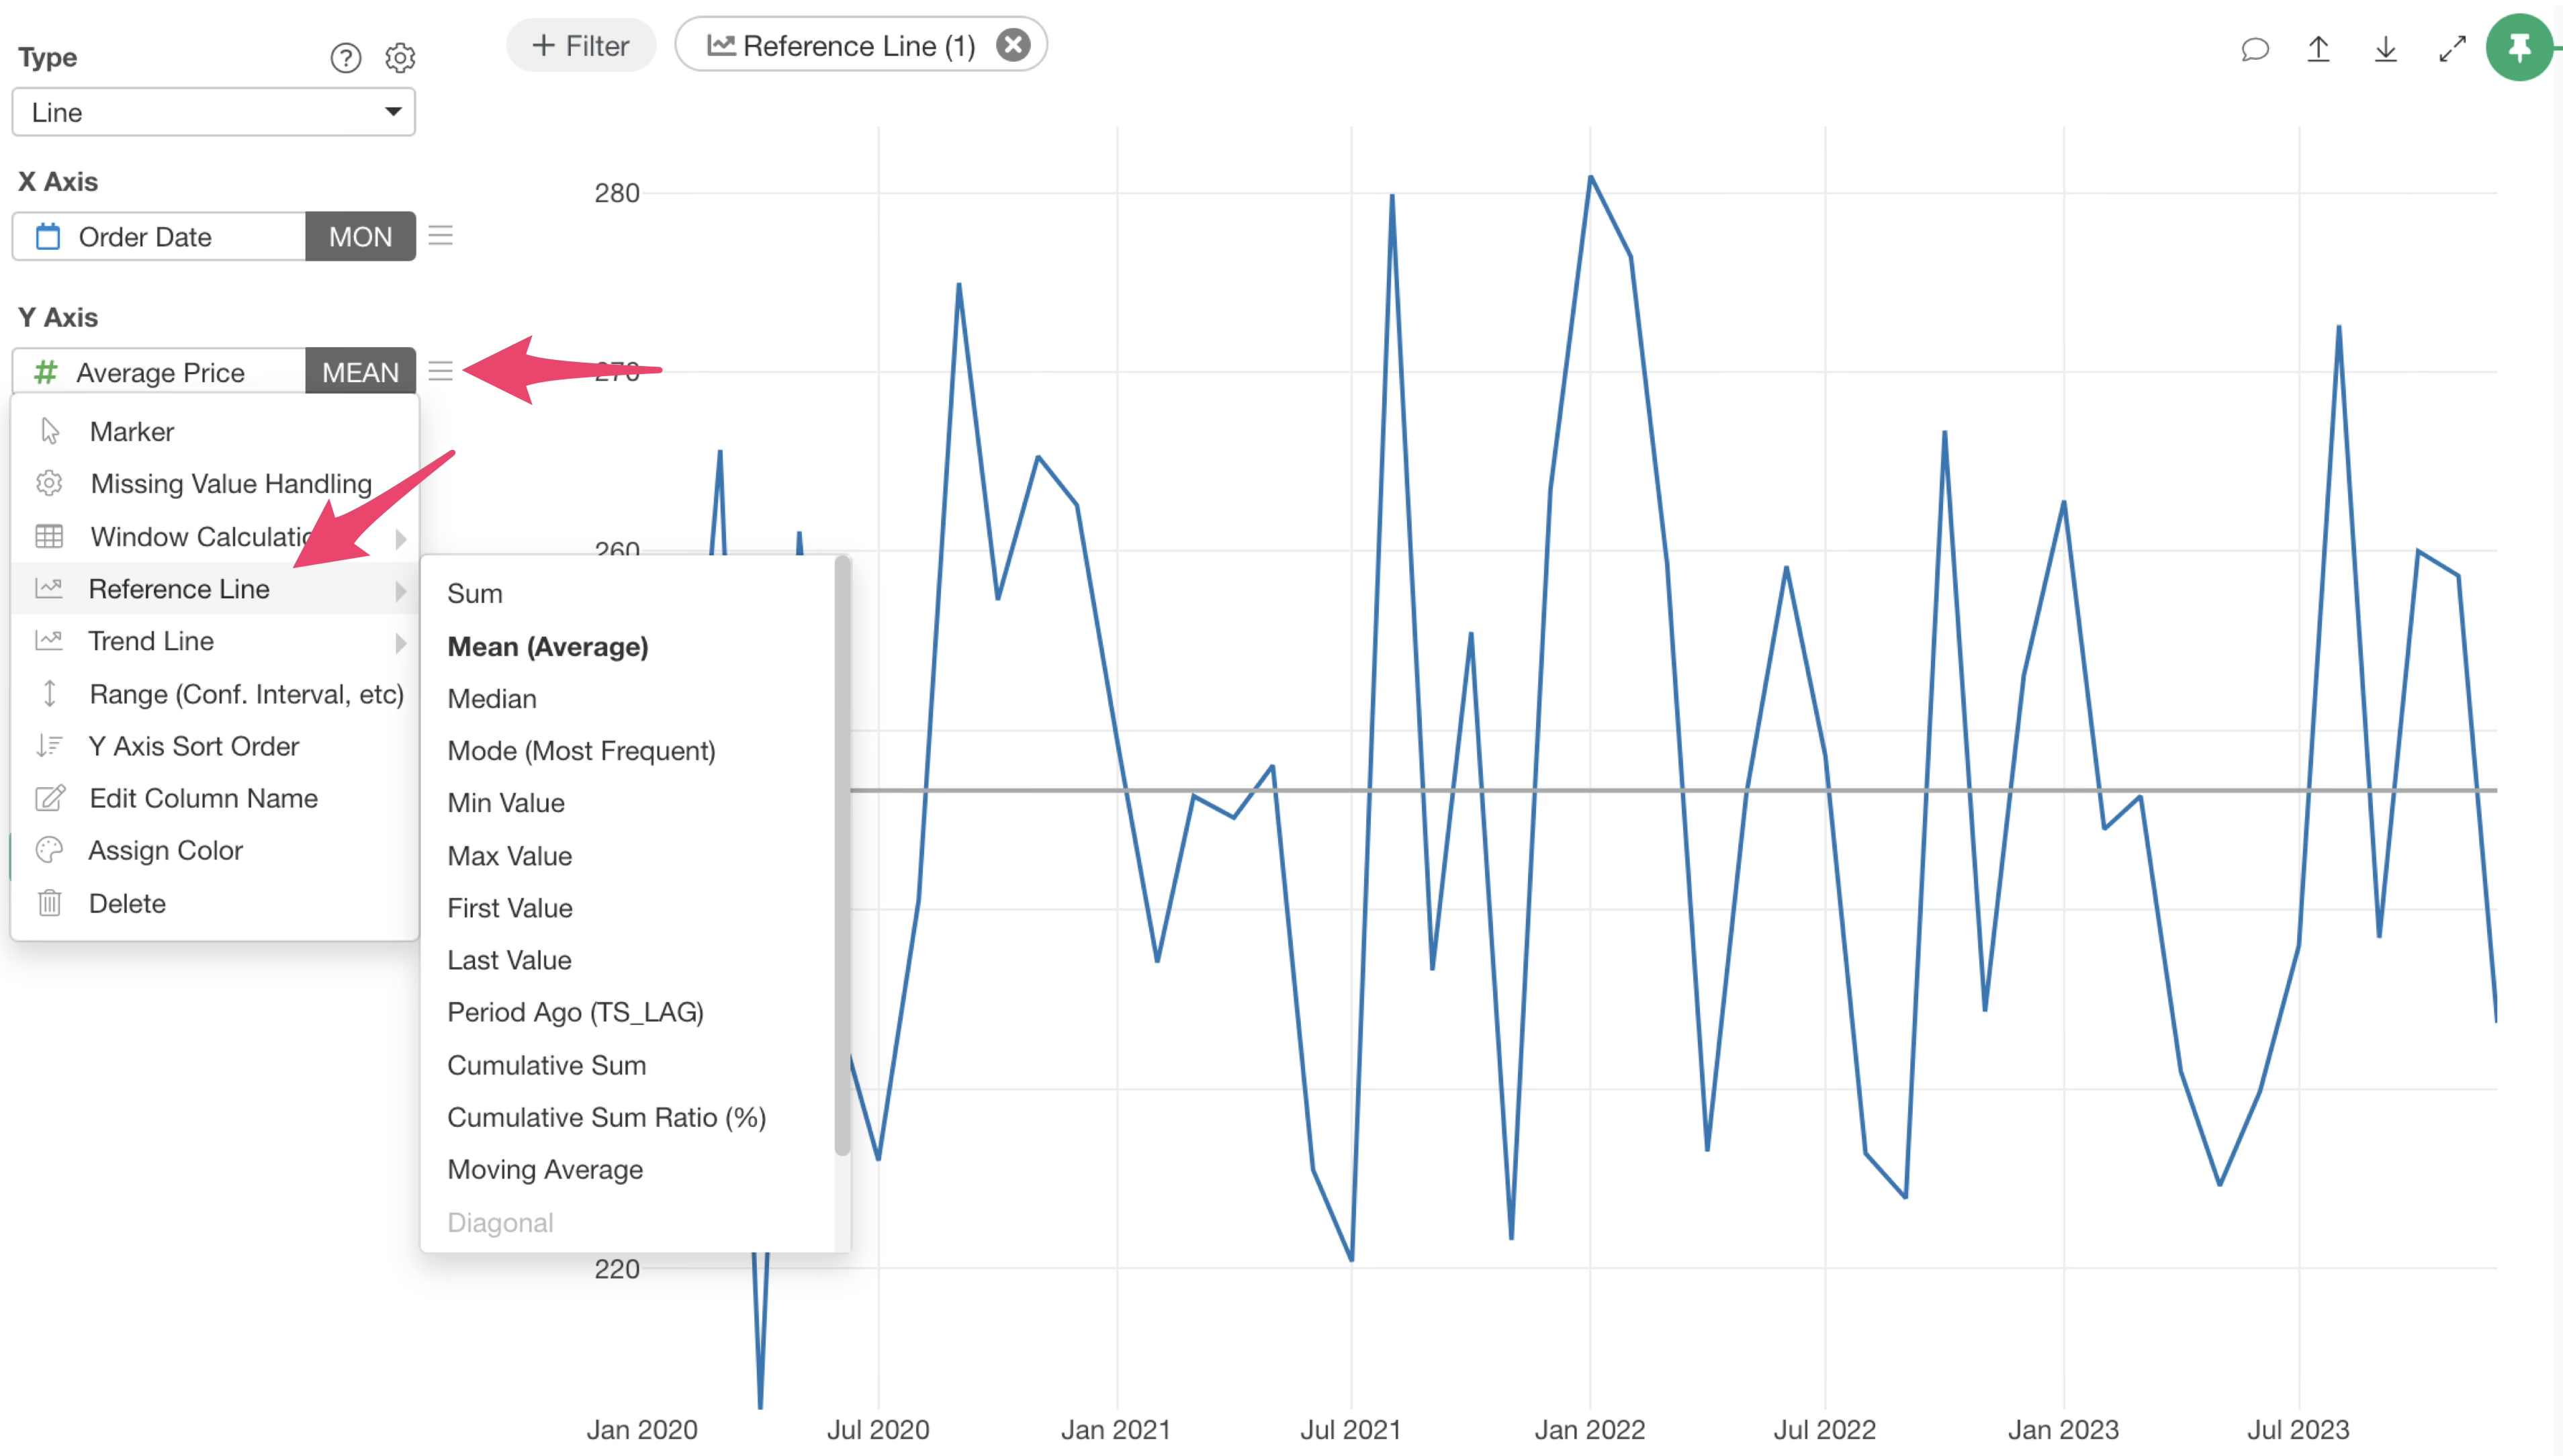
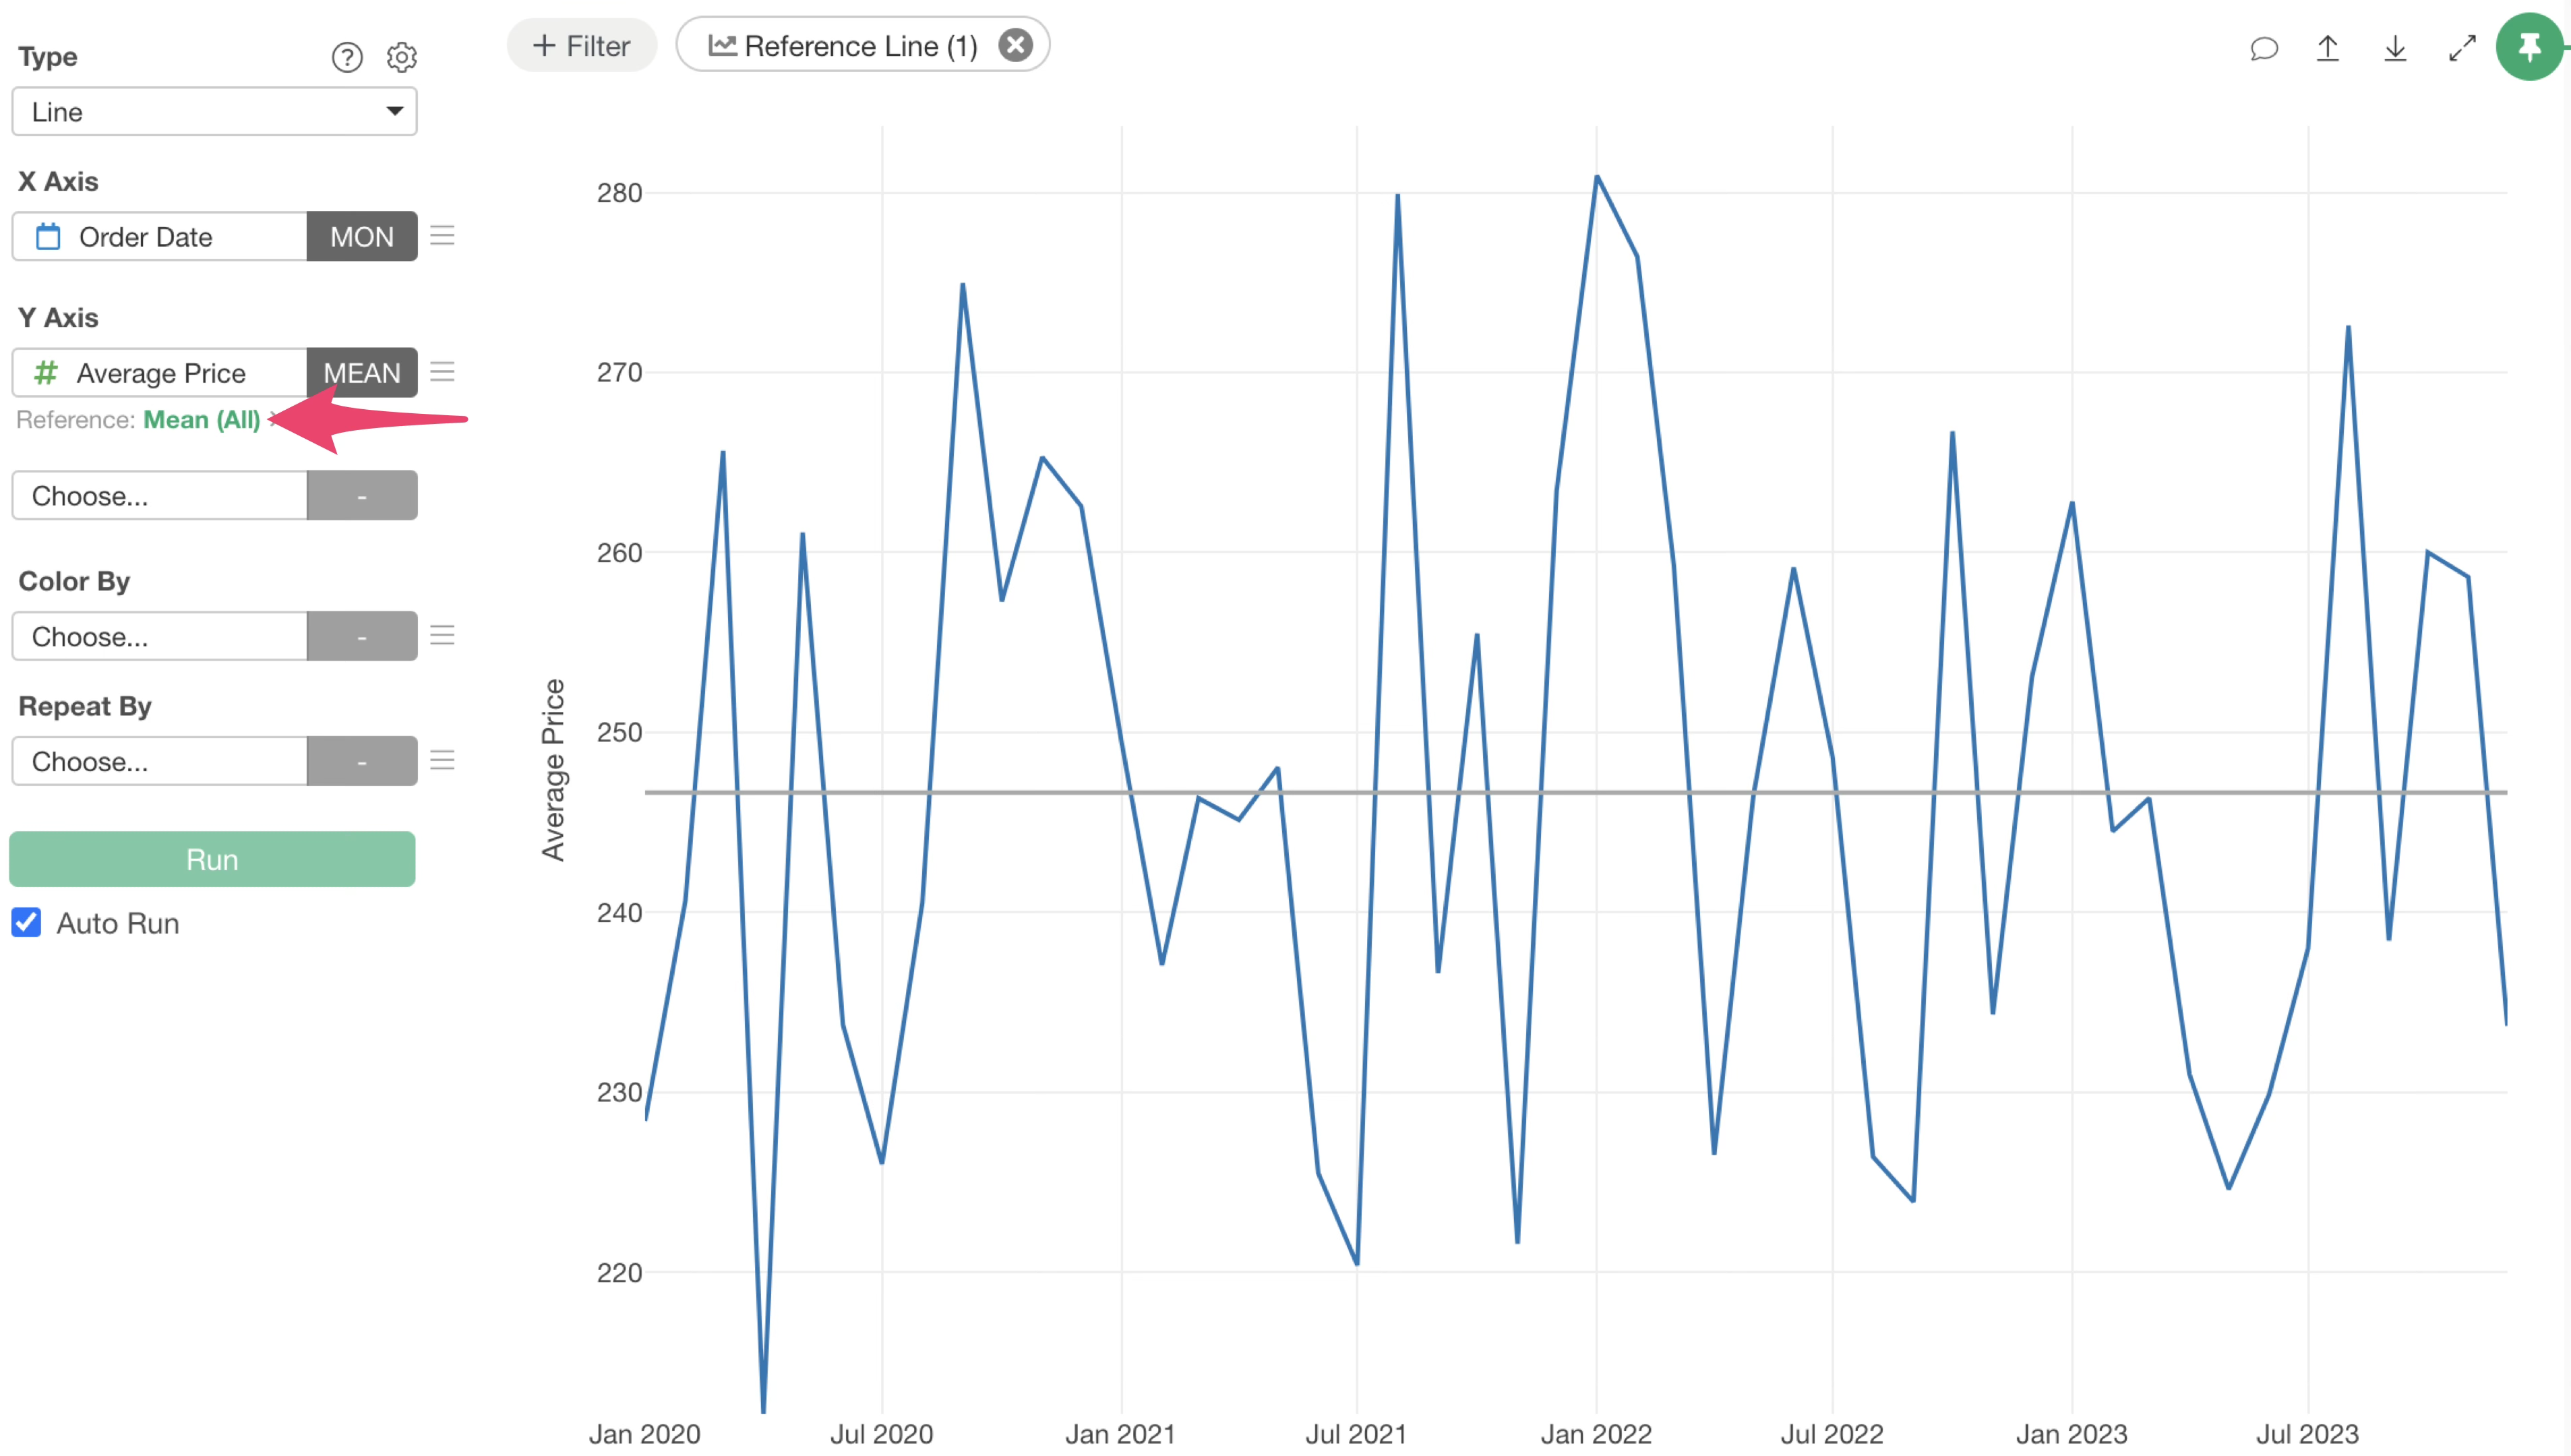
You can also access reference lines from the Y-axis value menu.
Setting Up Multiple Reference Lines
If you want to add multiple reference lines, click the “Reference Line” button again.
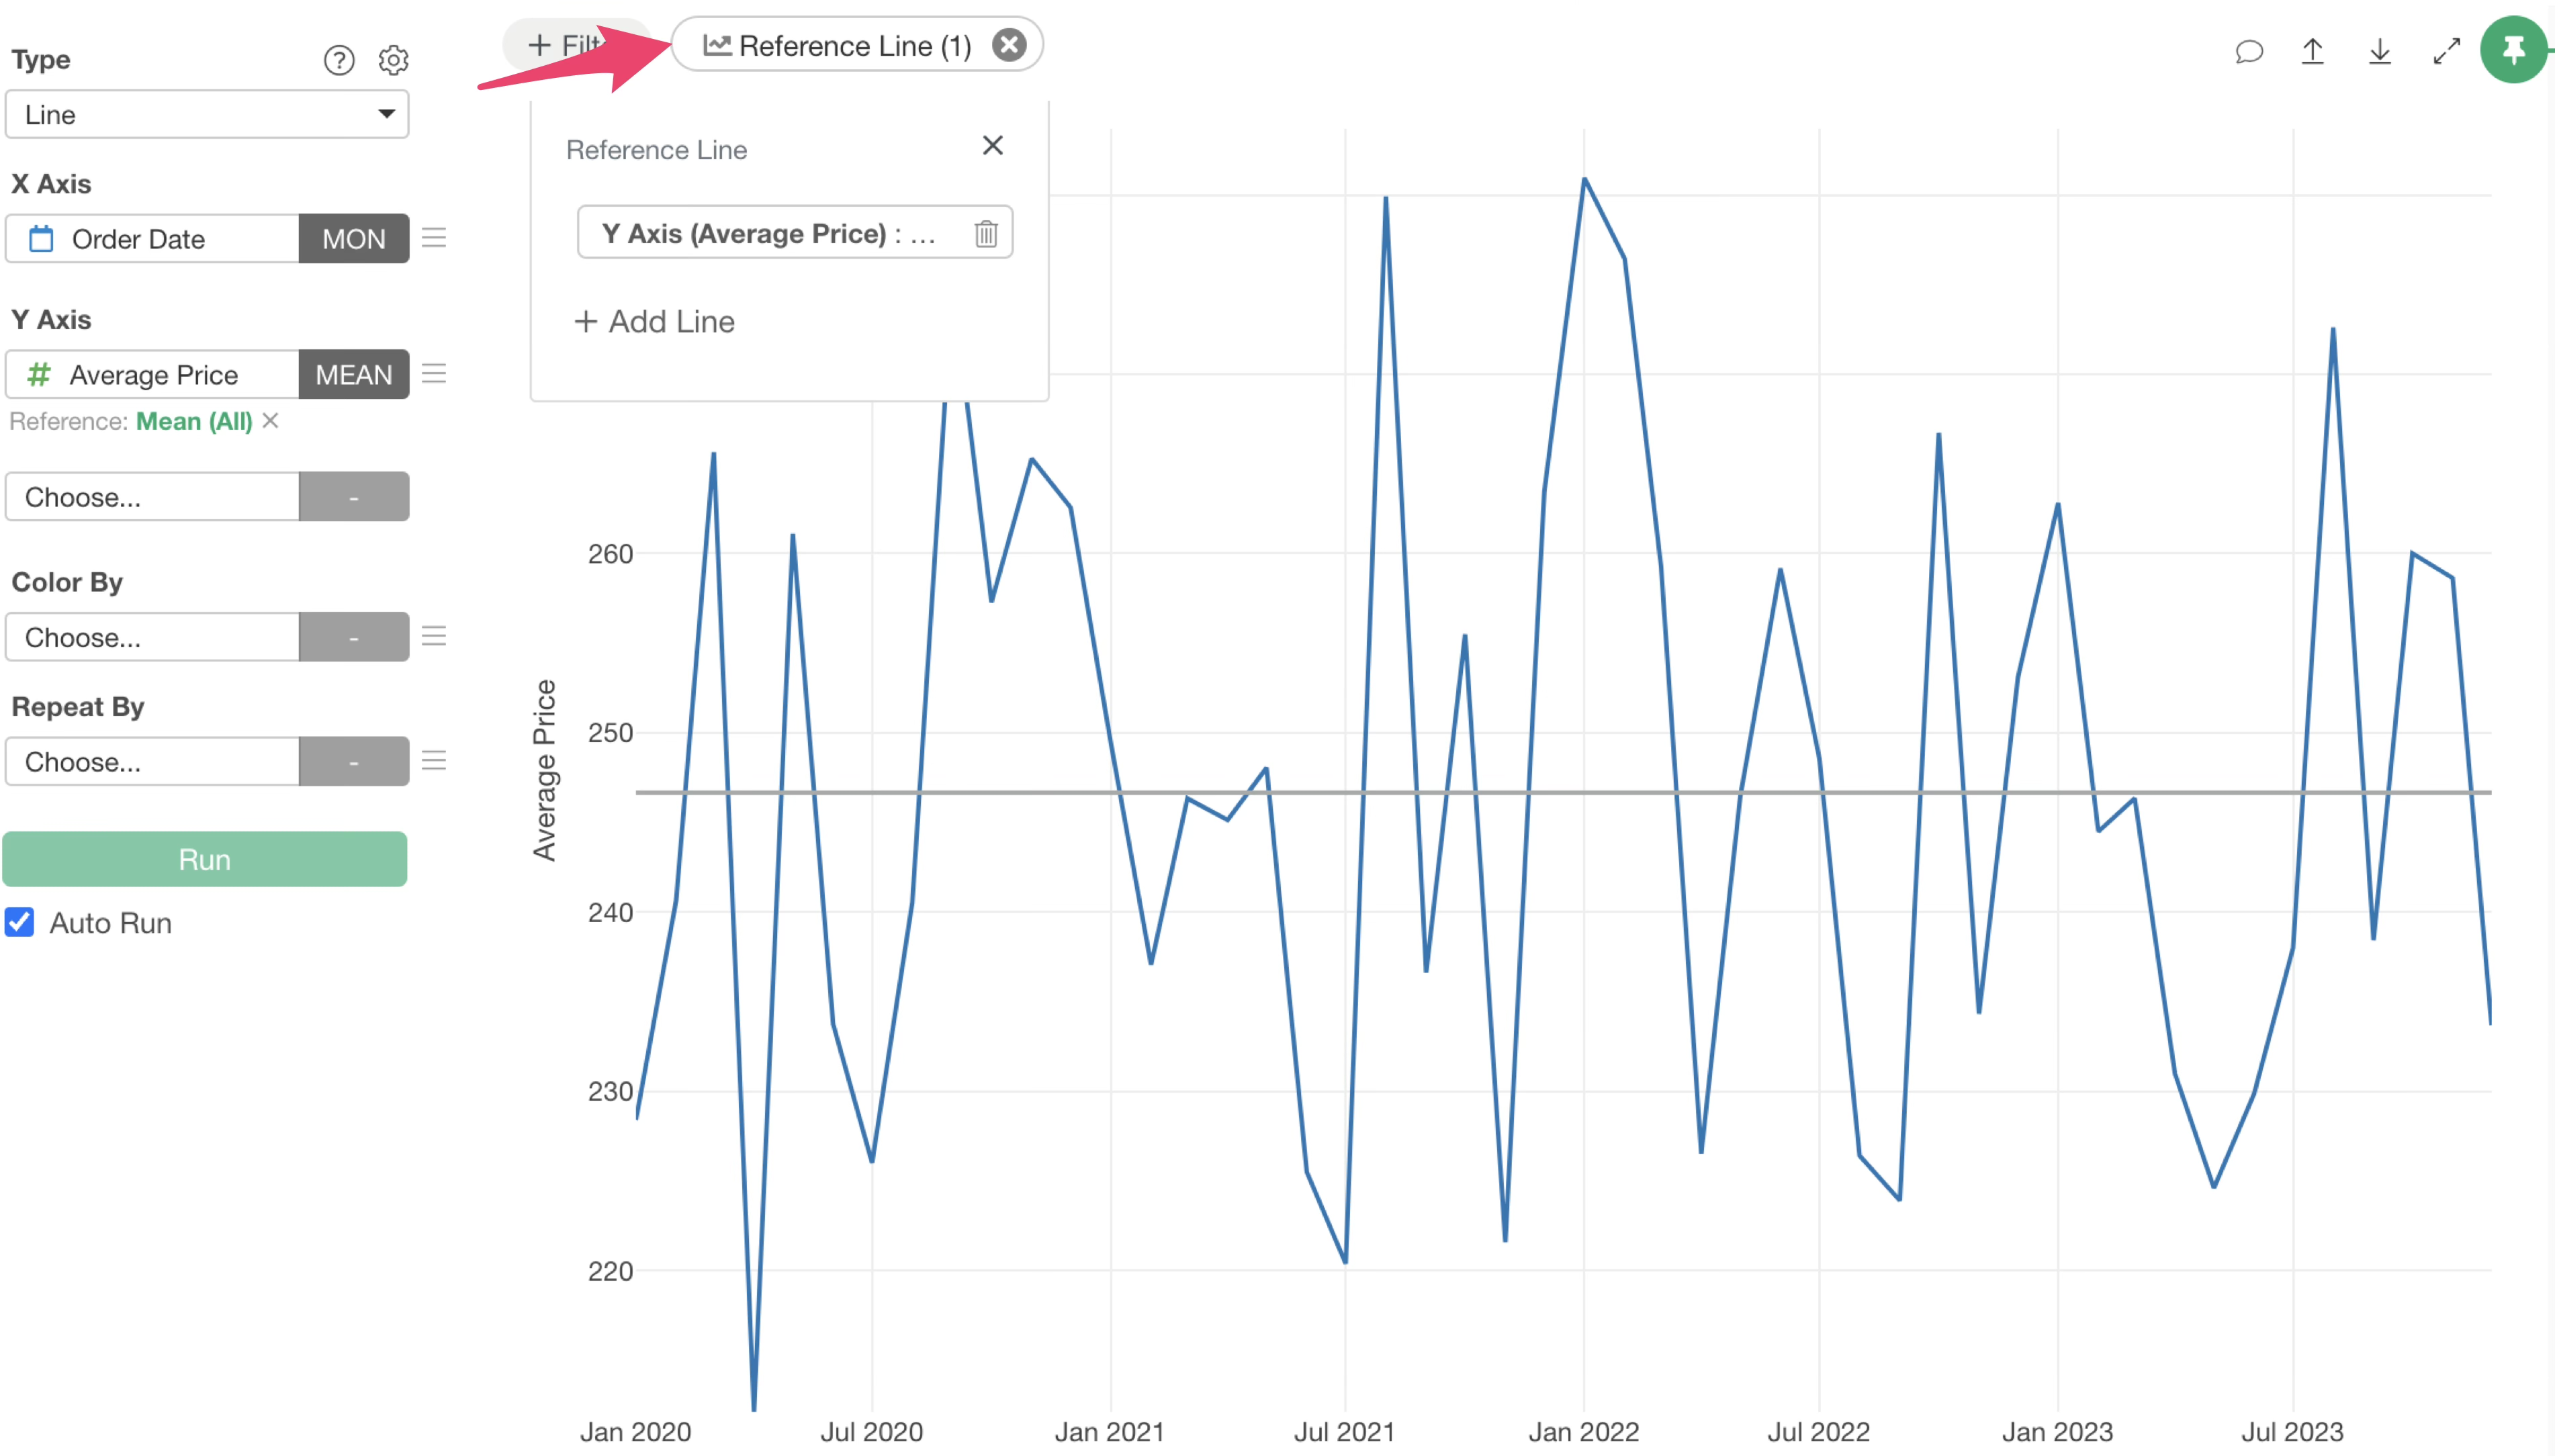
Click the “Add Line” button in the reference line dialog.
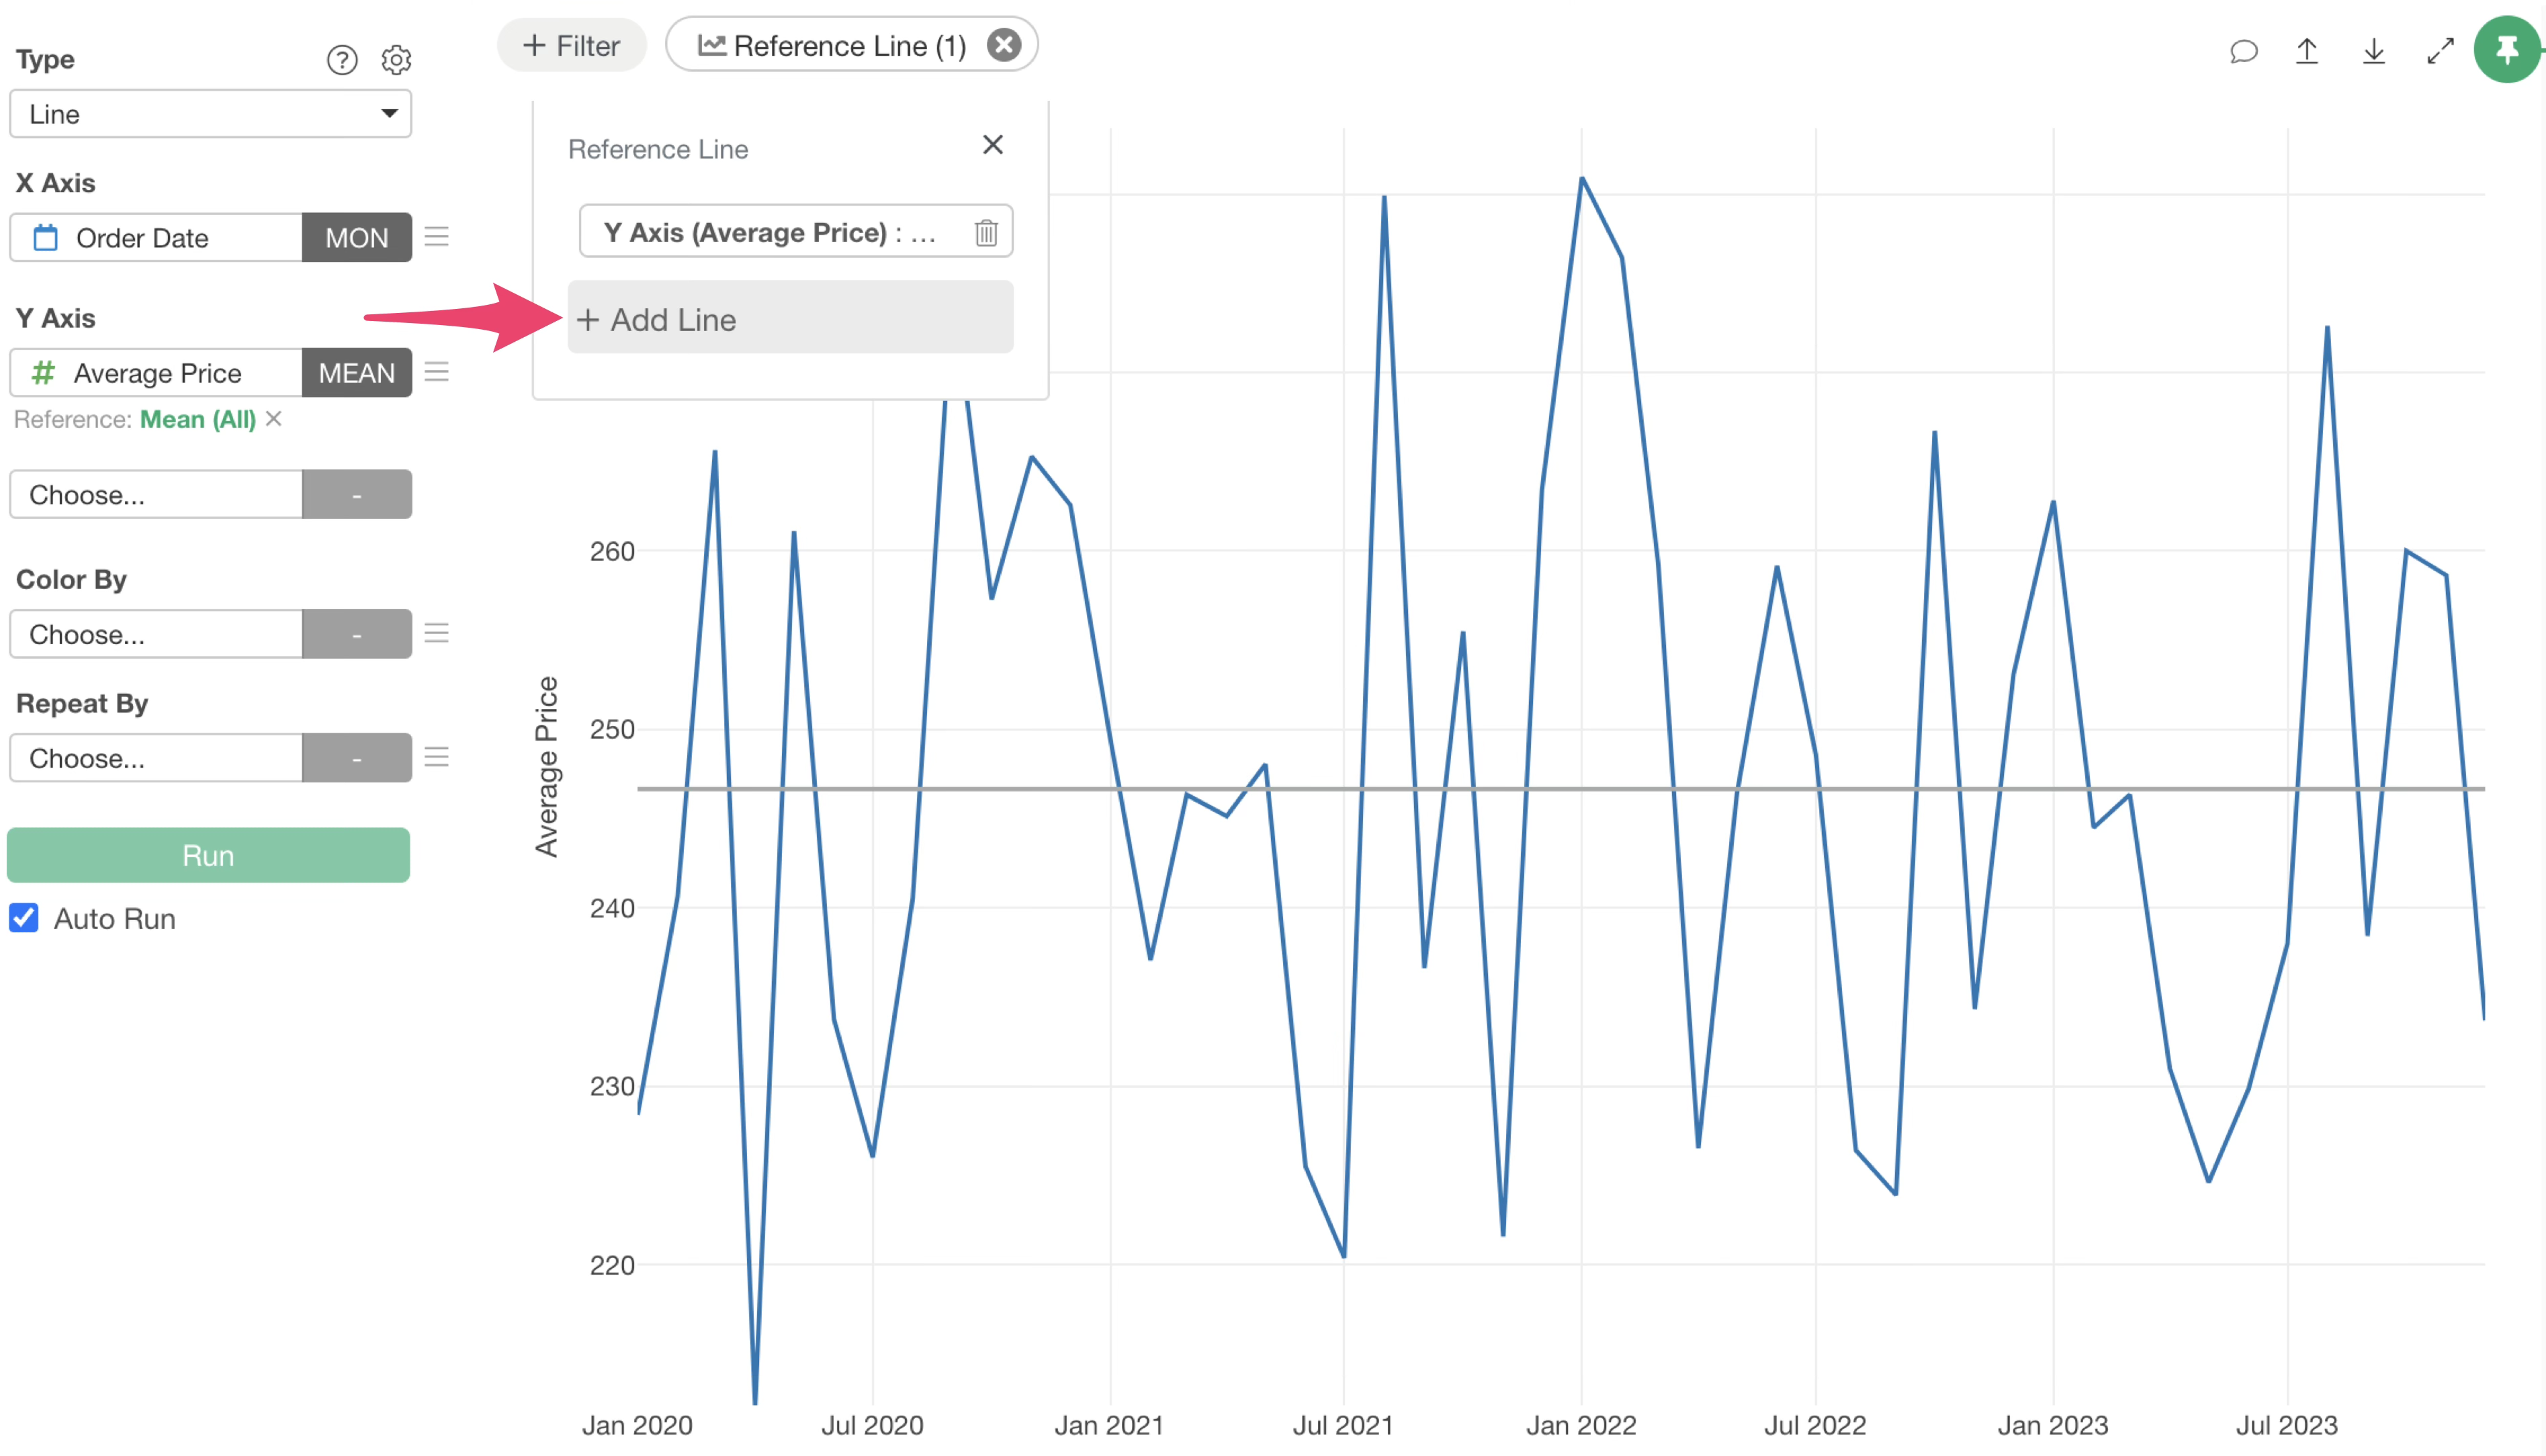
This allows you to choose whether to draw the reference line on the X-axis or Y-axis, same as the first line, and add it with the same steps.
Changing Reference Line Settings
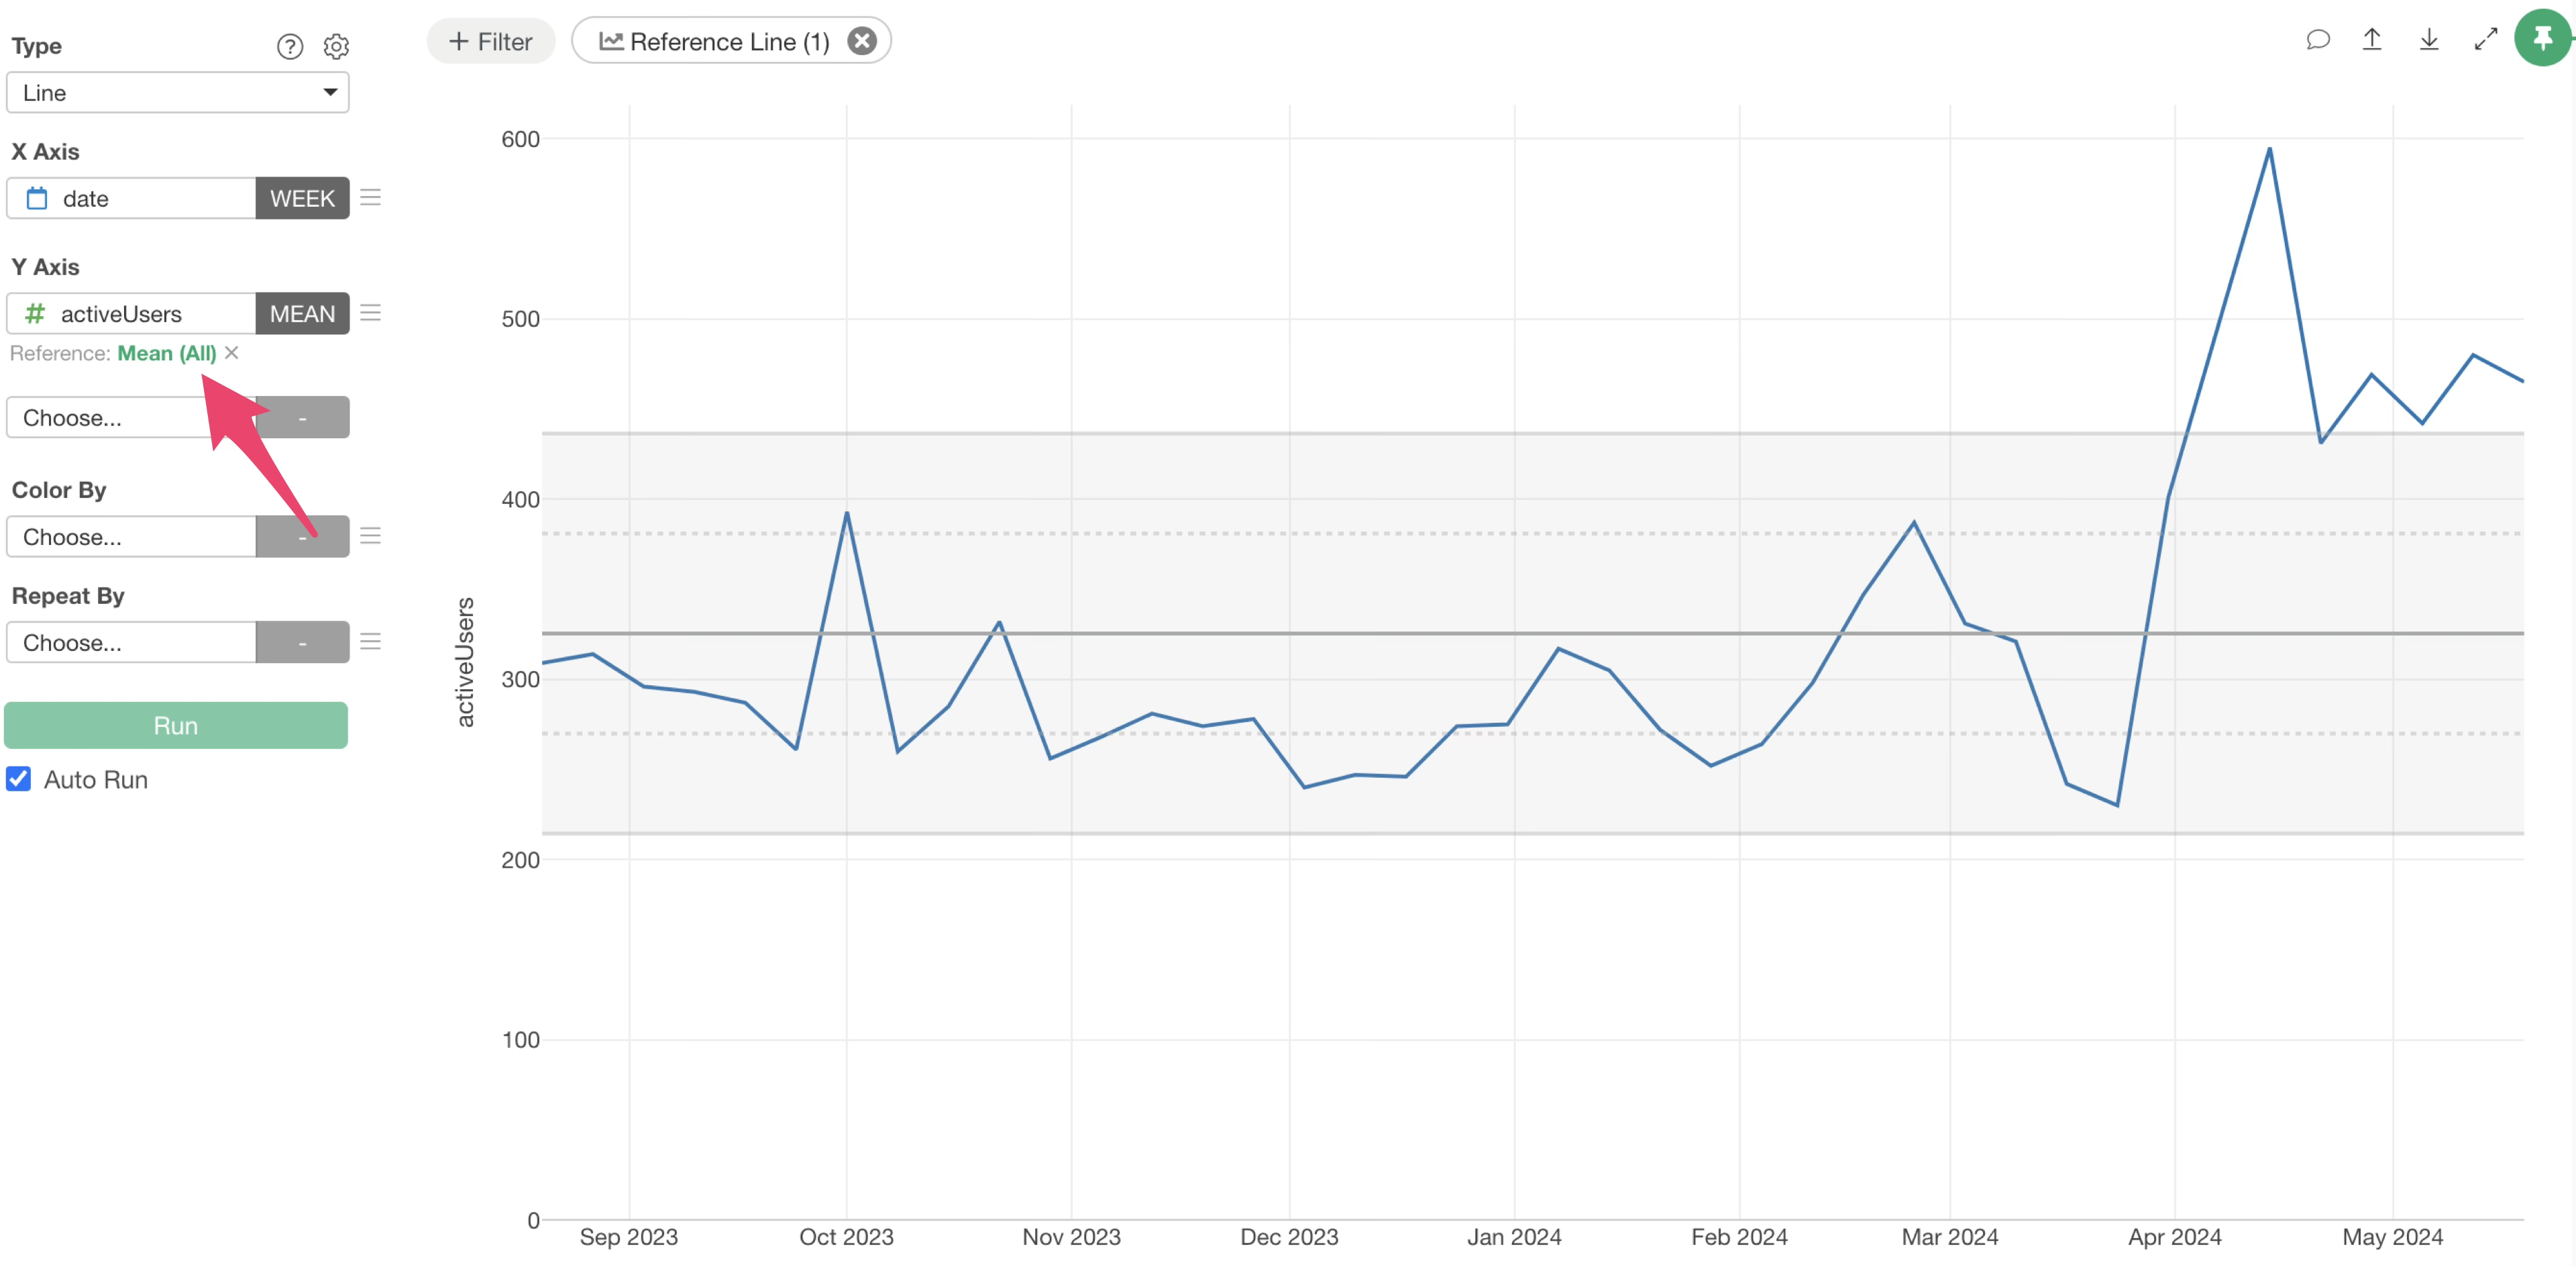
To edit an existing reference line, click the “Line” button and then click the button for the configured reference line, or
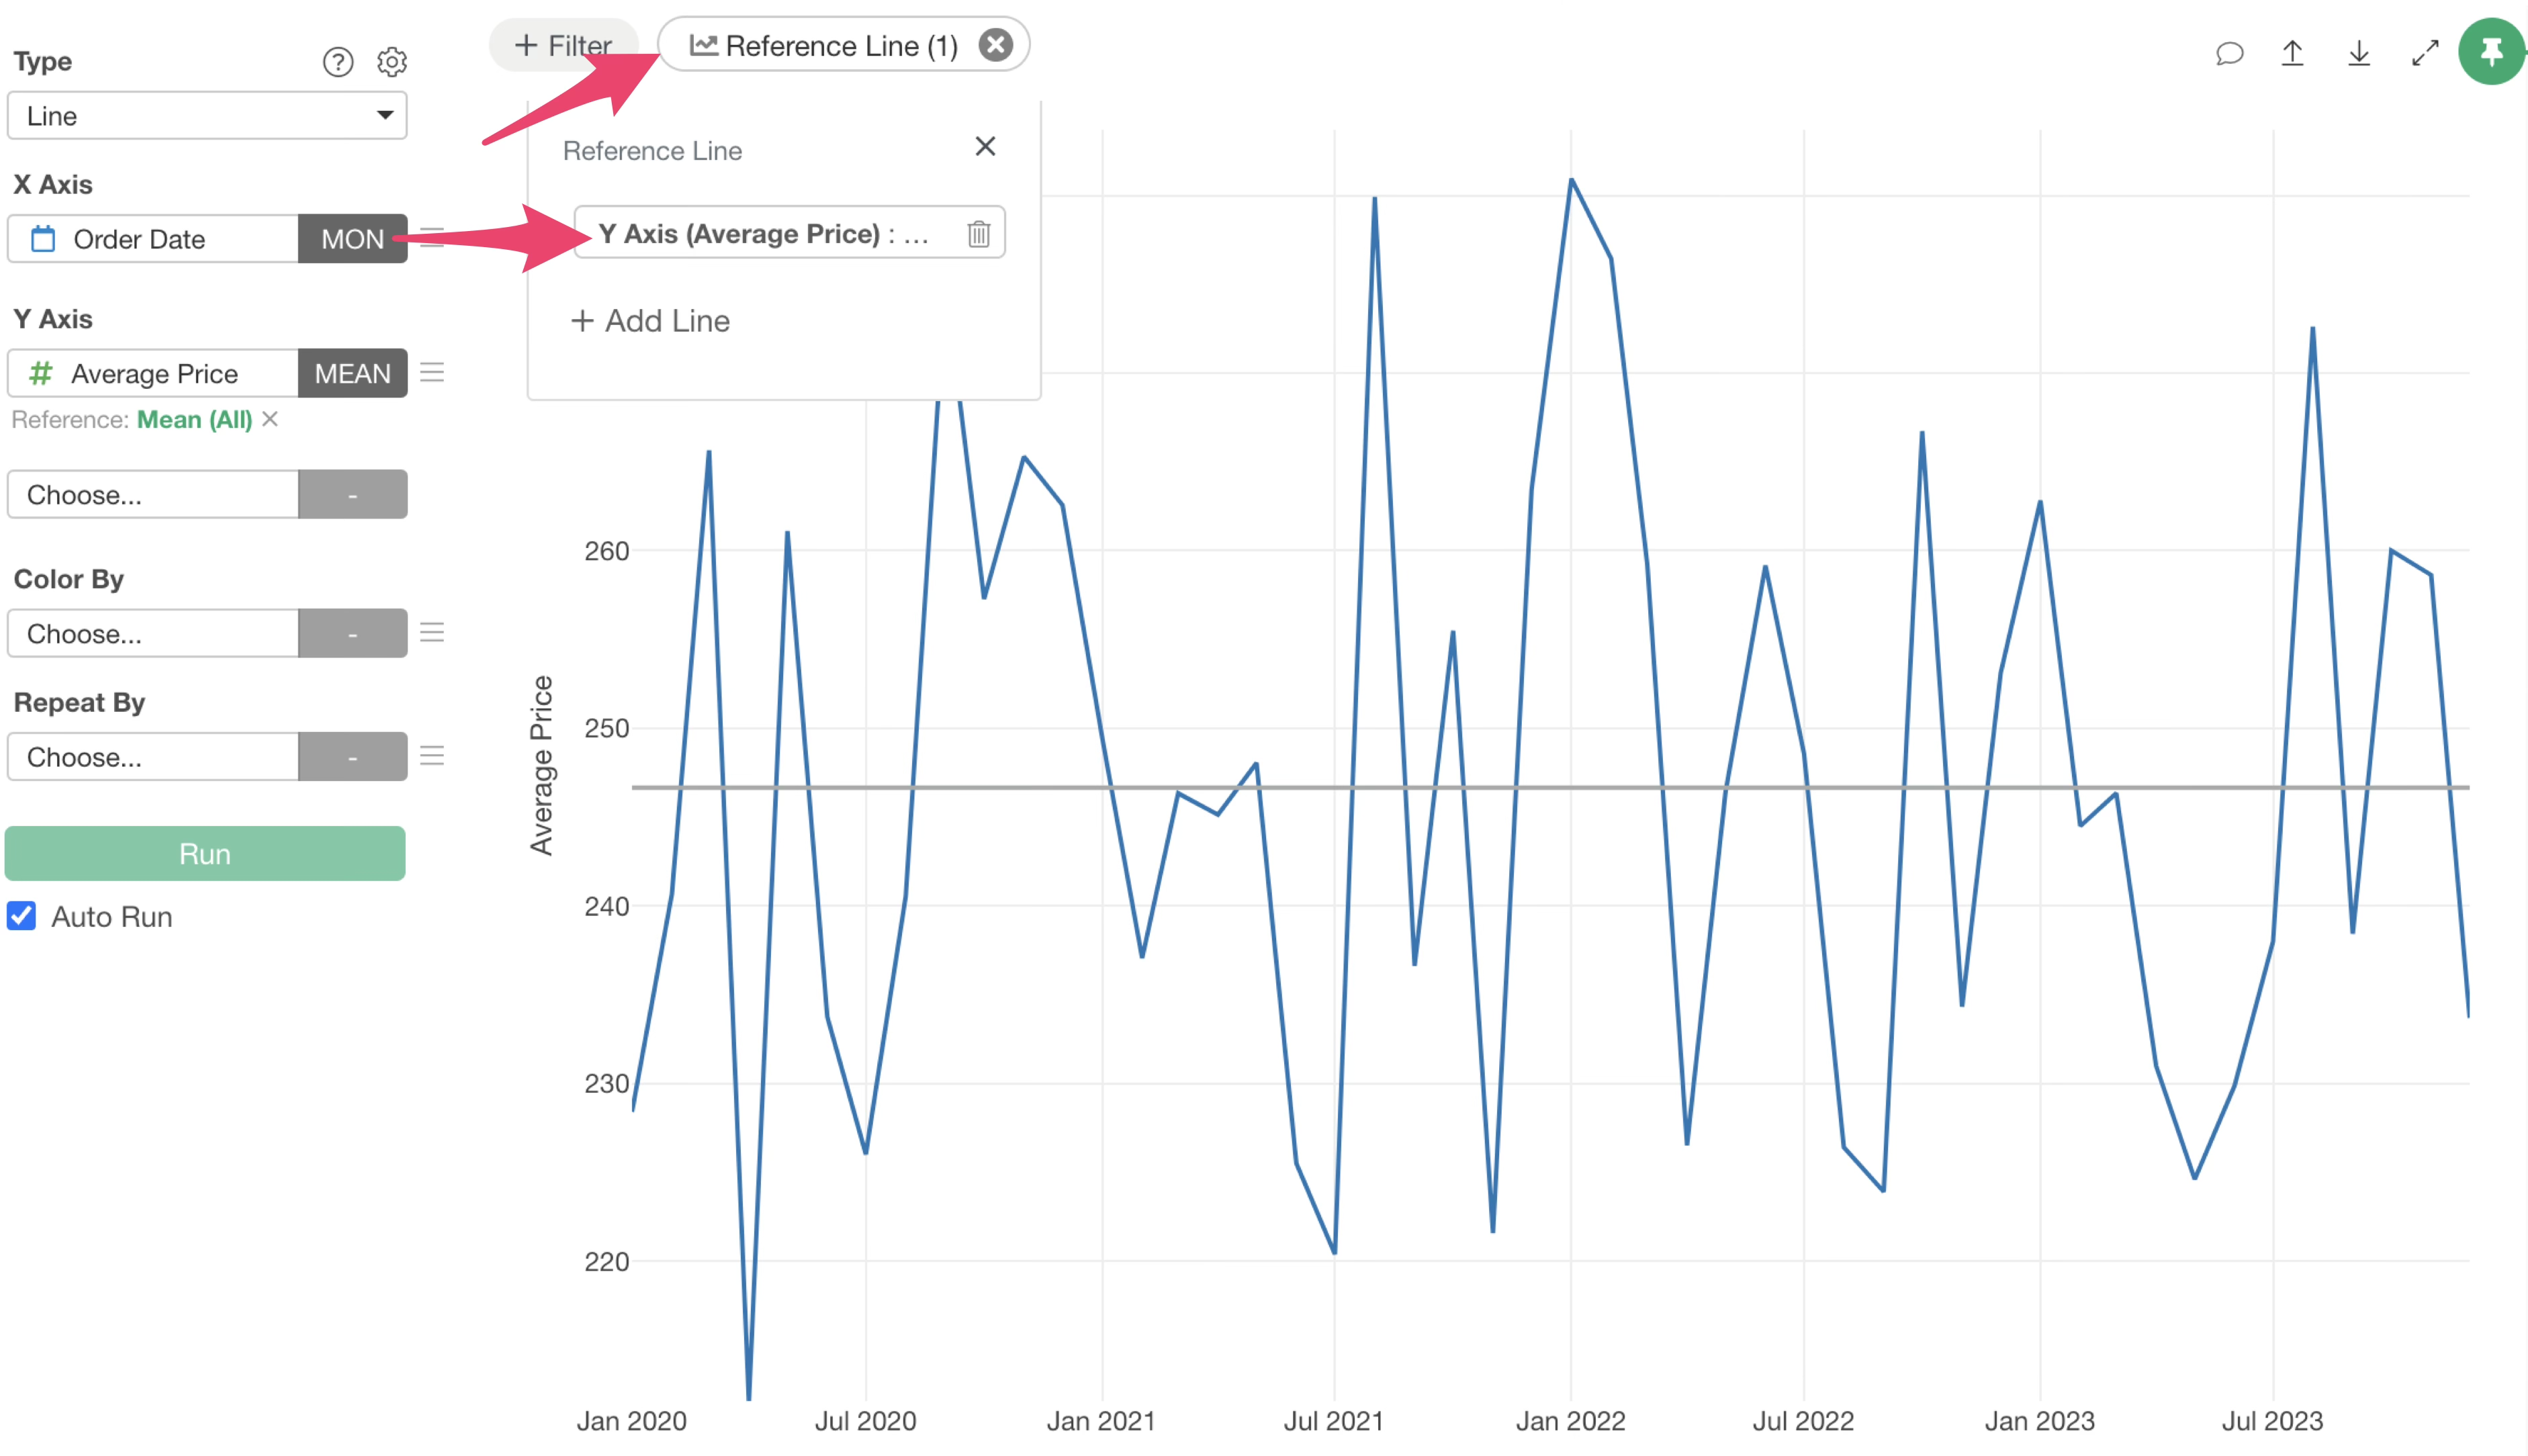
Click the green text of the reference line displayed on each axis.
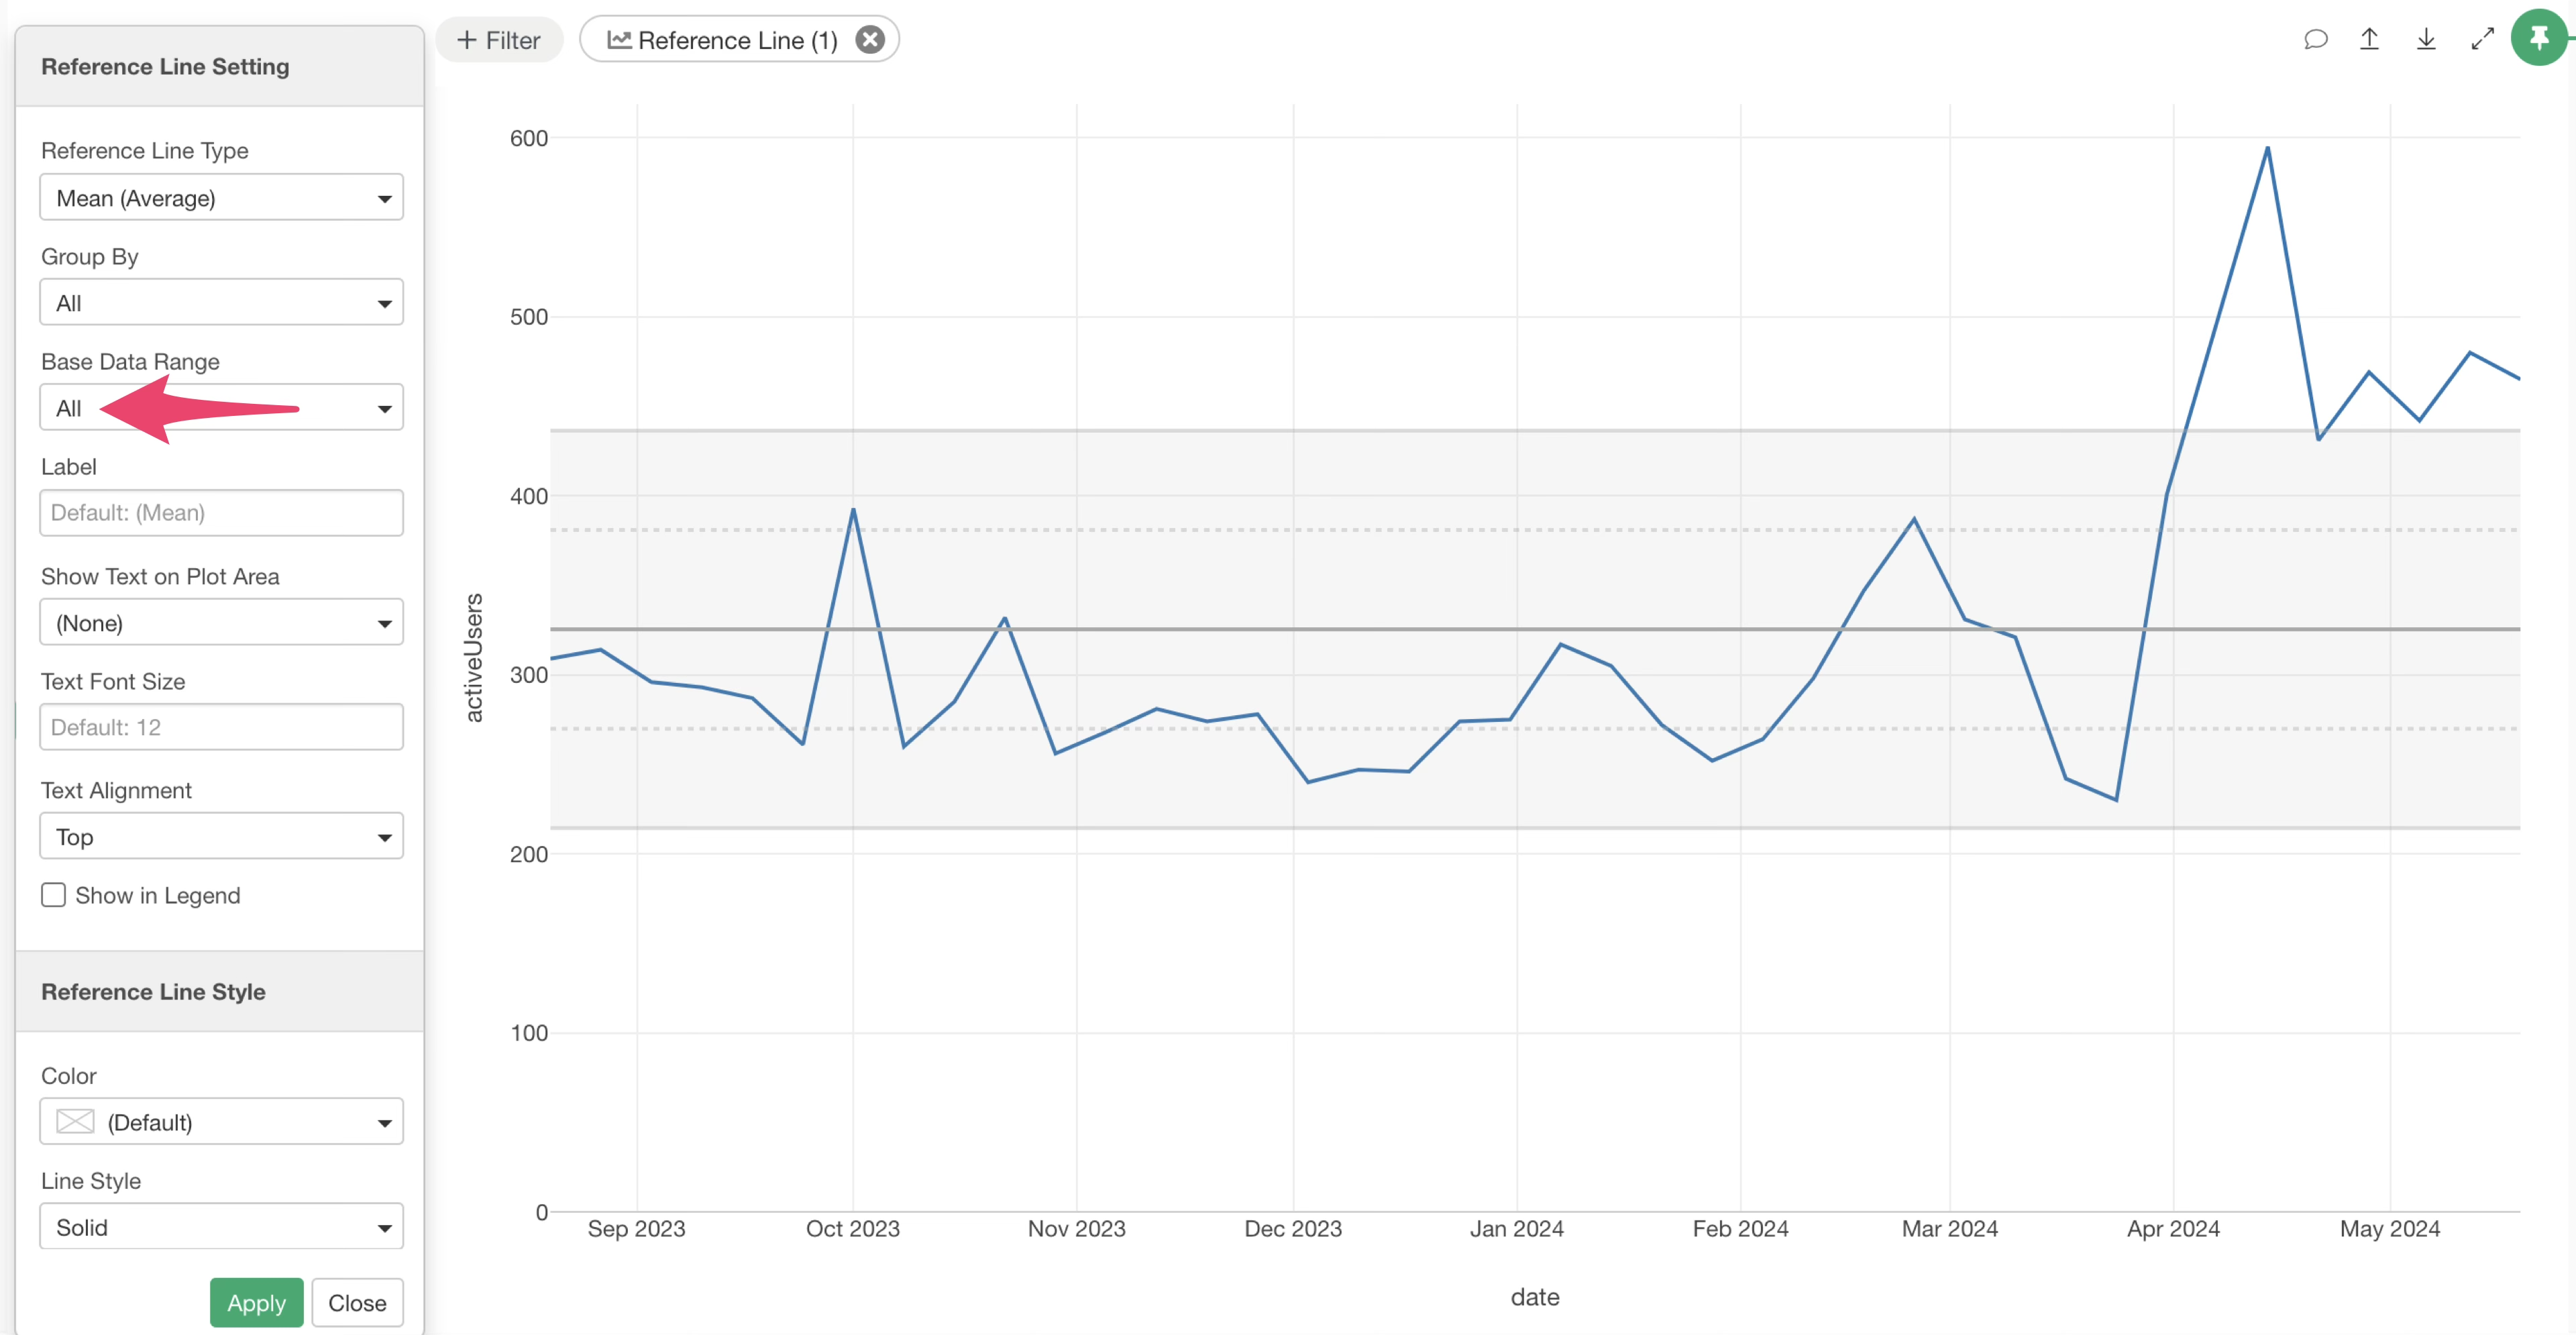
This opens the reference line settings dialog, where you can change or adjust detailed settings such as the reference line type, color, style, and label.
Supported Calculation Types
Reference lines support the following calculation types:
- Sum
- Mean (Average)
- Median
- Mode (Most Frequent)
- Min Value
- Max Value
- First Value
- Last Value
- Period Ago (TS_LAG)
- Cumulative Sum
- Cumulative Sum Ratio (%)
- Moving Average
- Diagonal
- Specific Value
- XmR (Control Chart)
X-axis and Y-axis
Reference lines can be drawn on both the X-axis and Y-axis.
Here’s a brief overview of reference lines for each axis.
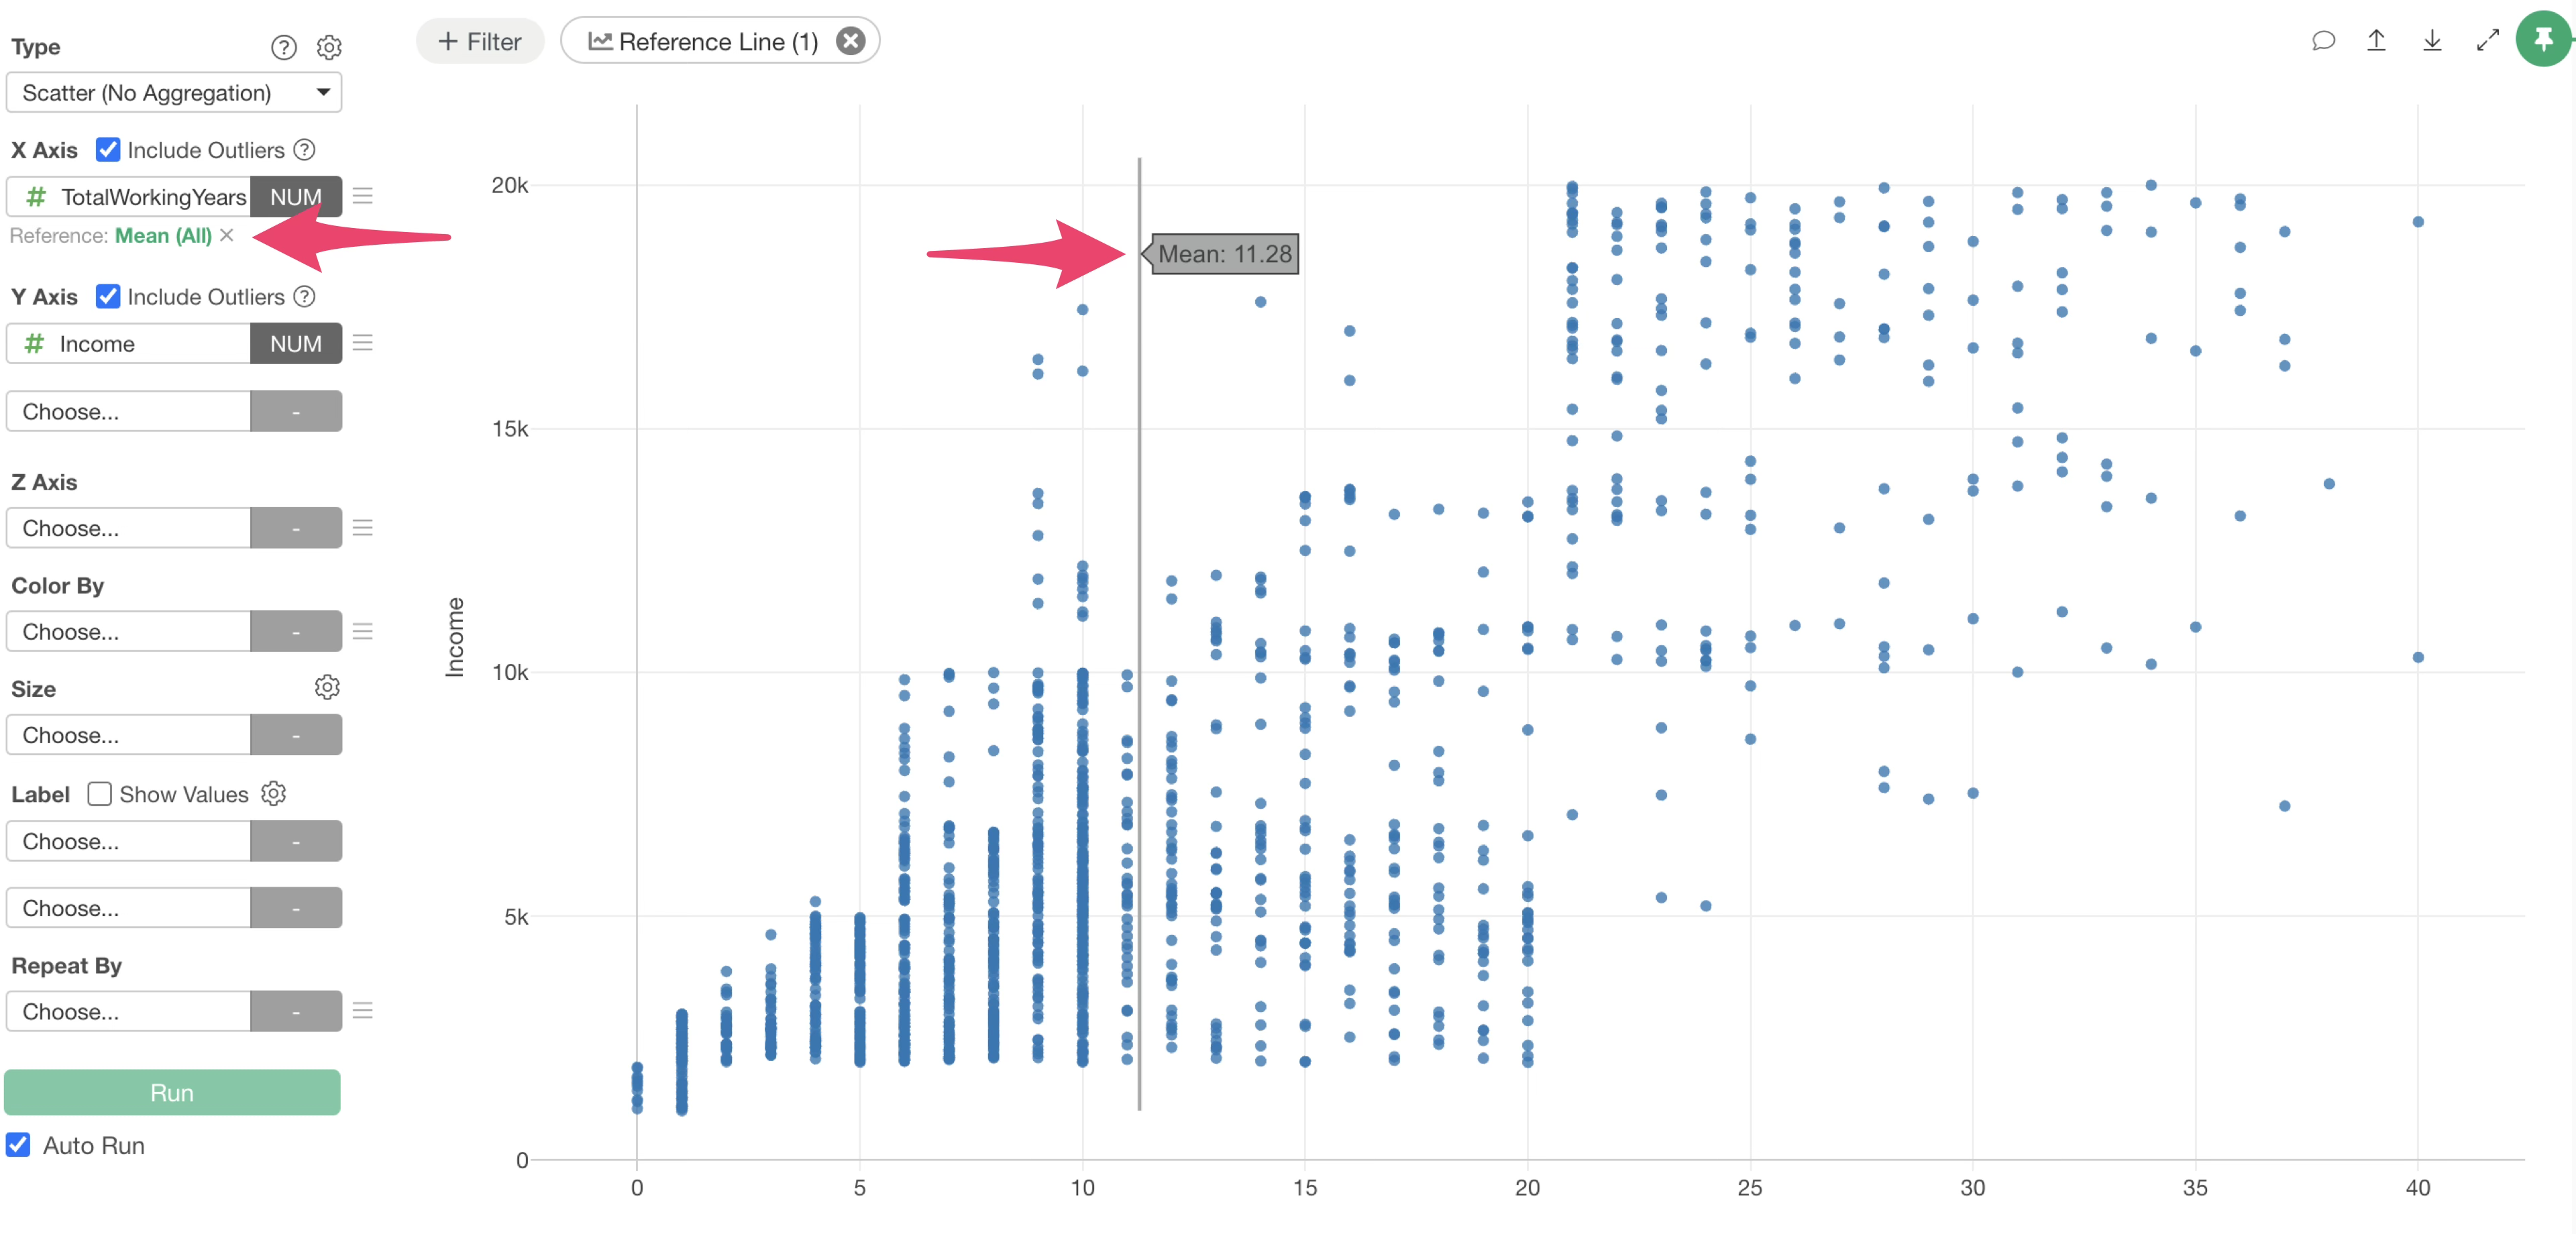
X-axis
When you draw a reference line on the X-axis, it appears vertically on the chart.
For example, in a scatter plot, you can set the average value as an X-axis reference line. This allows you to quickly identify observations where the metric on the X-axis is above the average.
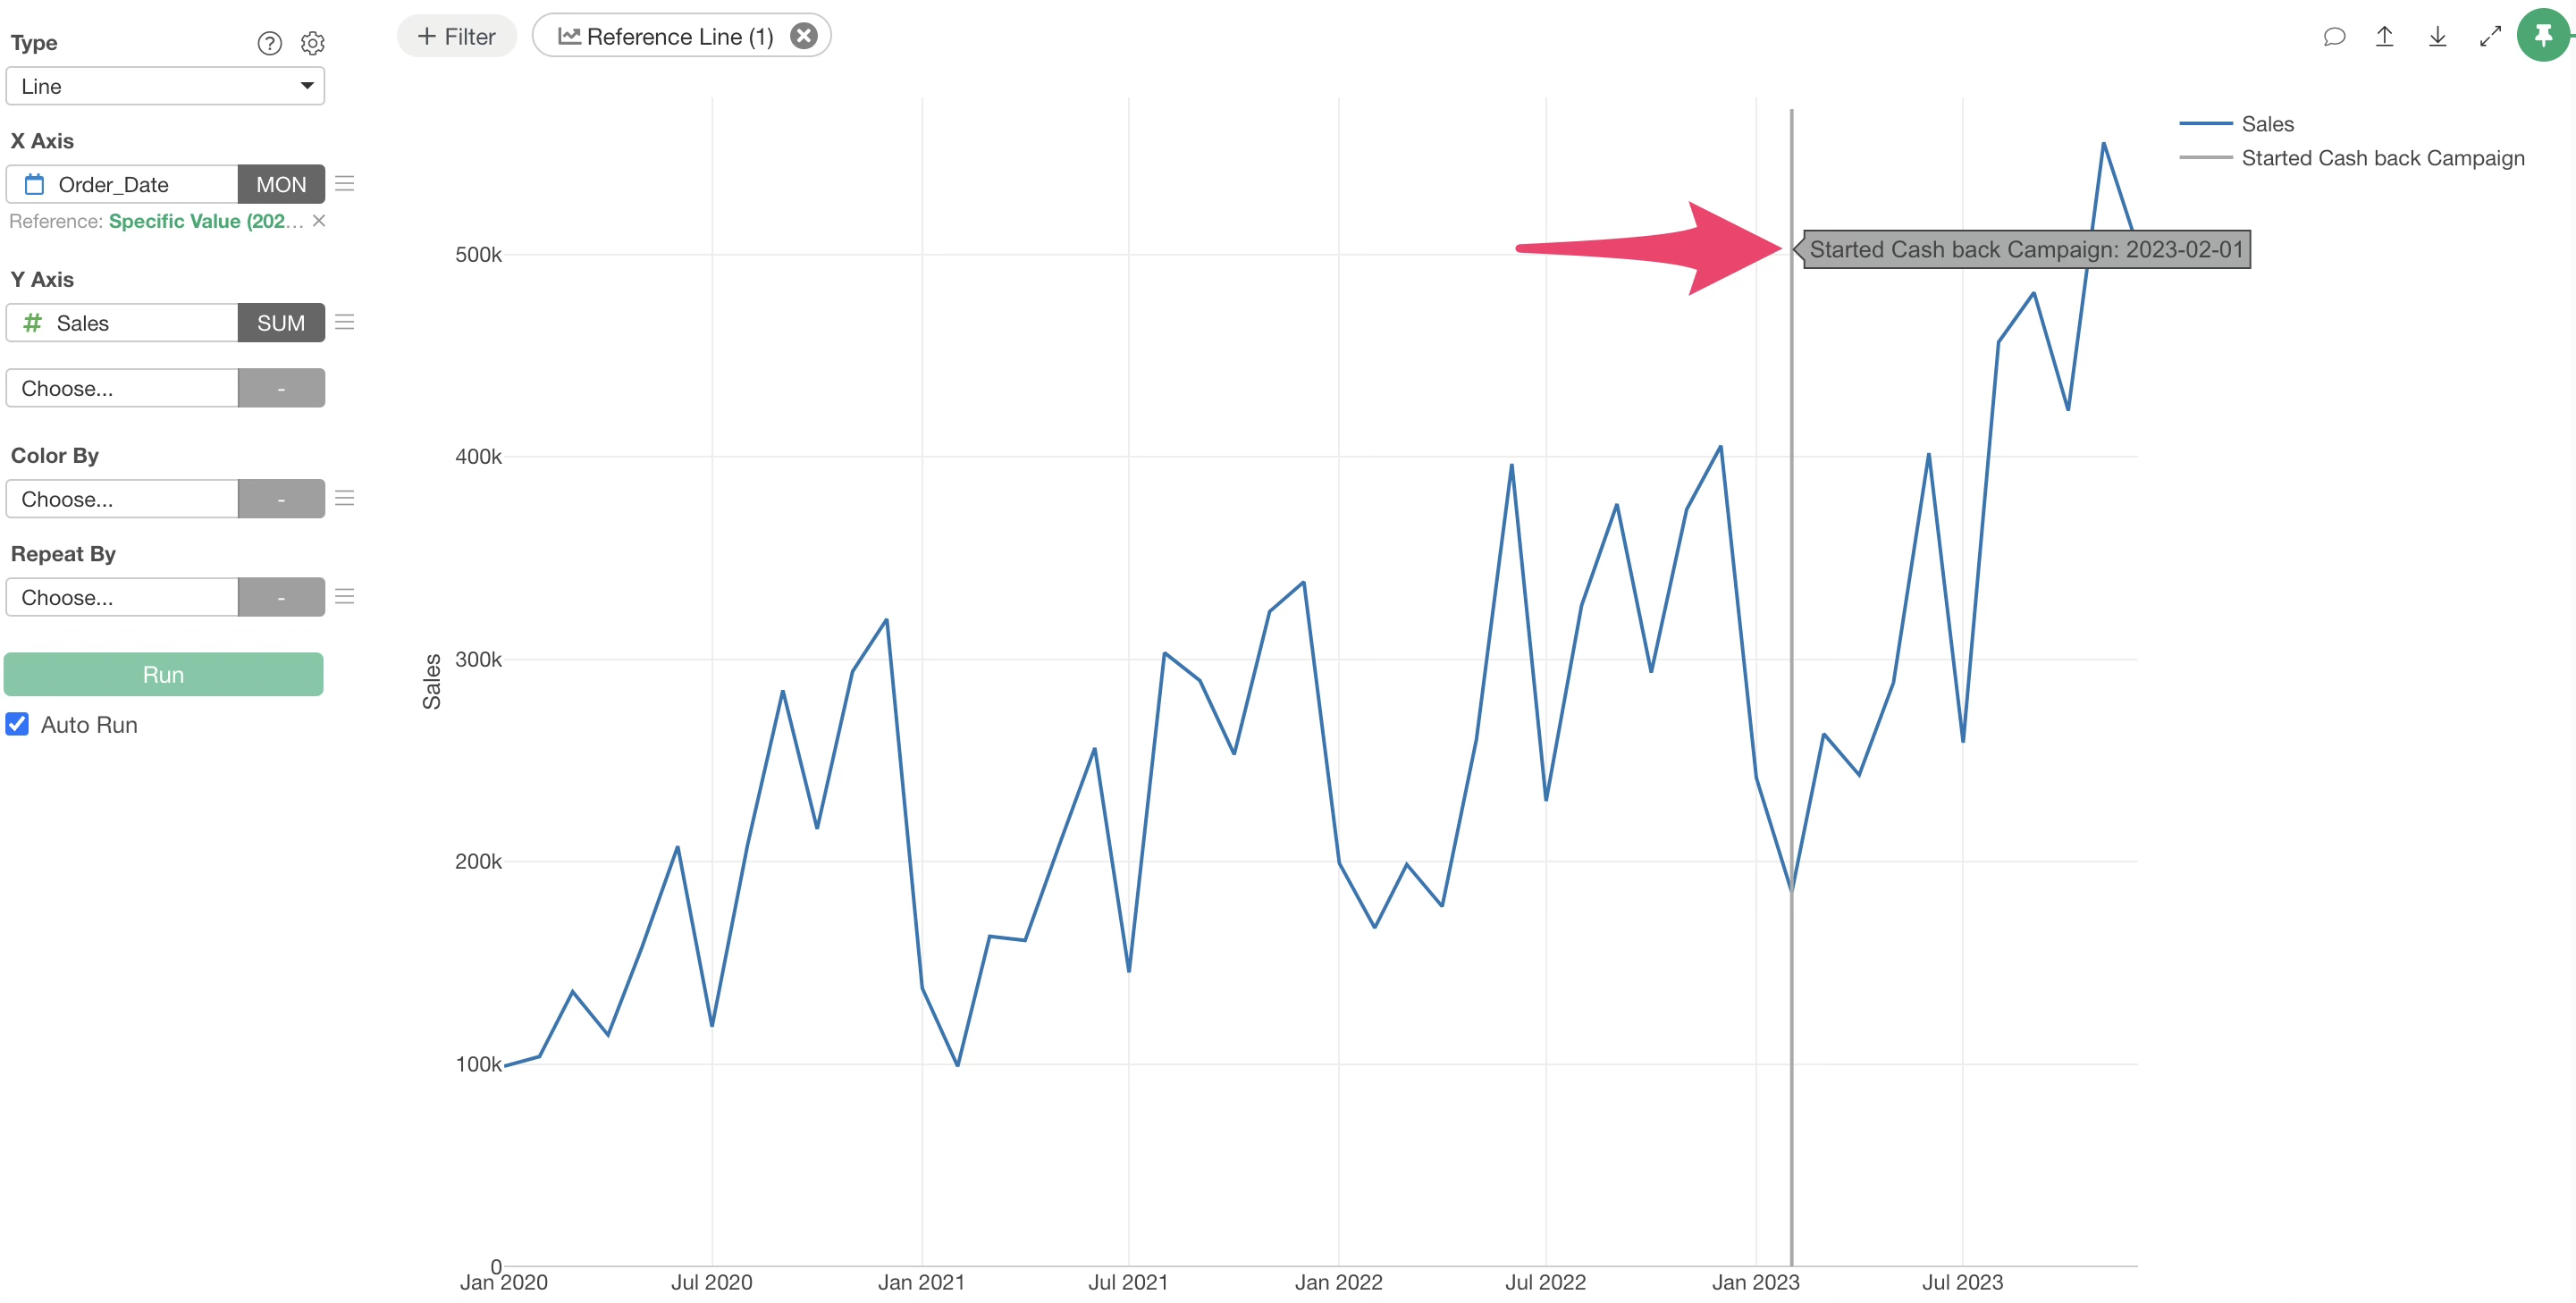
You can also set a specific value for a reference line to establish a benchmark for specific dates or numerical values.
Y-axis
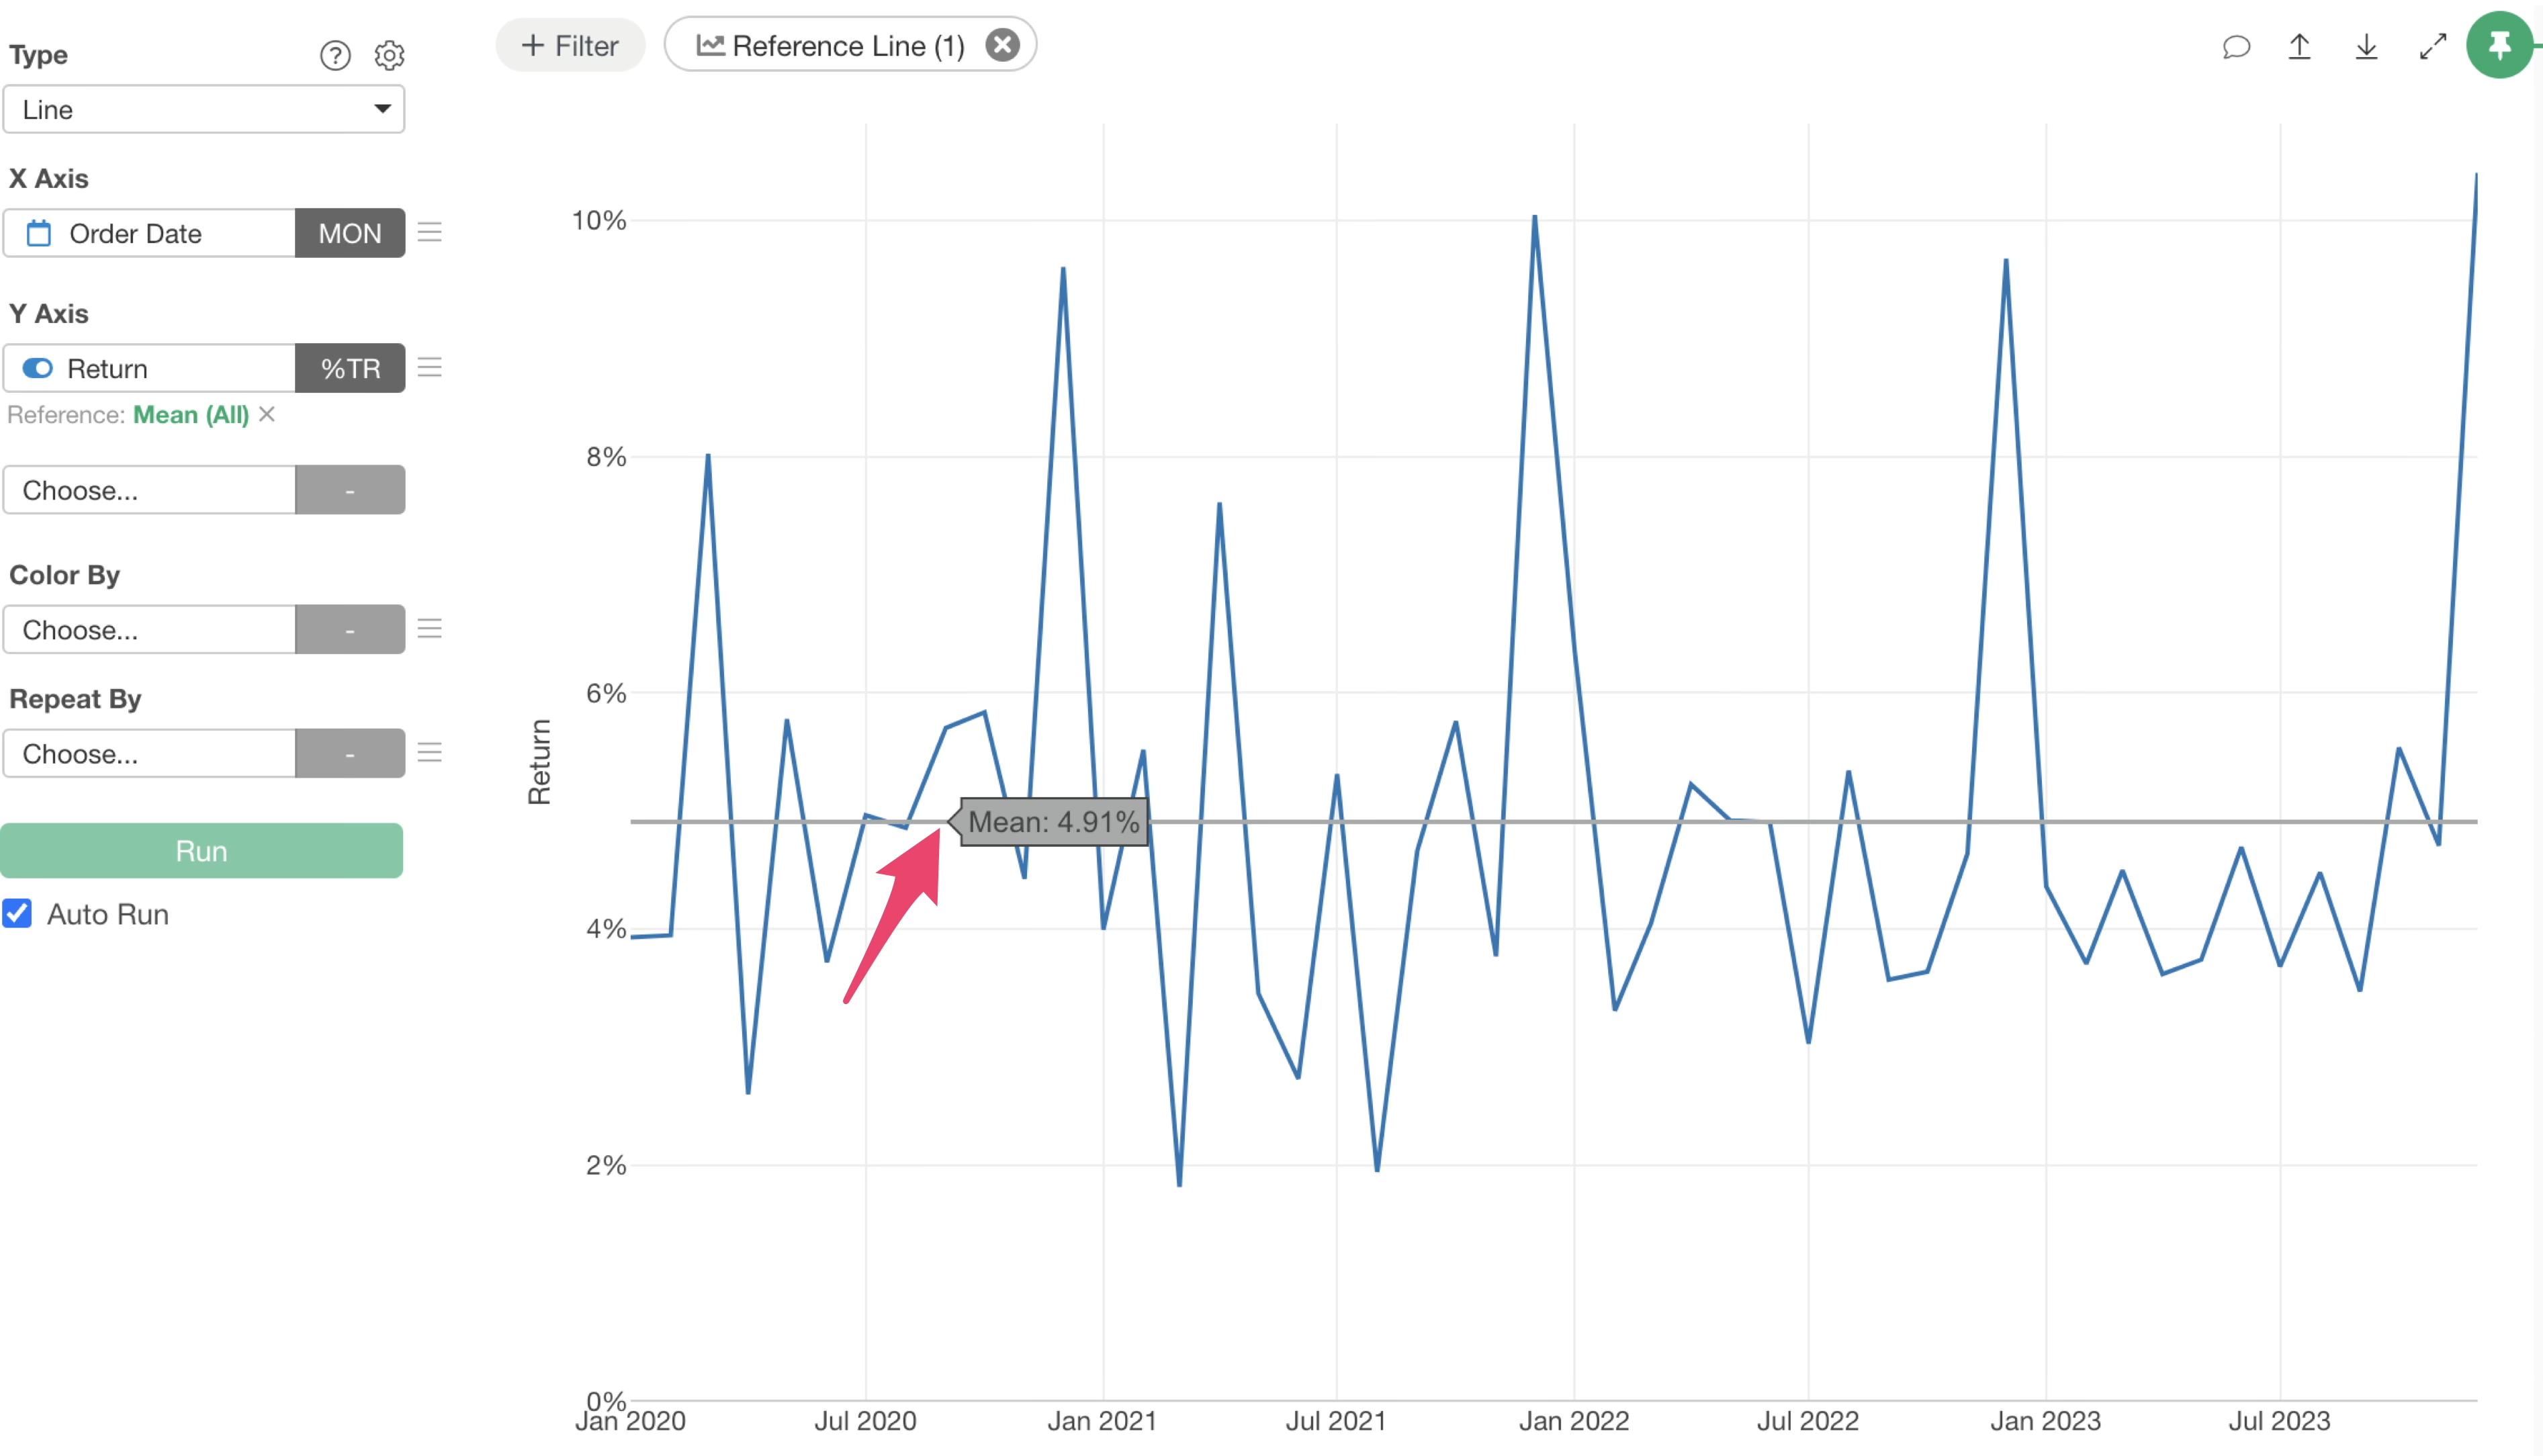
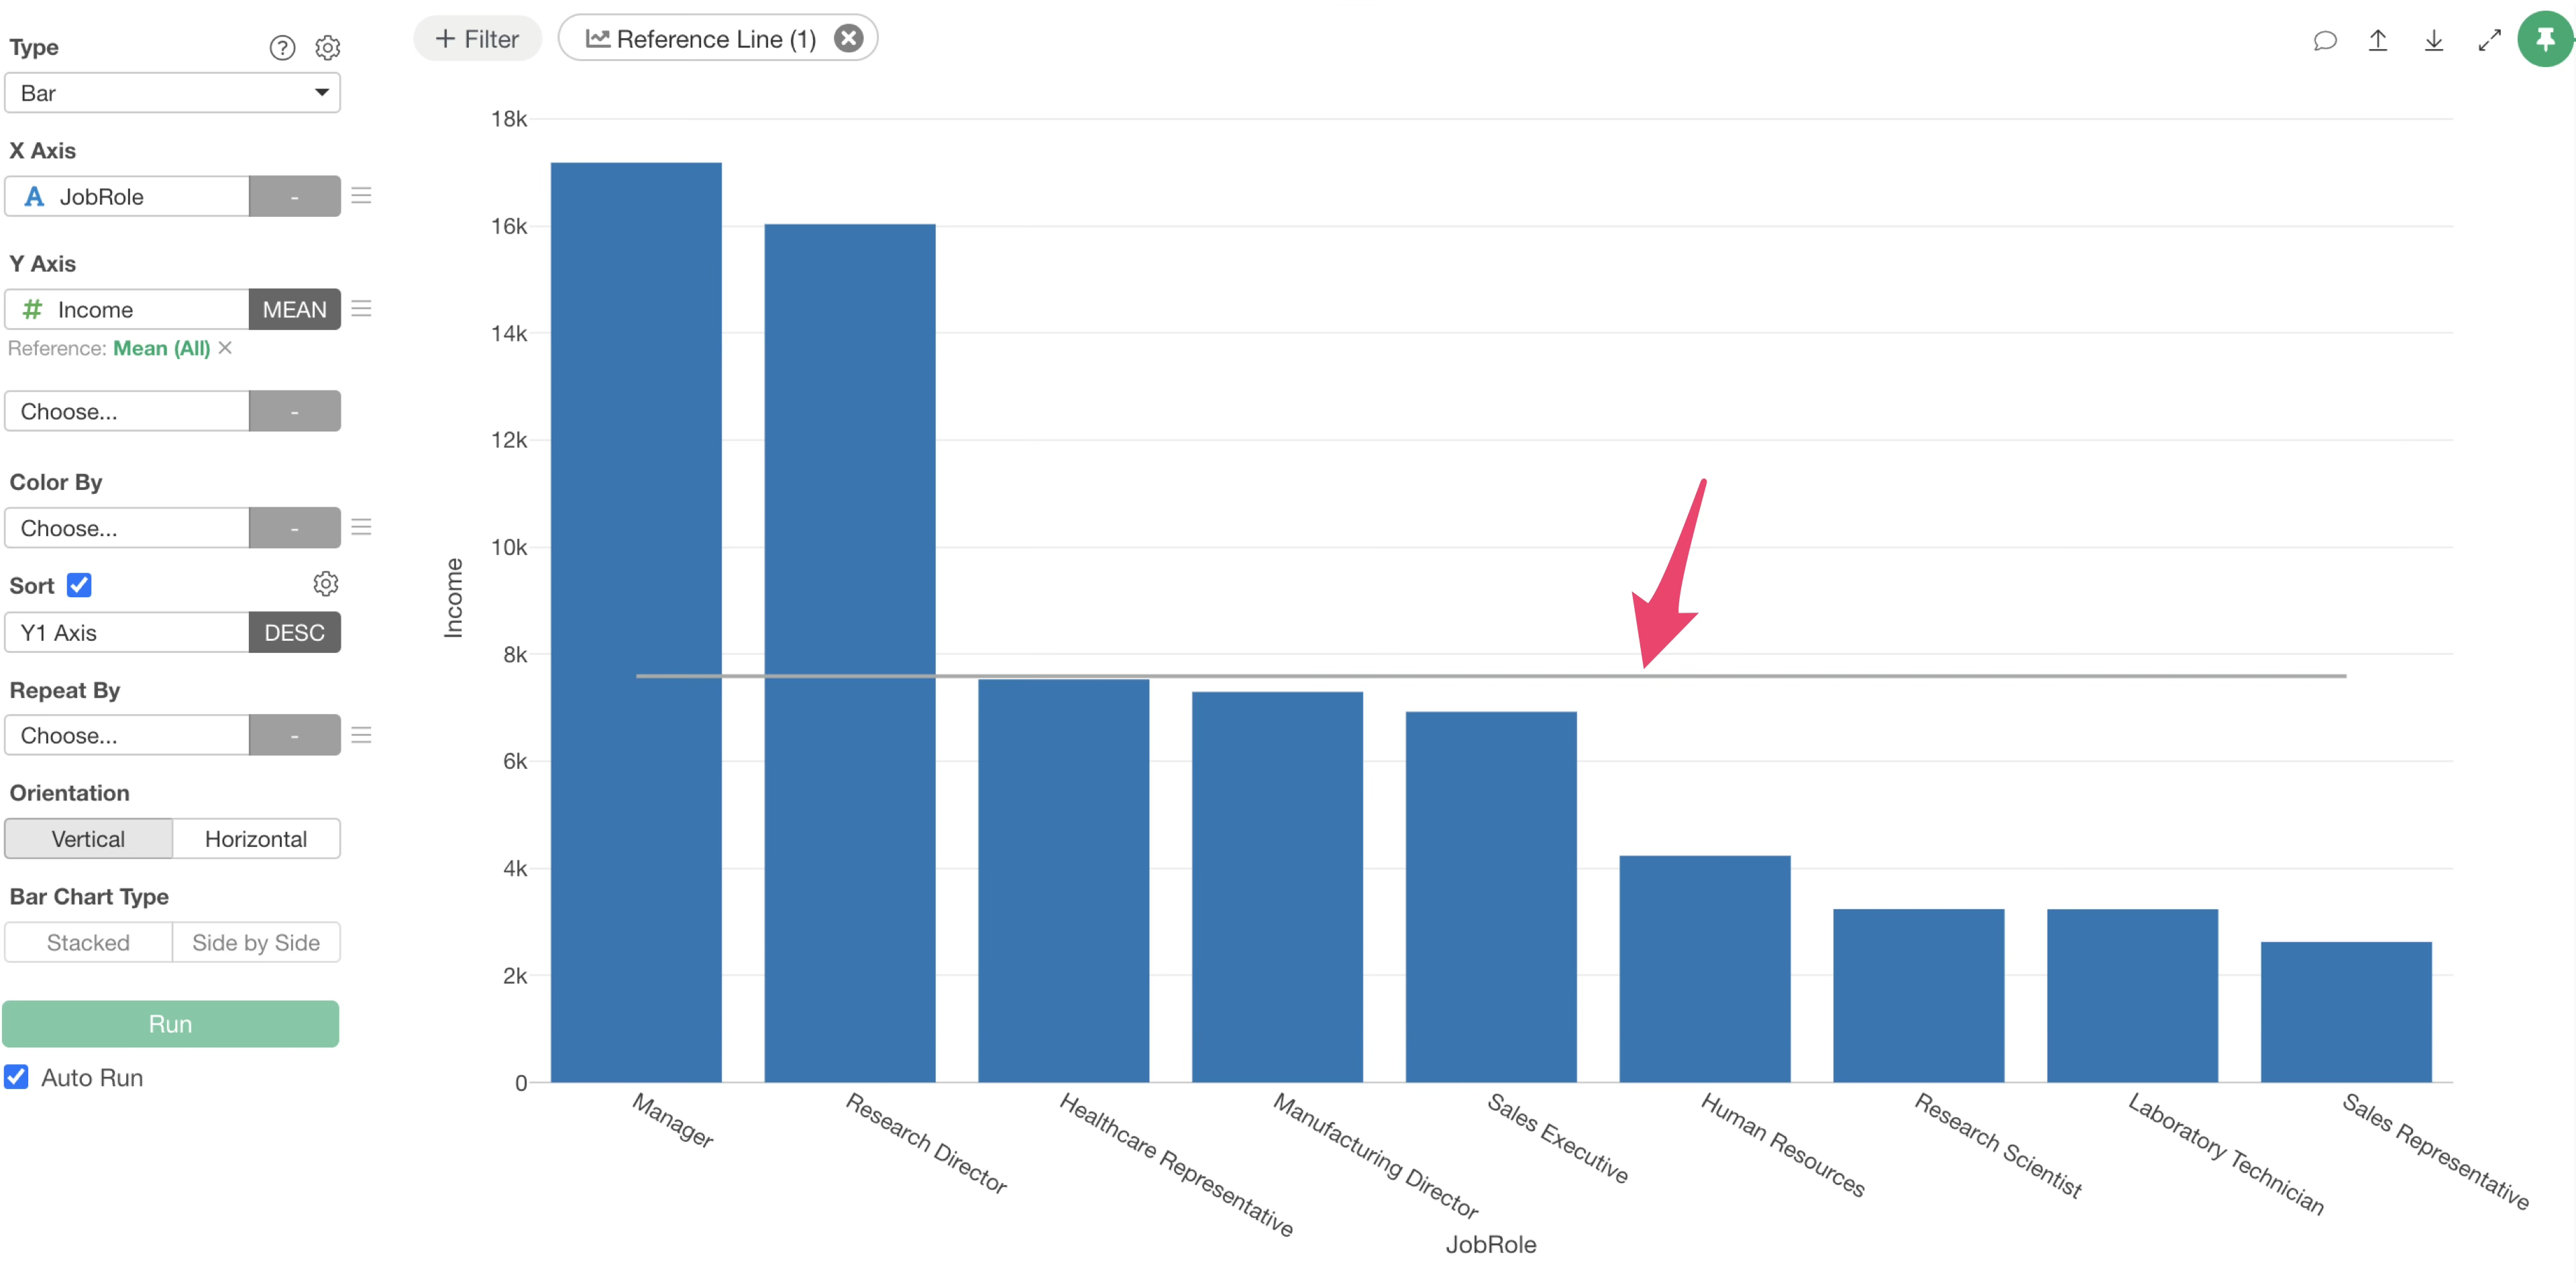
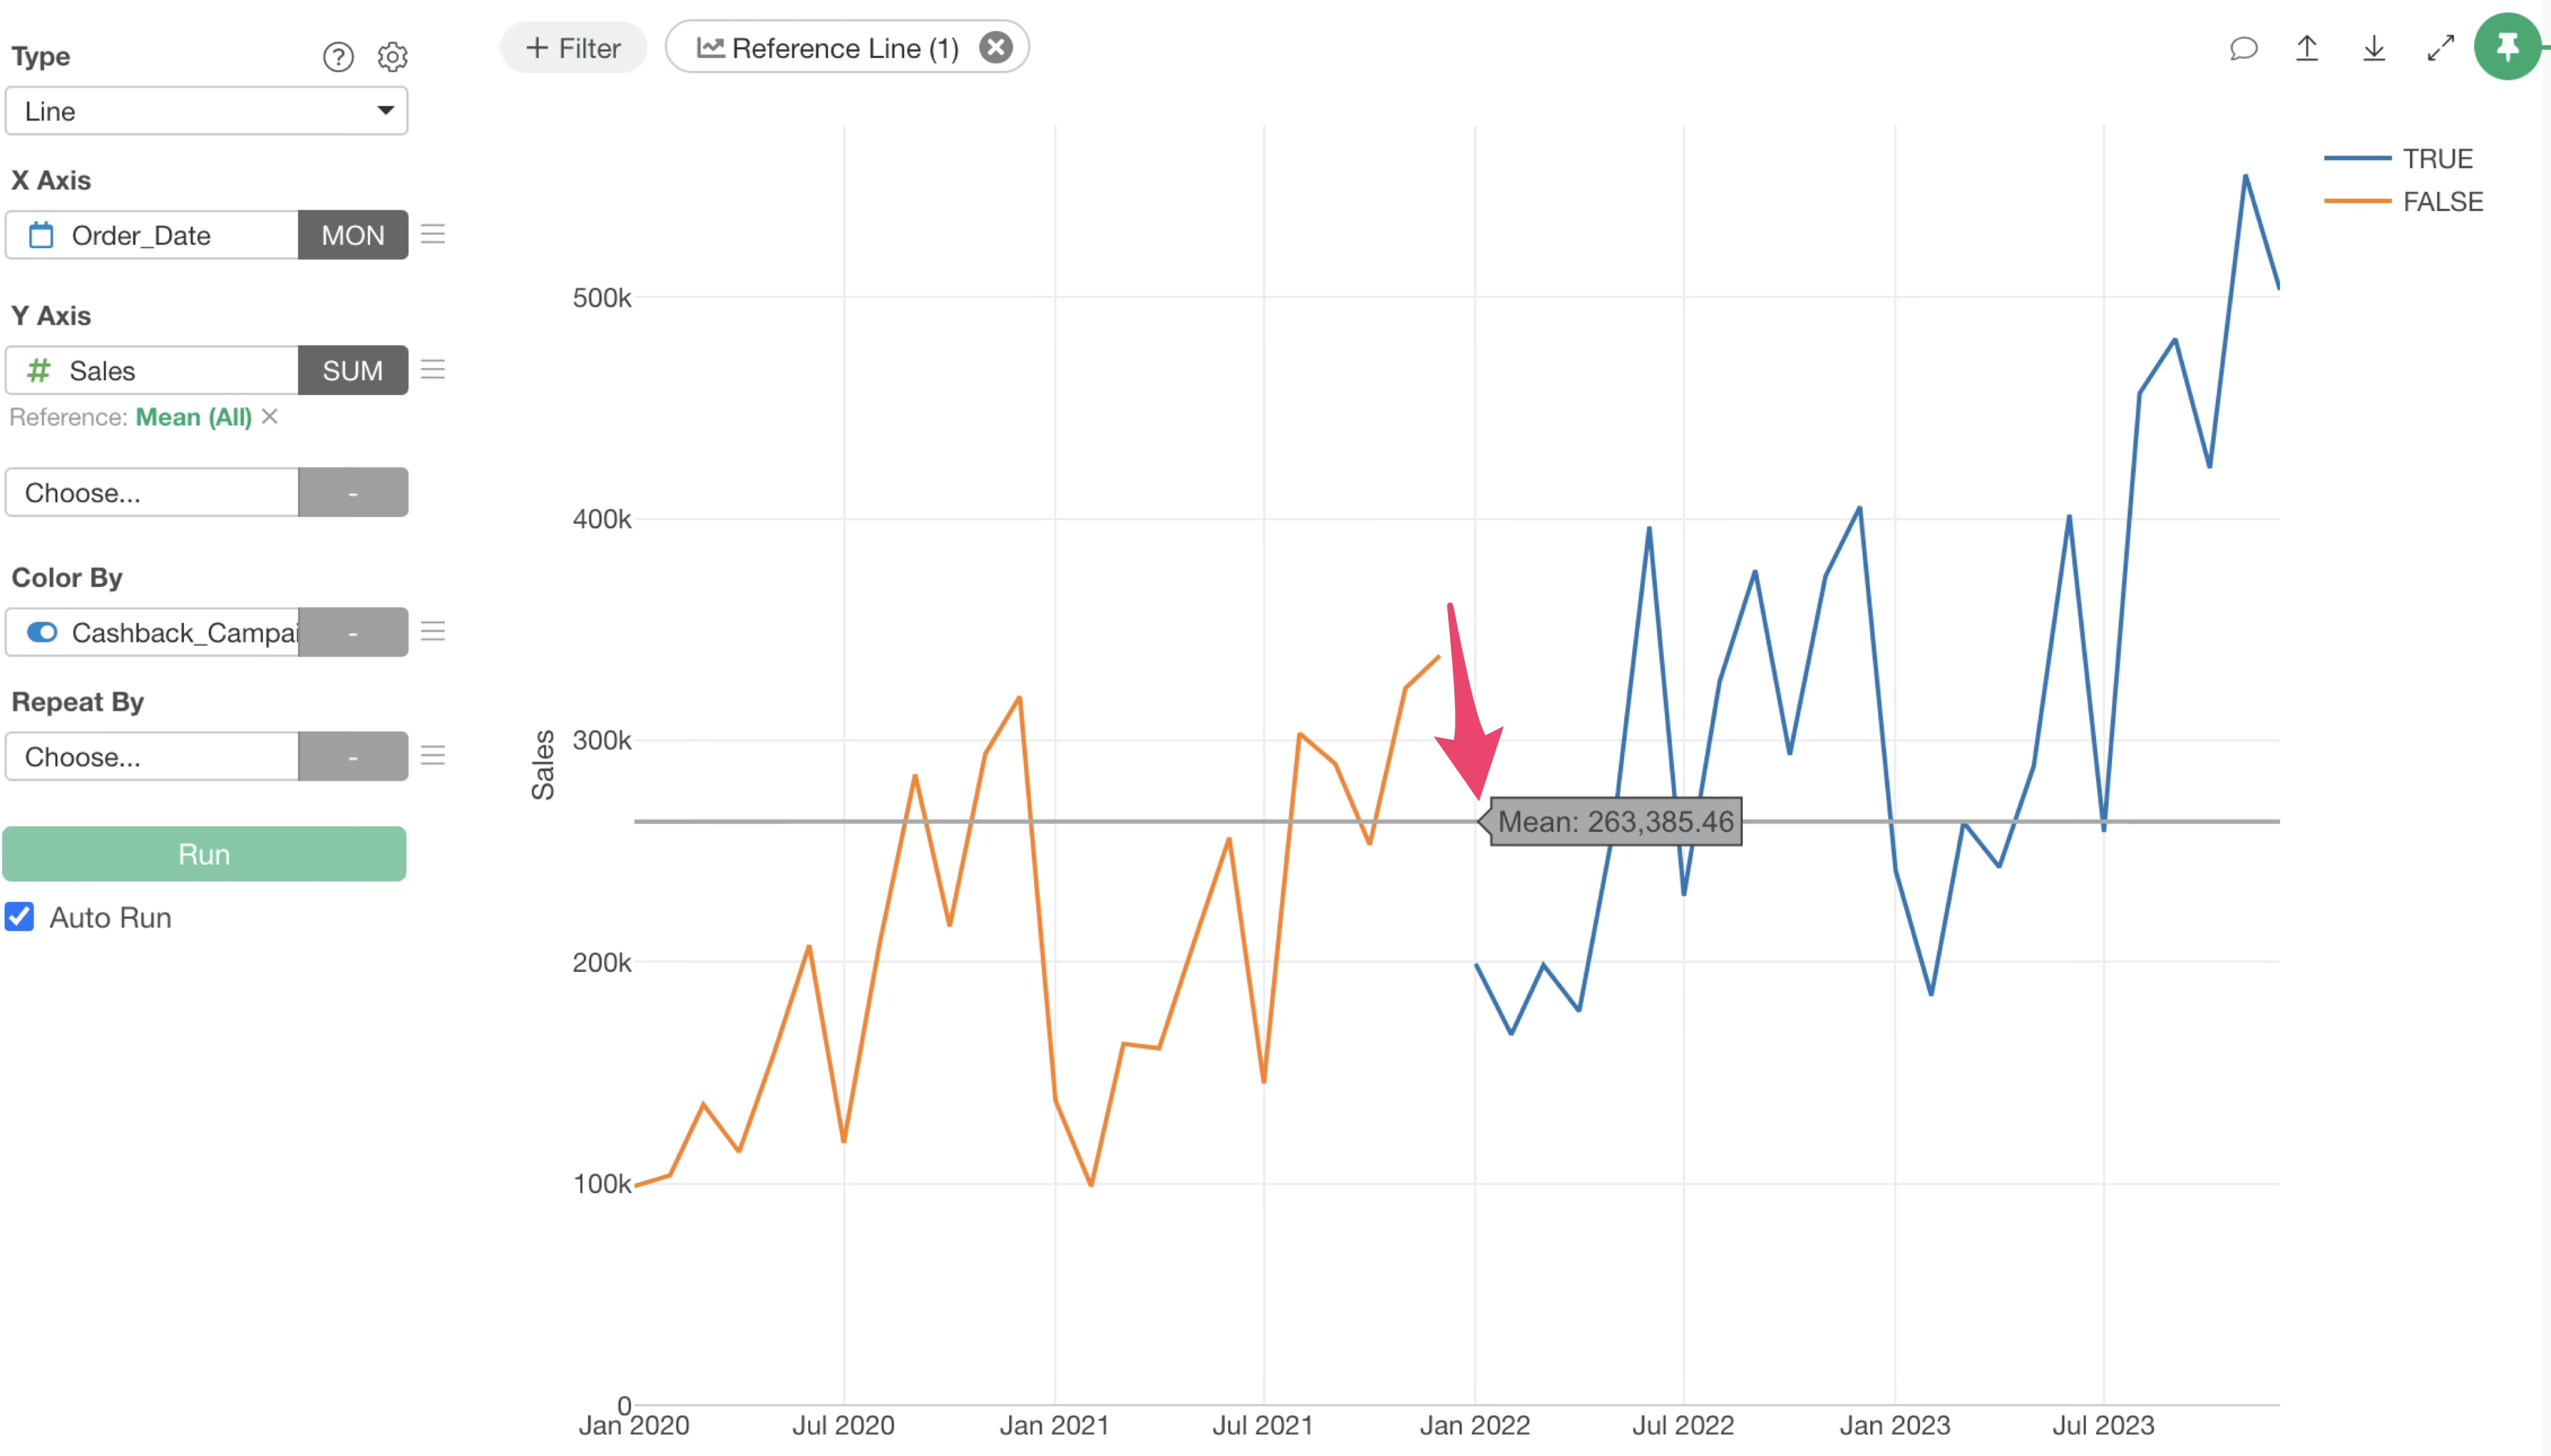
When you draw a reference line on the Y-axis, it appears horizontally on the chart.
For instance, in a bar chart visualizing metrics by group, you can draw an overall average line for all groups.
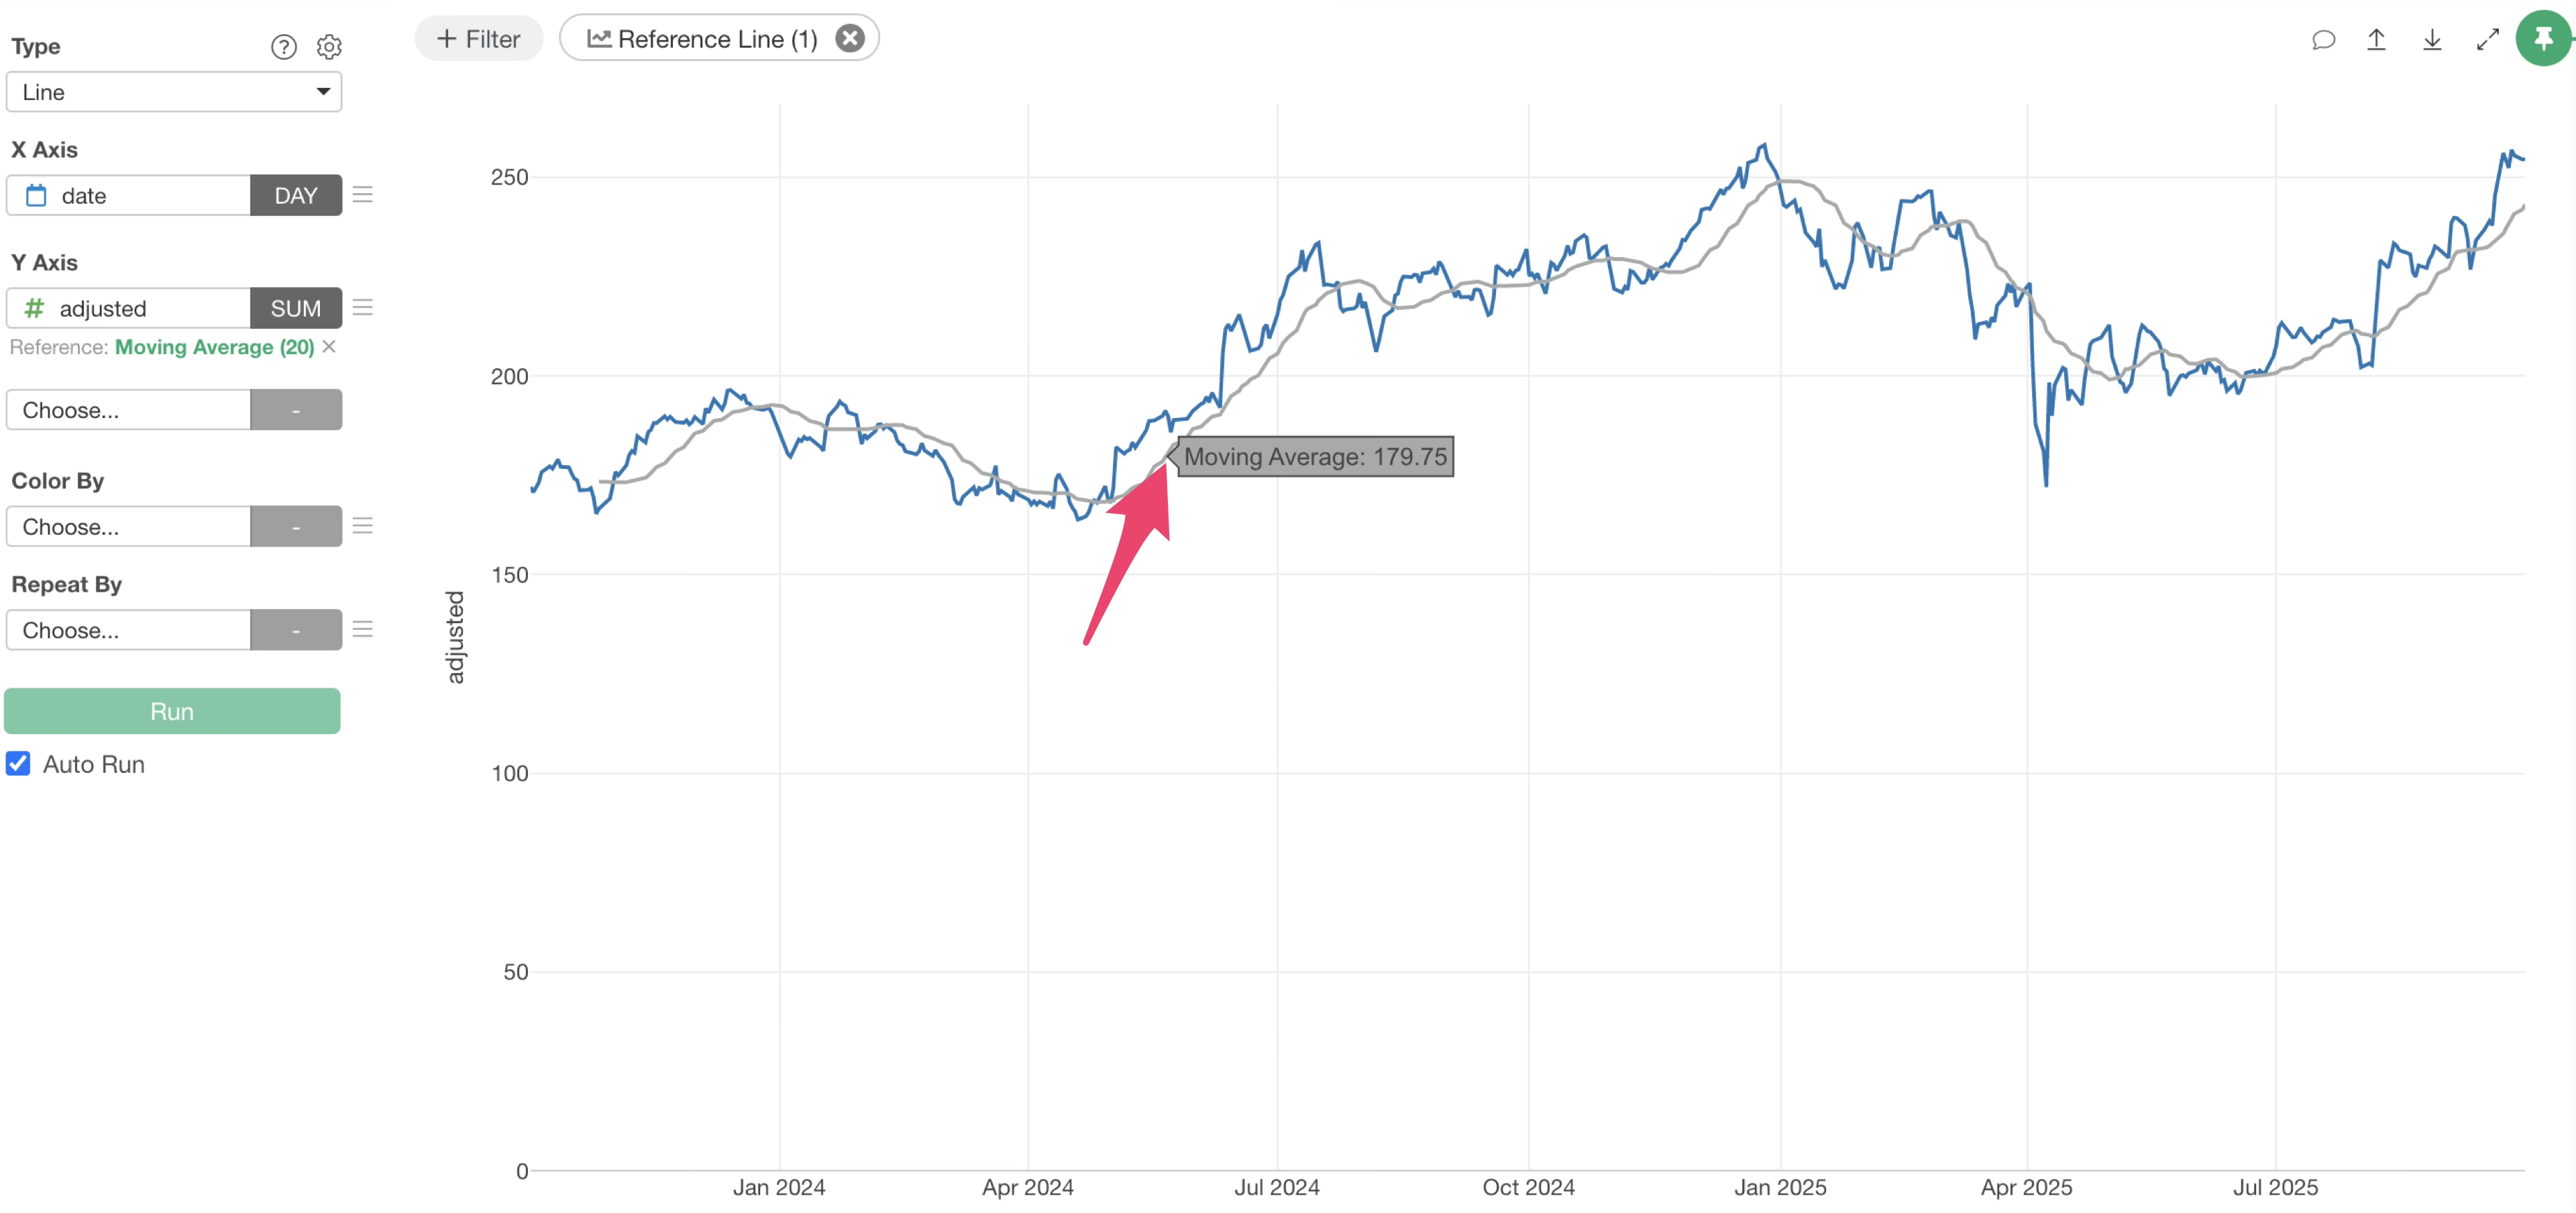
 You
can also set reference lines based on table calculations, such as a moving
average, rather than simple aggregate values like the mean.
You
can also set reference lines based on table calculations, such as a moving
average, rather than simple aggregate values like the mean.
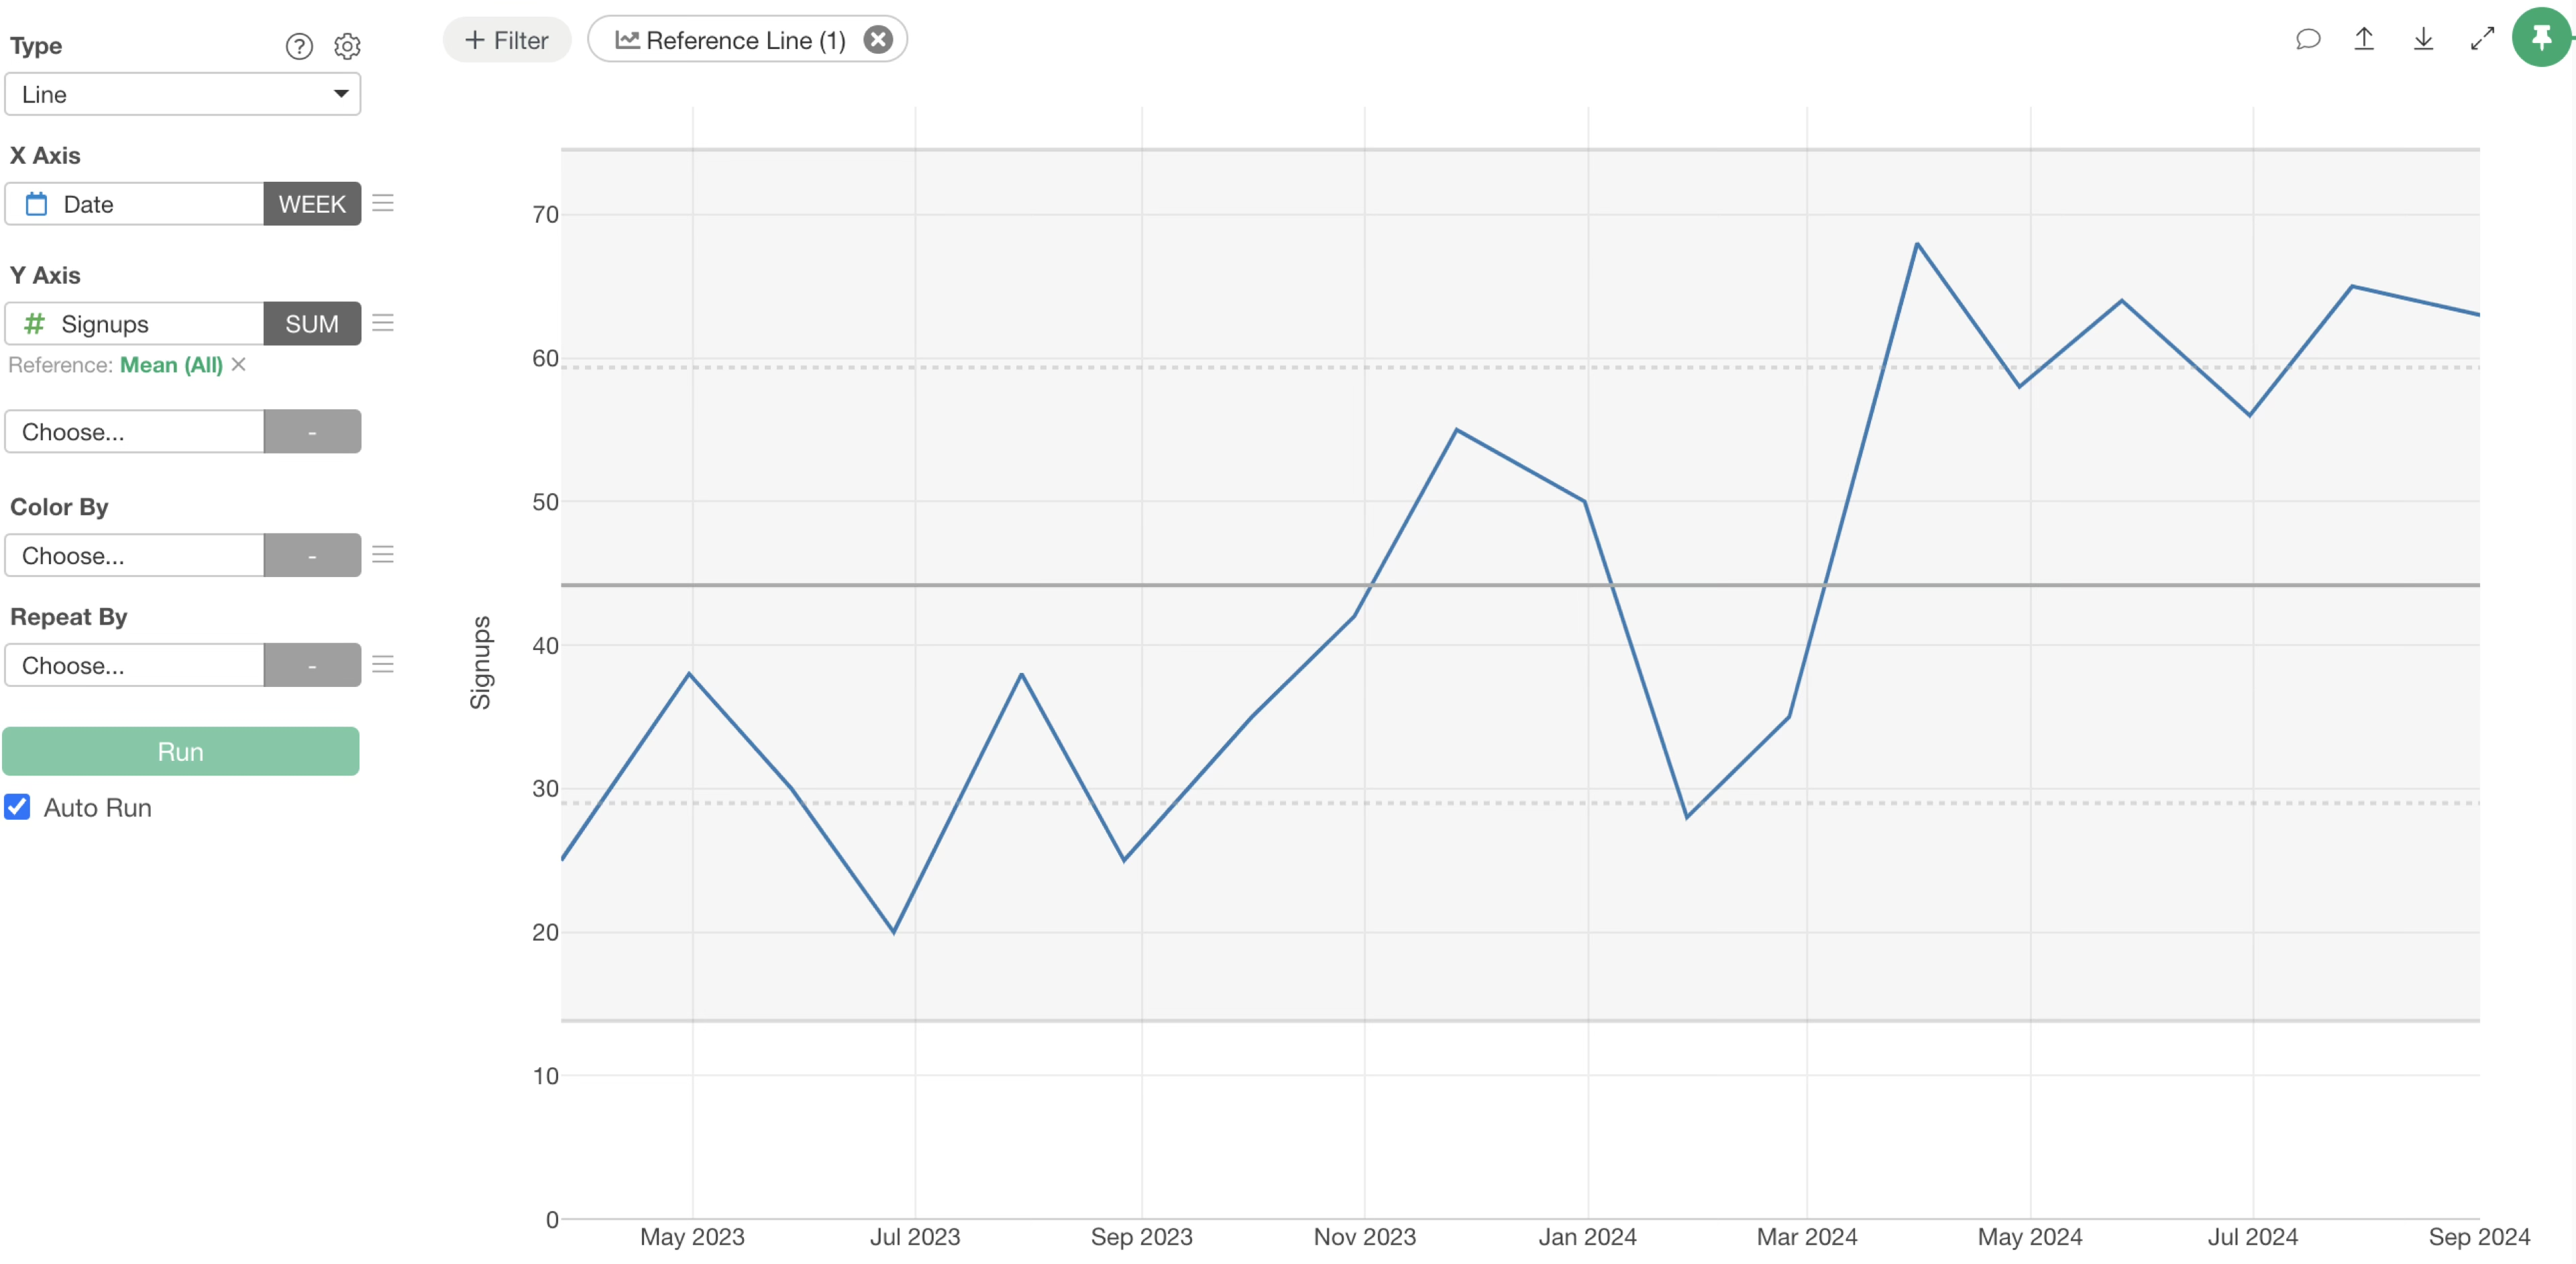
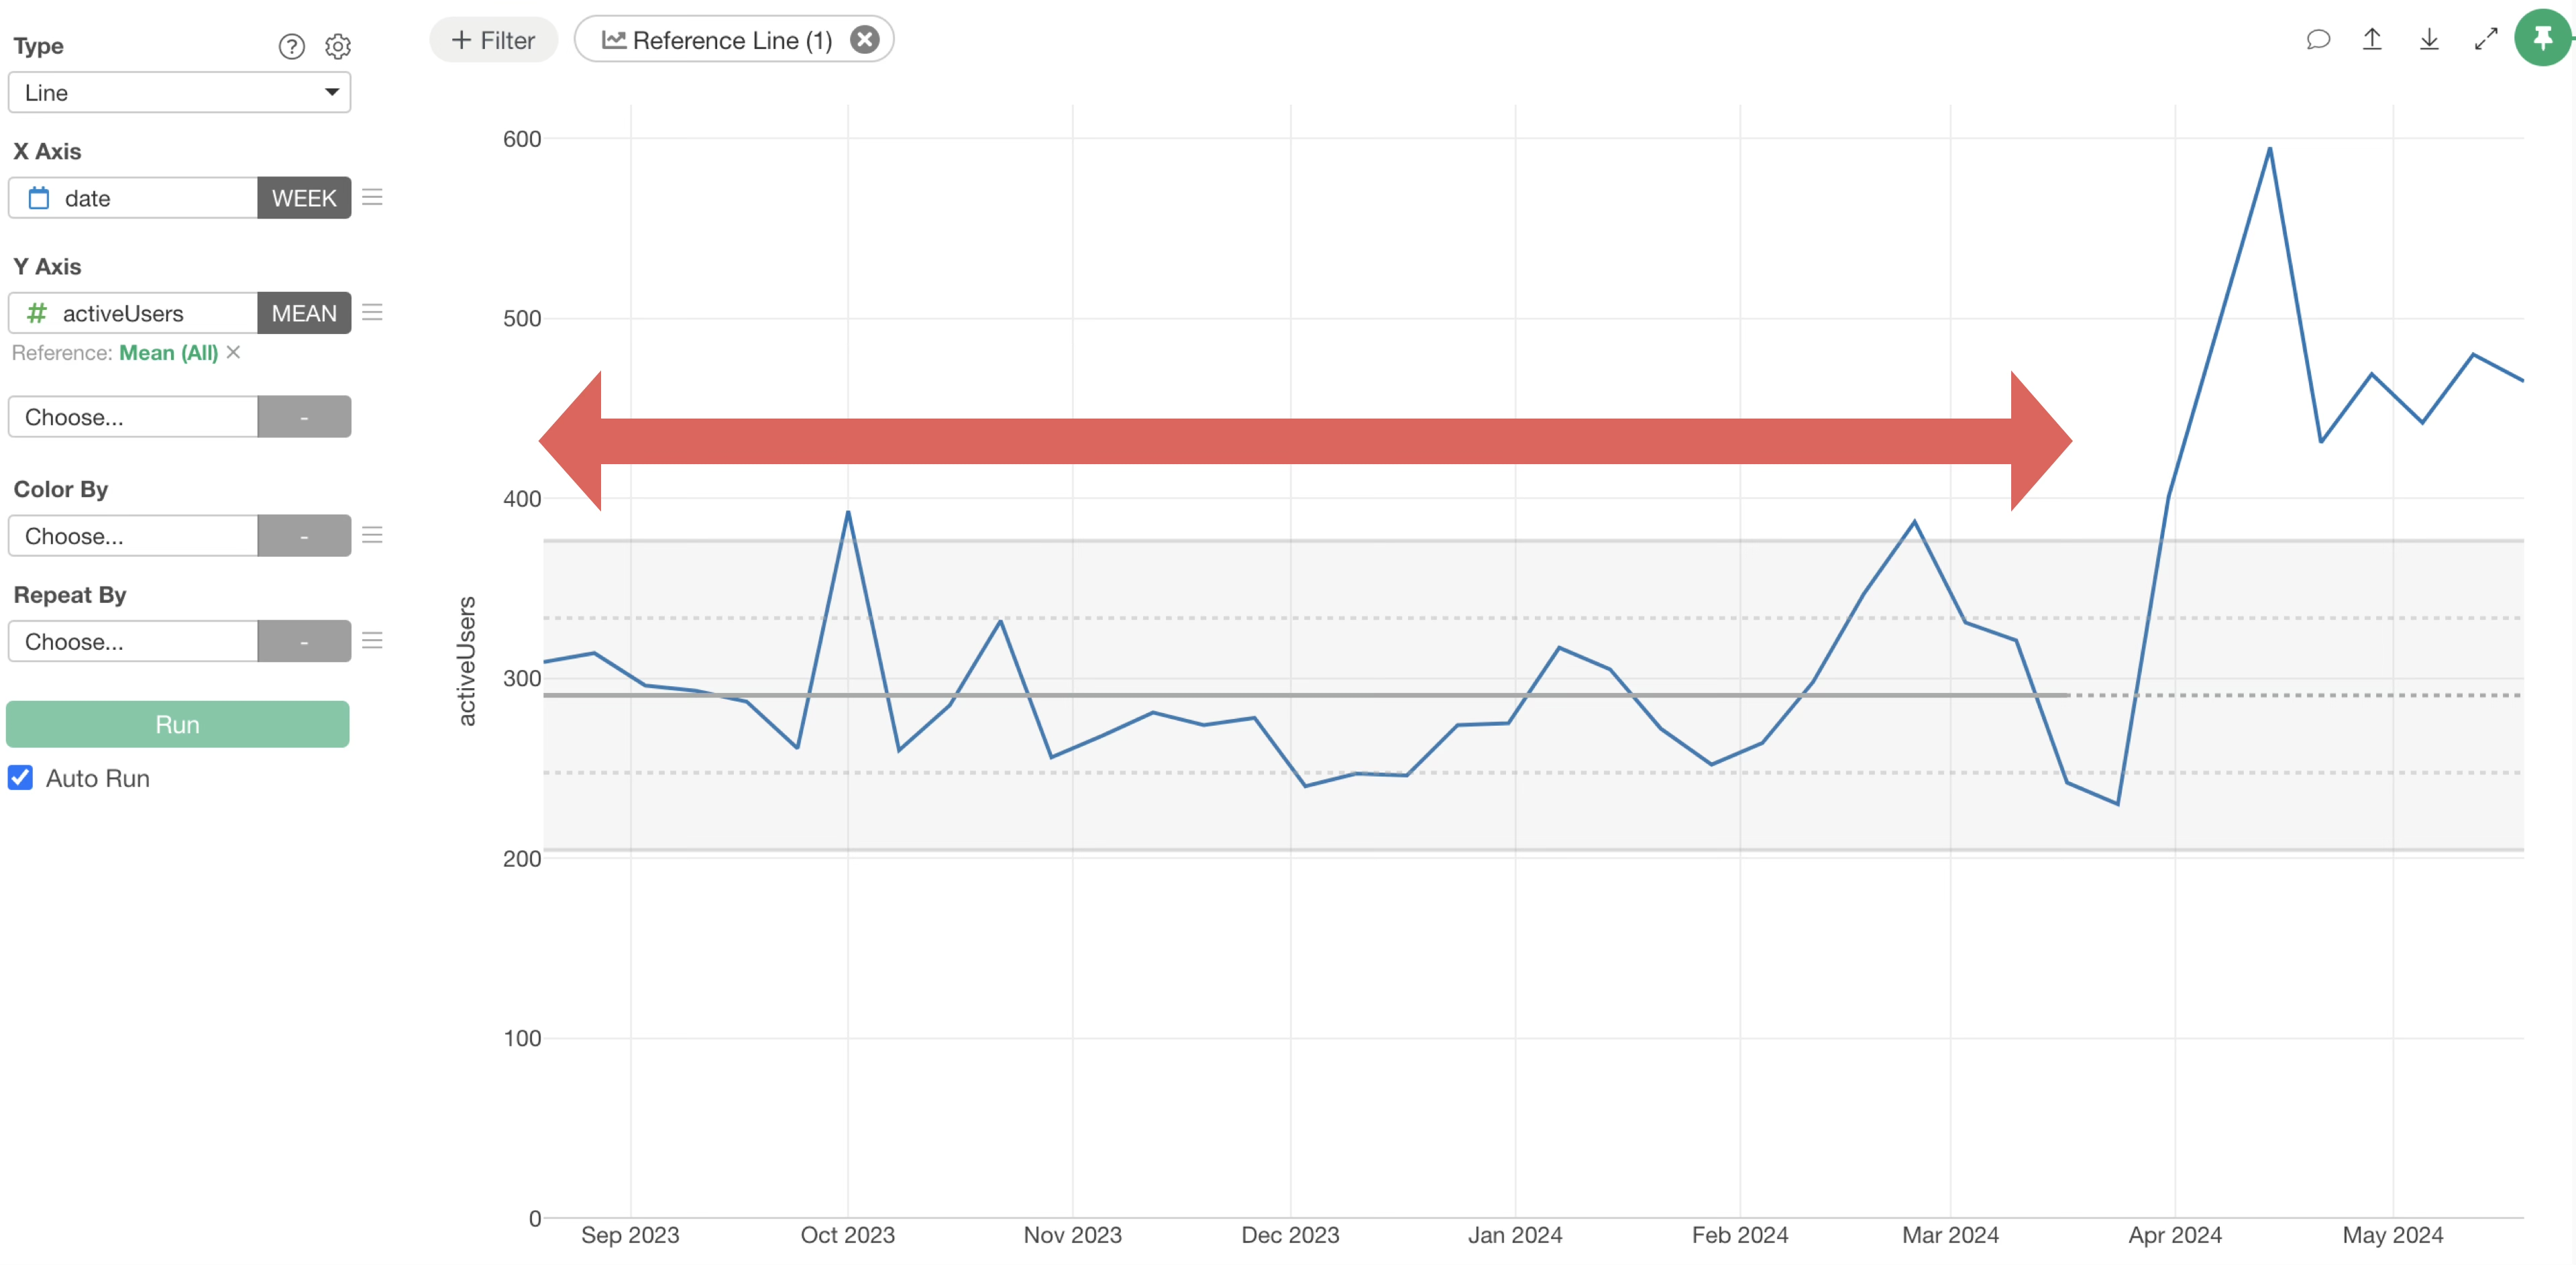
Additionally, you can draw an XmR chart from the reference line settings. This helps determine if variations in time-series data are standard fluctuations or significant signals.
Specifying Base Data Range
When drawing reference lines on charts visualizing time-series data, you might want to use data from a specific period.
In such cases, you can draw reference lines using data from a specified range within the reference line settings.
Clicking the reference line settings button opens the reference line settings dialog.
Once the dialog appears, click on the “Base Data Range” option.
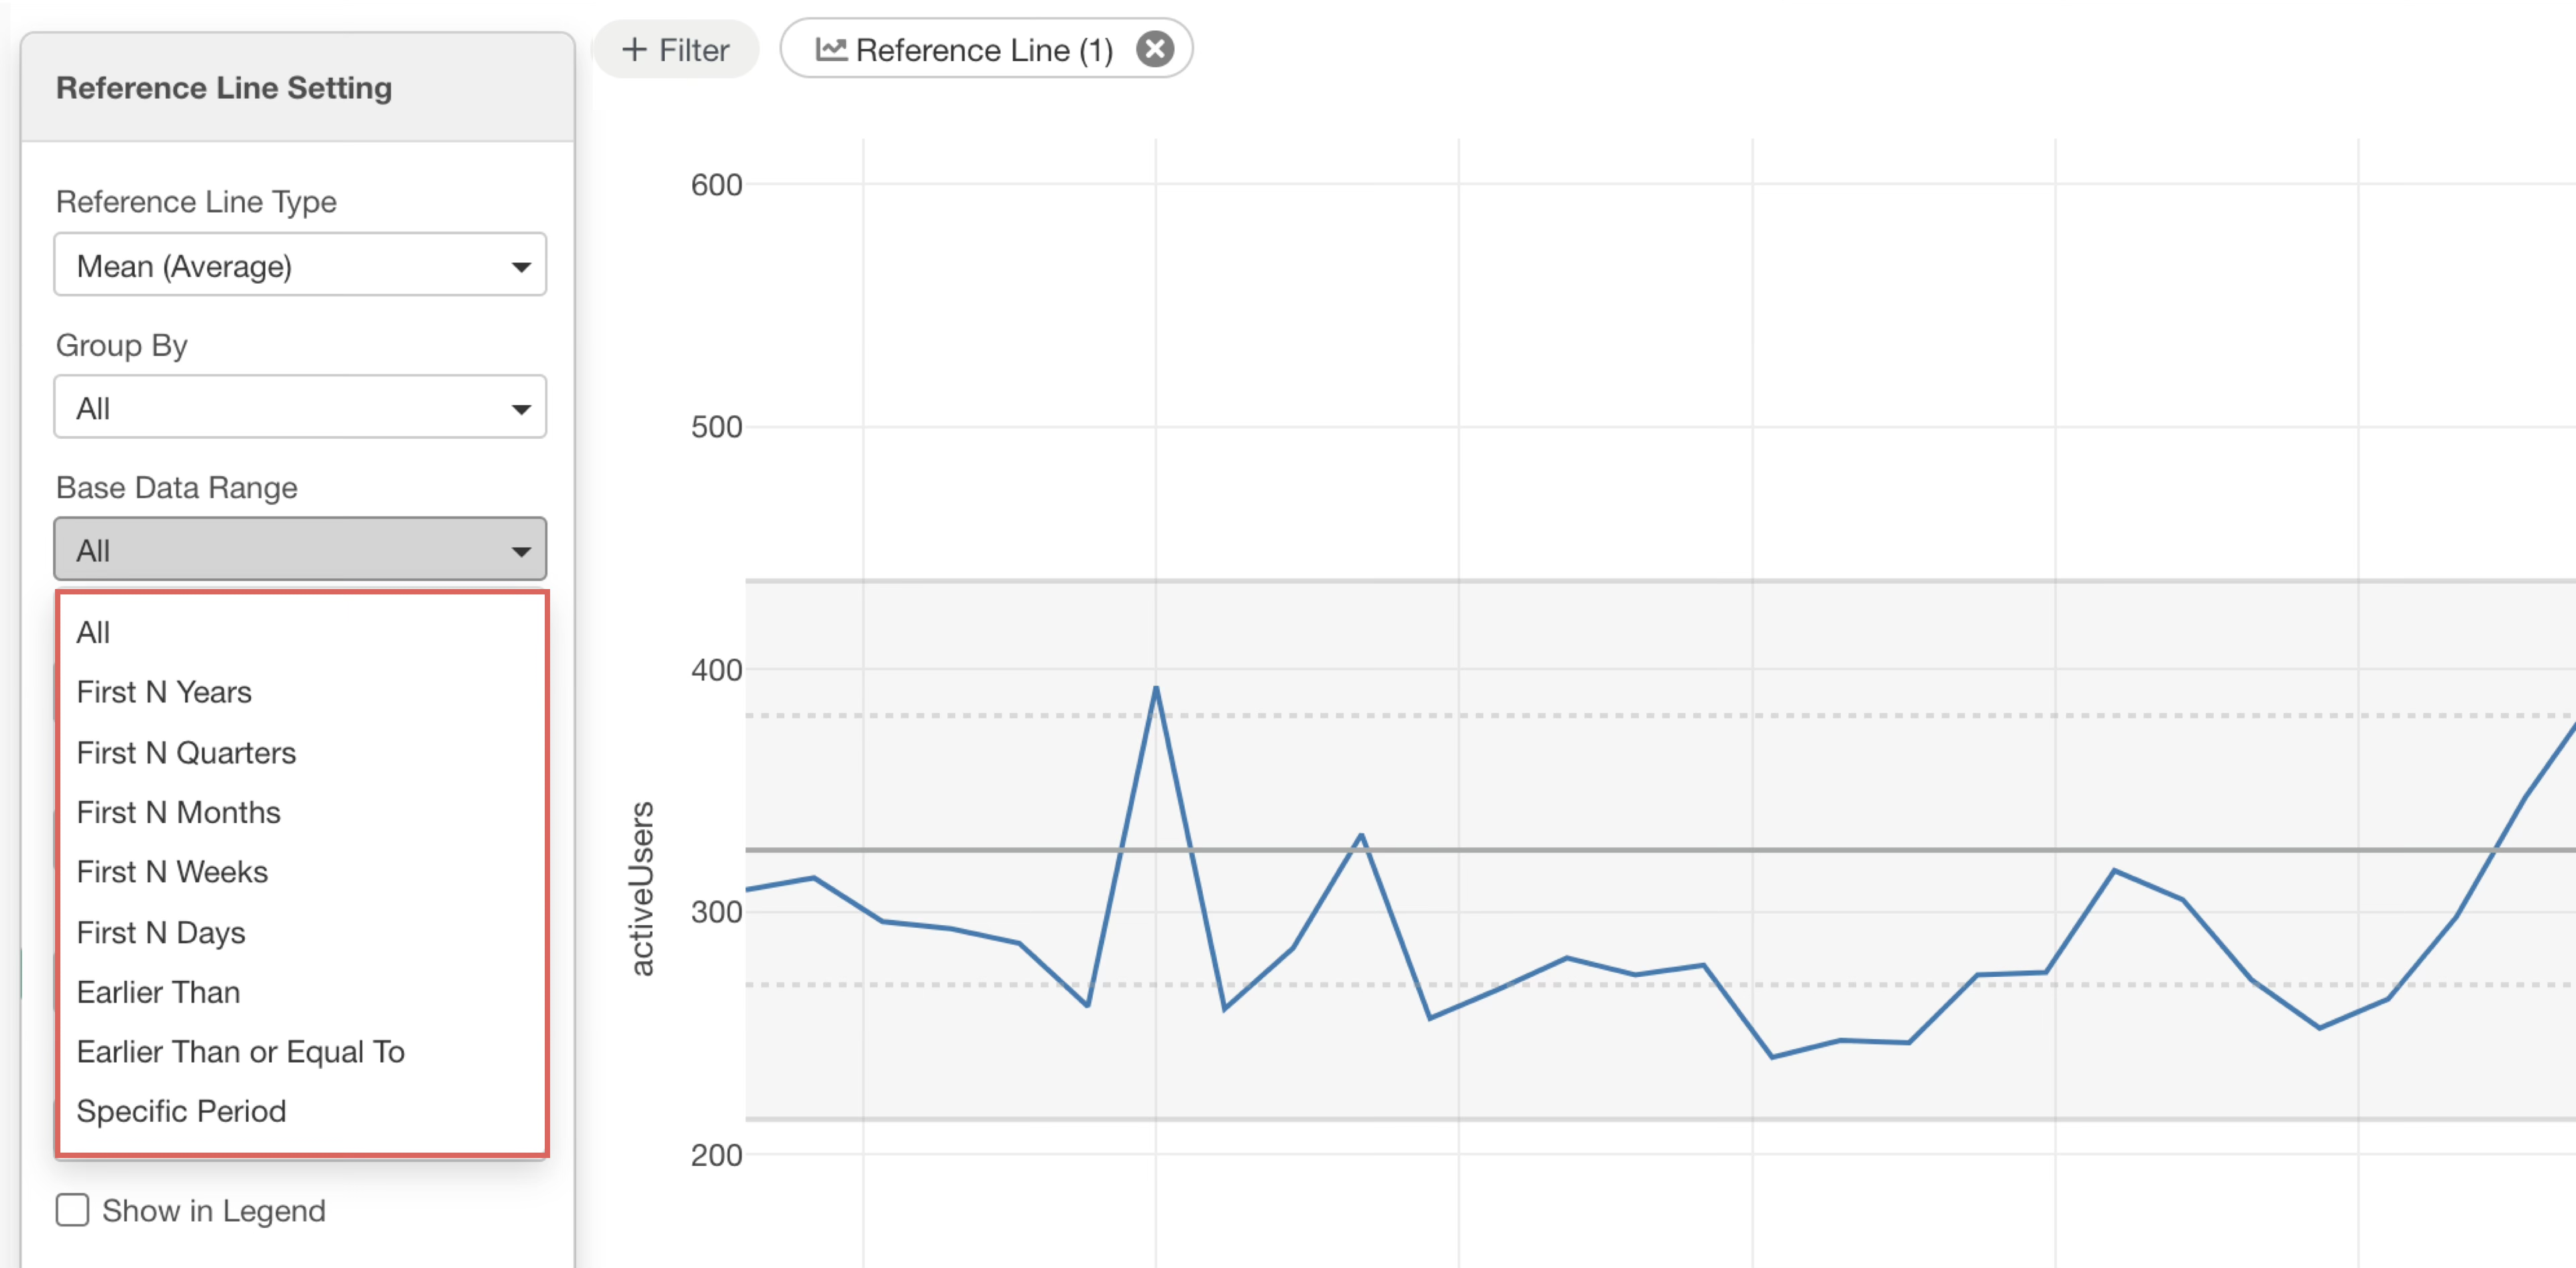
This displays the following options for specifying the base data range. The default value is “All.”
- All
- First N Years
- First N Quarters
- First N Months
- First N Weeks
- First N Days
- Earlier Than
- Earlier Than or Equal To
- Specific Period
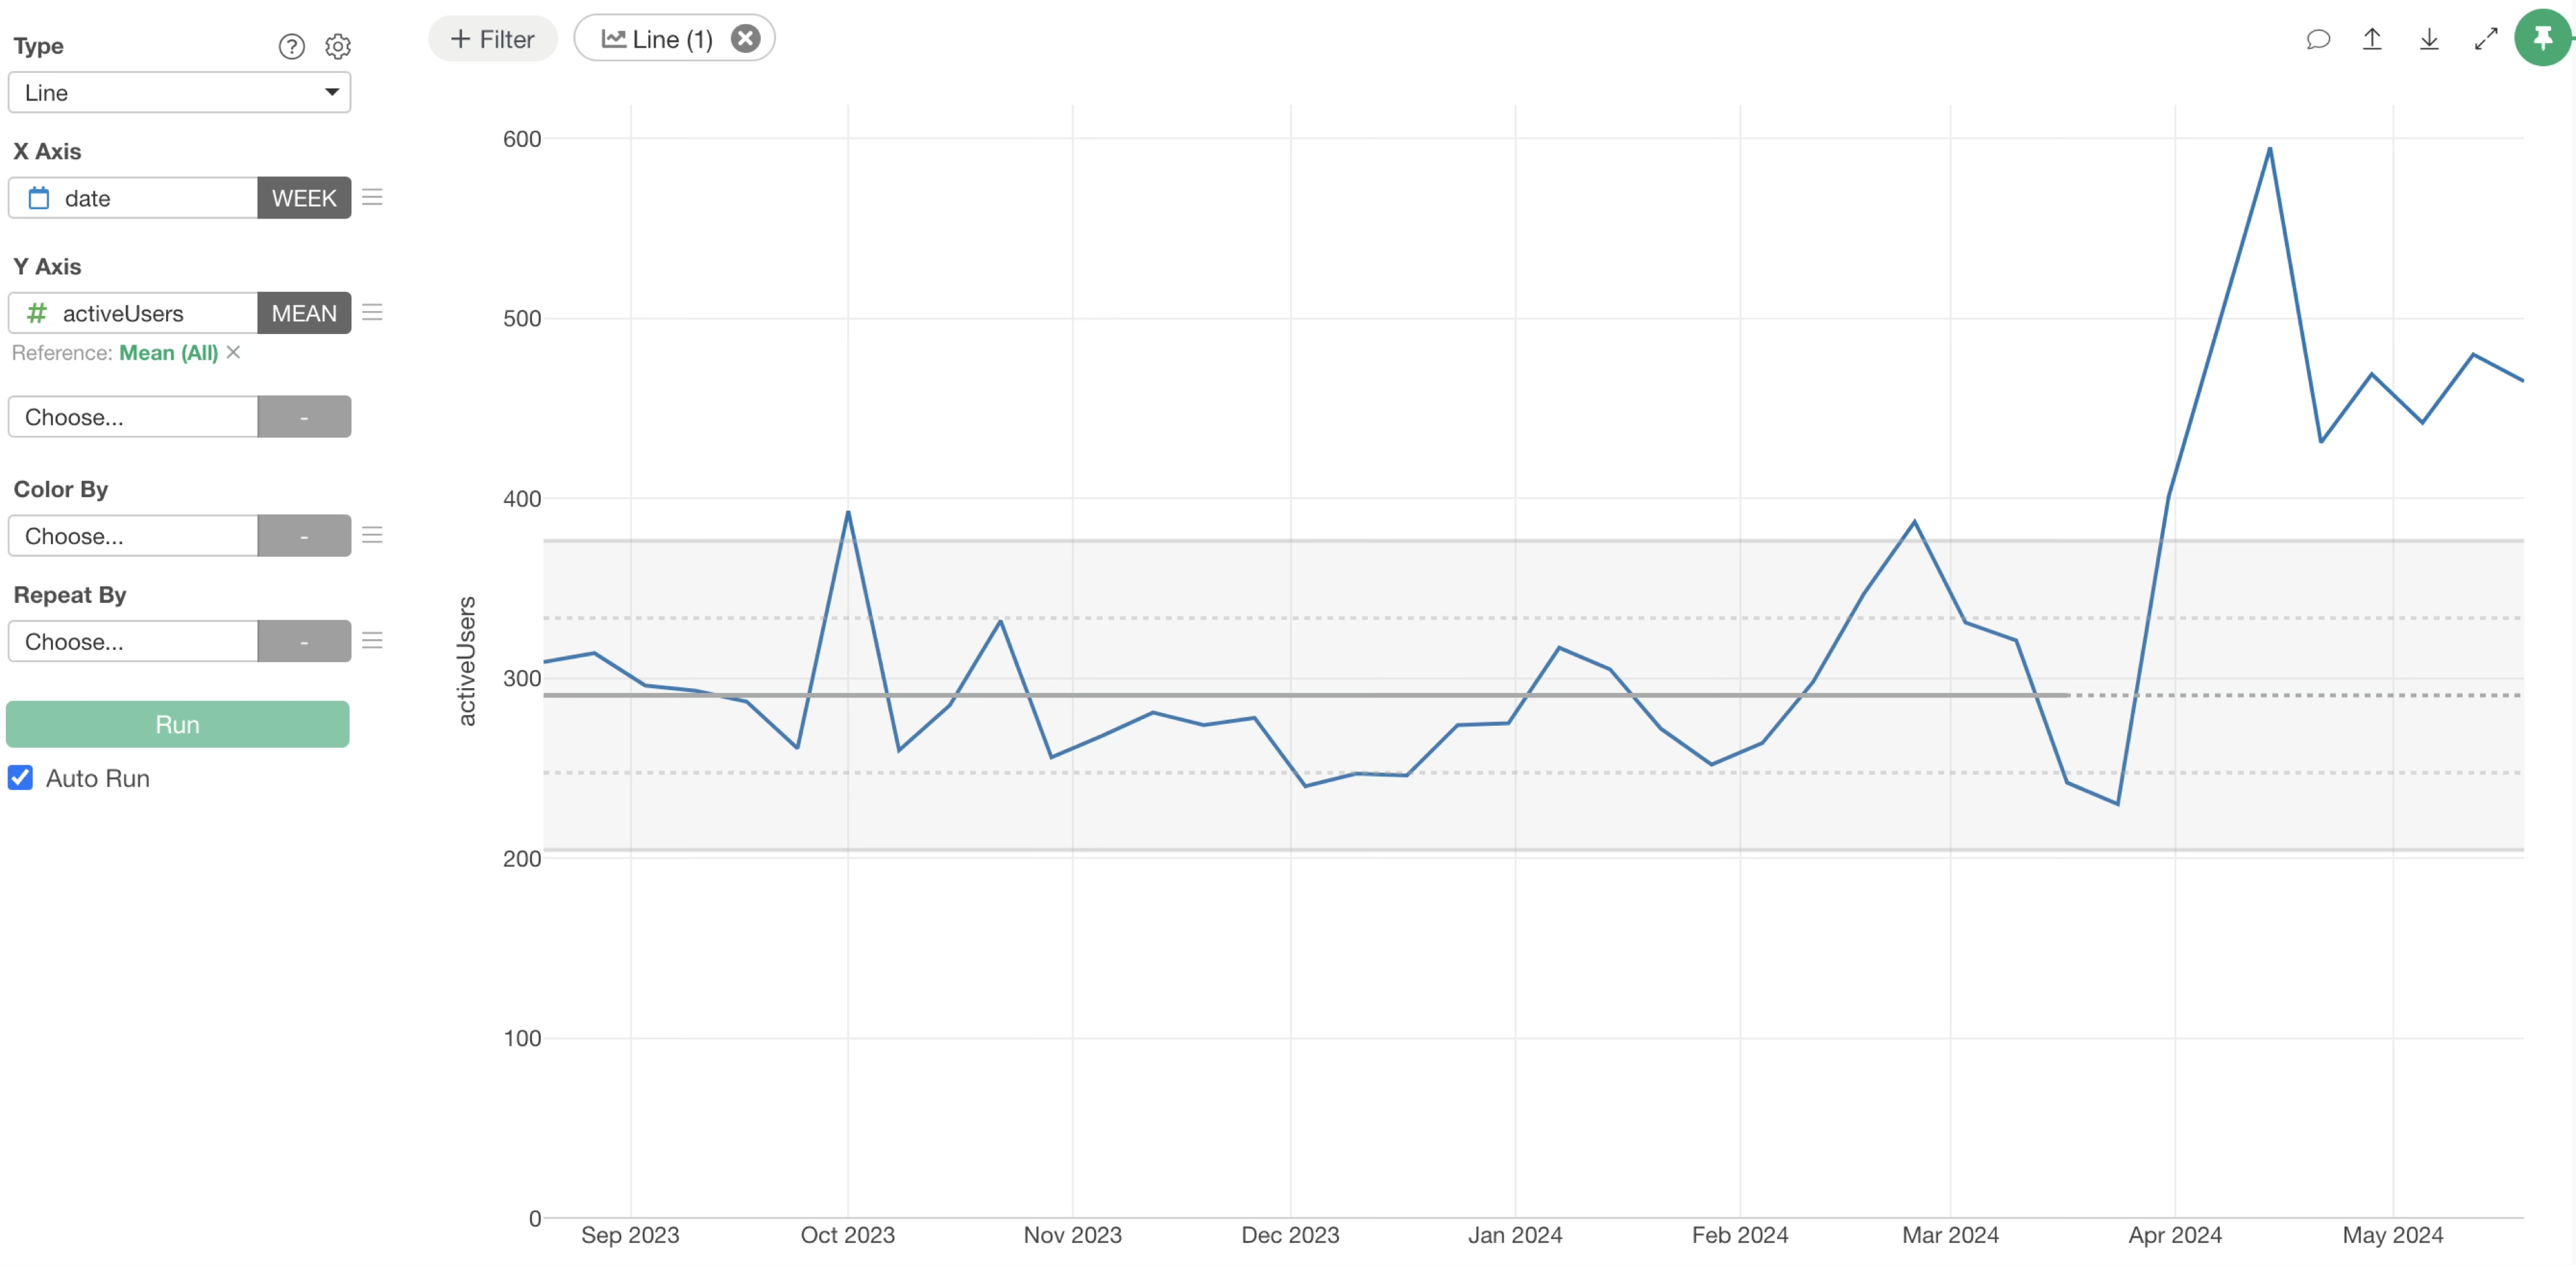
For example, if you specify “First 1 Year,” the reference line will be drawn using data from that initial year. For periods not used in the reference line calculation, the line will appear as a dotted line.
Drawing Reference Lines per Group
Exploratory allows you to visualize charts divided into groups using features like Color by and Repeat By.
Color By
Repeat By
You can also draw reference lines for each group. Here’s how to draw reference lines per group.
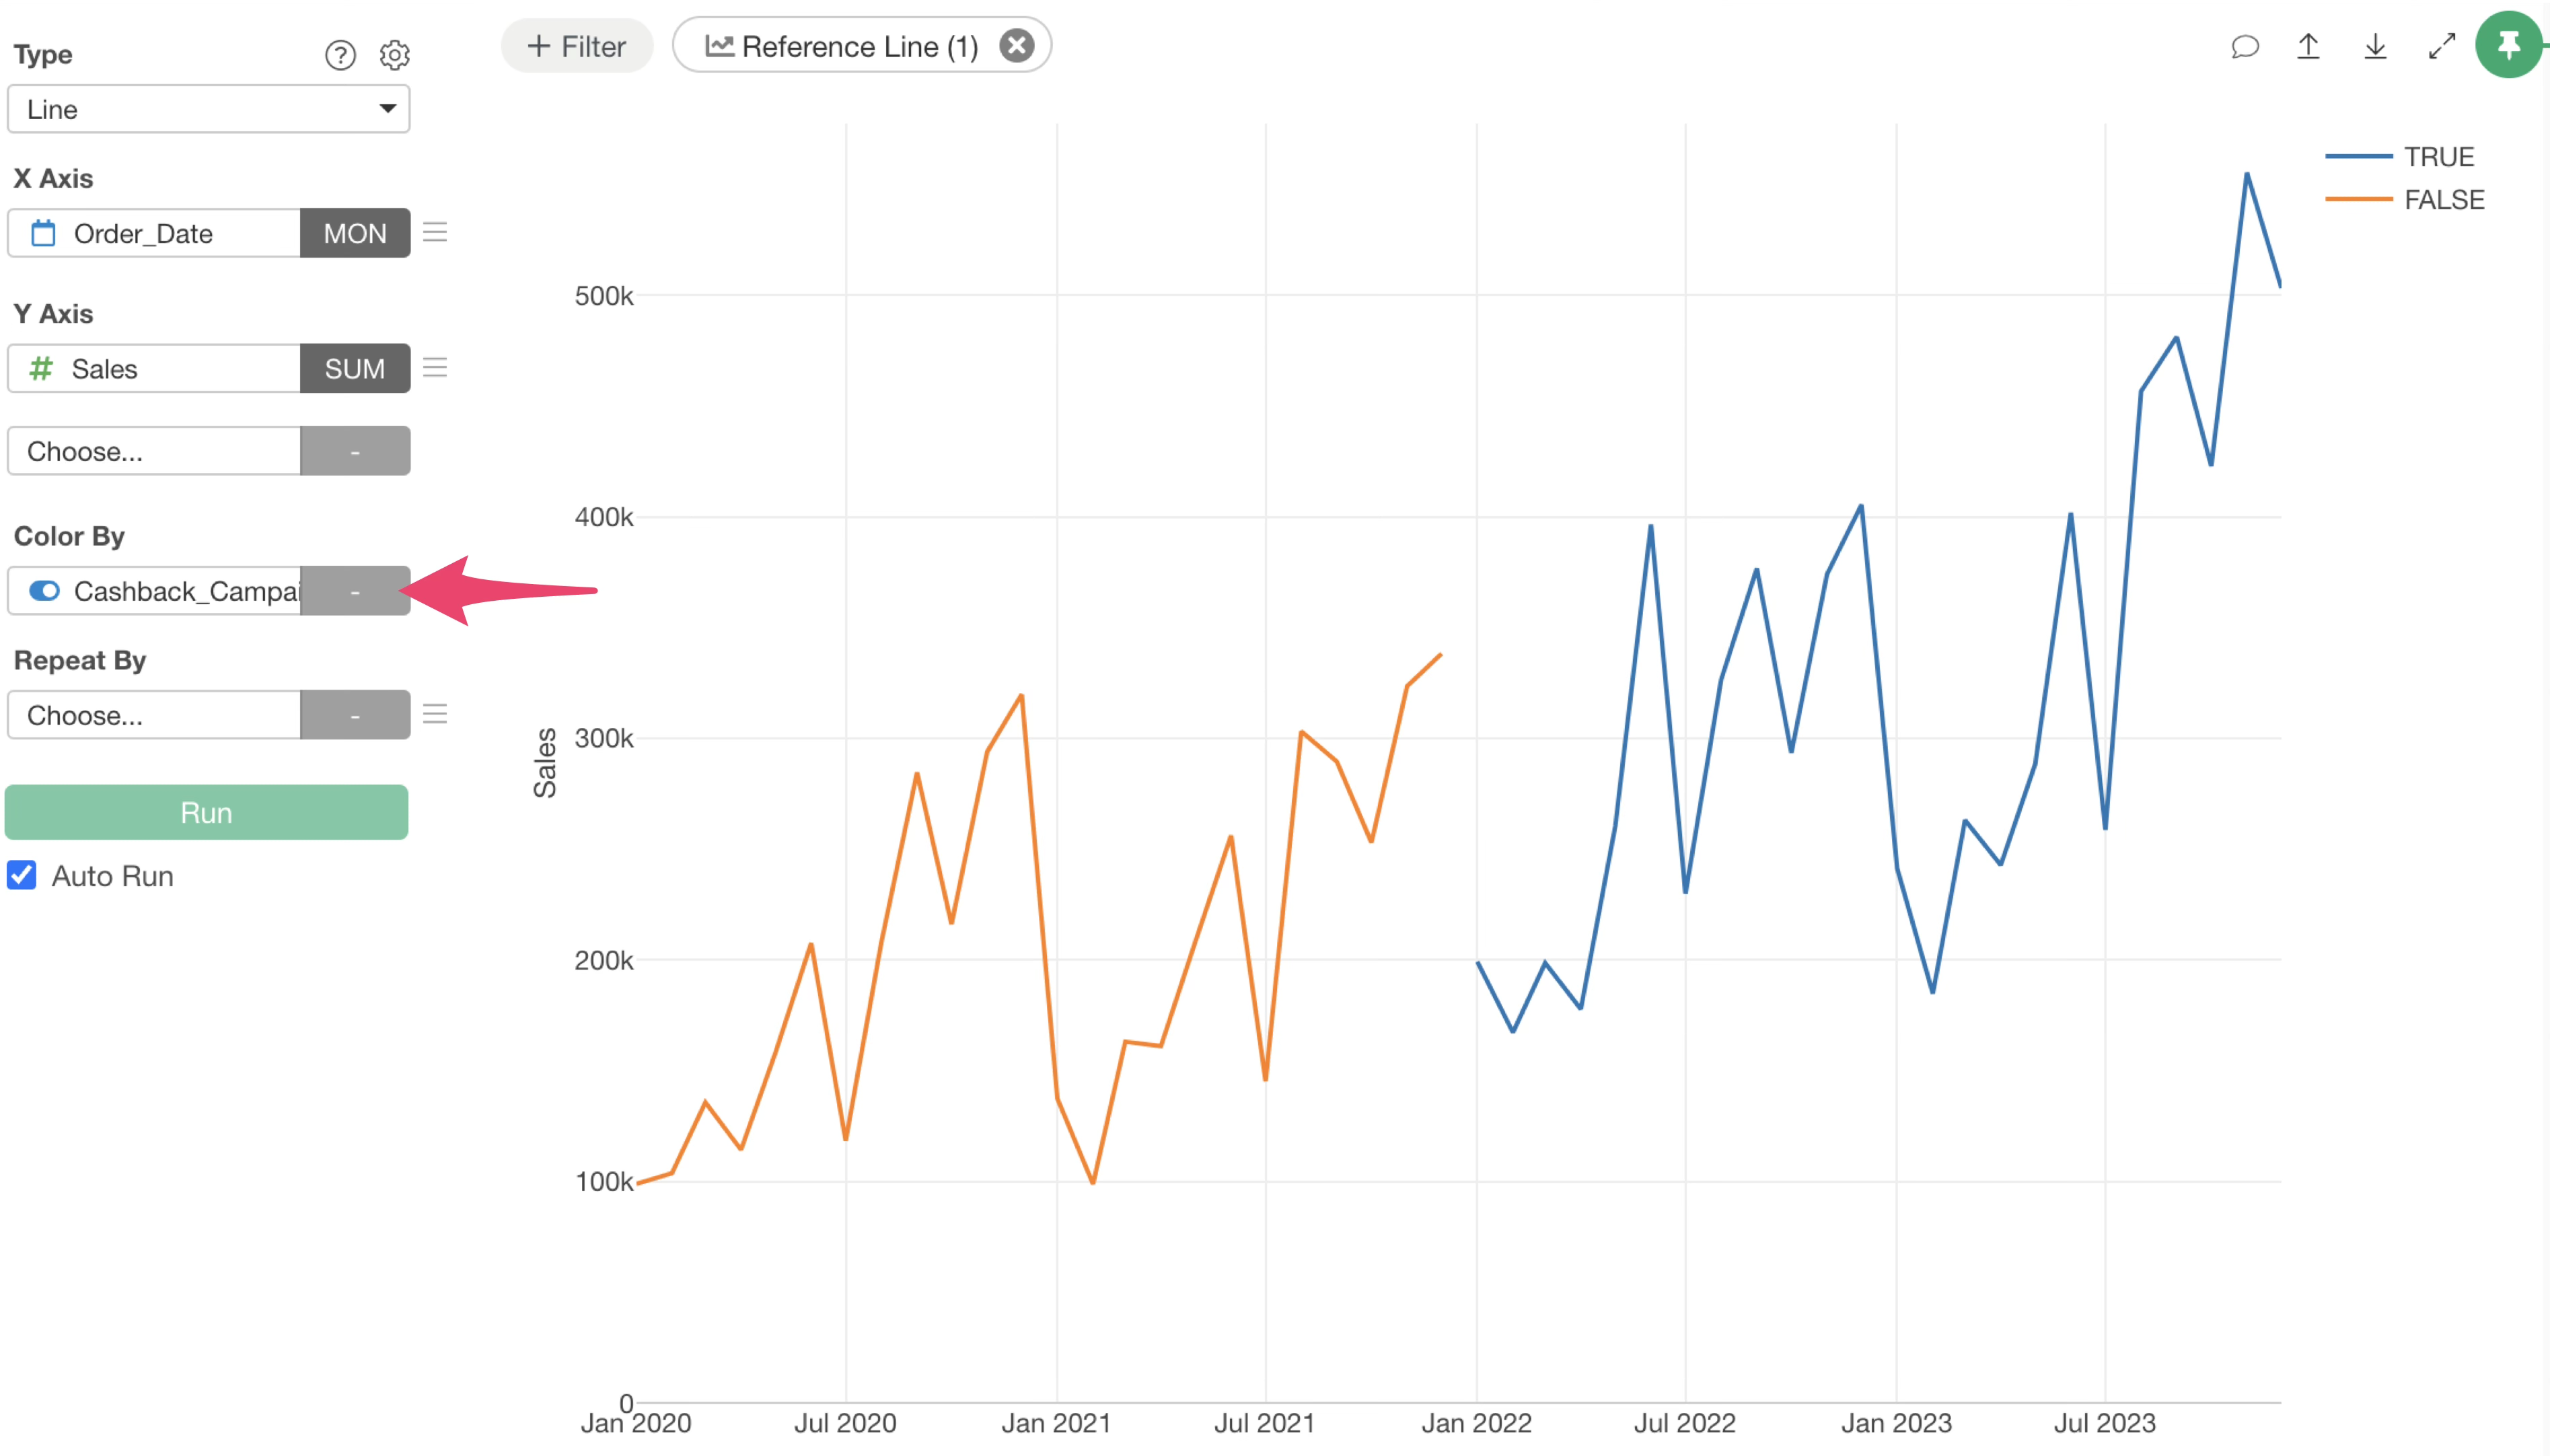
Color By
When “Color by” is specified, setting a reference line automatically draws a reference line for each group defined by color.
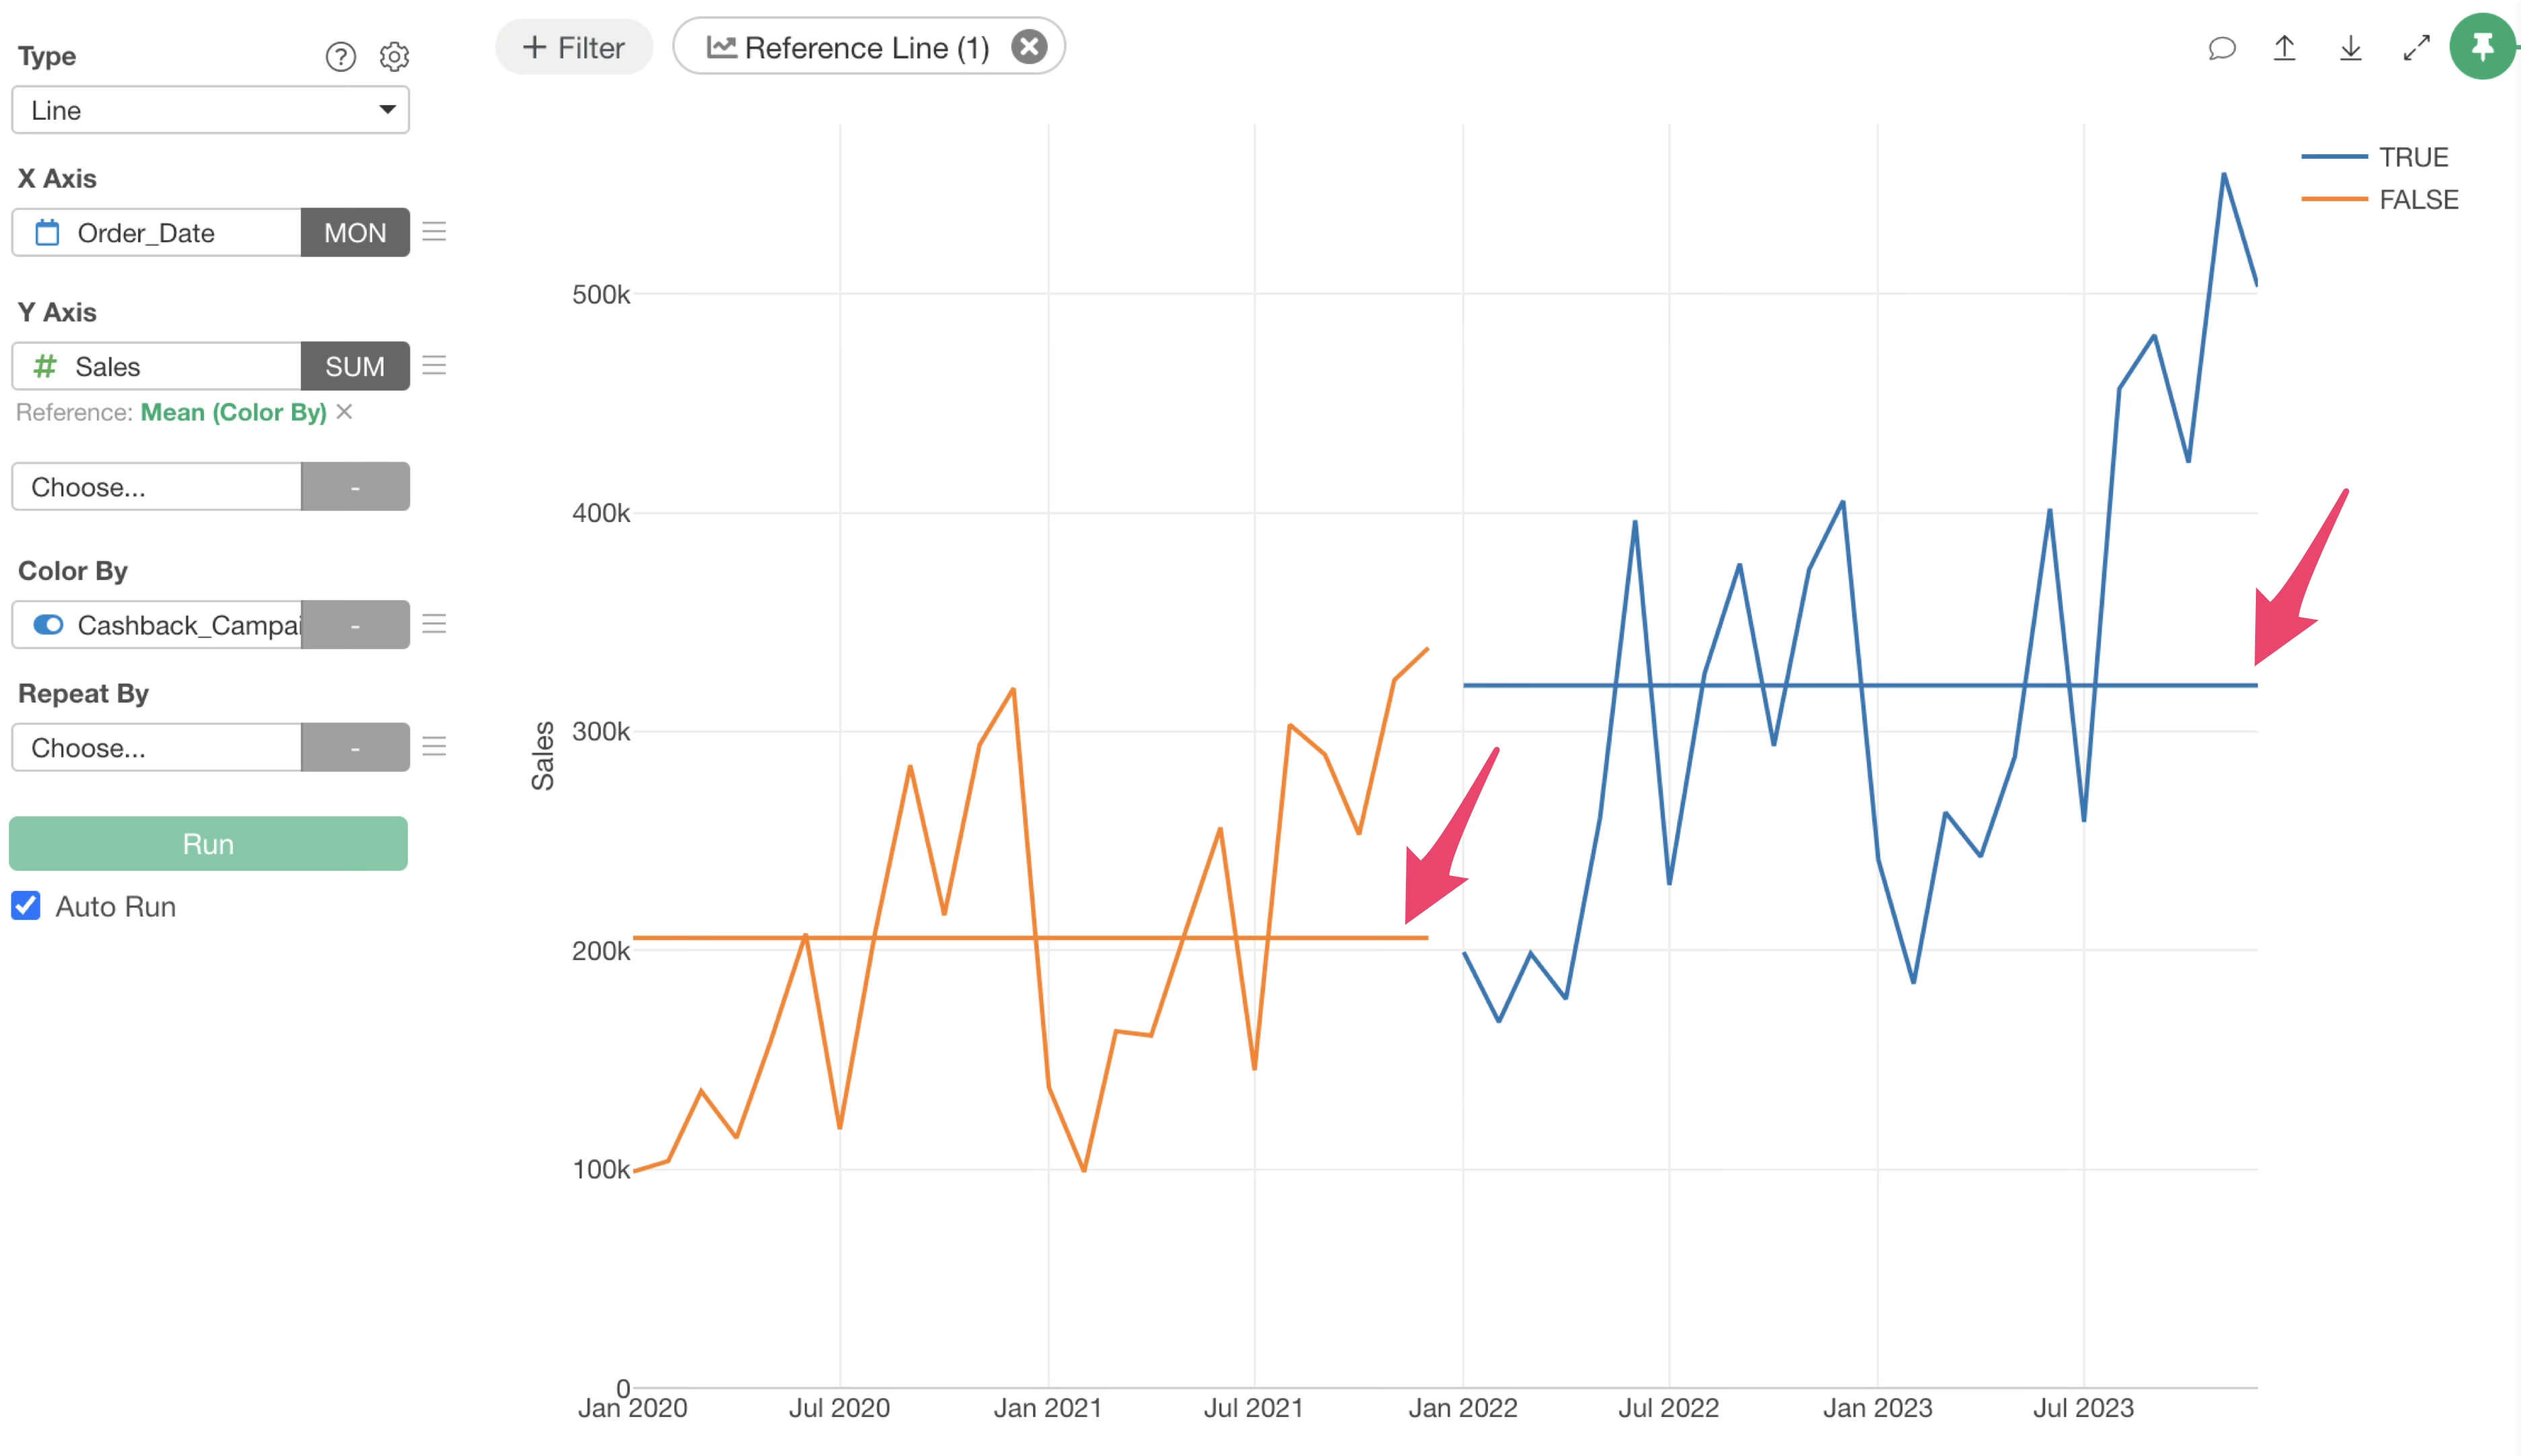
To set an overall reference line, click the green text in the reference line settings.

In the reference line settings dialog, select “All” from the “Group By” menu and apply it.
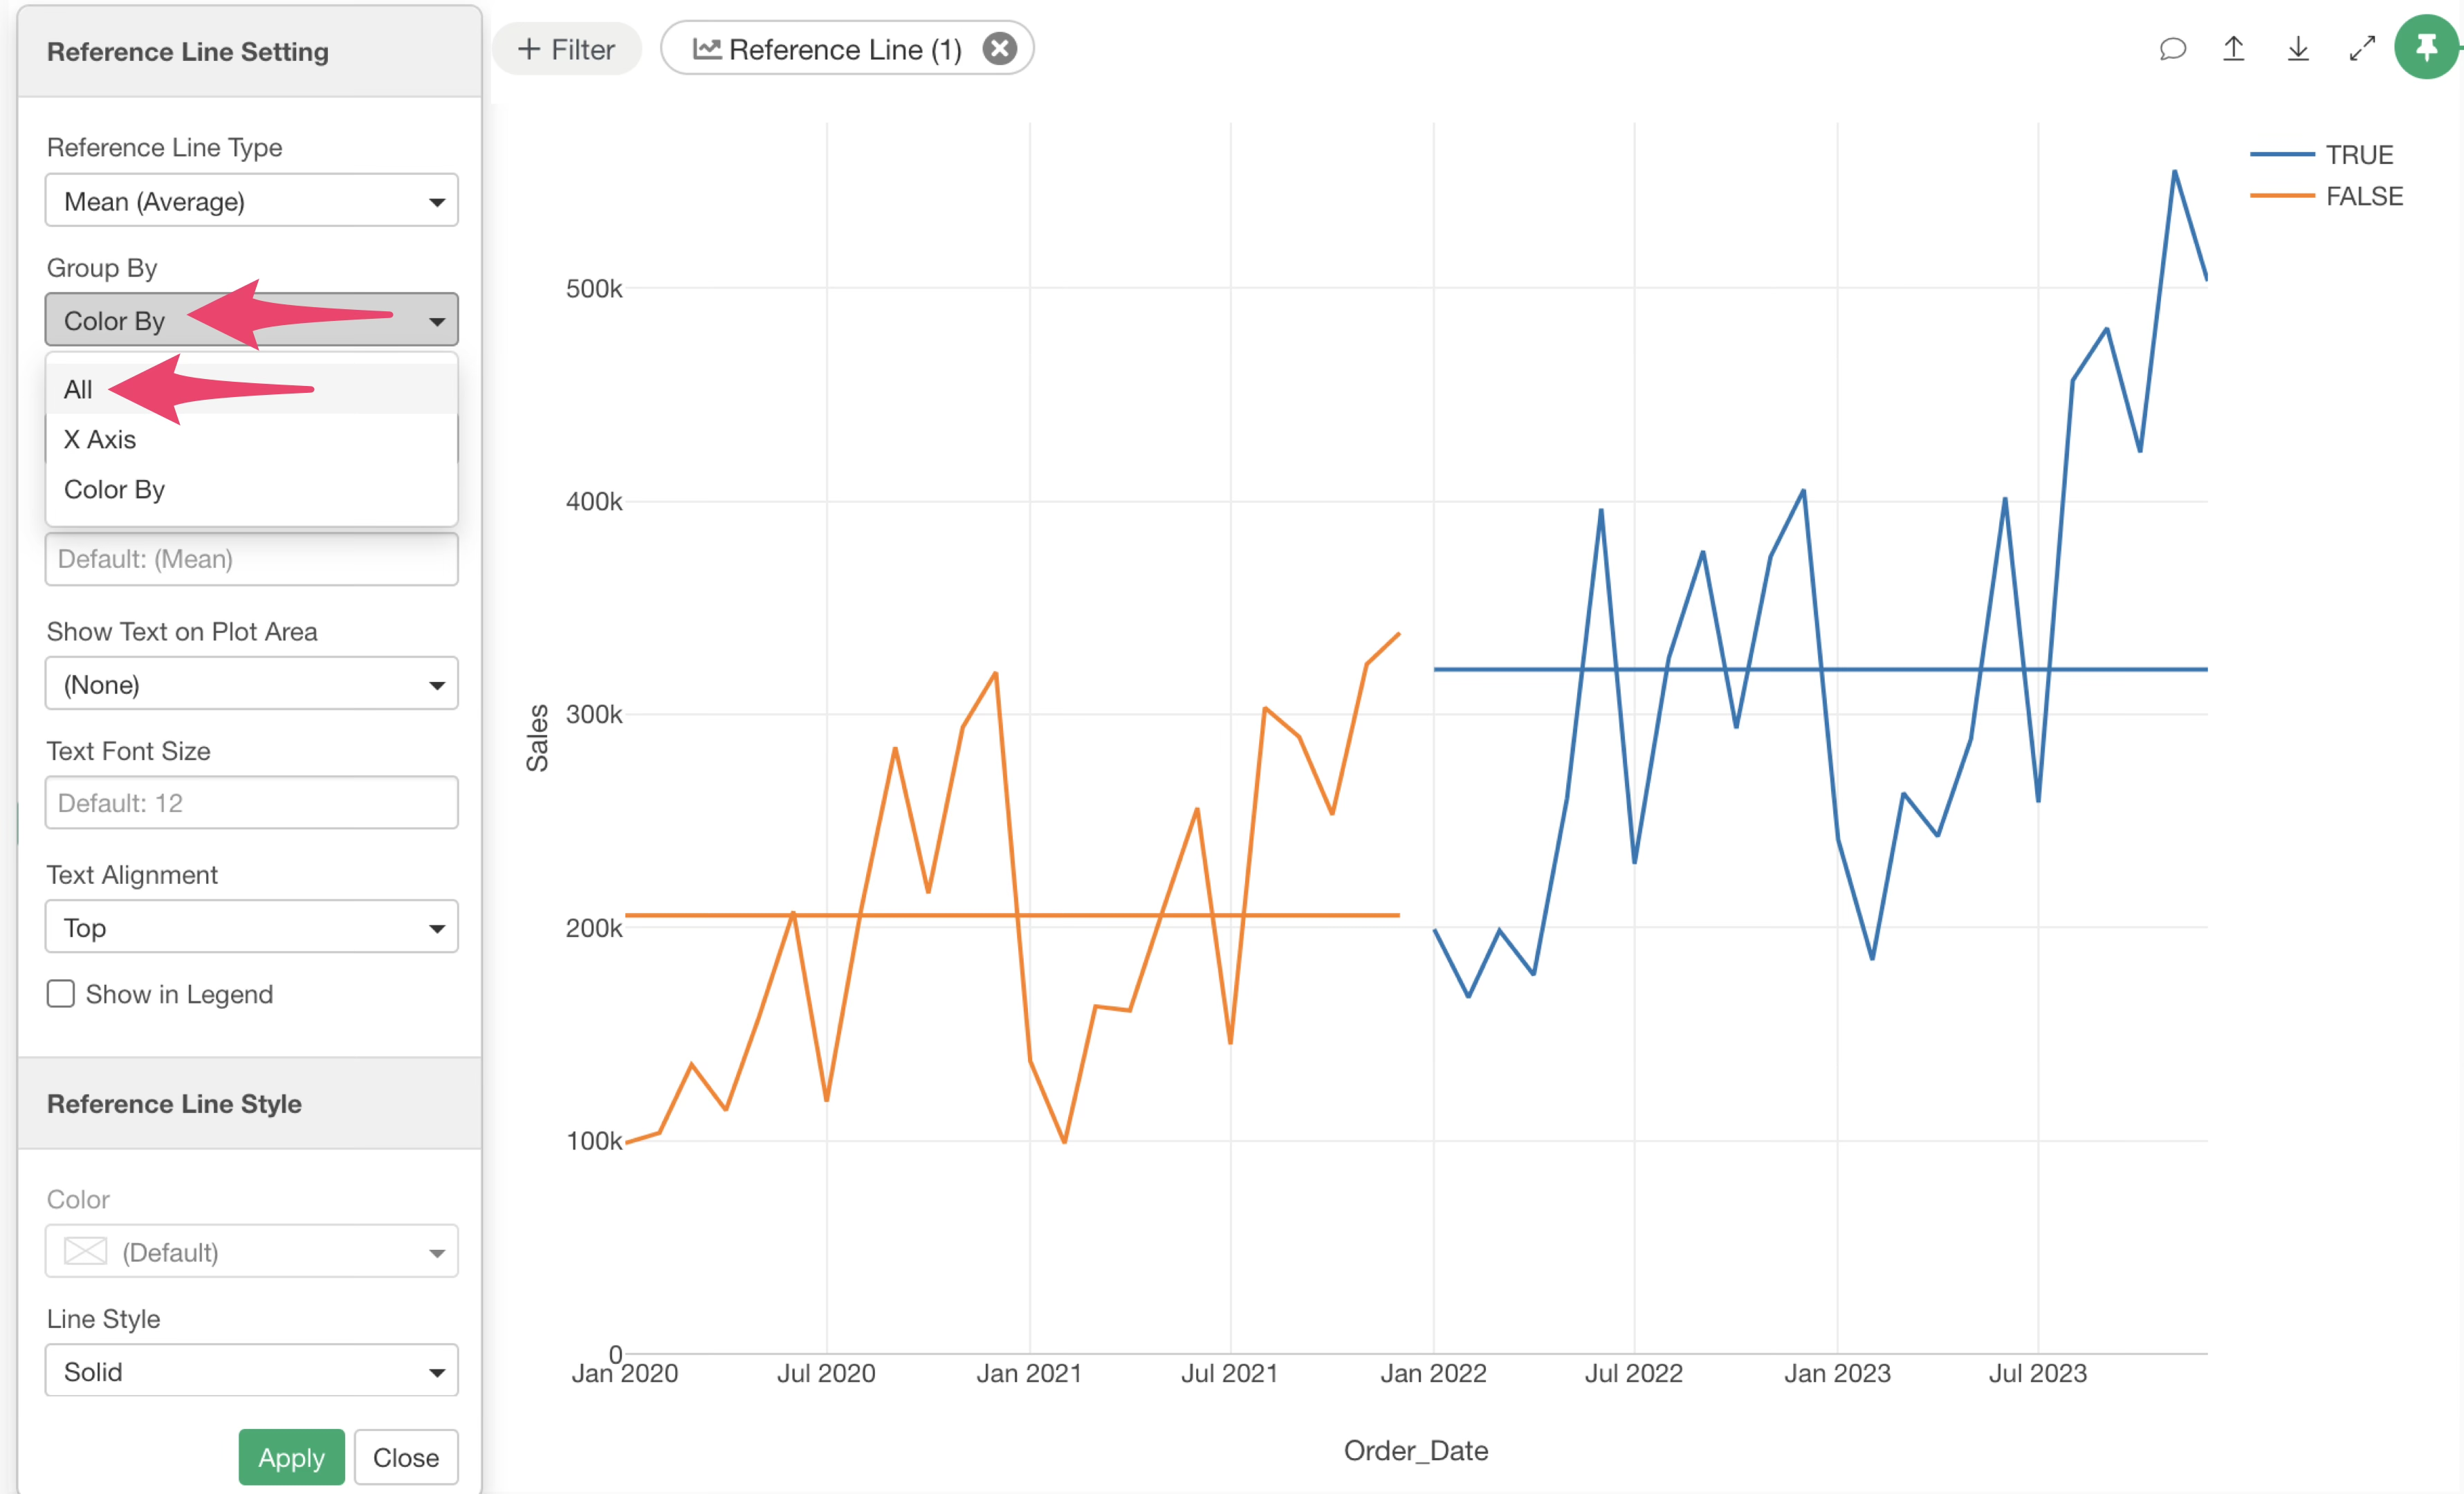
This changes the reference lines, which were previously drawn for each colored category, to an overall reference line.
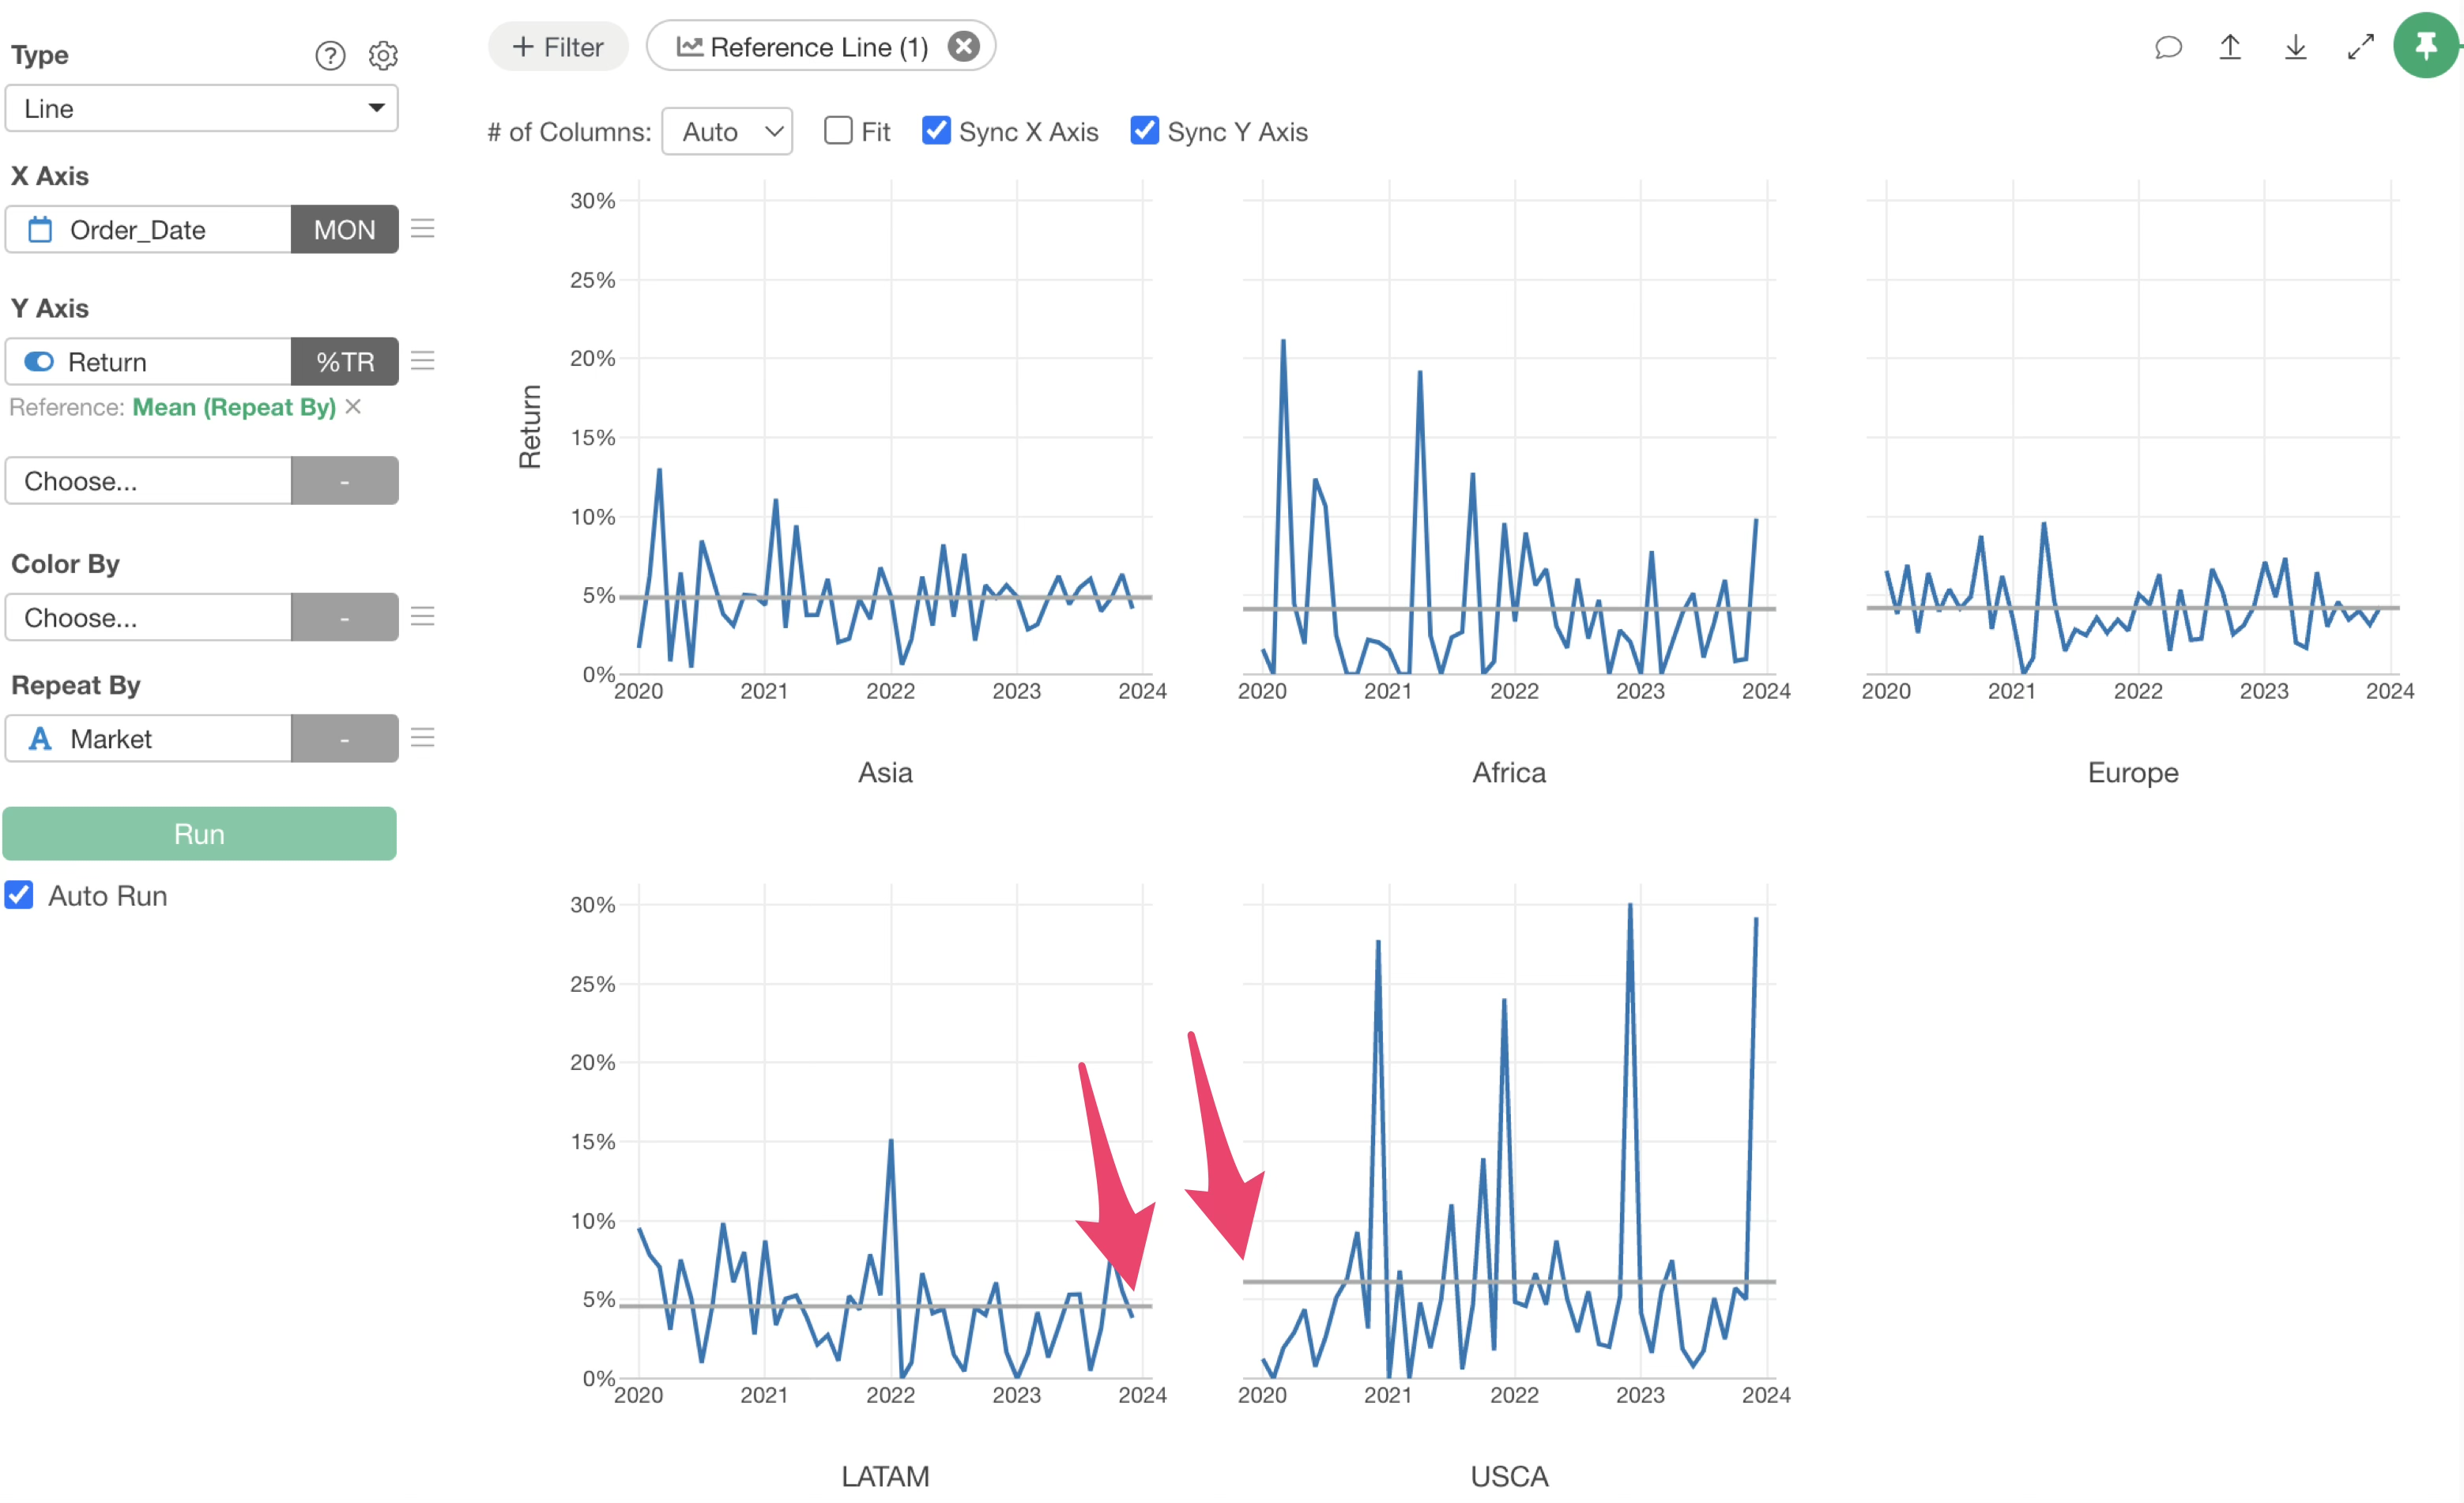
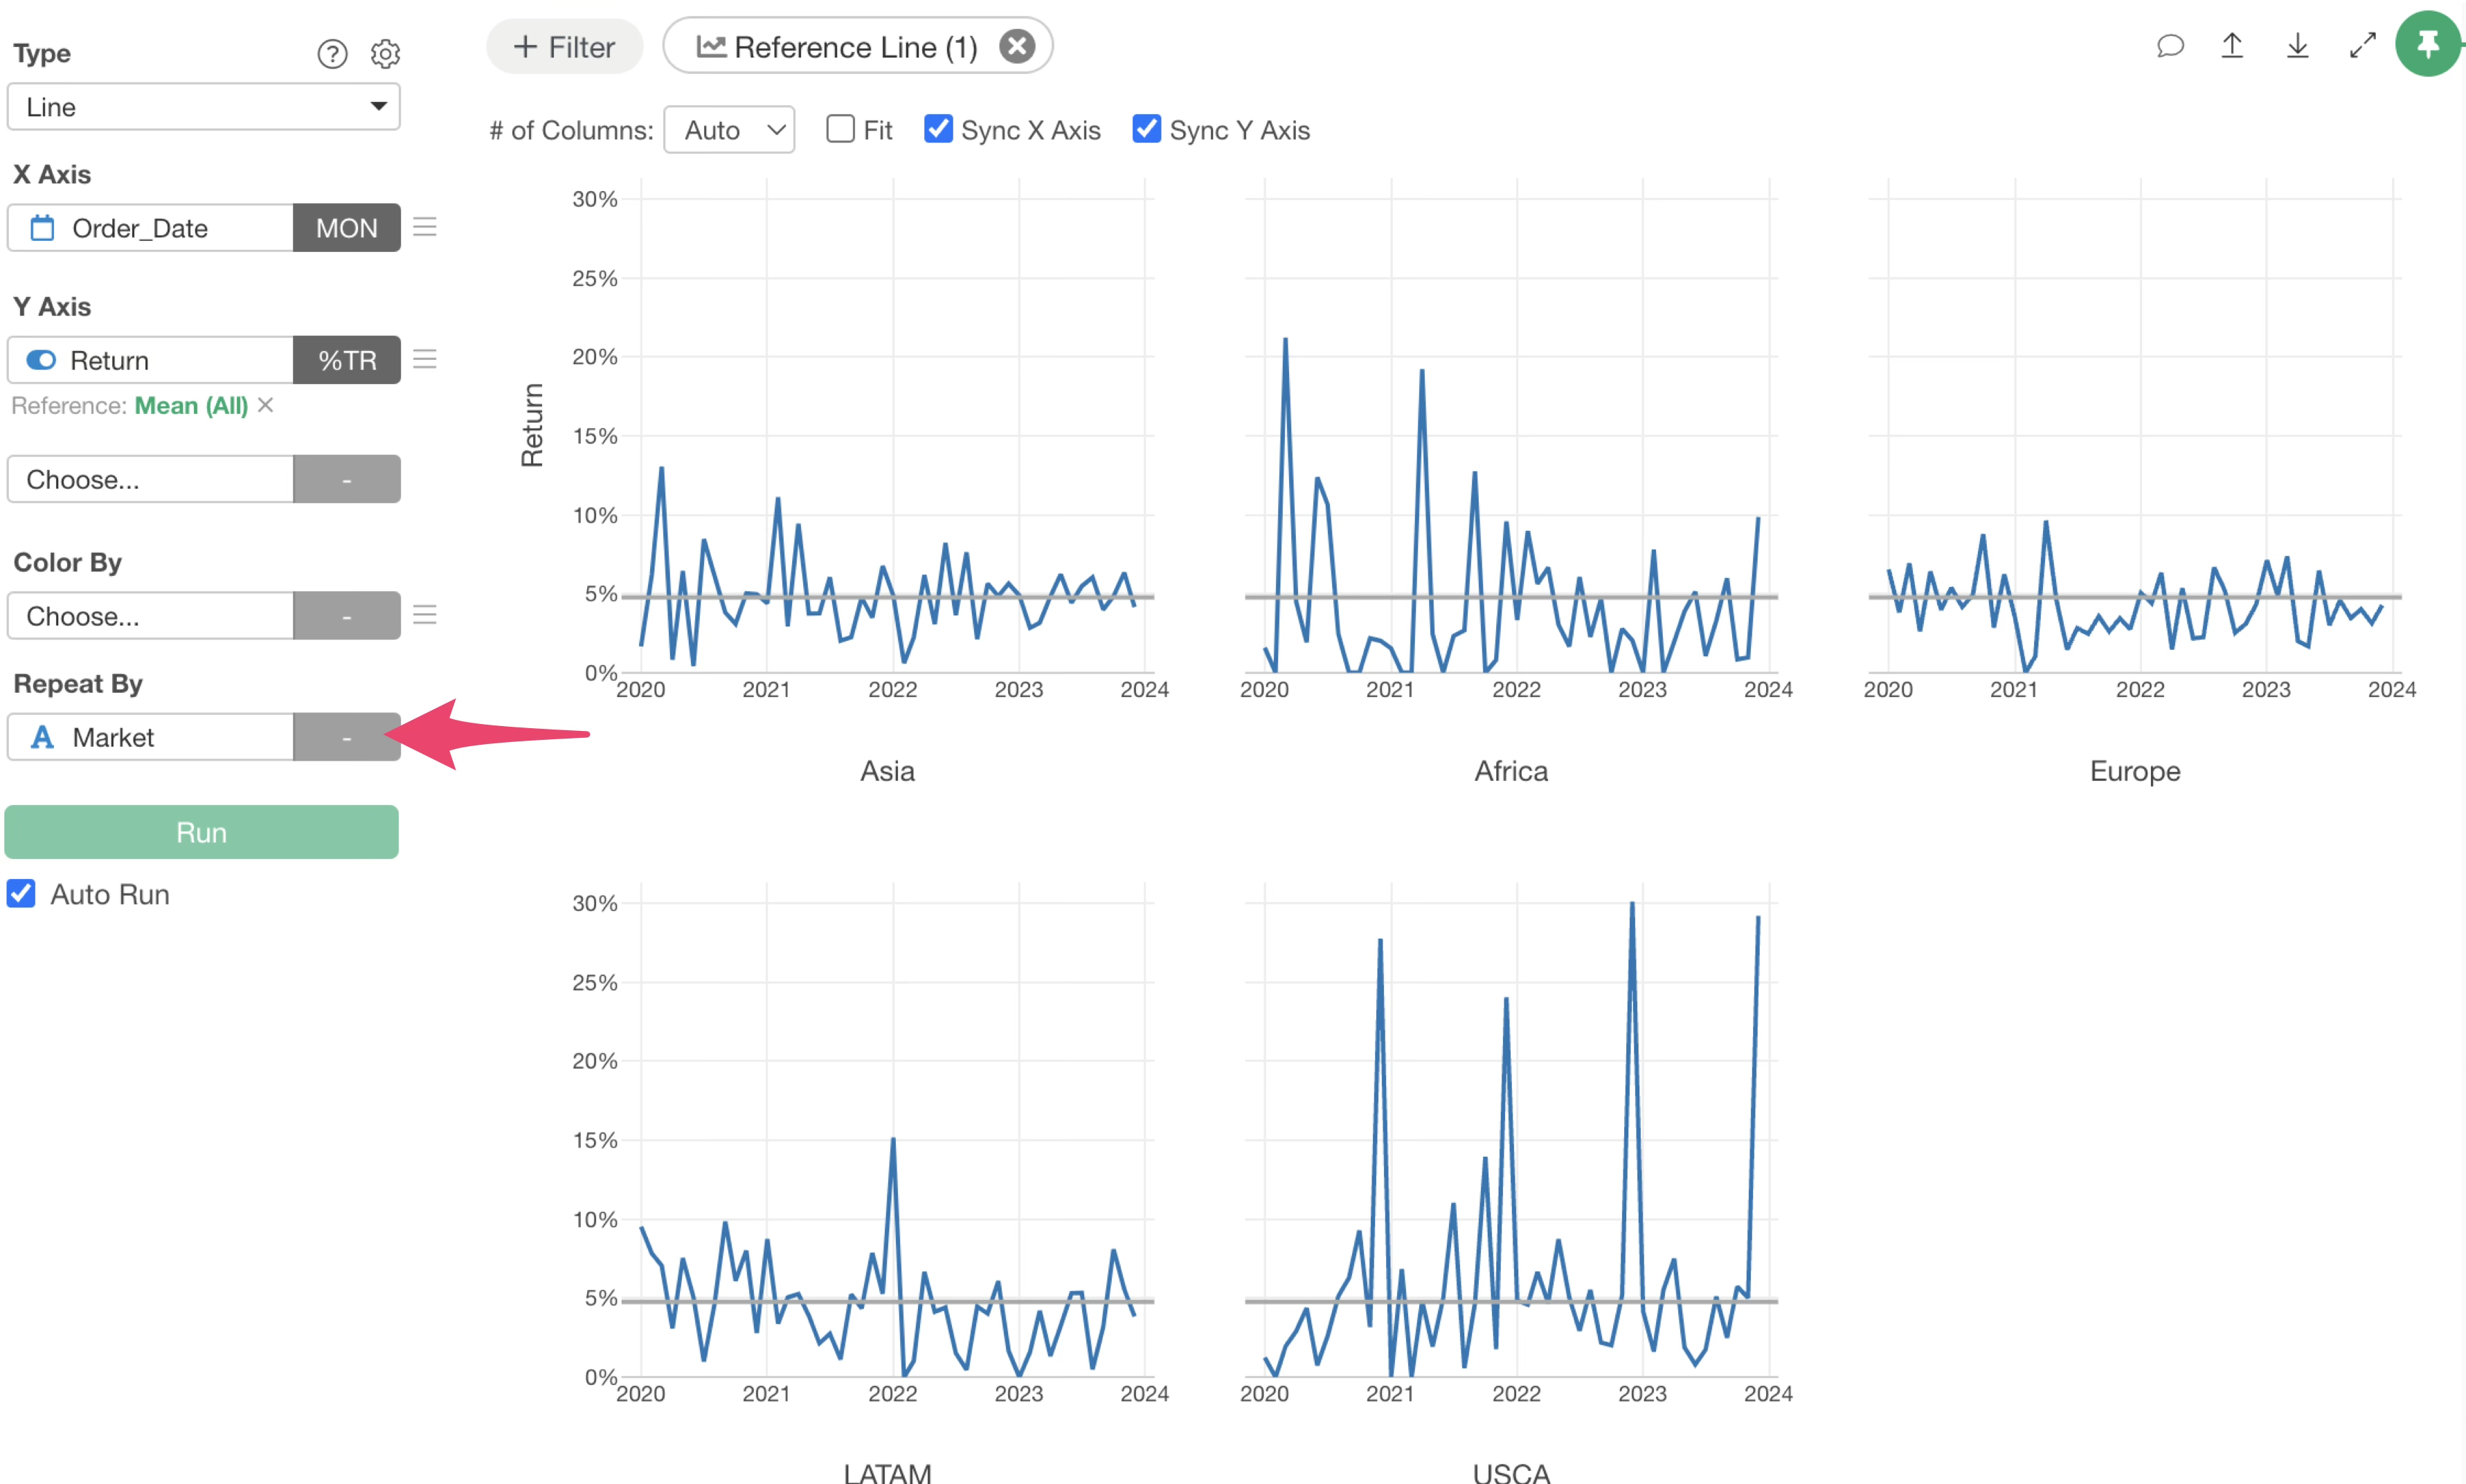
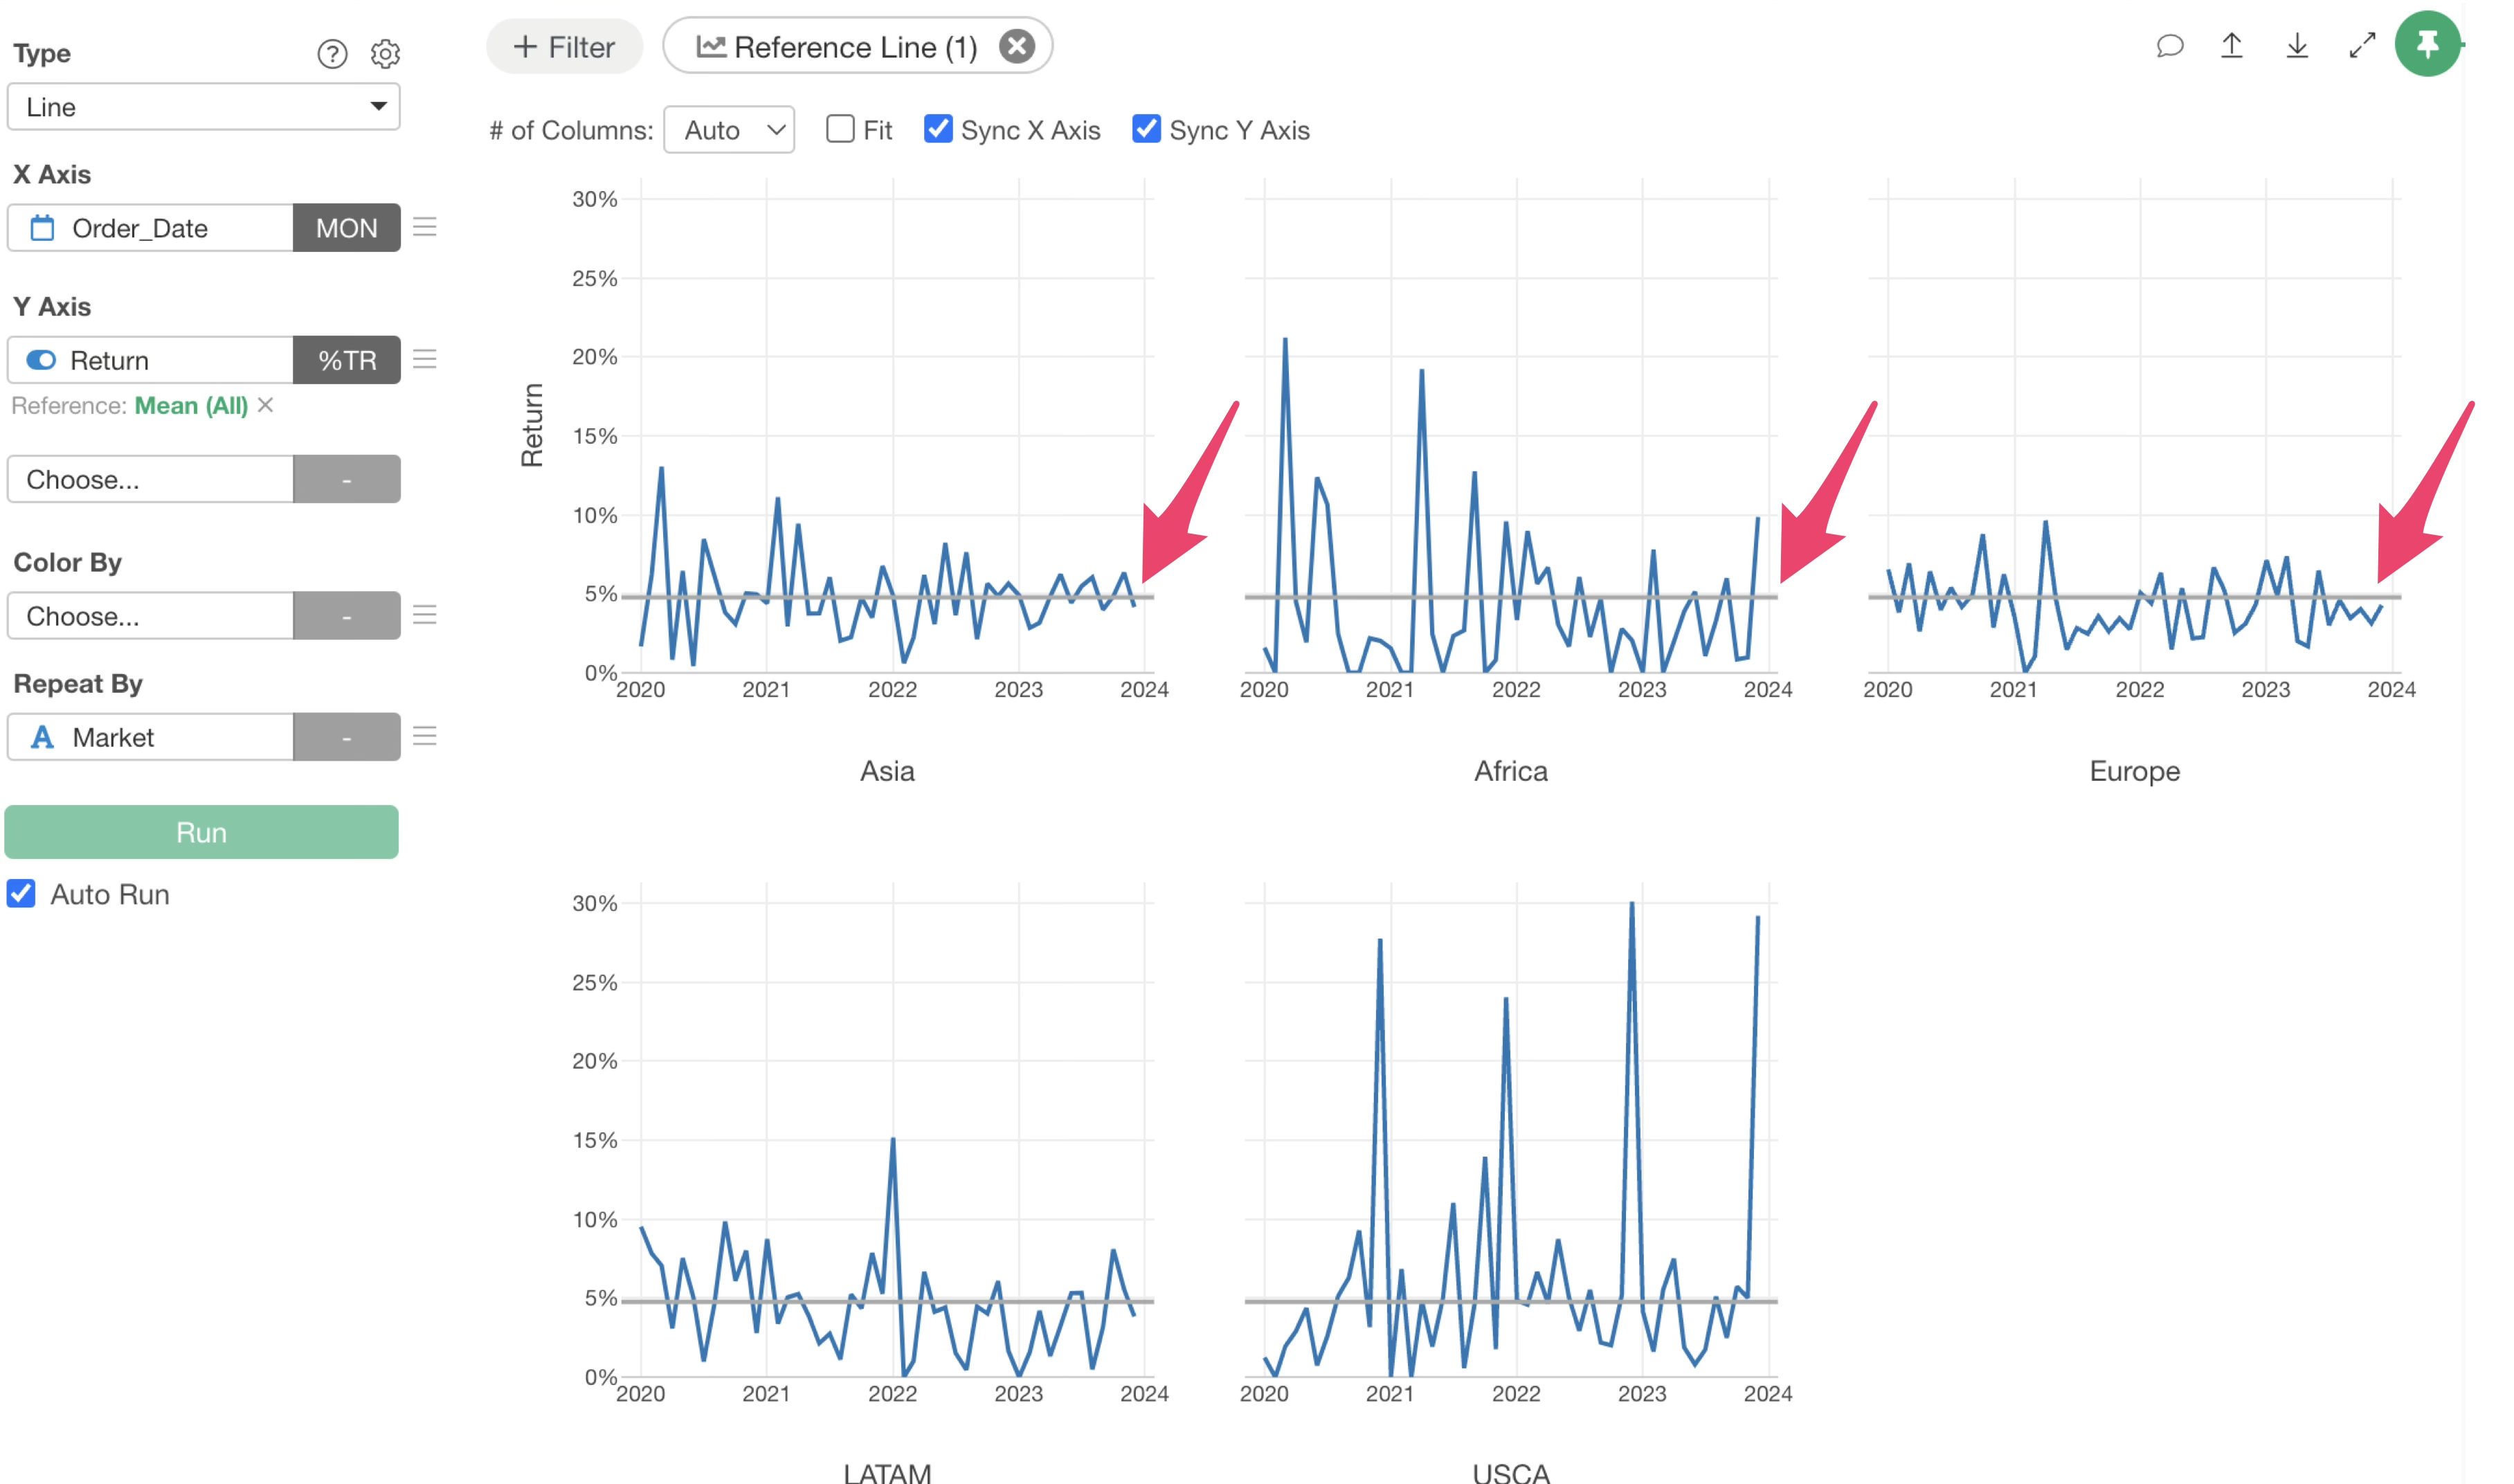
Repeat By
When “Repeat By” is selected, setting a reference line displays an overall reference line.
If you want to display reference lines for each repeated category, click the green text of the reference line.
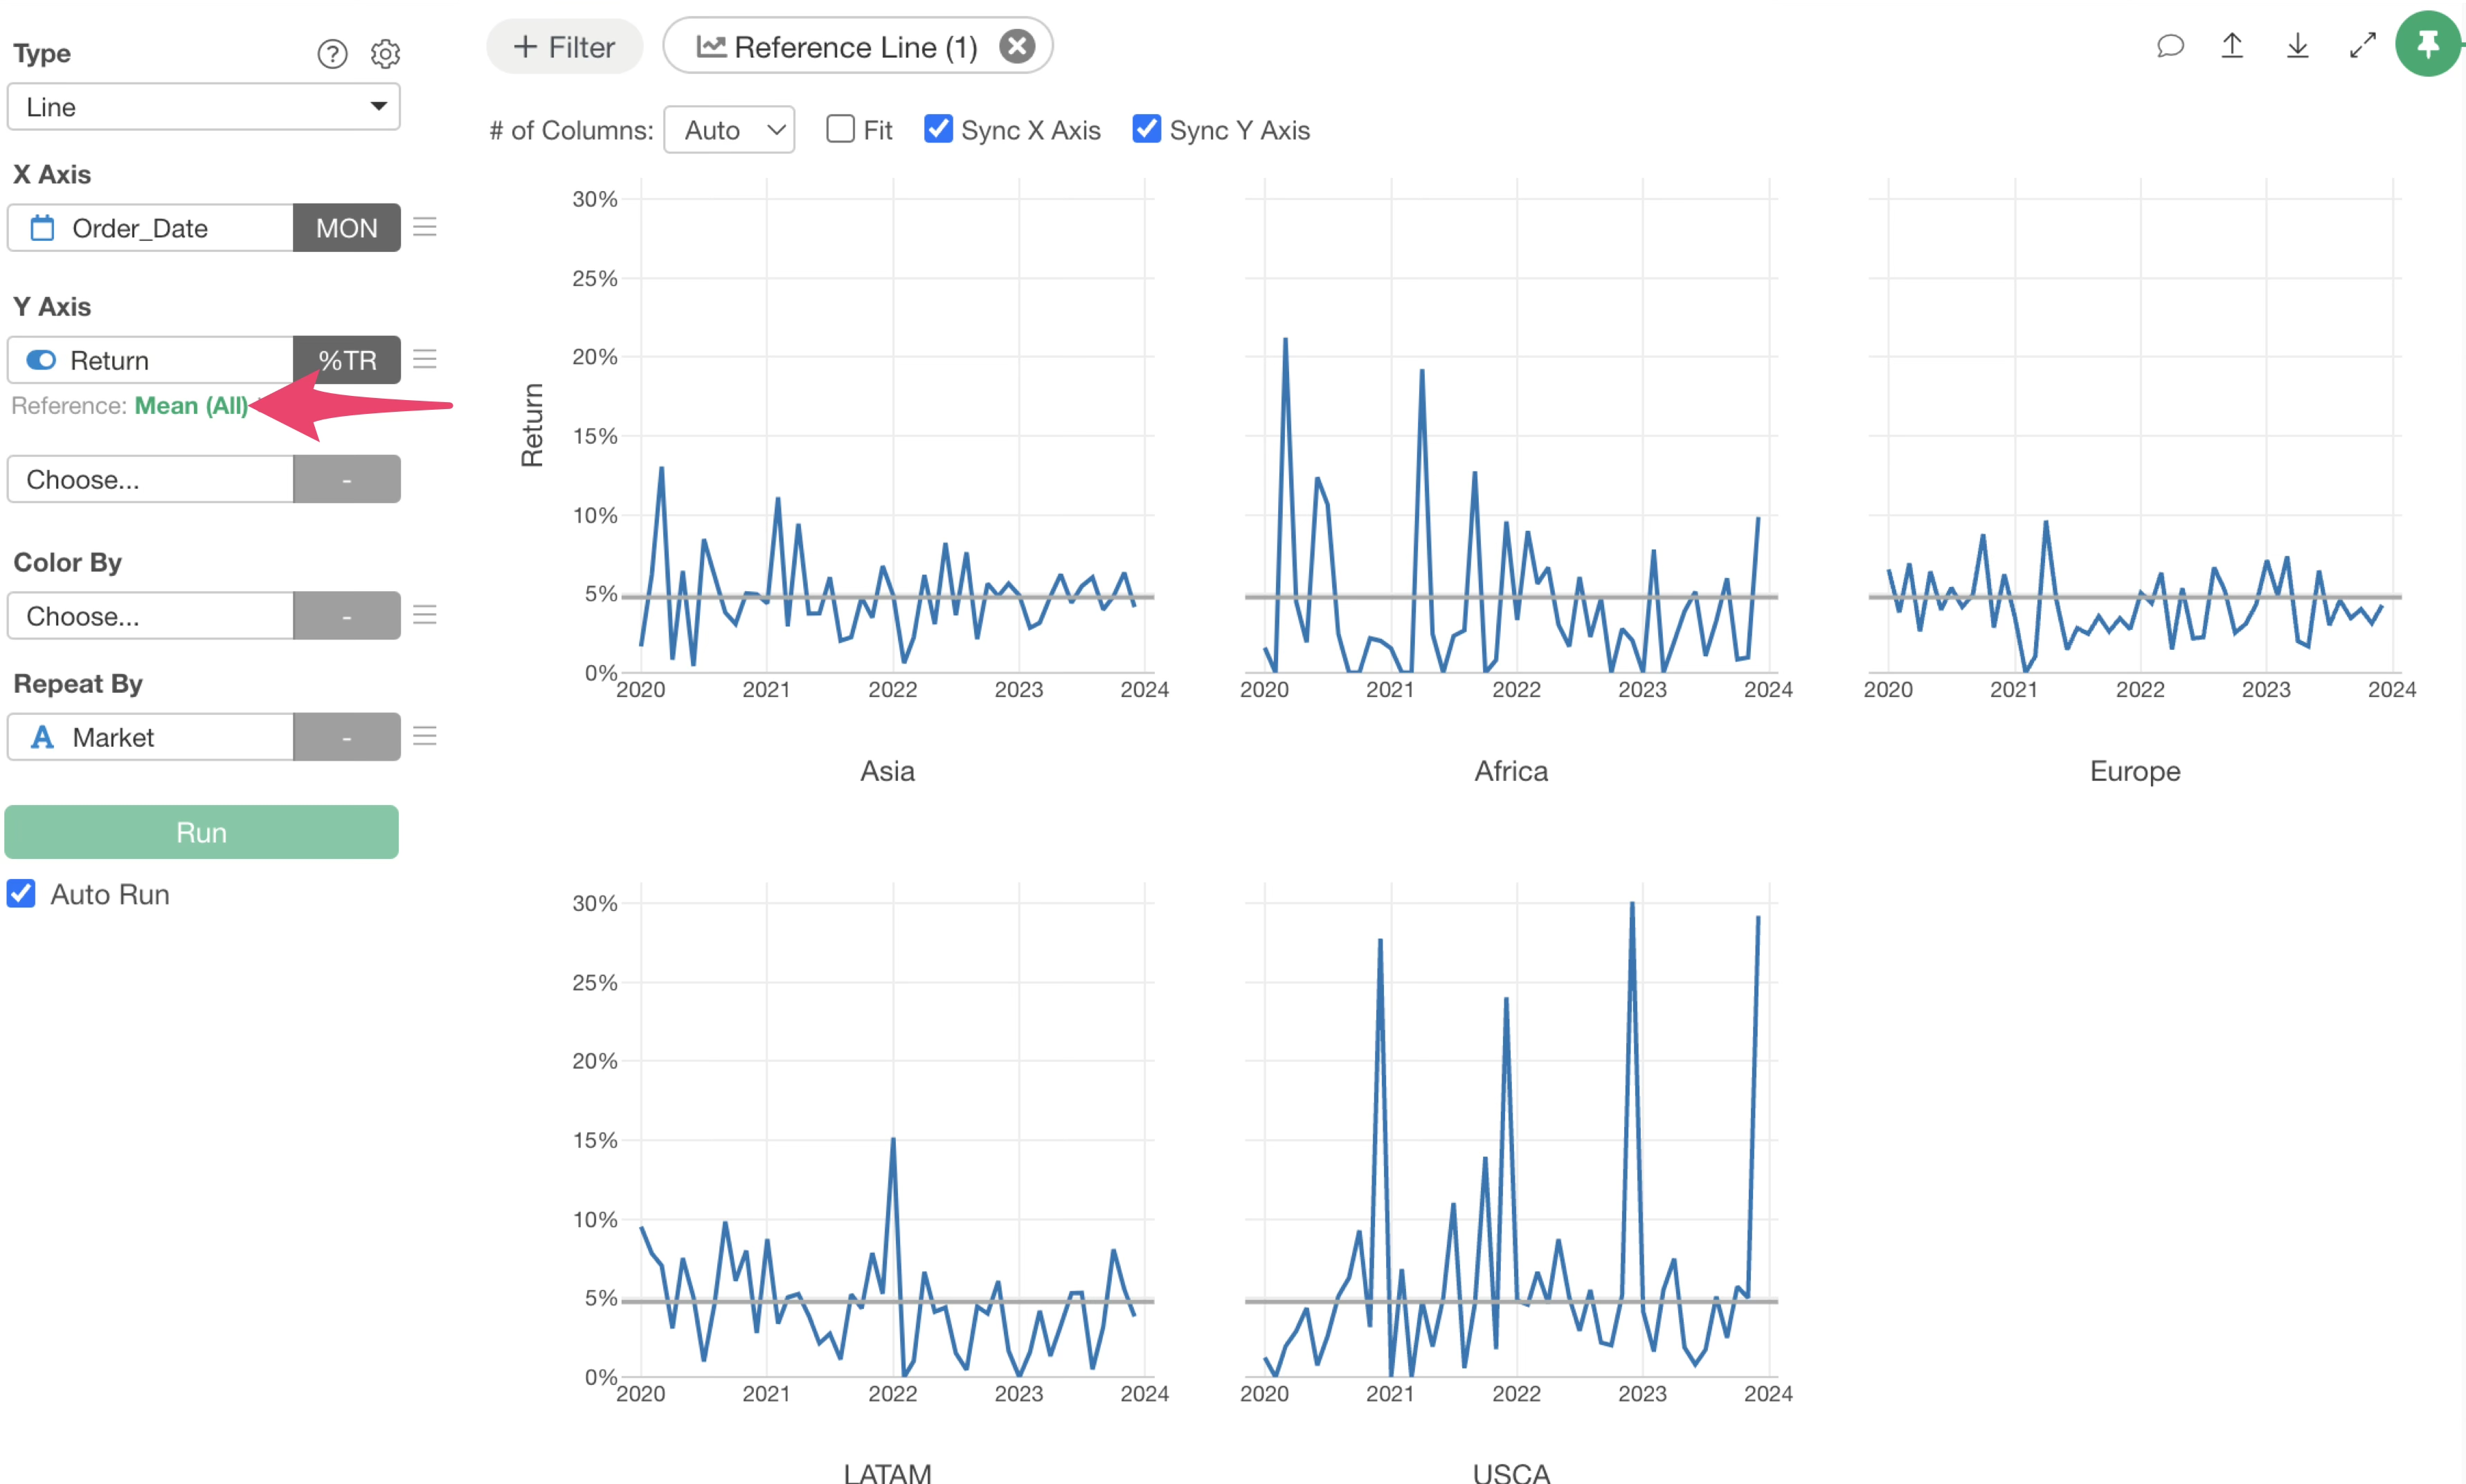
Once the reference line settings dialog opens, select “Repeat By” for grouping.
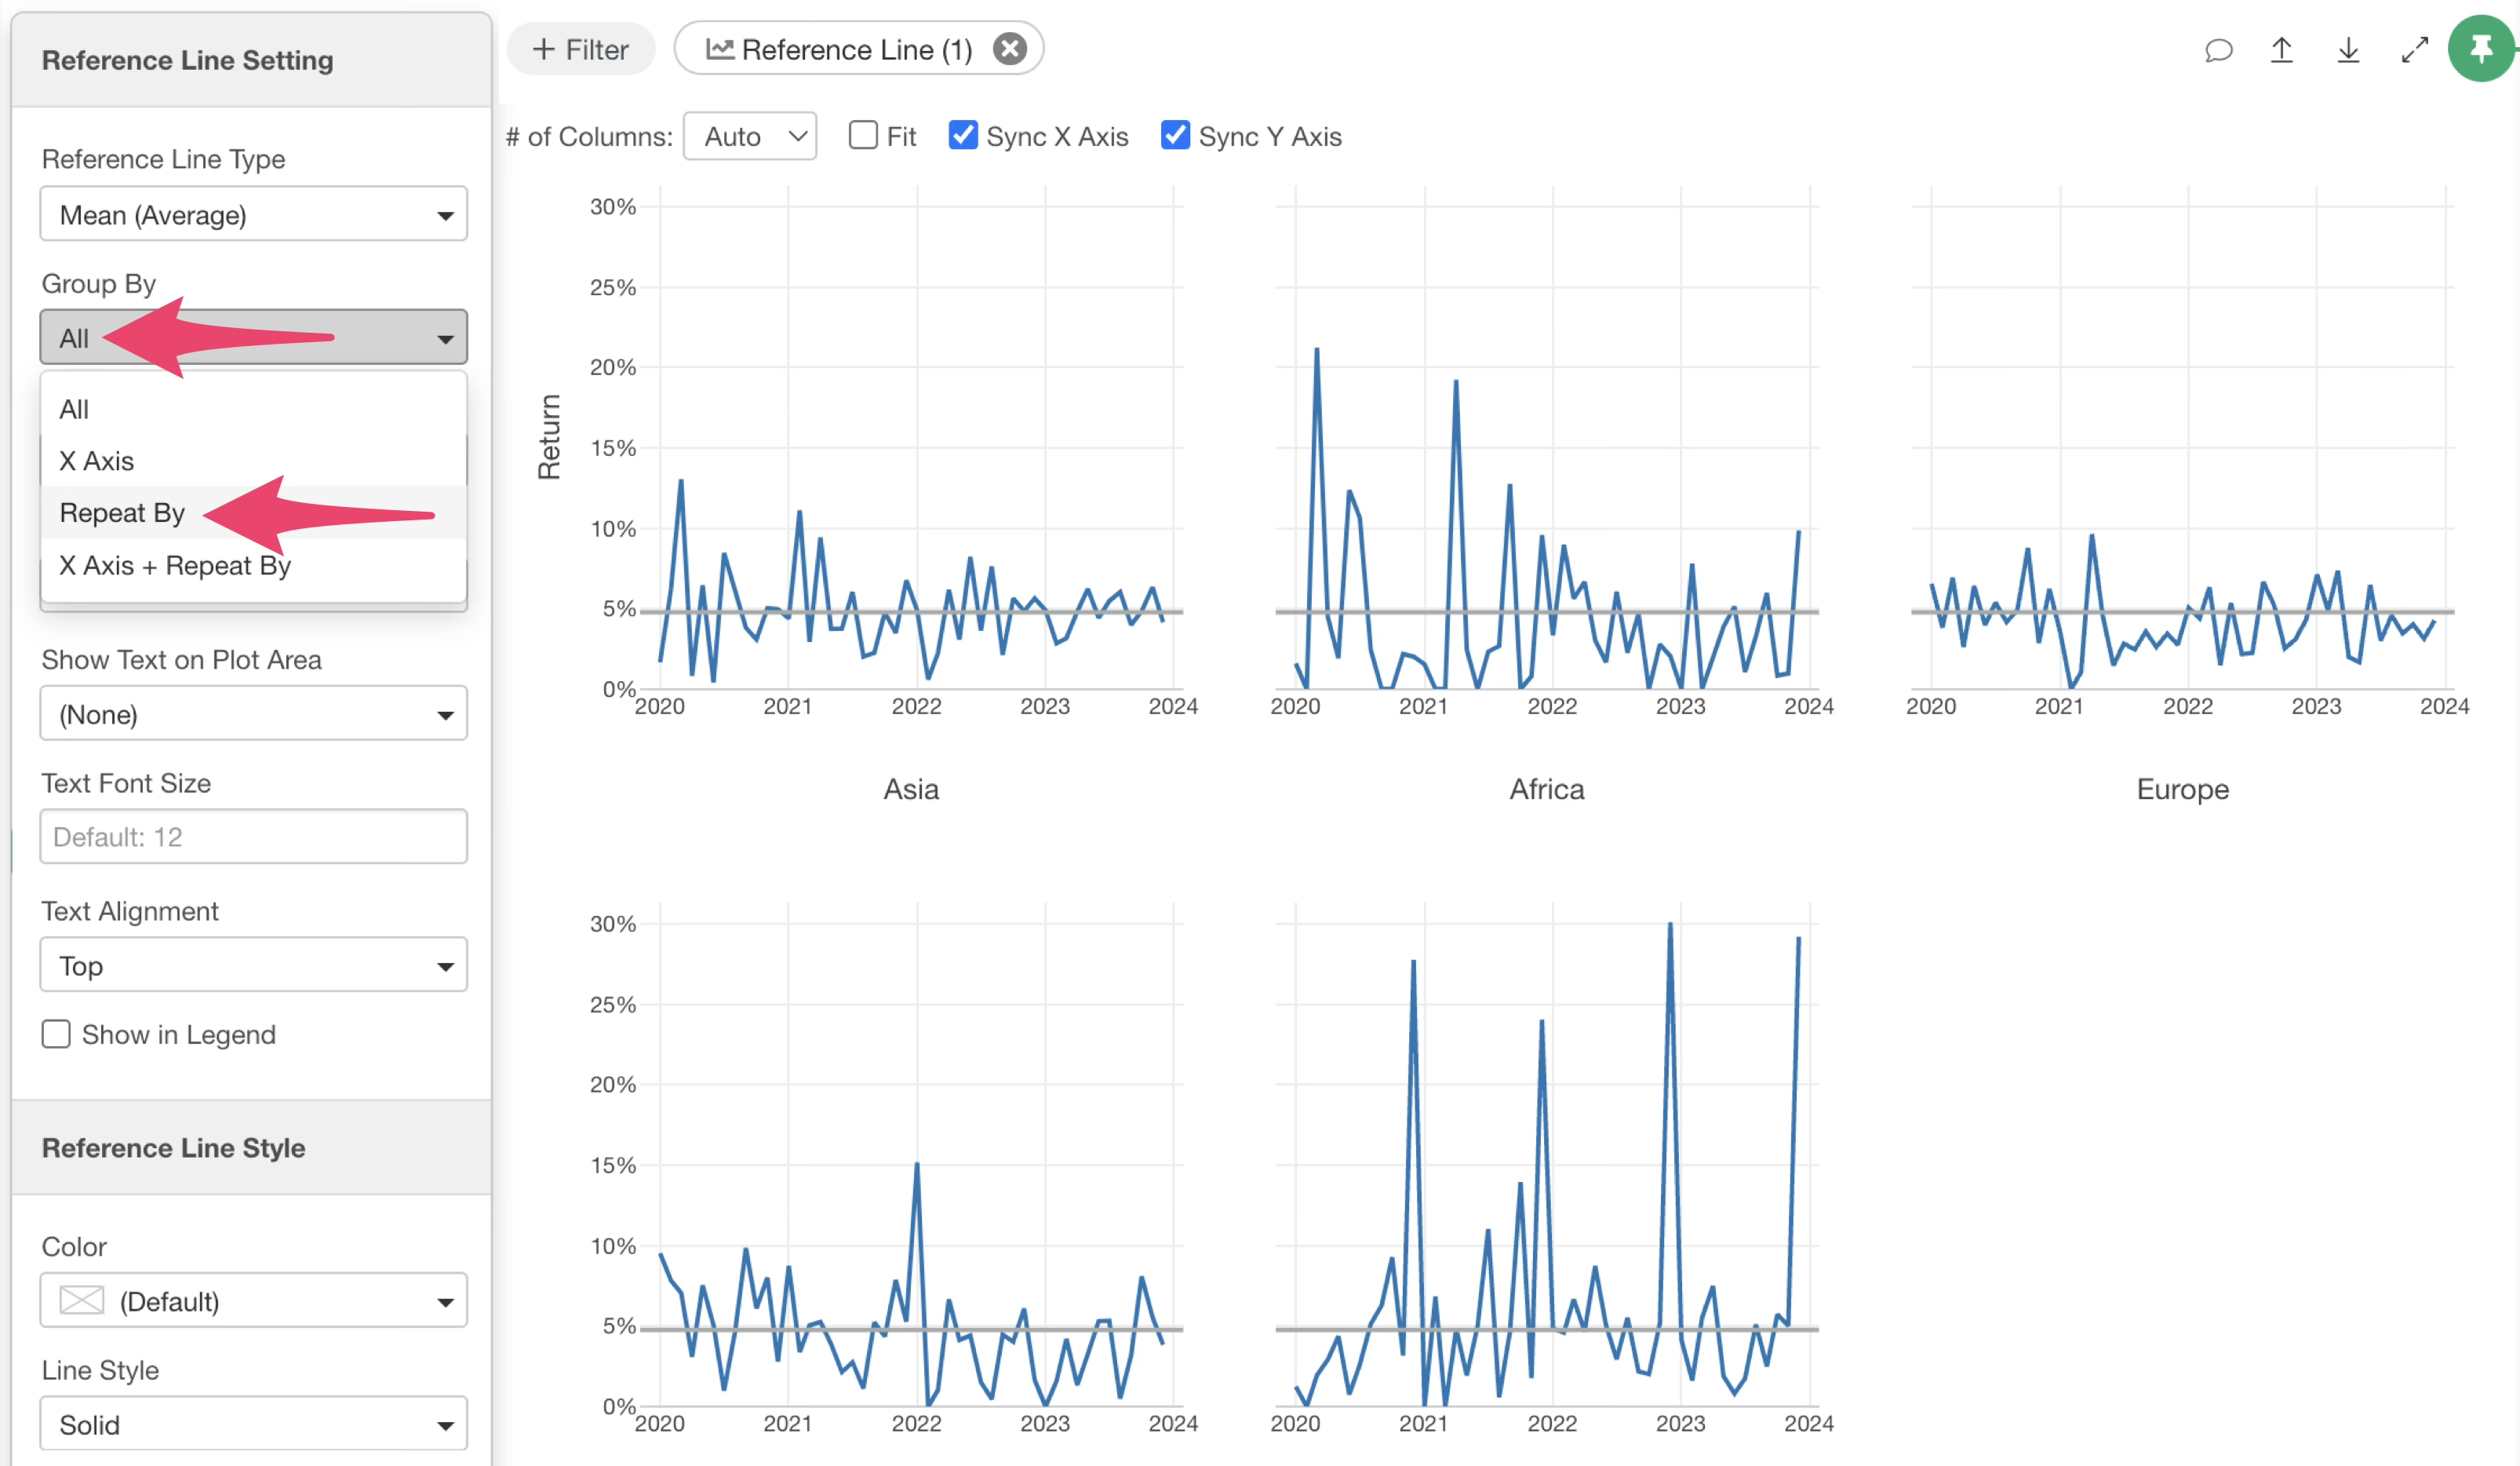
Selecting “Repeat By” will set reference lines for each repeated category.