How to Use Survival Curves (How to Calculate Survival Rates)
This article summarizes frequently asked questions about using survival curves and the Kaplan-Meier method, which is employed in Exploratory for survival curve analysis.
By using survival curves, you can analyze time-related patterns such as:
- Time until a user churns (cancels) from a service
- Time until an employee changes jobs or leaves the company
- Time until a product fails (e.g., time from starting to use a car until it breaks down)
- Remaining life expectancy of patients with a certain disease (origin of the term “survival analysis”)
Required Data
To draw a survival curve, you need data where each row represents one subject of observation (e.g., one row per customer).
You also need columns containing the following information:
- Start Time: A column of Date or POSIXct type representing the start of observation for the subject
- End Time: A column of Date or POSIXct type representing the end of observation
- Event Status: A logical column representing the status of the event for the subject (e.g., death, cancellation, etc.)
- Color By: If there’s another column that groups the subjects, you can draw and compare survival curves for each group.
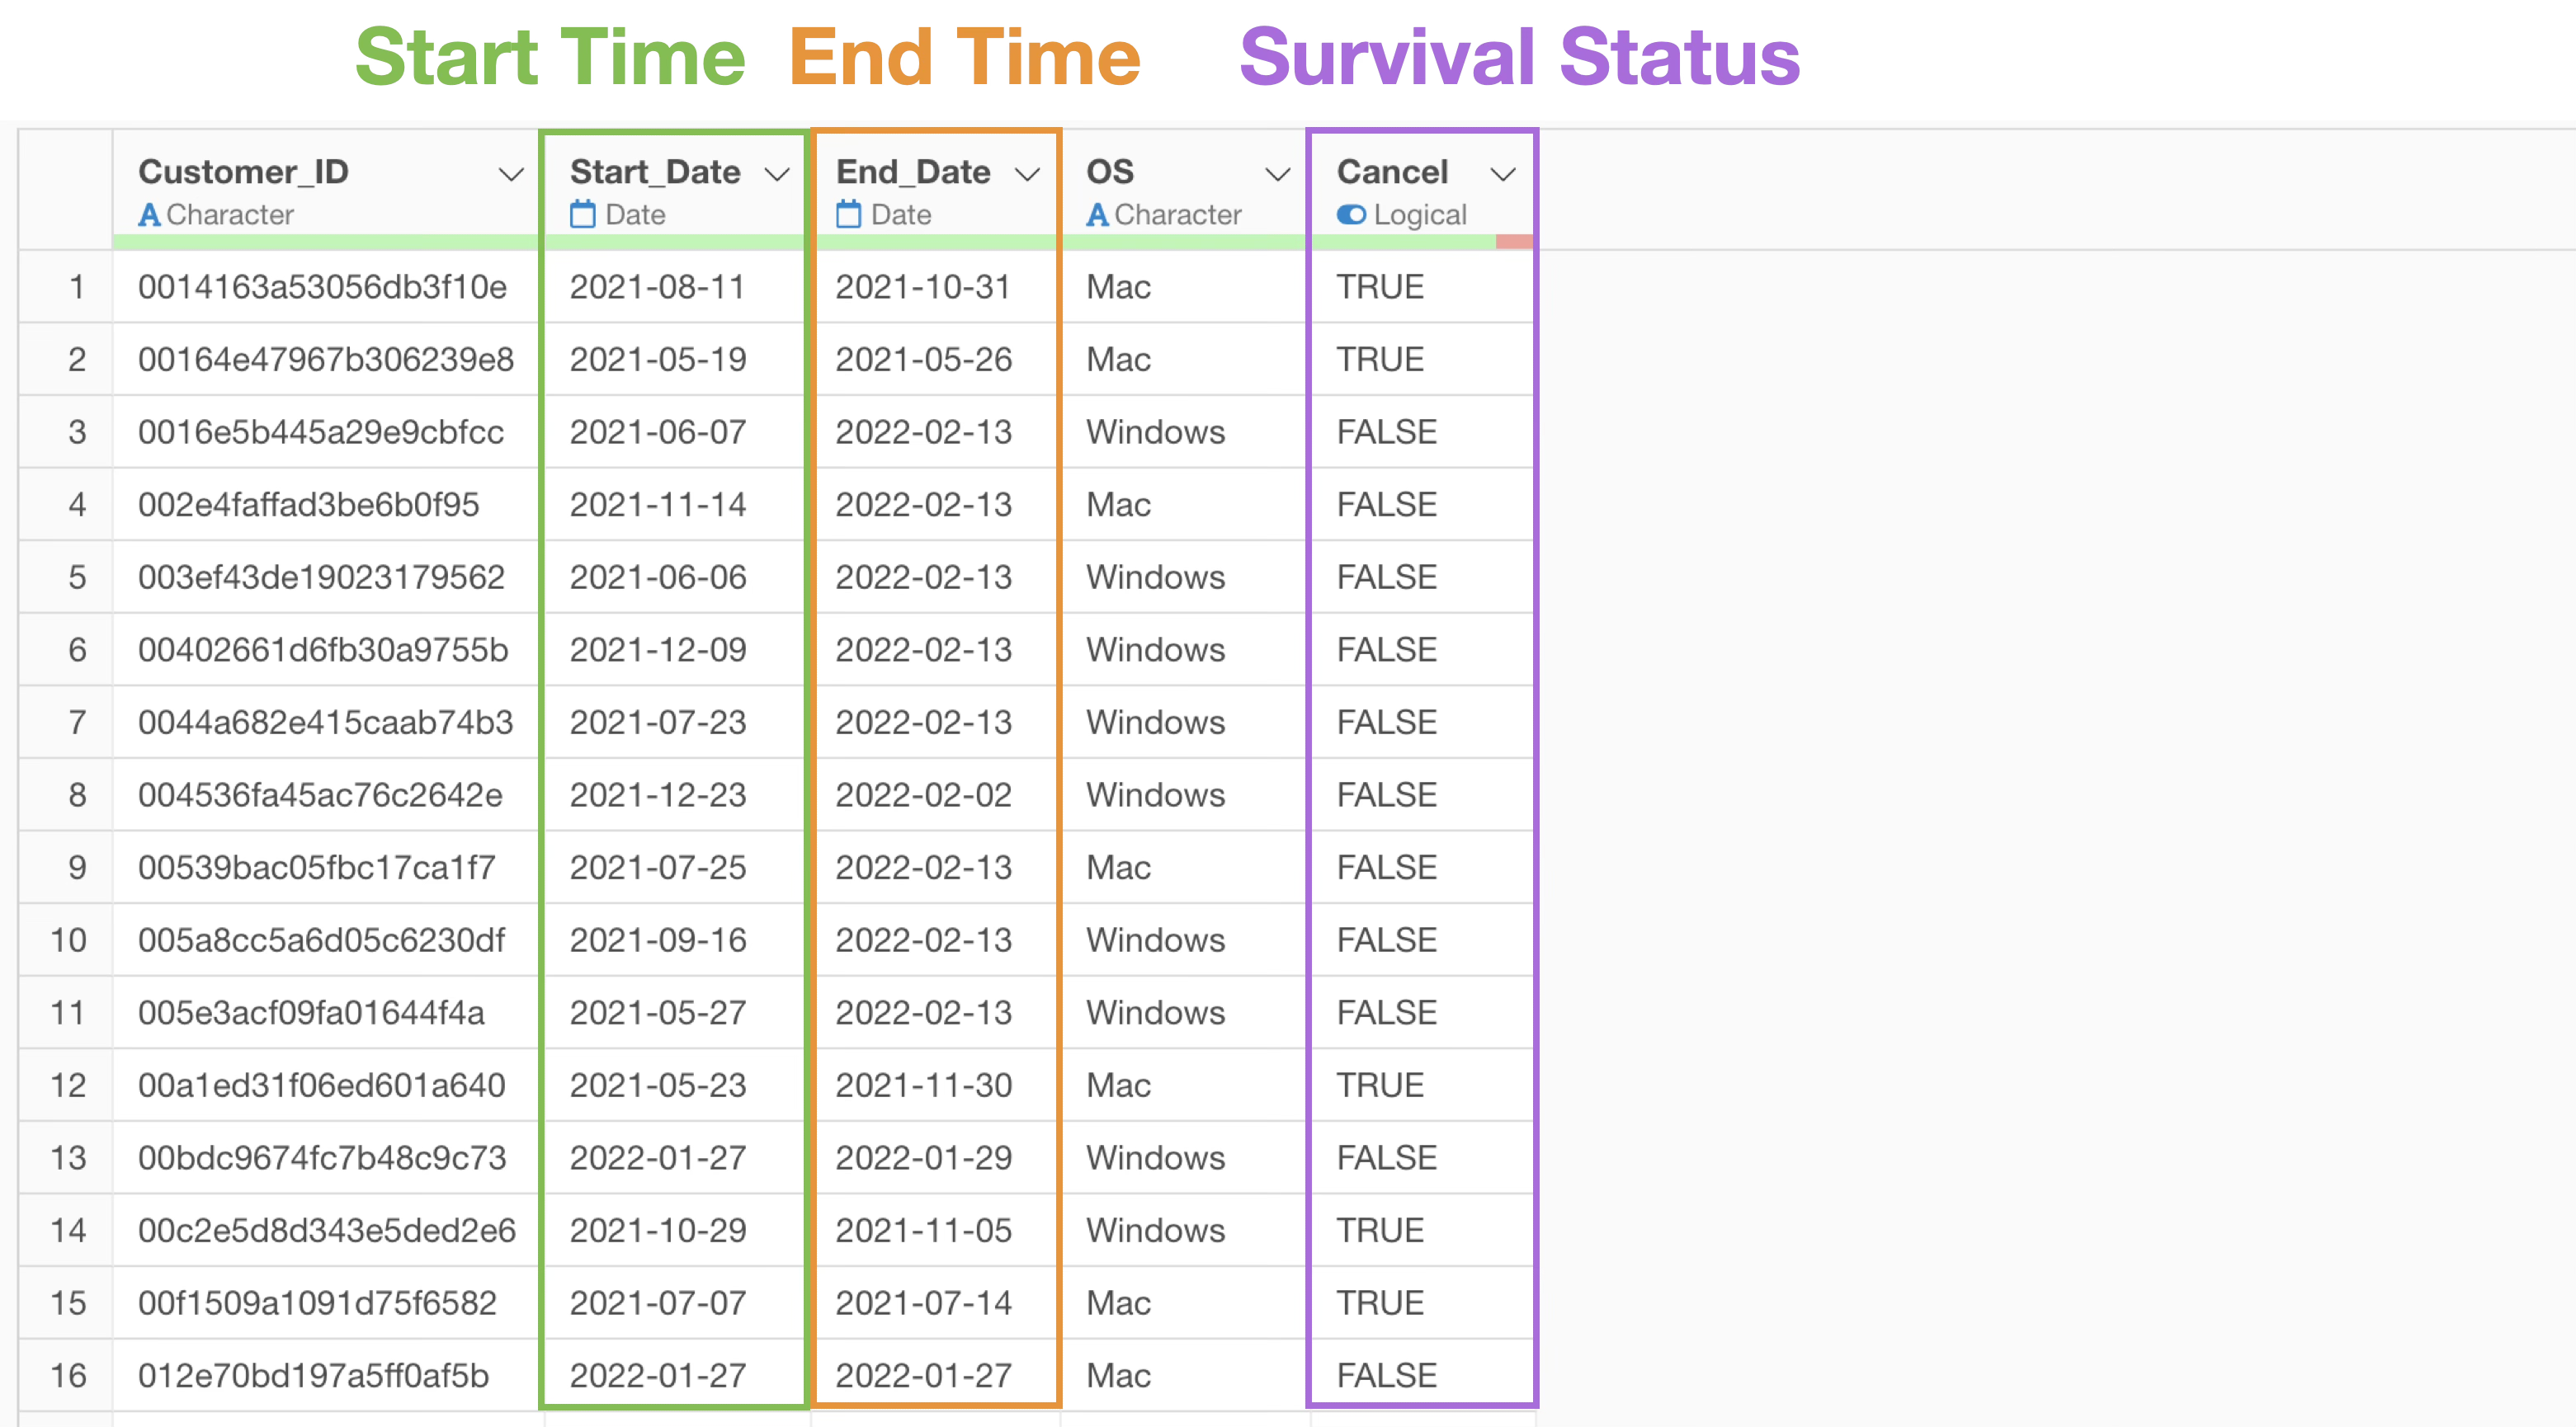
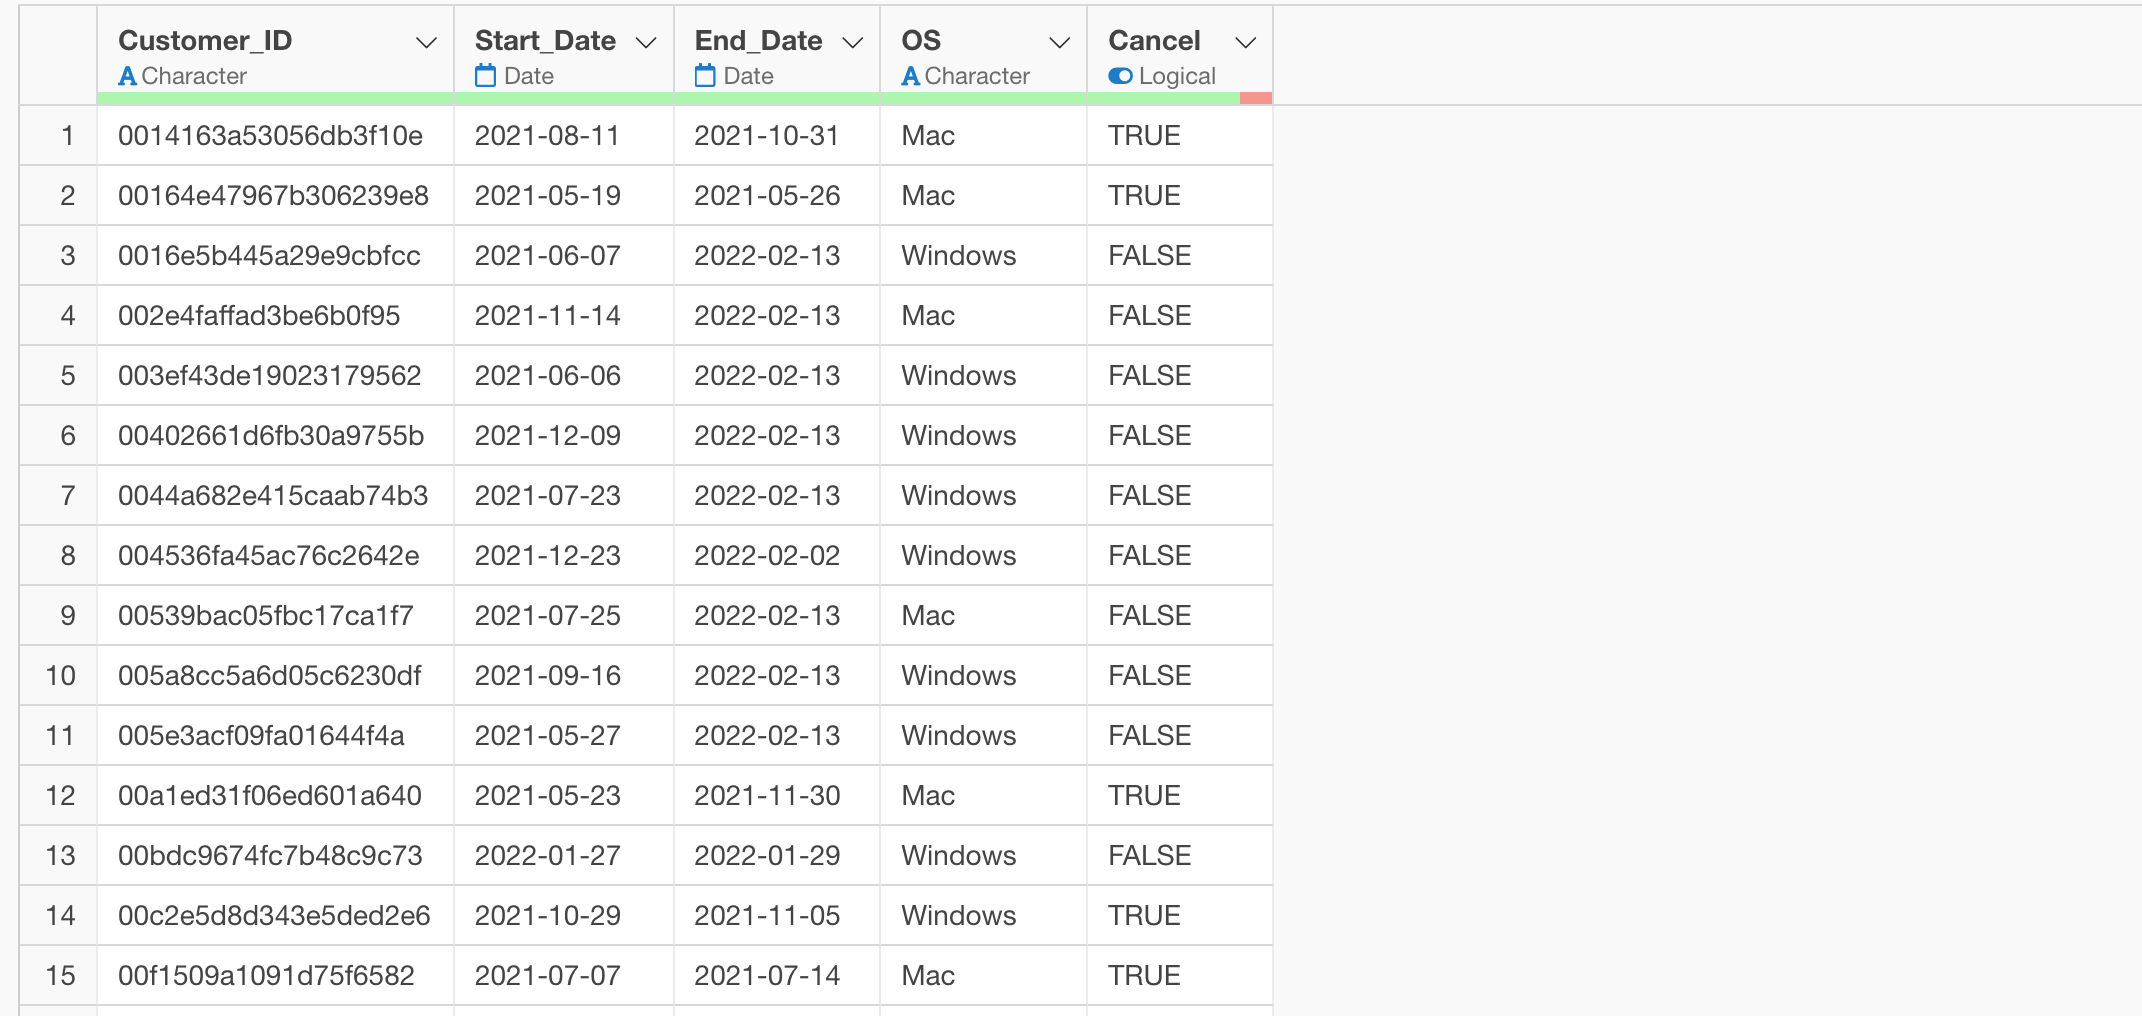
Sample Data
For this example, we will use sample data on Web Service Usage.
This dataset has one row per customer, and includes:
- Customer_ID: unique identifier for each customer
- Start_Date: service start date
- End_Date: service end date
- OS: OS used
- Cancel: Whether the service was canceled (TRUE/FALSE)
Running Survival Analysis
In the Analytics View, set Type to Survival Curve.

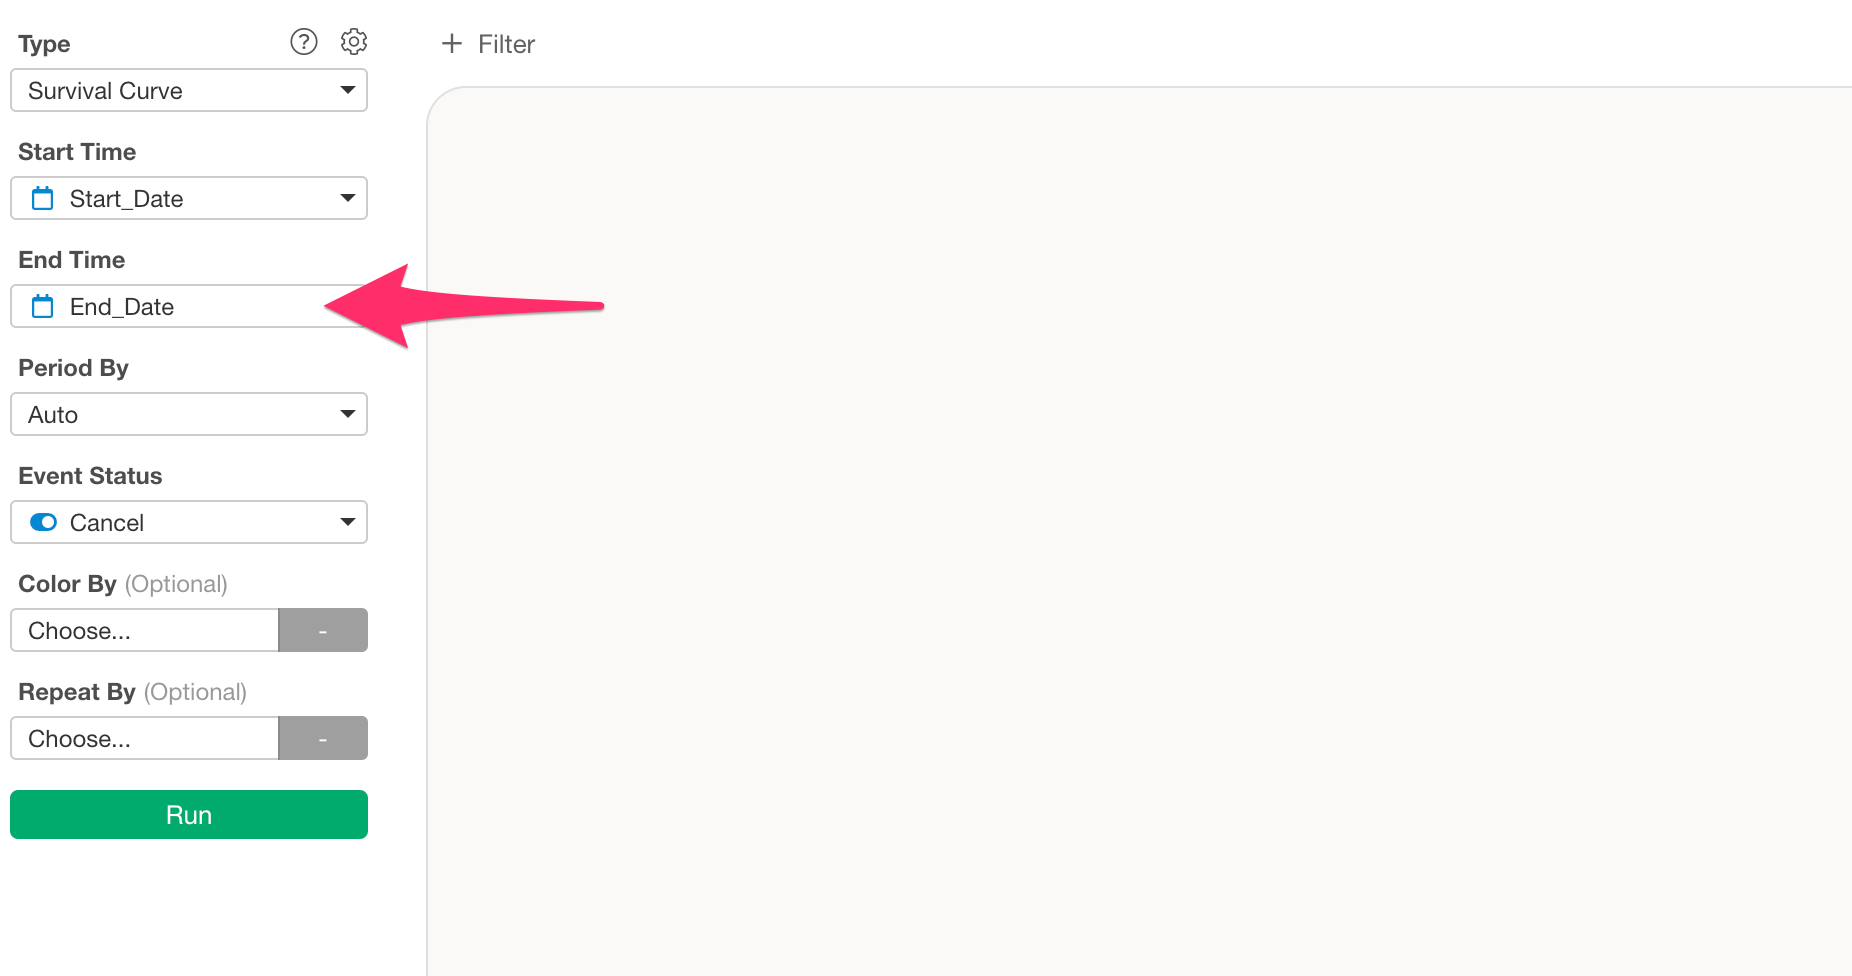
For Start Time, select Start_Date.
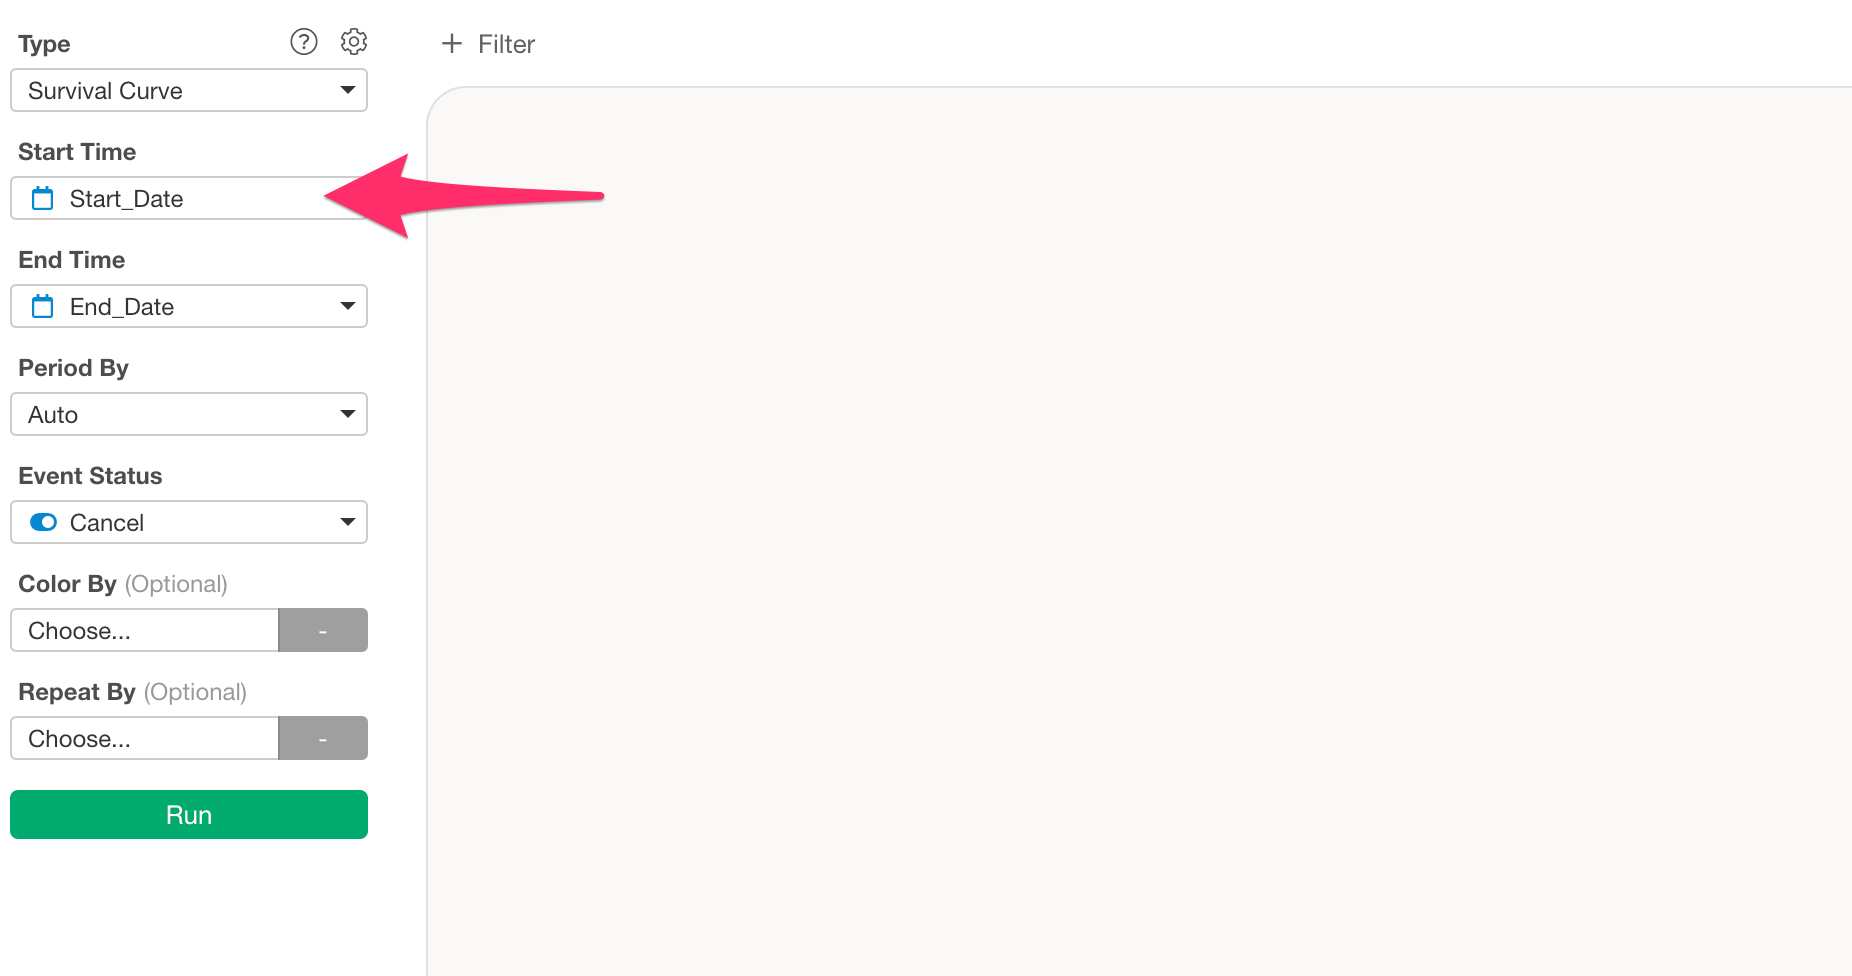
For End Time, select End_Date.
For Period By, choose the time unit for survival duration. The default is Auto, which automatically selects the optimal unit. We will use Auto for this time.

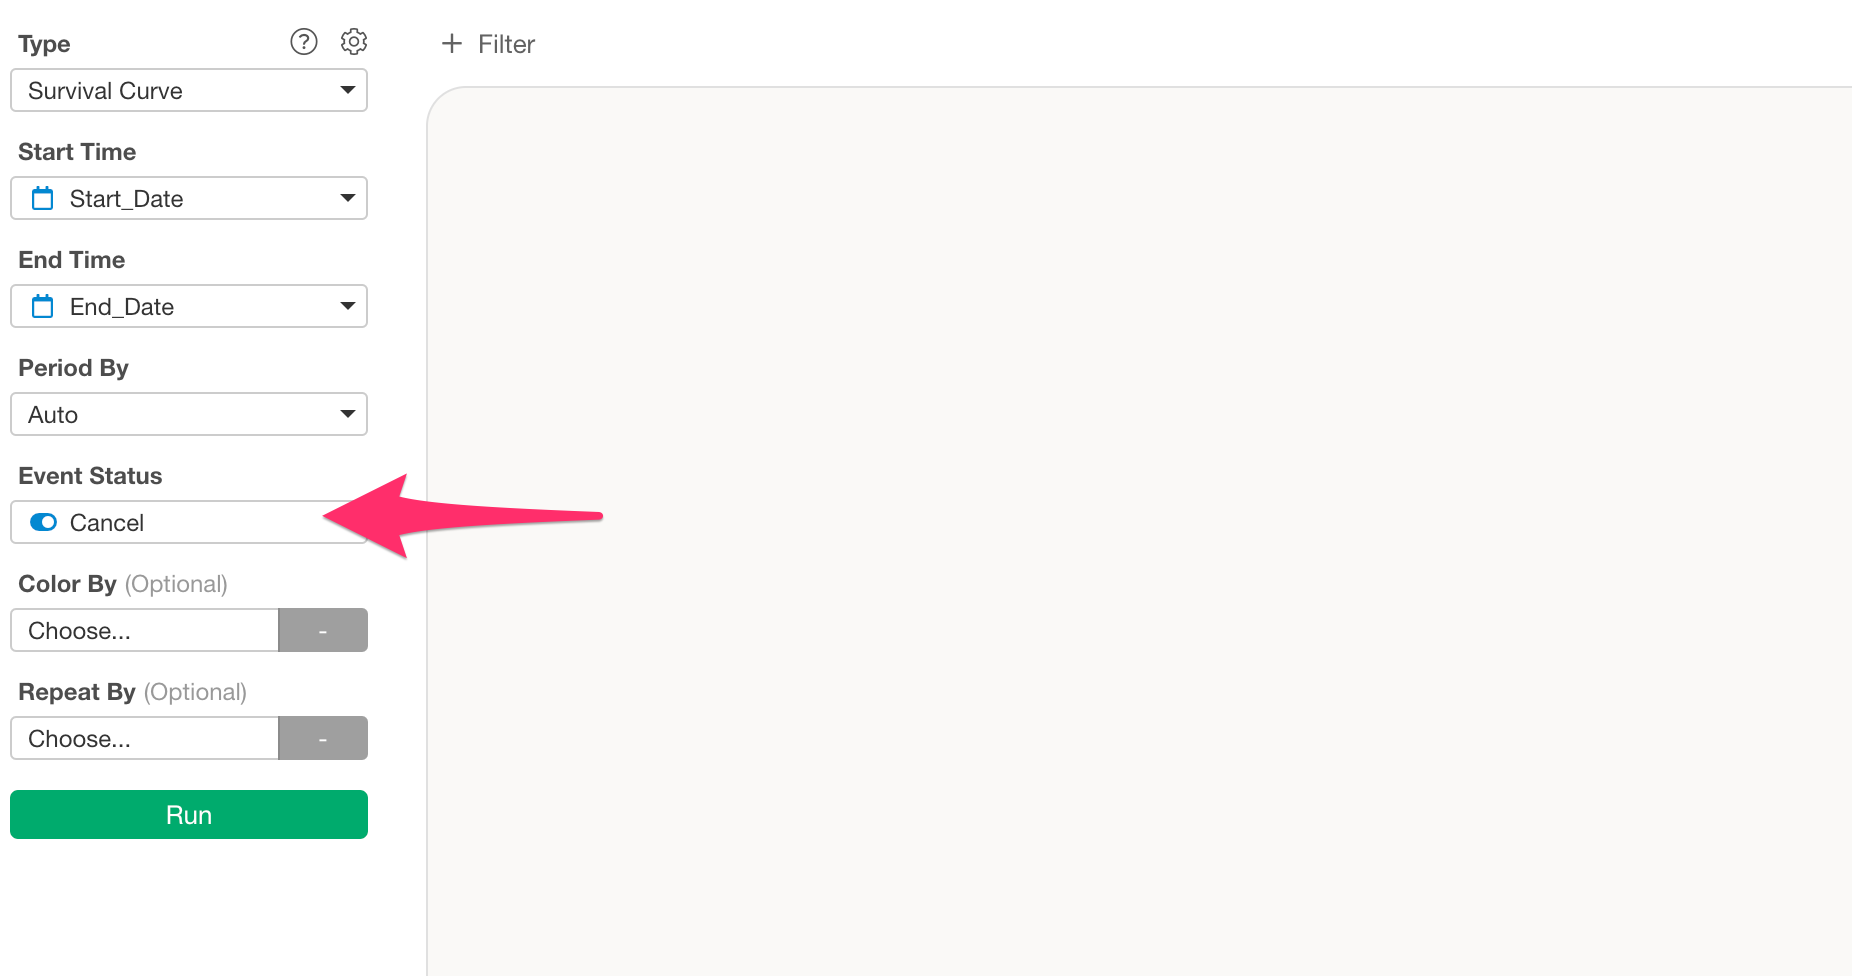
For Event Status, choose Cancel.
If you want to compare groups, set Color By
(Optional) to a grouping column. In this example,
os is selected, and then Run is clicked to
execute the analysis.

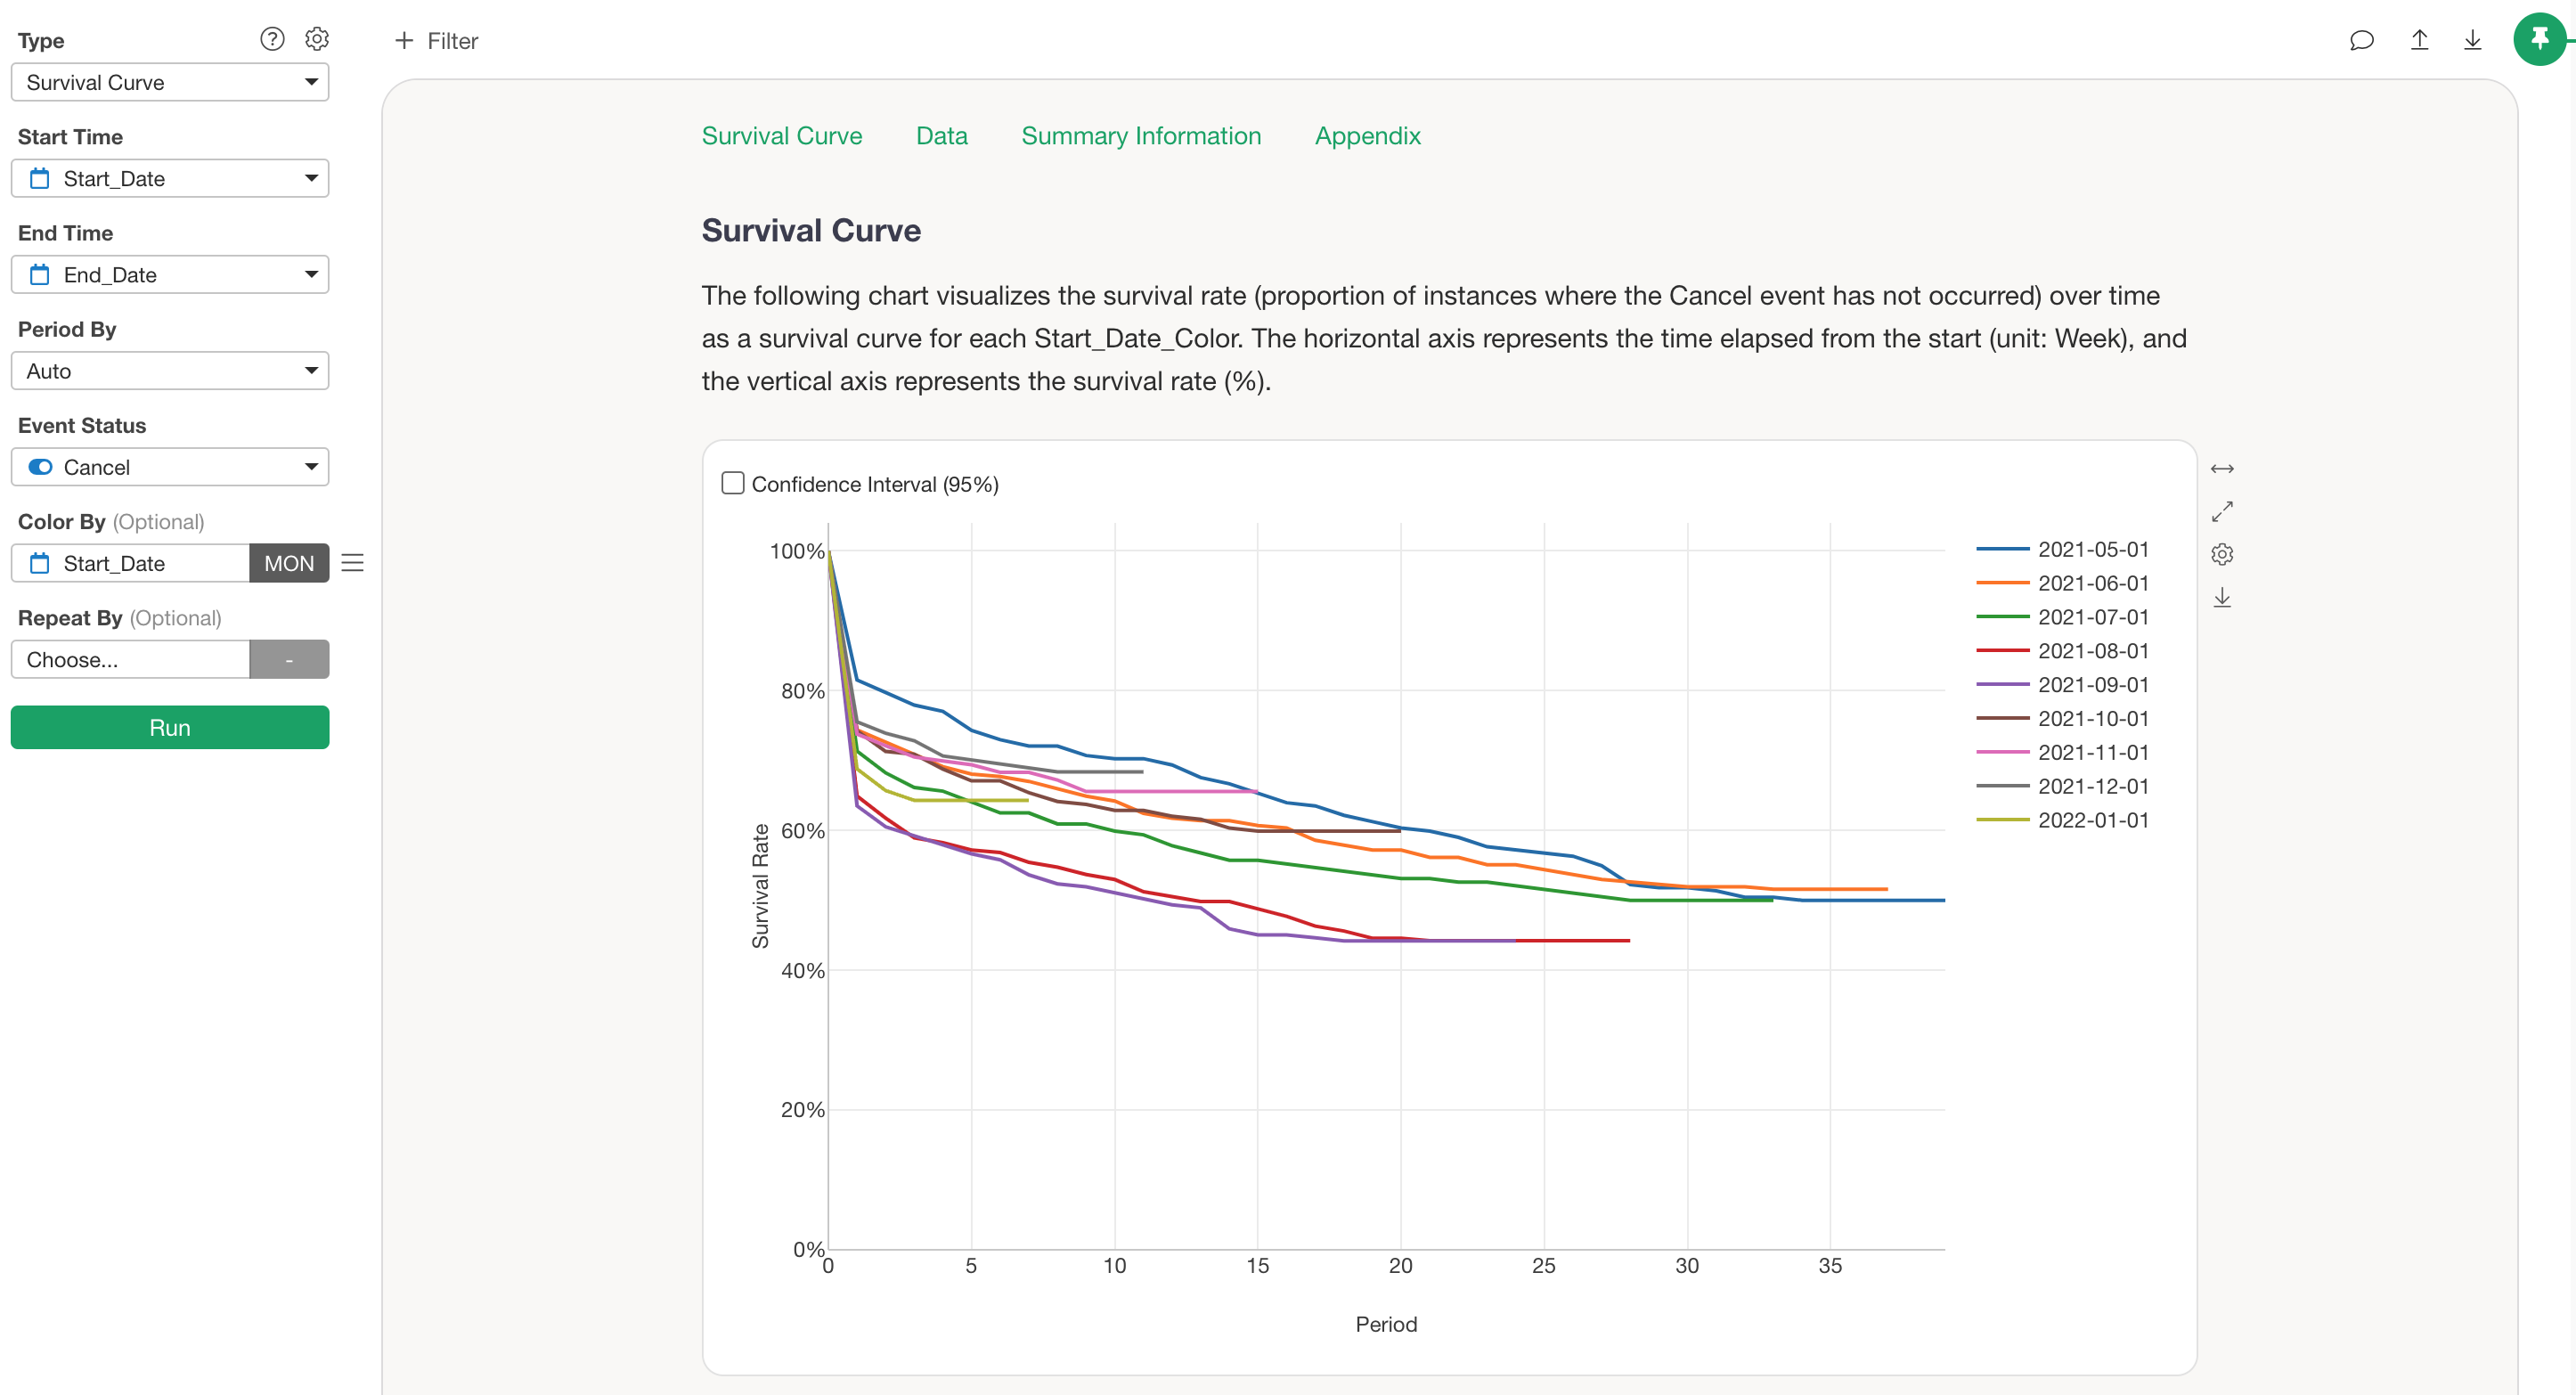
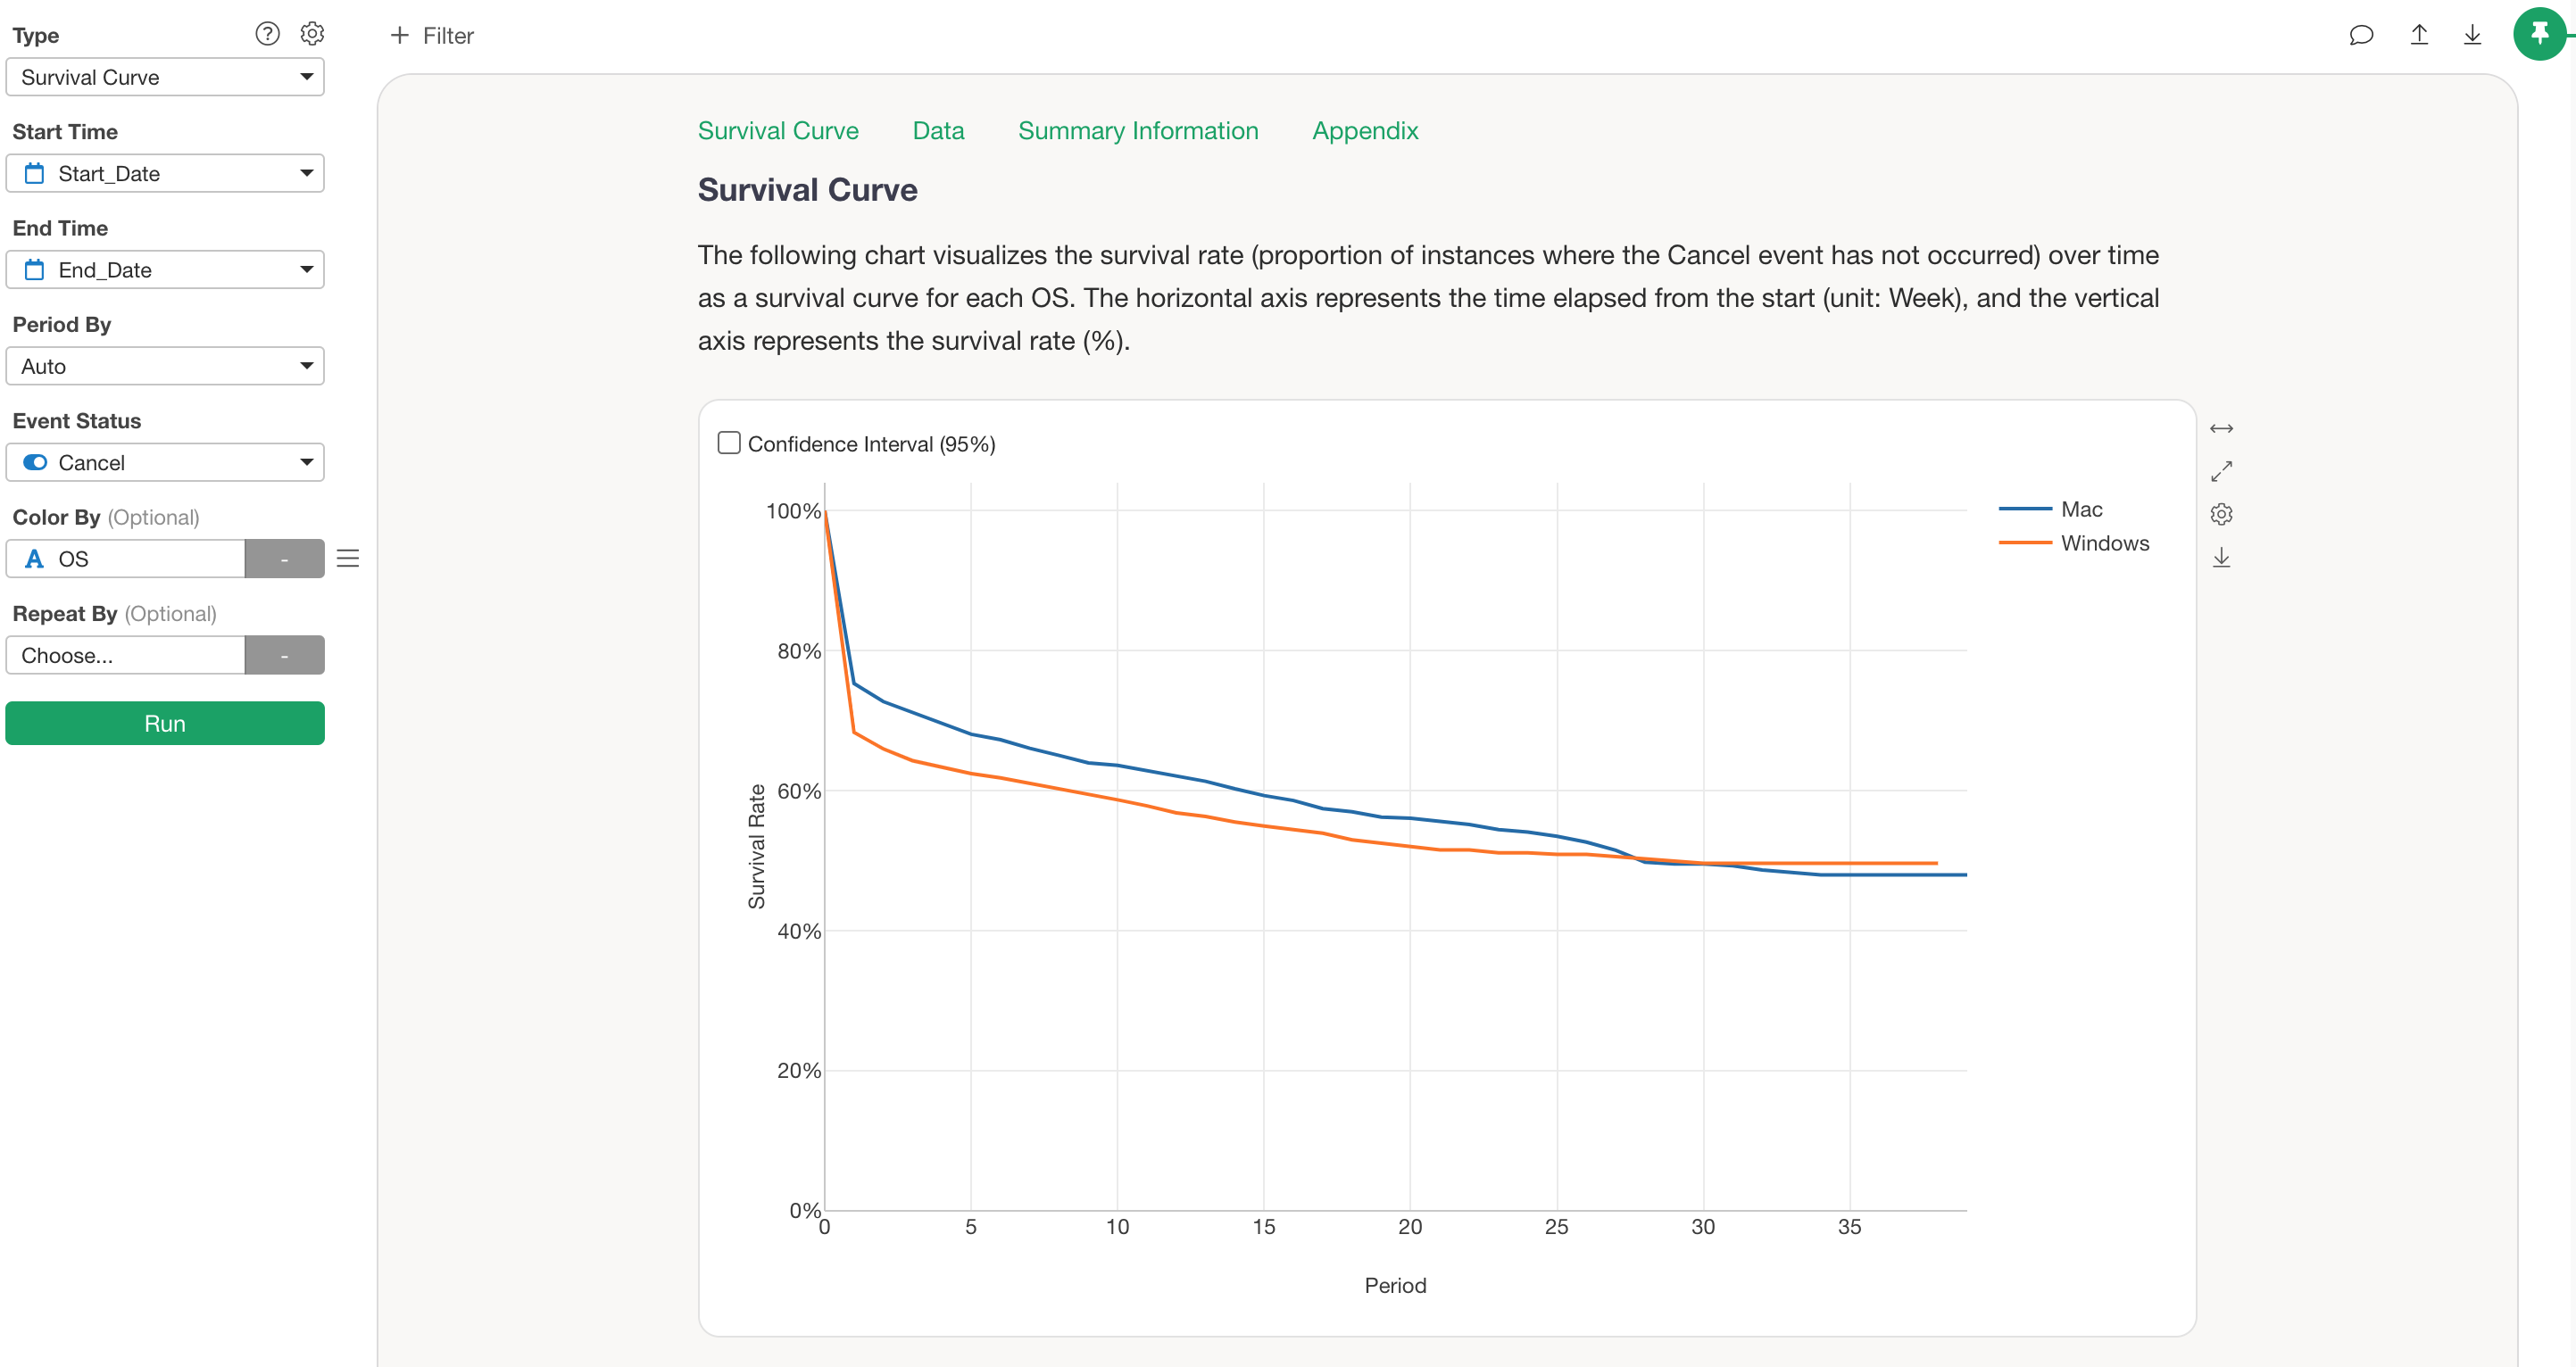
A survival curve will then be drawn.
Interpreting Results
Survival Curve
Survival Curve shows, as a line chart, the proportion of subjects that have not experienced the event (e.g., cancellation, resignation) over elapsed time.
If you select a column for Color By (Optional), separate survival curves will be drawn for each category.

Checking Confidence Interval (95%) will display the confidence interval for each curve.
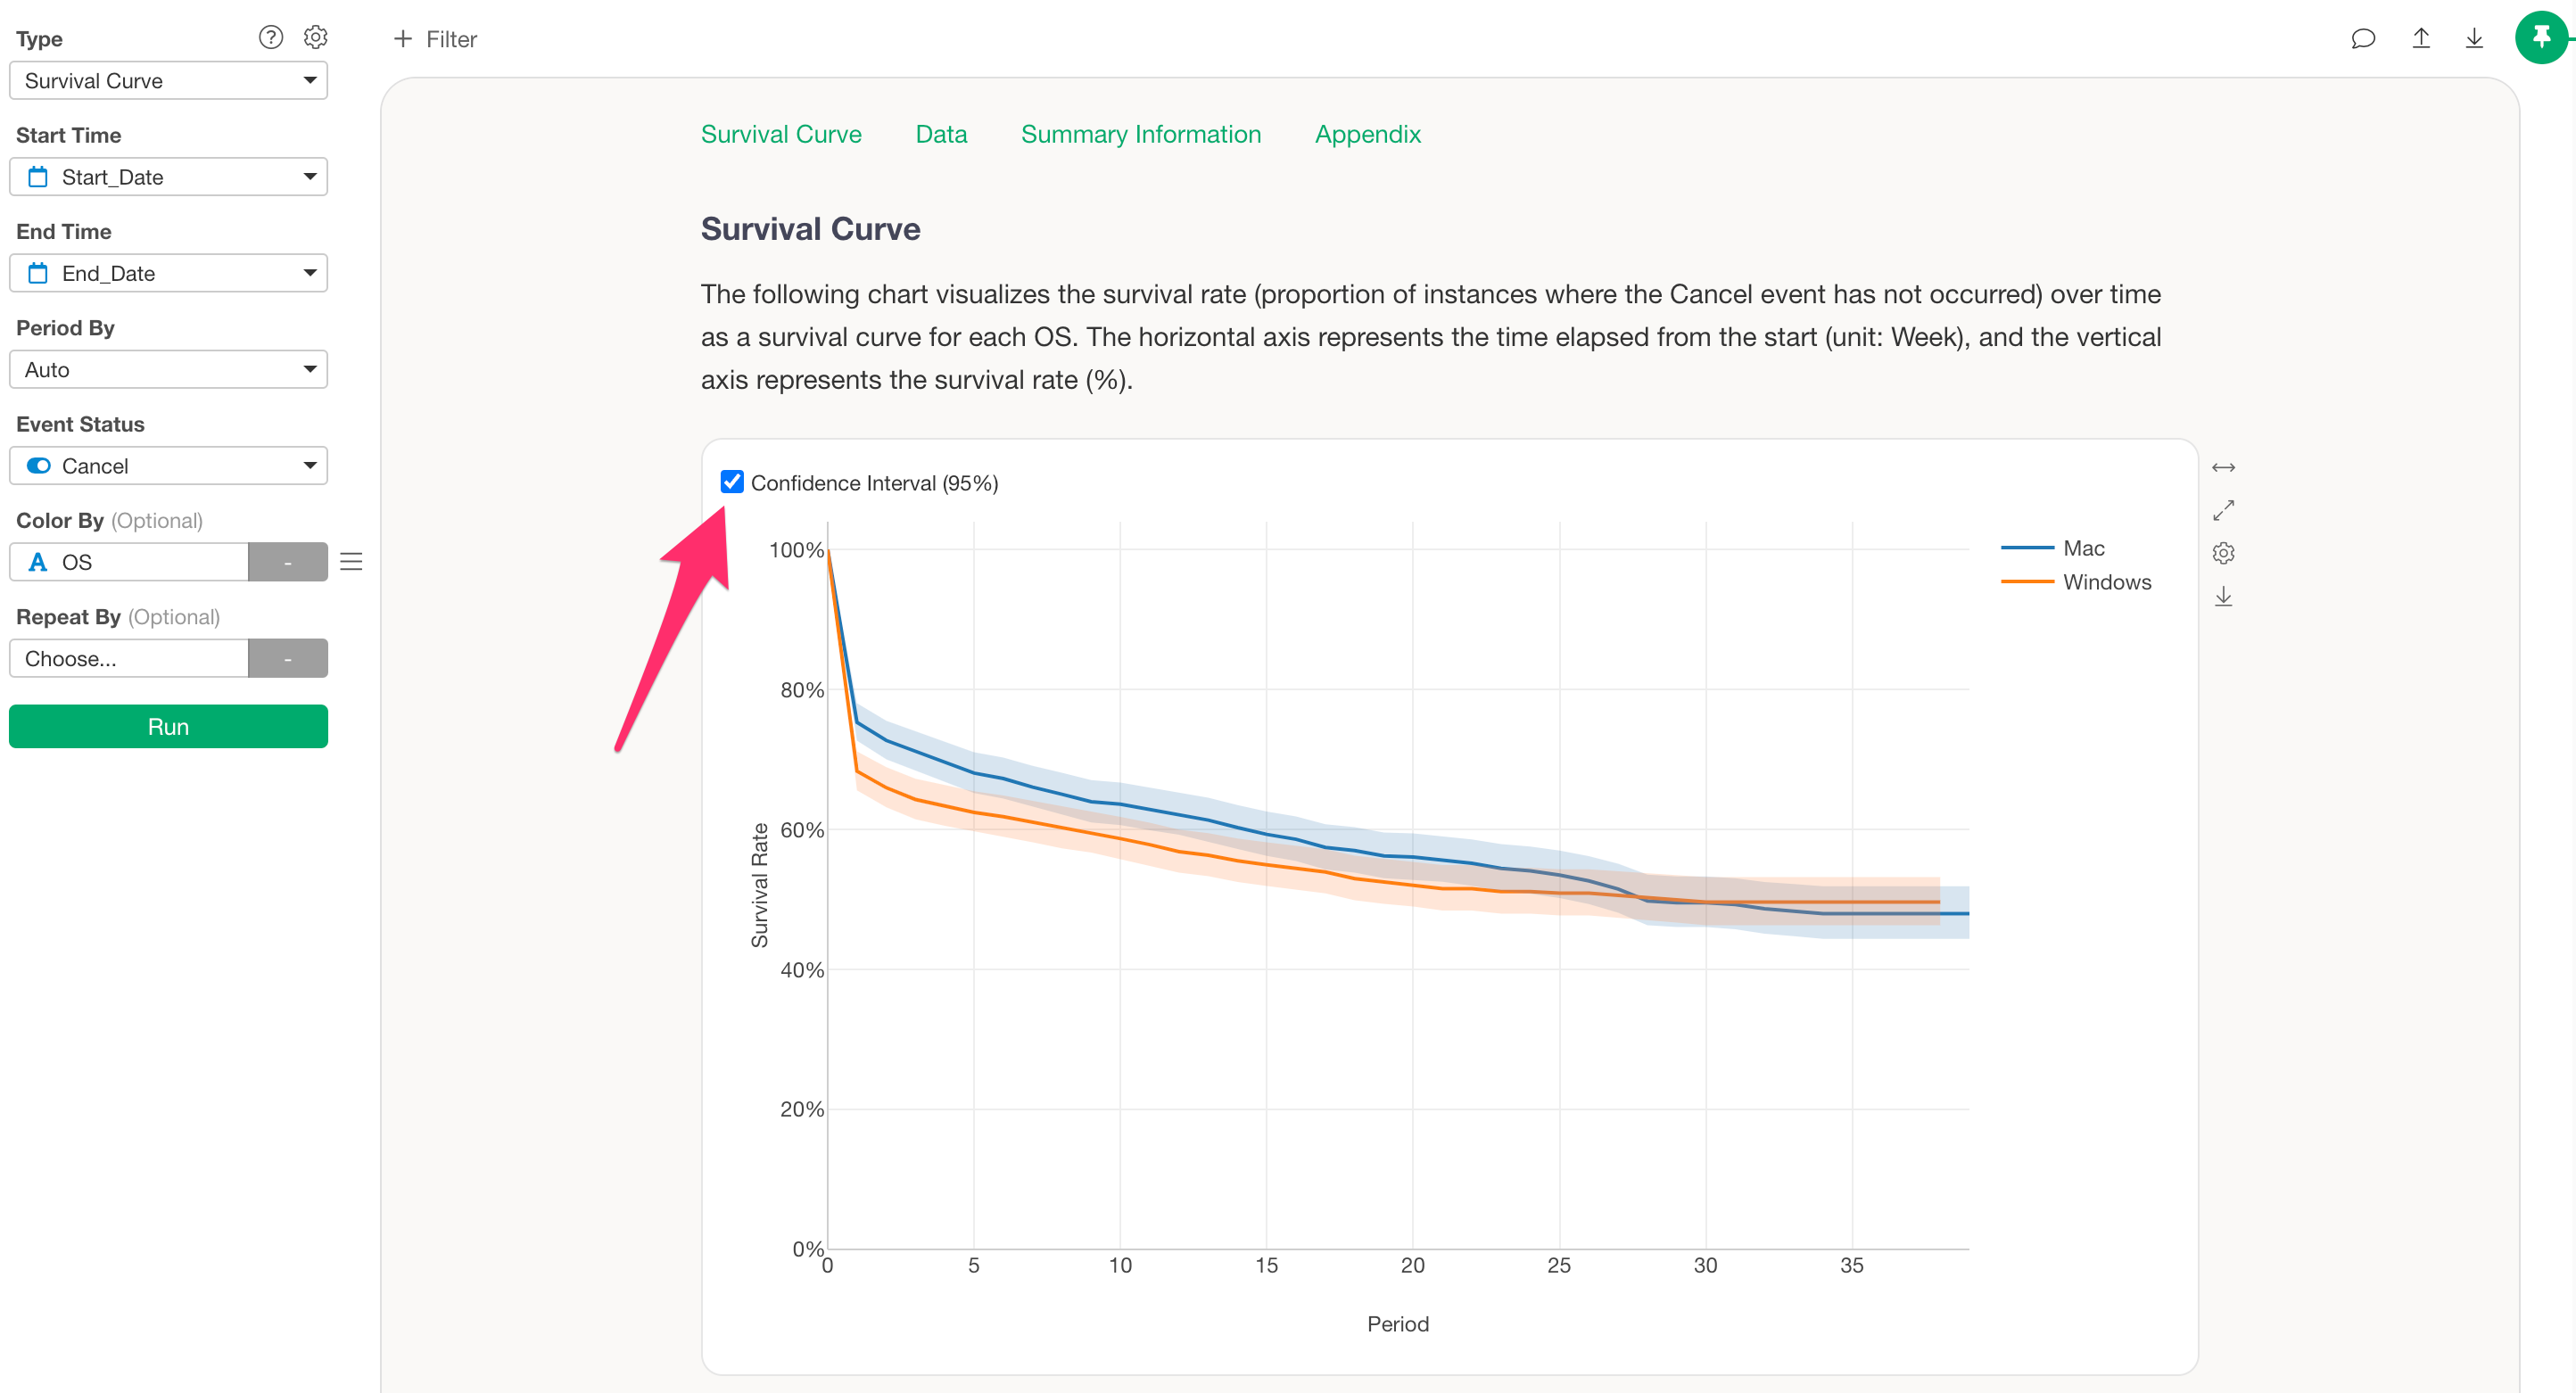
In this example, the confidence intervals for the Mac
and Windows groups overlap, indicating no significant
relationship between os and survival curves.
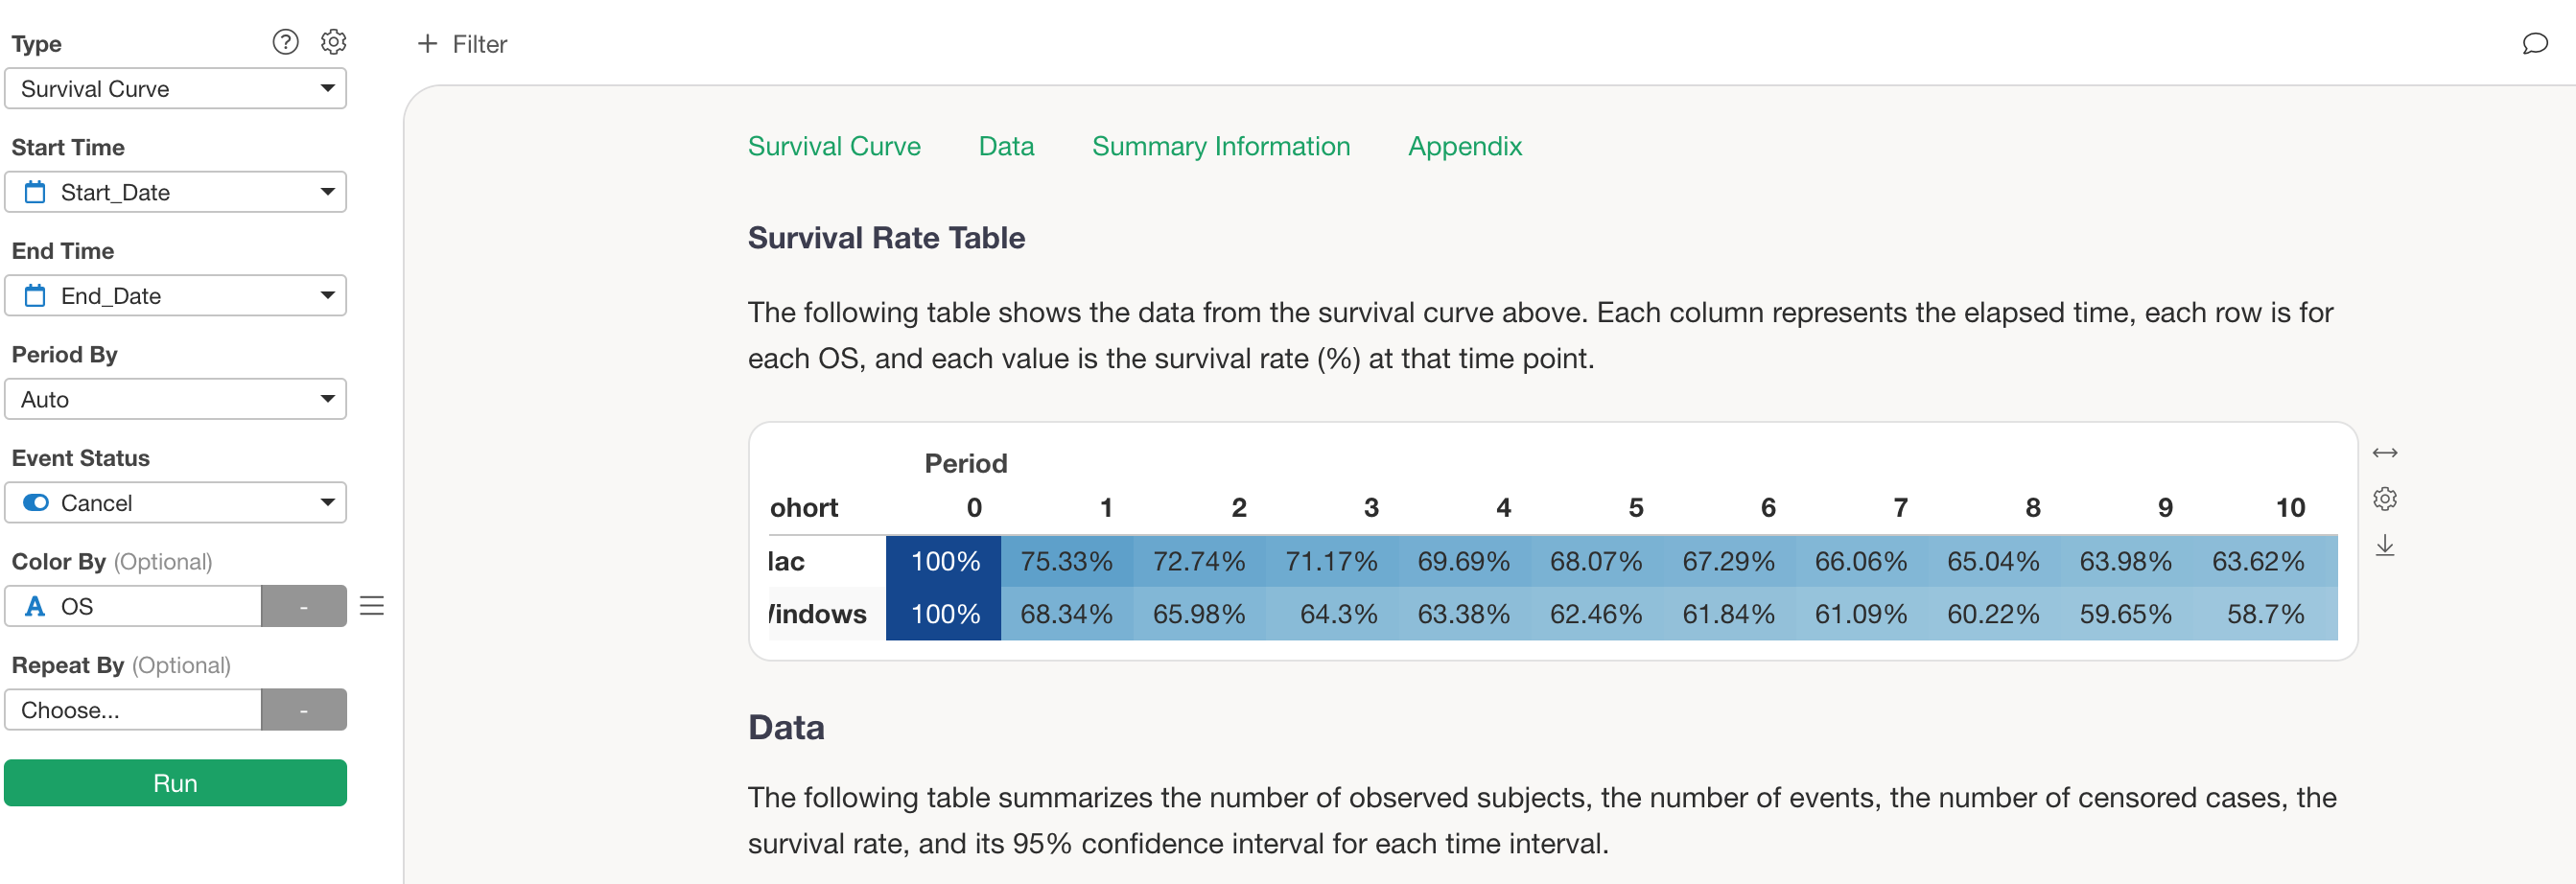
Survival Rate Table
Survival Rate Table shows a color-coded table of how many subjects survived without experiencing the event over time.
Data
Data displays the underlying data used to draw the survival curve.
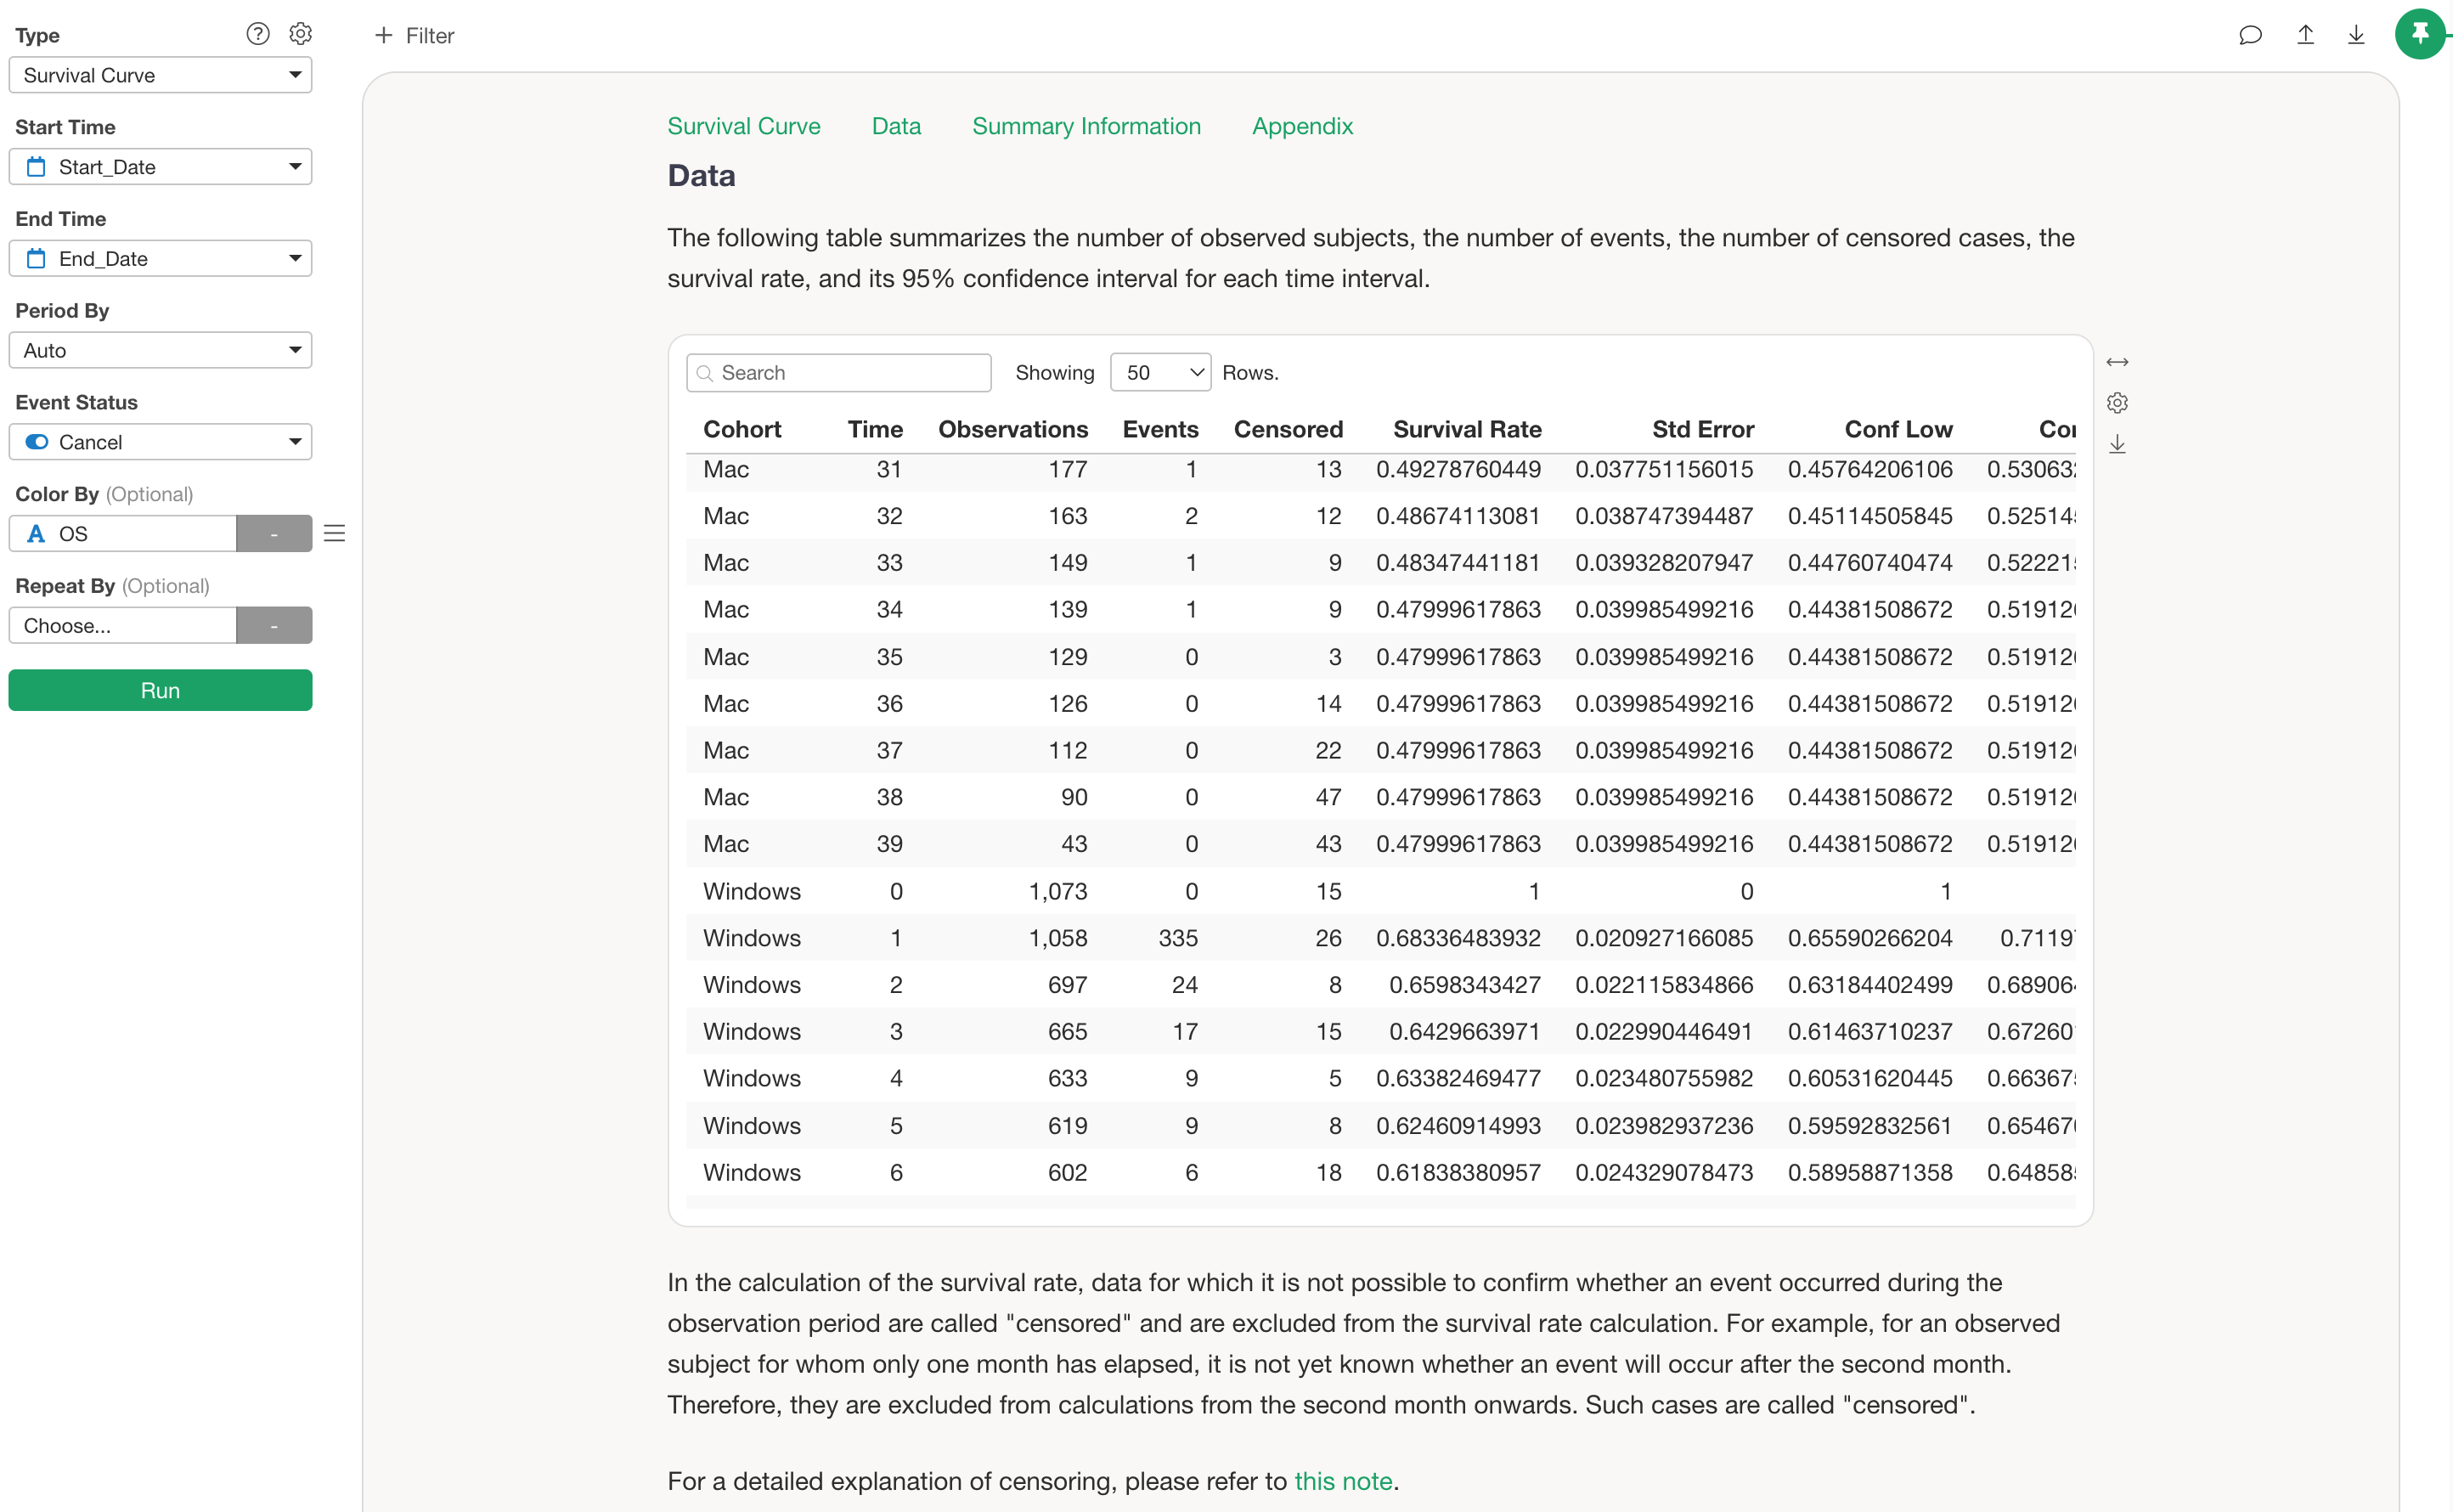
Columns include:
Cohort - (Optional) The group value selected for Color By (Optional)
Survival Time - (e.g., days since signup)
Observations - Number of subjects still event-free at the start of the time interval
Events - Number of events in that interval
Censored - Number of subjects censored in that interval
Survival Rate - Survival probability at the end of the interval (used for the curve)
Standard Error - Standard error of the survival rate
Conf Low - Lower bound of the survival rate confidence interval
Conf High - Upper bound of the survival rate confidence interval
Summary Information
Summary appears only when a column is selected for Color By (Optional).
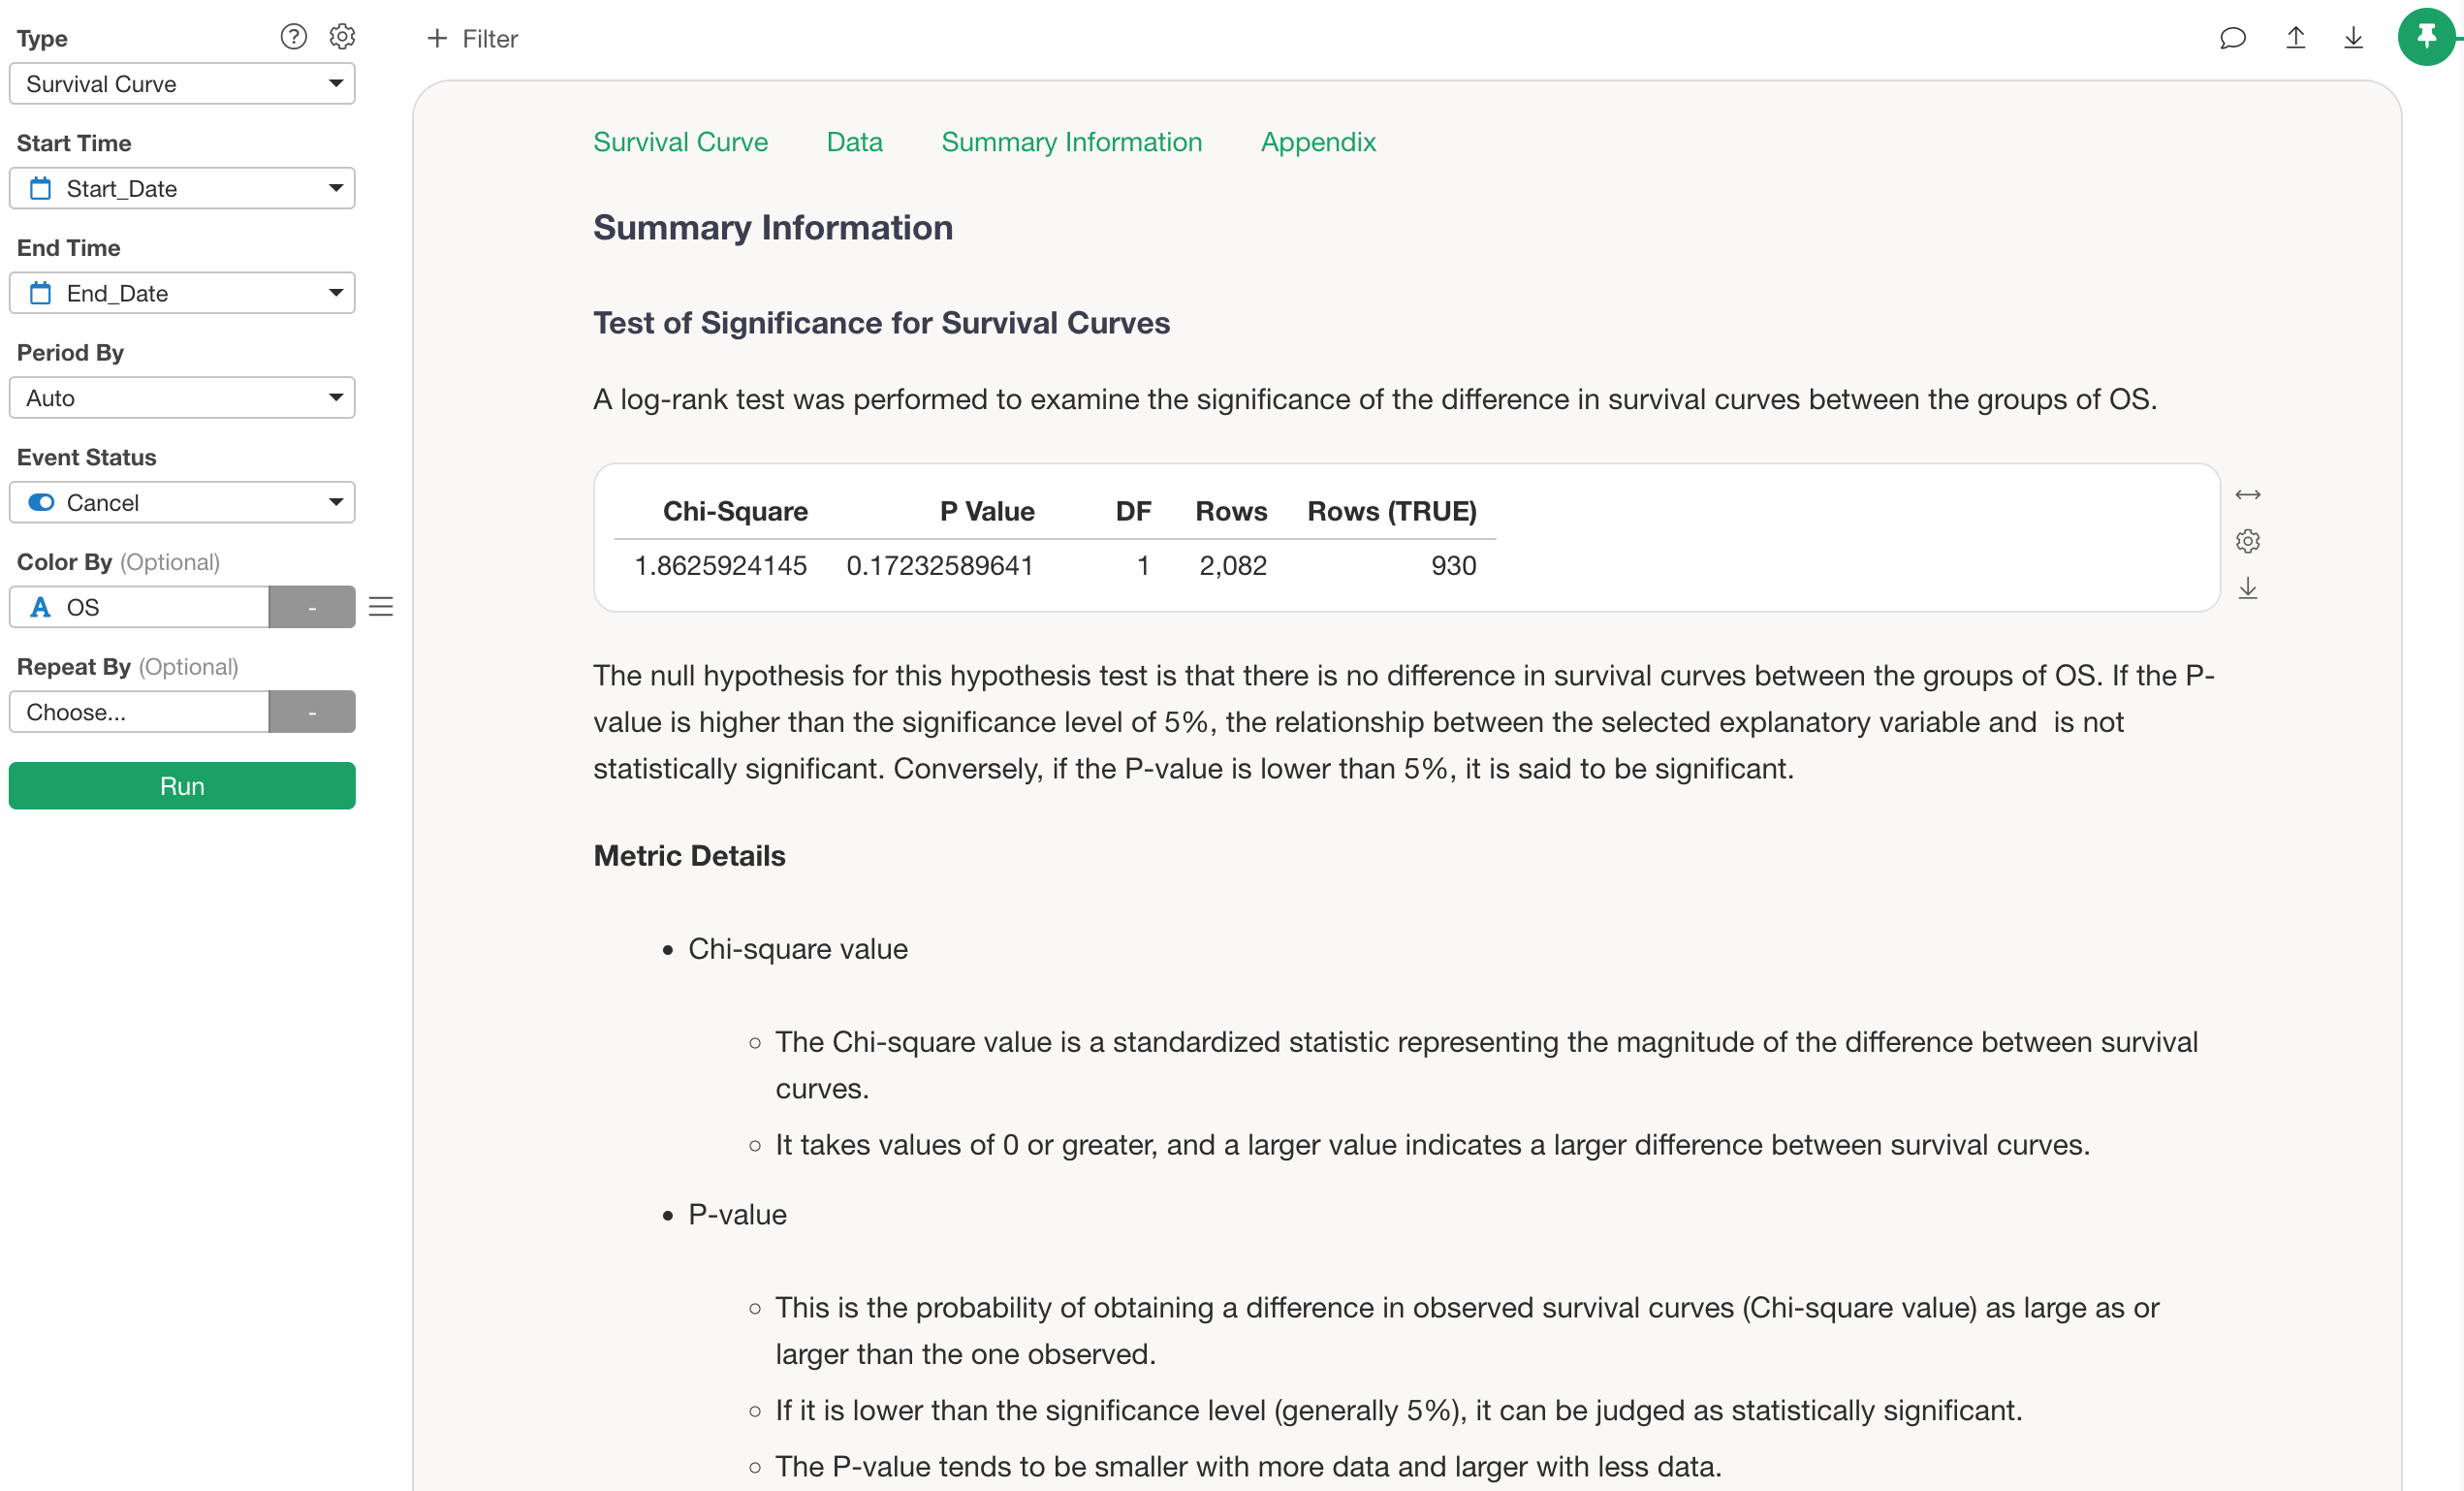
P Value represents the probability of obtaining the observed difference in survival curves under the assumption that there is no real relationship between the group from log-rank test.
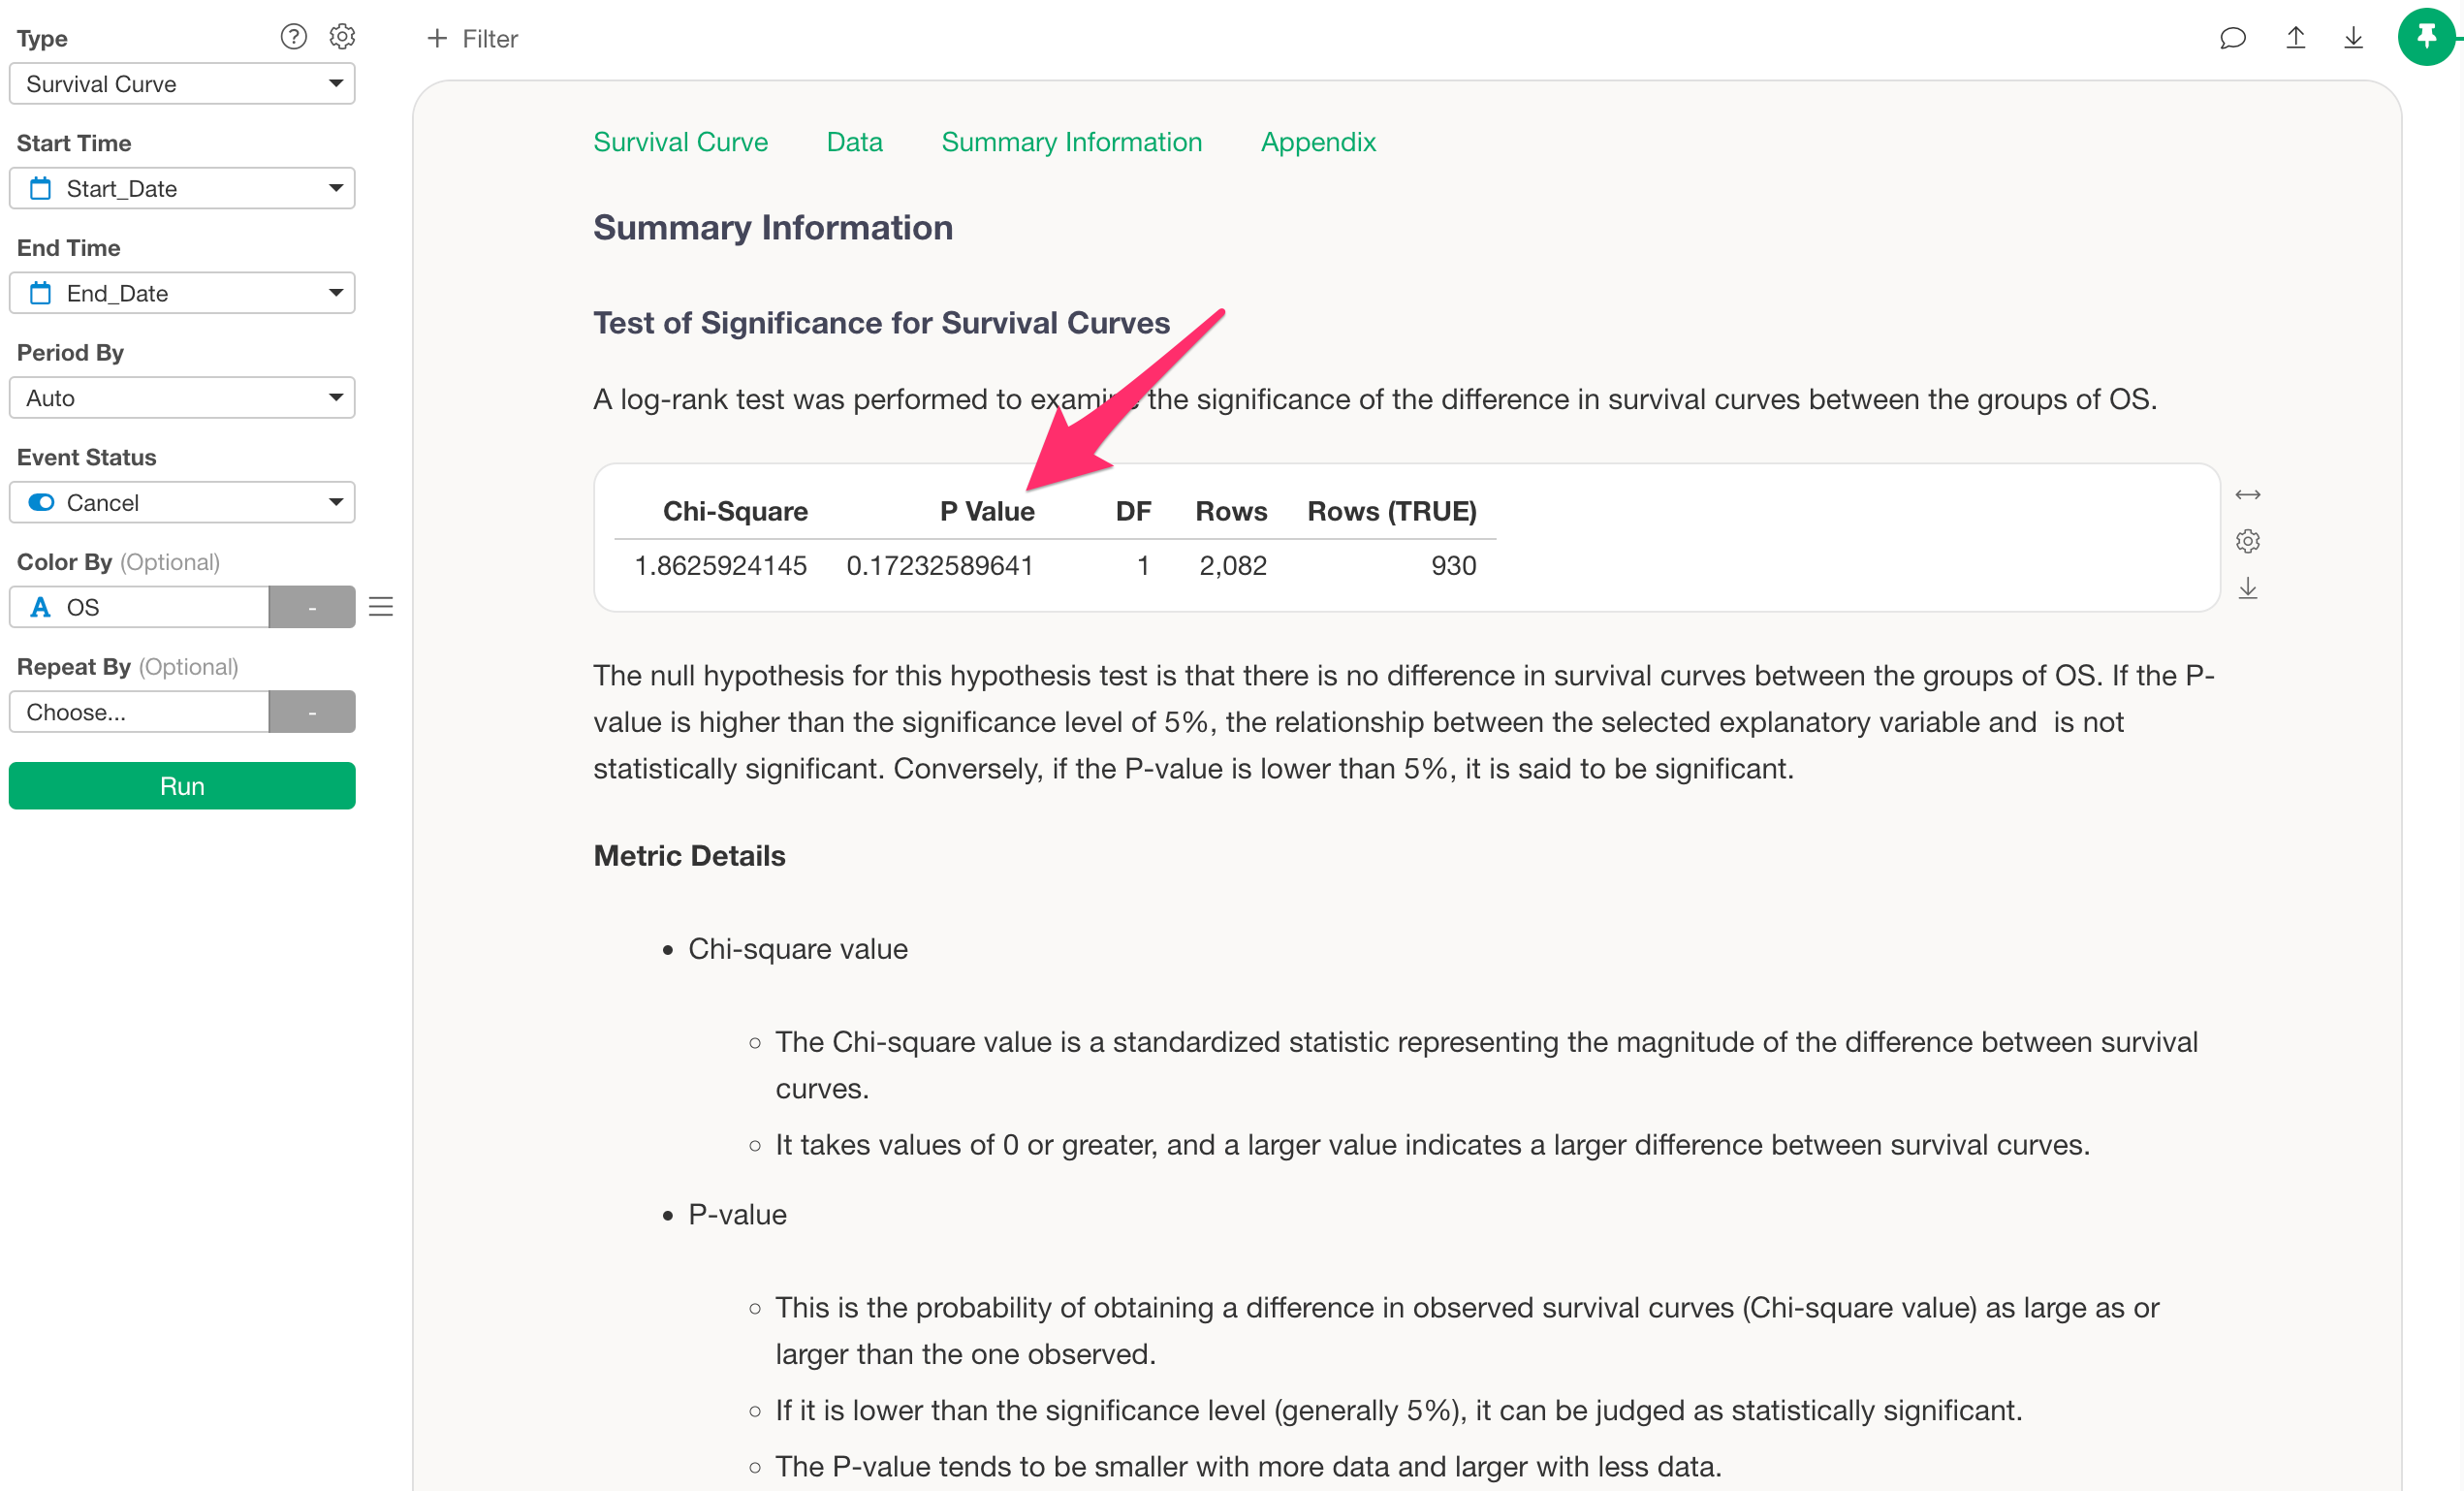
If the p-value is ≤ 0.05 (5%), the difference between the groups’ survival curves is statistically significant.
In our example, the p-value is 0.17, so we cannot say there is a significant relationship between OS and the survival curves.
FAQ on Survival Curves
Q: How are the “Month” and “Year” time units calculated?
In Exploratory’s survival curve, you can specify the unit of the period for drawing the survival curve from Period By.
This Period By is calculated from the number of days in the survival period, which is obtained by subtracting Start Time from End Time.
For example, the number of days per month, considering leap years, is
calculated as the average number of days in a month by dividing
365.25 by 12 months as follows:
30.4375 = 365.25 (days) / 12 (months)If the survival period is 90 days, it is calculated as follows, resulting in about 2.96 months, meaning survival did not reach the third month:
2.95687885 (months) = 90 / 30.4375Also, when “Year” is selected for Period By, the
number of survival days is divided by 365.25 to obtain the
survival time in years.
Q: What is “Censored”?
Let’s take a subscription-based business as an example.
If we assume that the current month is April 2024, a person who started using the service in January 2024 has only been using it for 3 months (January, February, March), so we do not know whether they will continue in the 4th month.
Such subjects for whom data does not exist up to the observed survival period are called “censored” and are excluded from the calculation of the survival rate for that period.
Q: The censoring or event occurs one interval earlier than expected
In most cases, this question can be resolved by understanding the calculation method for the time unit of the survival period explained above.
For example, suppose we have the following data:
| userid | Start Time | End Time | Event | Survival Period (days) |
|---|---|---|---|---|
| a | 2020/1/1 | 2020/6/30 | TRUE | 181 |
| b | 2020/7/1 | 2020/12/31 | FALSE | 183 |
| c | 2020/1/1 | 2020/12/31 | FALSE | 365 |
| d | 2020/1/1 | 2020/12/31 | TRUE | 365 |
Looking at the start and end dates, userid a seems to
have survived for 6 months, so it may seem that the event occurred in
the 7th month.
However, their survival period is 181 days.
The “Month” unit of the survival period is calculated by dividing the
number of survival days by the average number of days in a month,
considering leap years, which is 30.4375. Therefore, the
survival period becomes 5.94 months, and the event occurs
in the 6th month.
Similarly, userid d appears to have survived for one
year, so it may seem the event occurred in the 13th month.
However, their survival period is 365 days.
The “Year” unit of the survival period is calculated by dividing the
number of survival days by the average number of days in a year,
considering leap years, which is 365.25.
Therefore, the survival period becomes about
0.999 years, meaning they did not survive a full year.
Q: What should be specified for missing end dates?
When you click the settings button, there is an option called “Fill NA for End Time Variable” which supports three types.
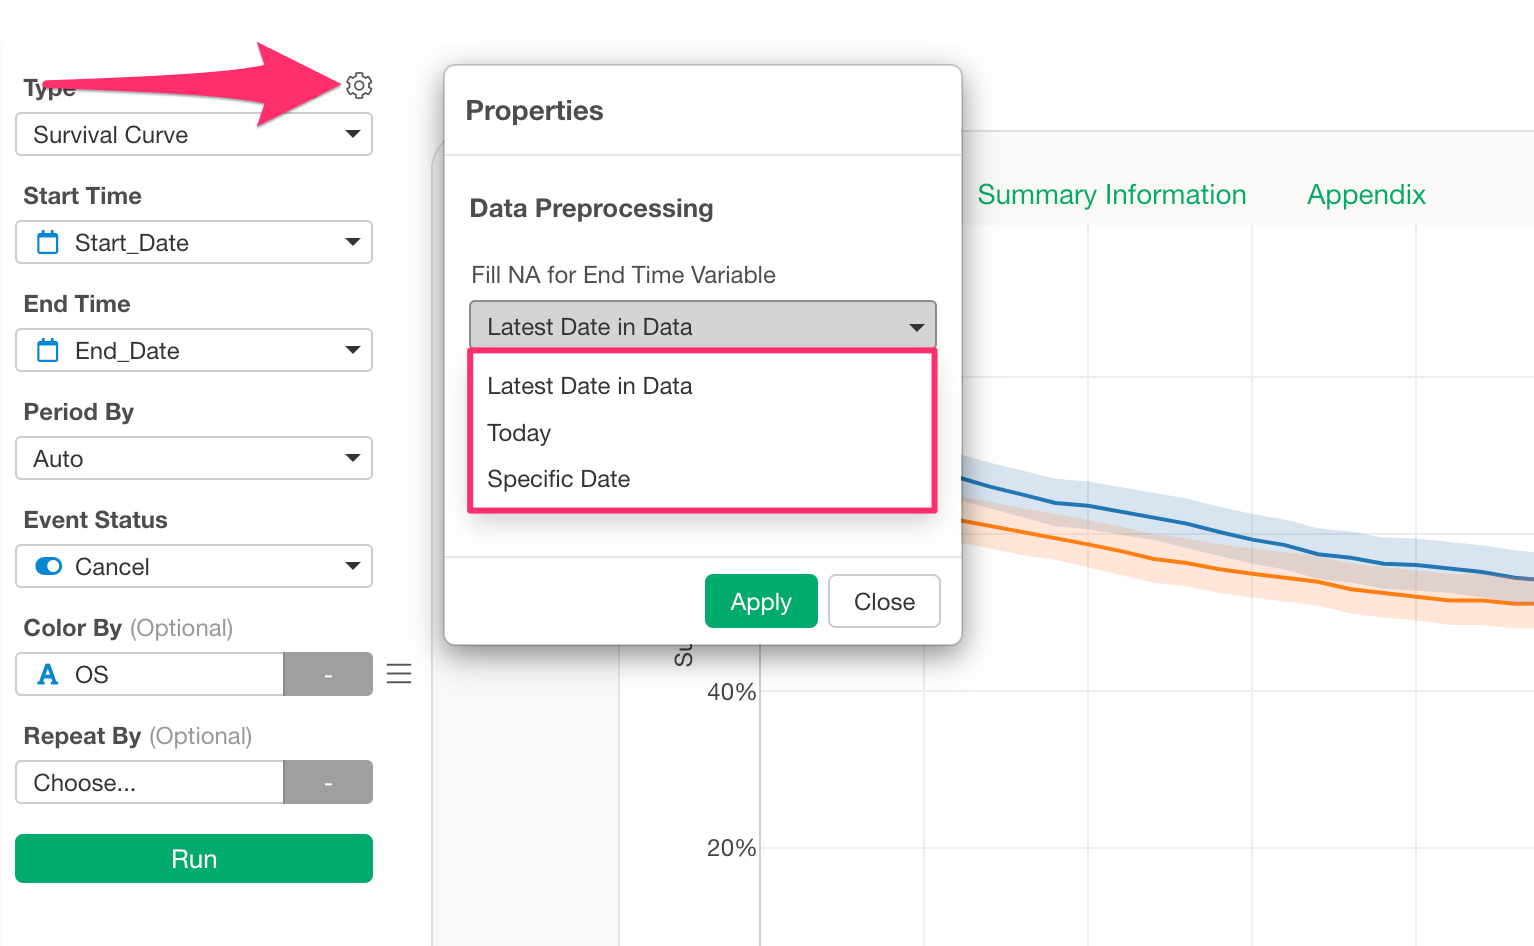
If your dataset is updated regularly, it is best to fill missing end dates with Today’s date.
If your dataset is not regularly updated and is checked only when needed, then “Latest Date in Data” or “Specific Date” may be better.
The “Latest Date in Data” will be the last date in the end date column. For example, if the last date is 2023-12-31, then that date will be used.