Introduction to Market Basket Analysis
This section introduces “Market Basket Analysis” in Analytics.
Market Basket Analysis allows you to analyze combinations of products that tend to be purchased together. For example, it can reveal insights such as “people who buy diapers also tend to buy beer.”
Required Data Format
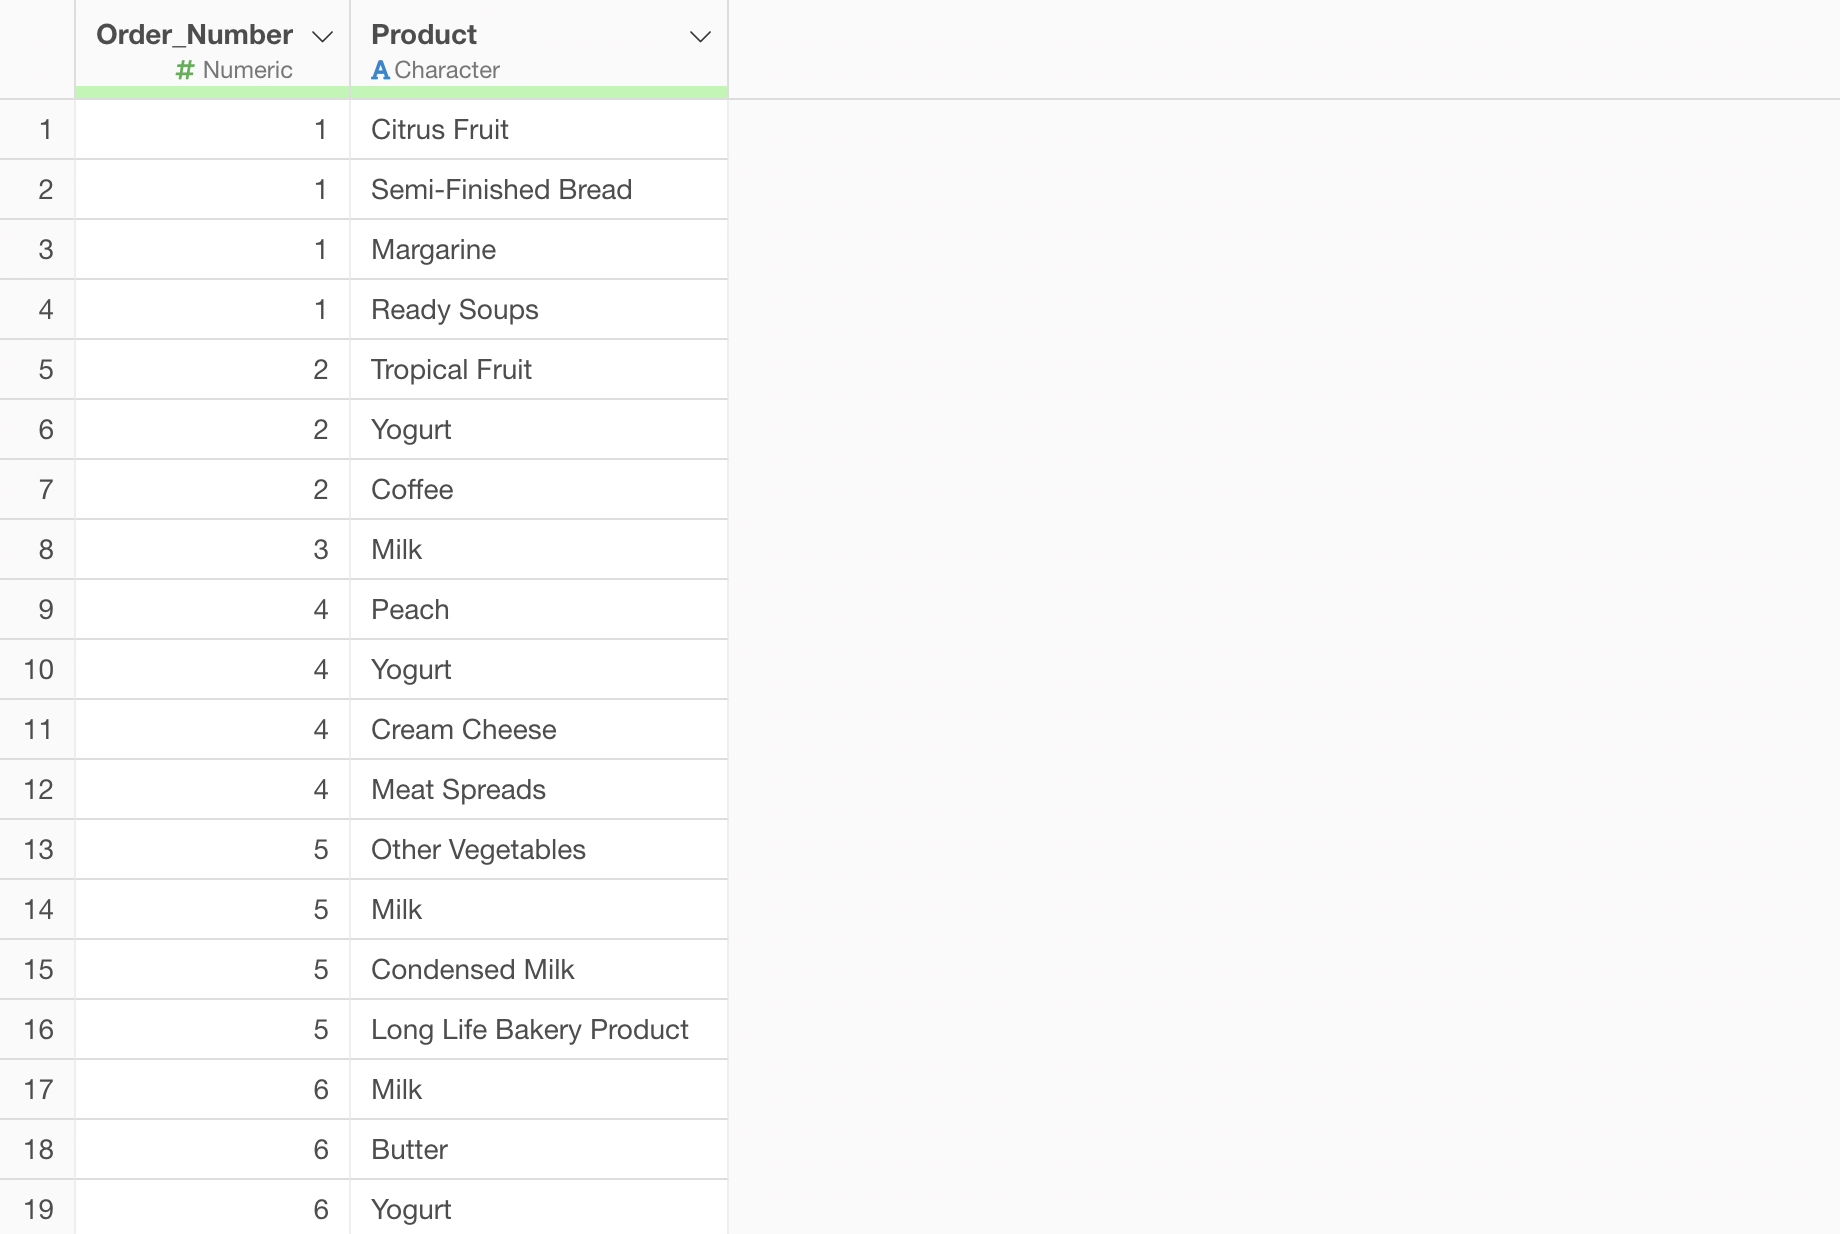
Market Basket Analysis requires data where each row represents one item within a single basket (shopping cart).
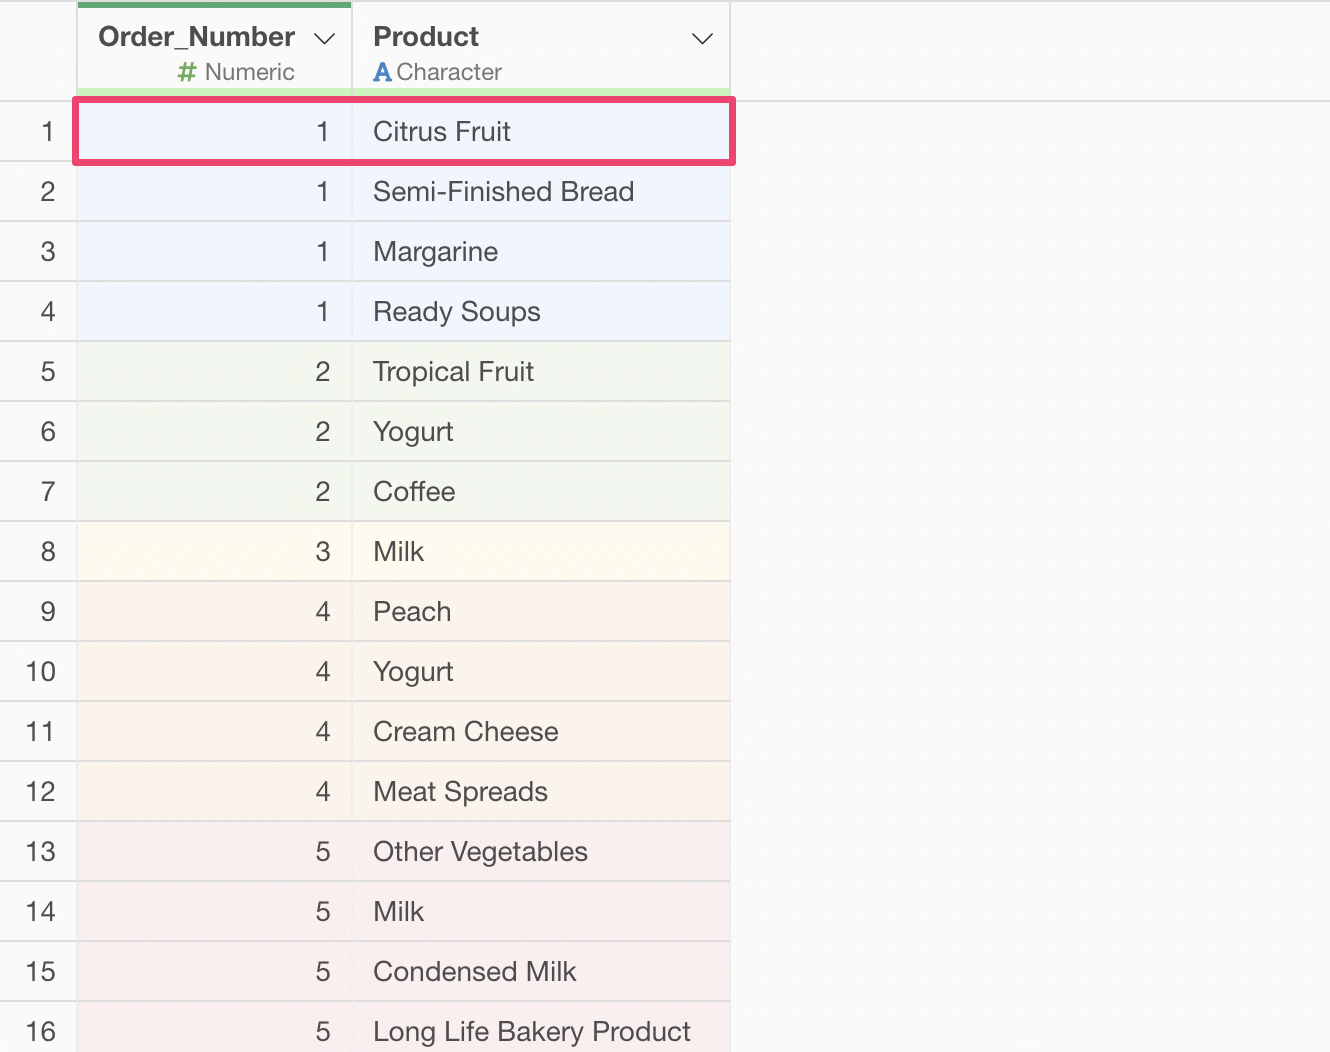
In addition to the column for the items included in the basket, you also need a column to identify which basket each item belongs to (e.g., Order Number, Transaction ID).
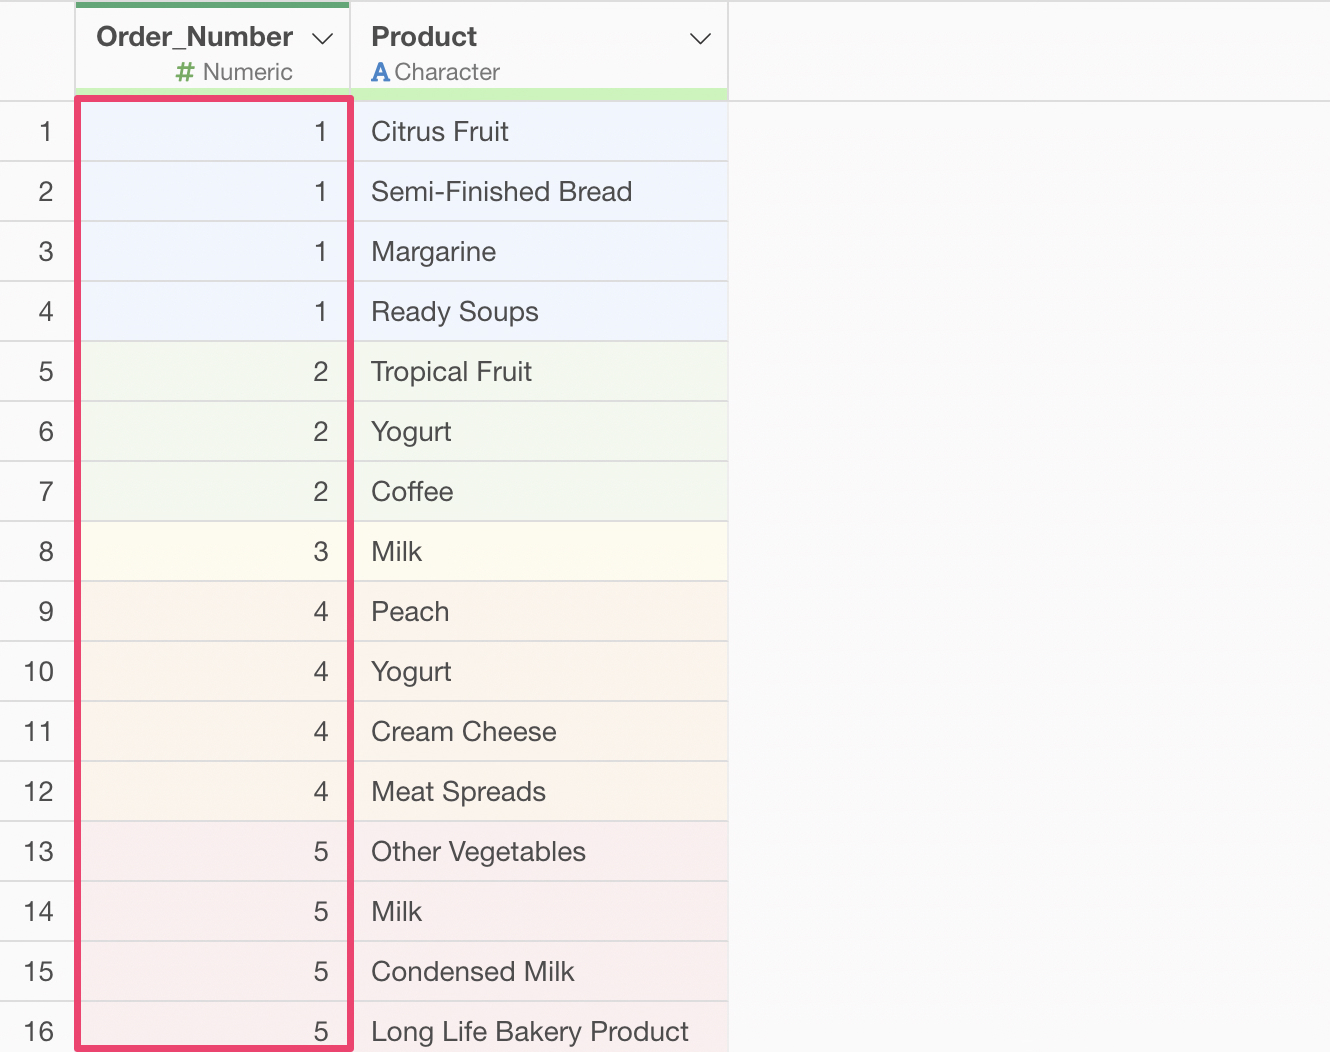
For this example, we will use shopping cart data from an online supermarket as sample data.
Running Market Basket Analysis
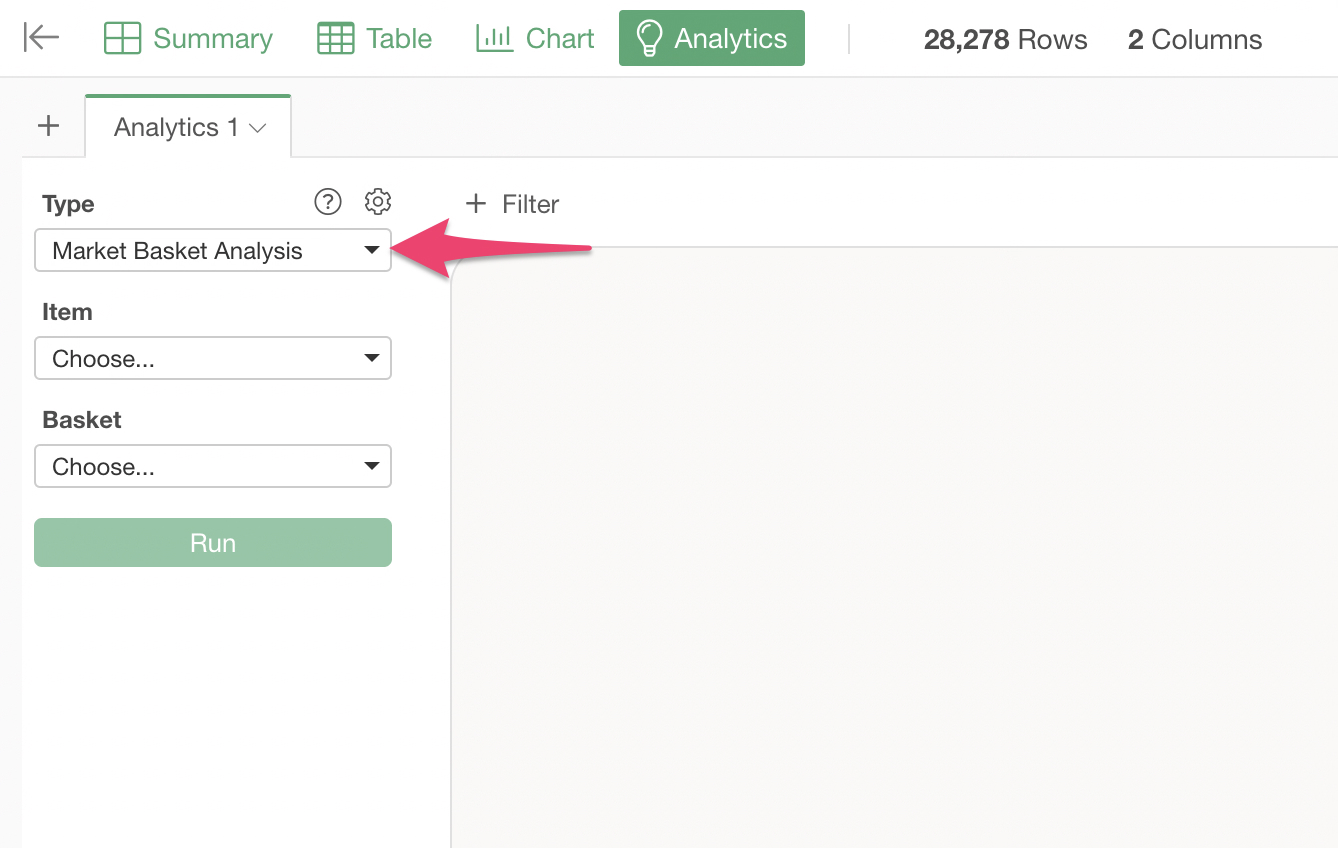
Open the Analytics view and select “Market Basket Analysis” as the Type.
Select “Product” (representing the contents of the cart) for the “Items” and “Order Number” (the column identifying the basket) for the “Basket.”
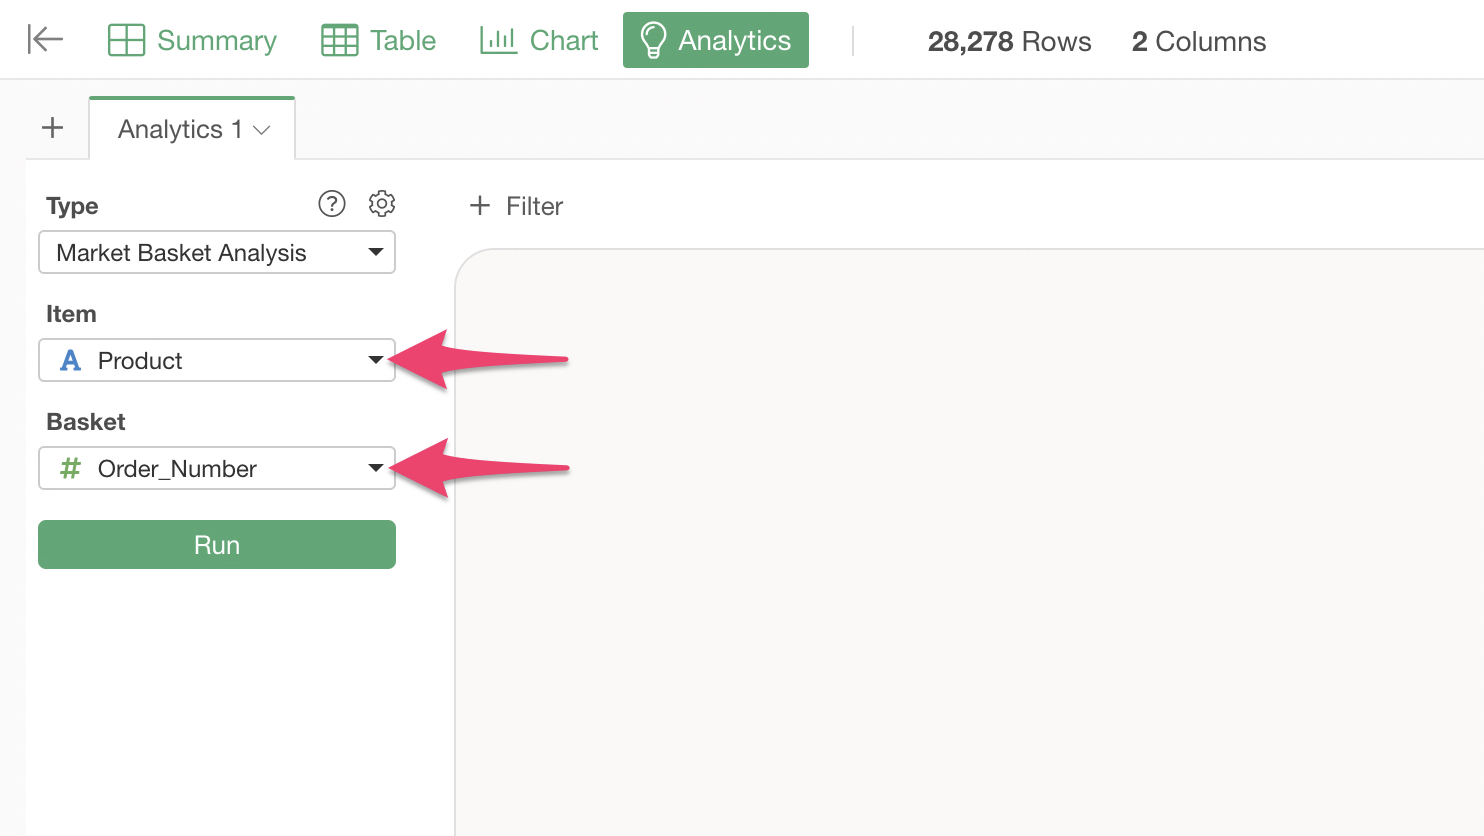
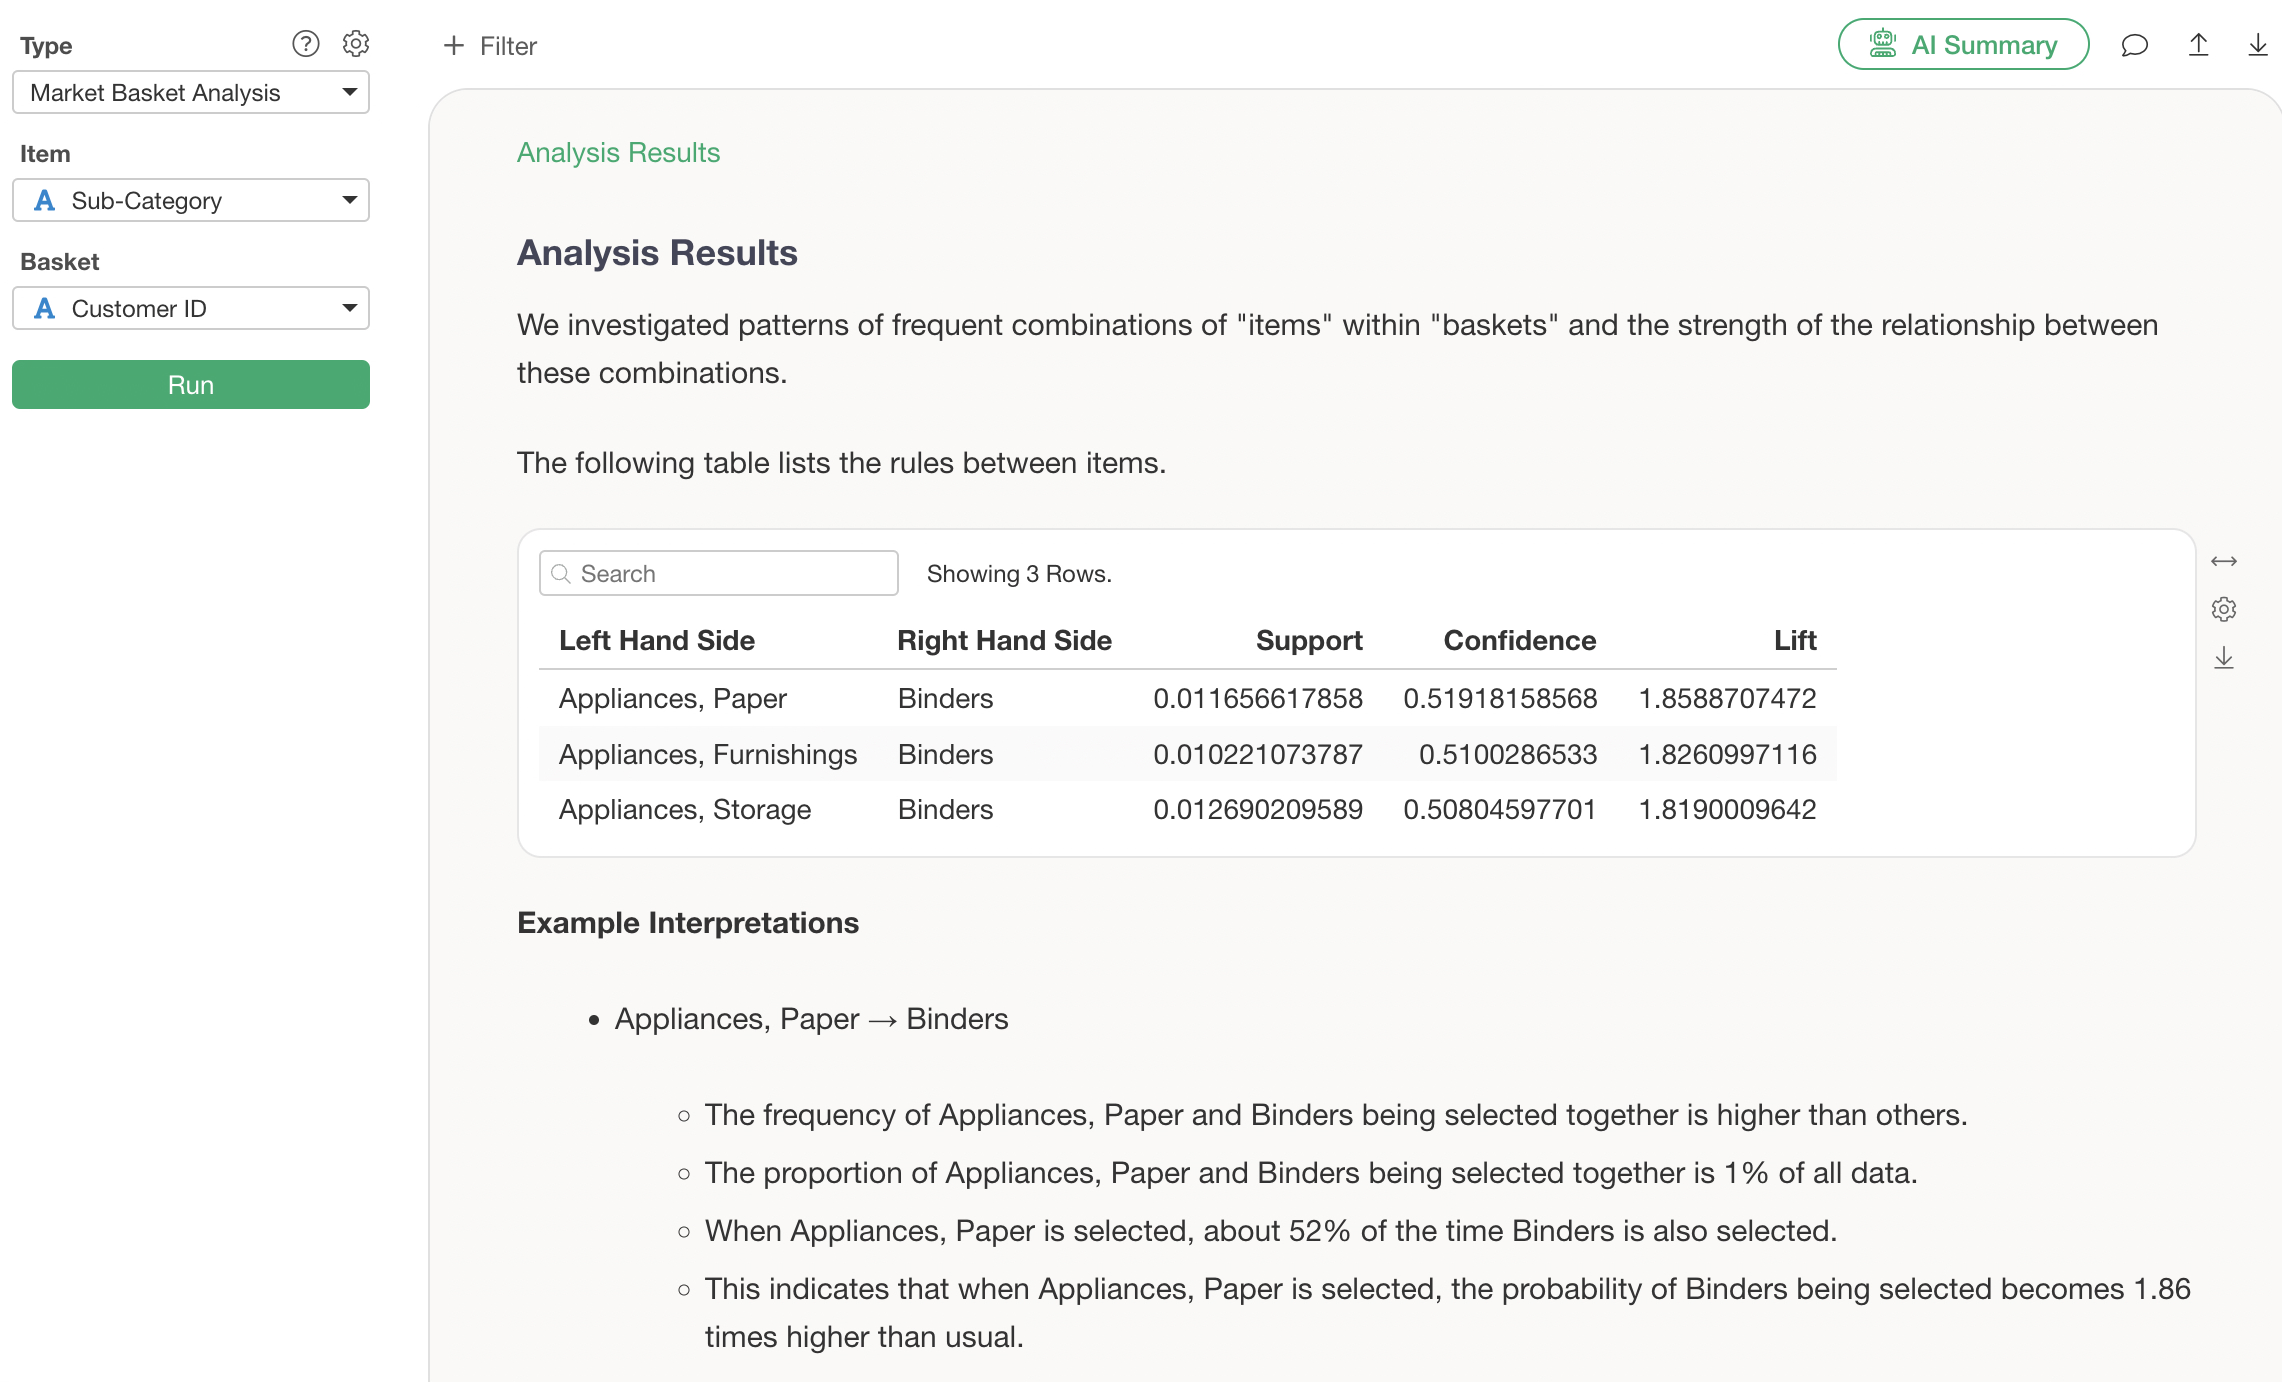
Once you specify the columns and run the analysis, the results of the Market Basket Analysis will be displayed.
Interpreting the Results
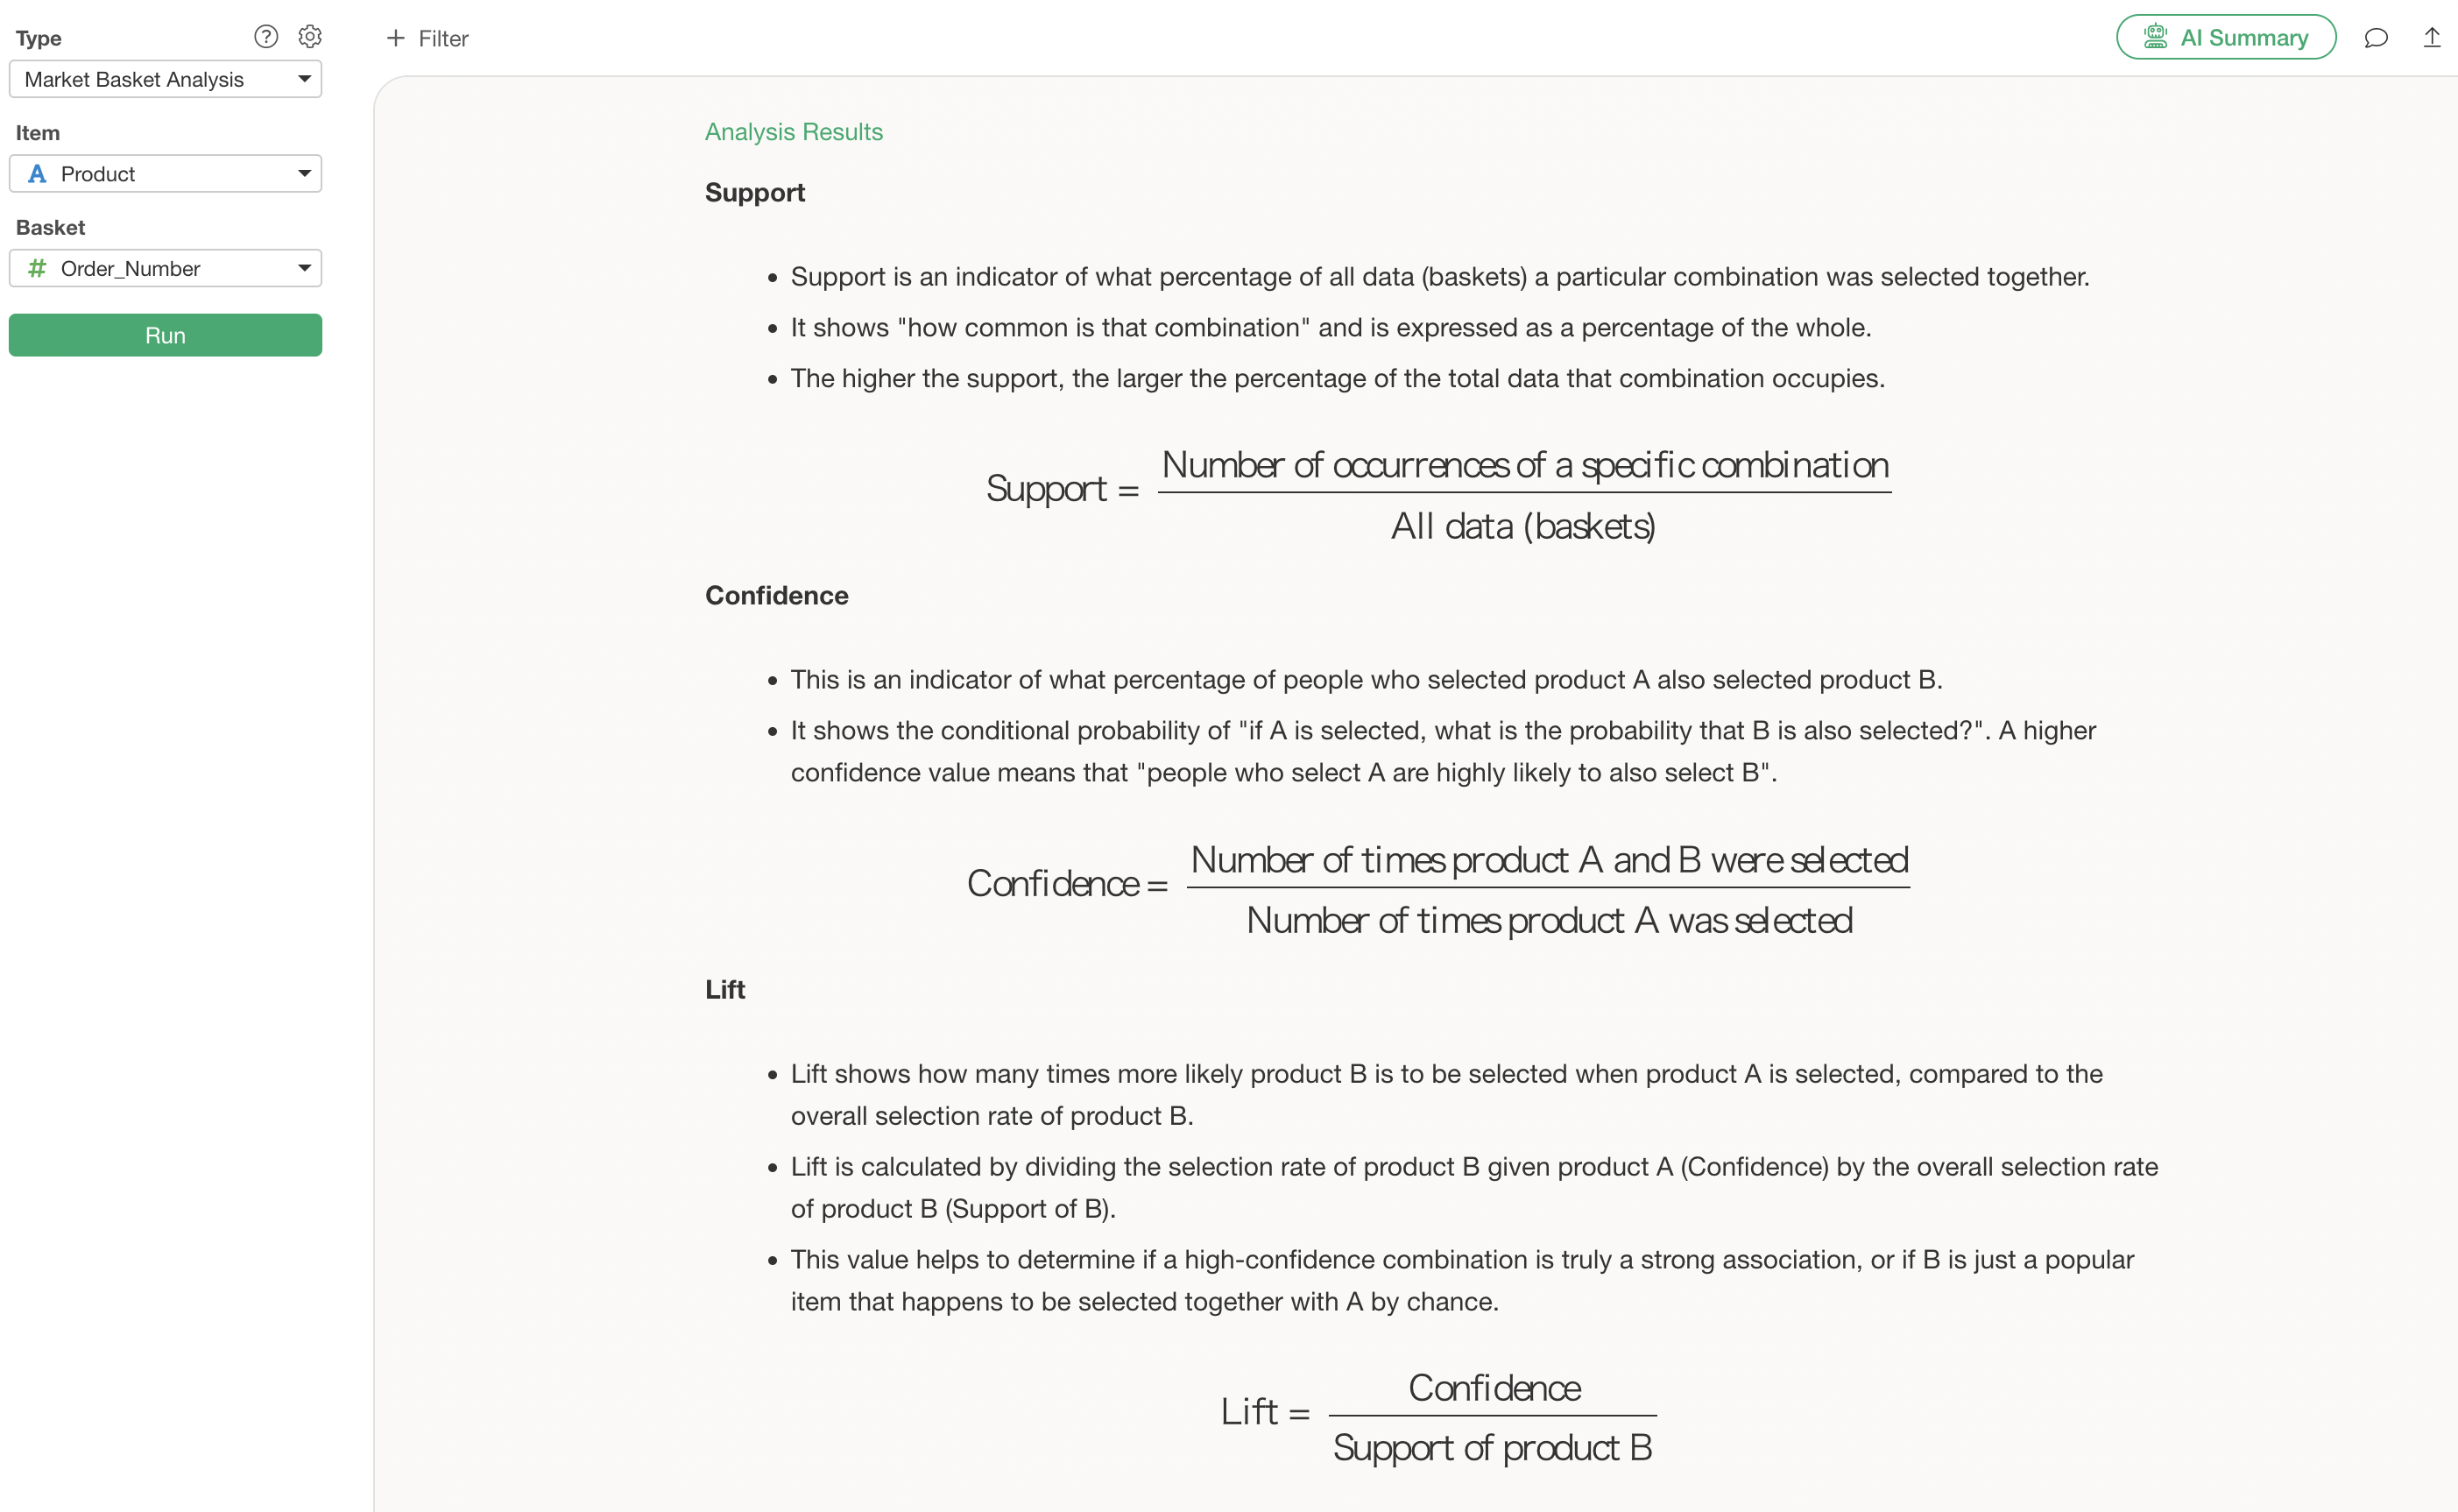
In Market Basket Analysis, judgments are made based on three metrics: Support, Confidence, and Lift.
- Support: A metric representing the proportion of all data (baskets) in which a specific combination was selected together.
- Confidence: A metric representing the proportion of people who selected Item A and also selected Item B.
- Lift: Lift indicates how many times more likely Item B is to be selected when Item A is selected, compared to the overall selection rate of Item B.
Detailed explanations for each, including calculation formulas, are displayed as a guide.
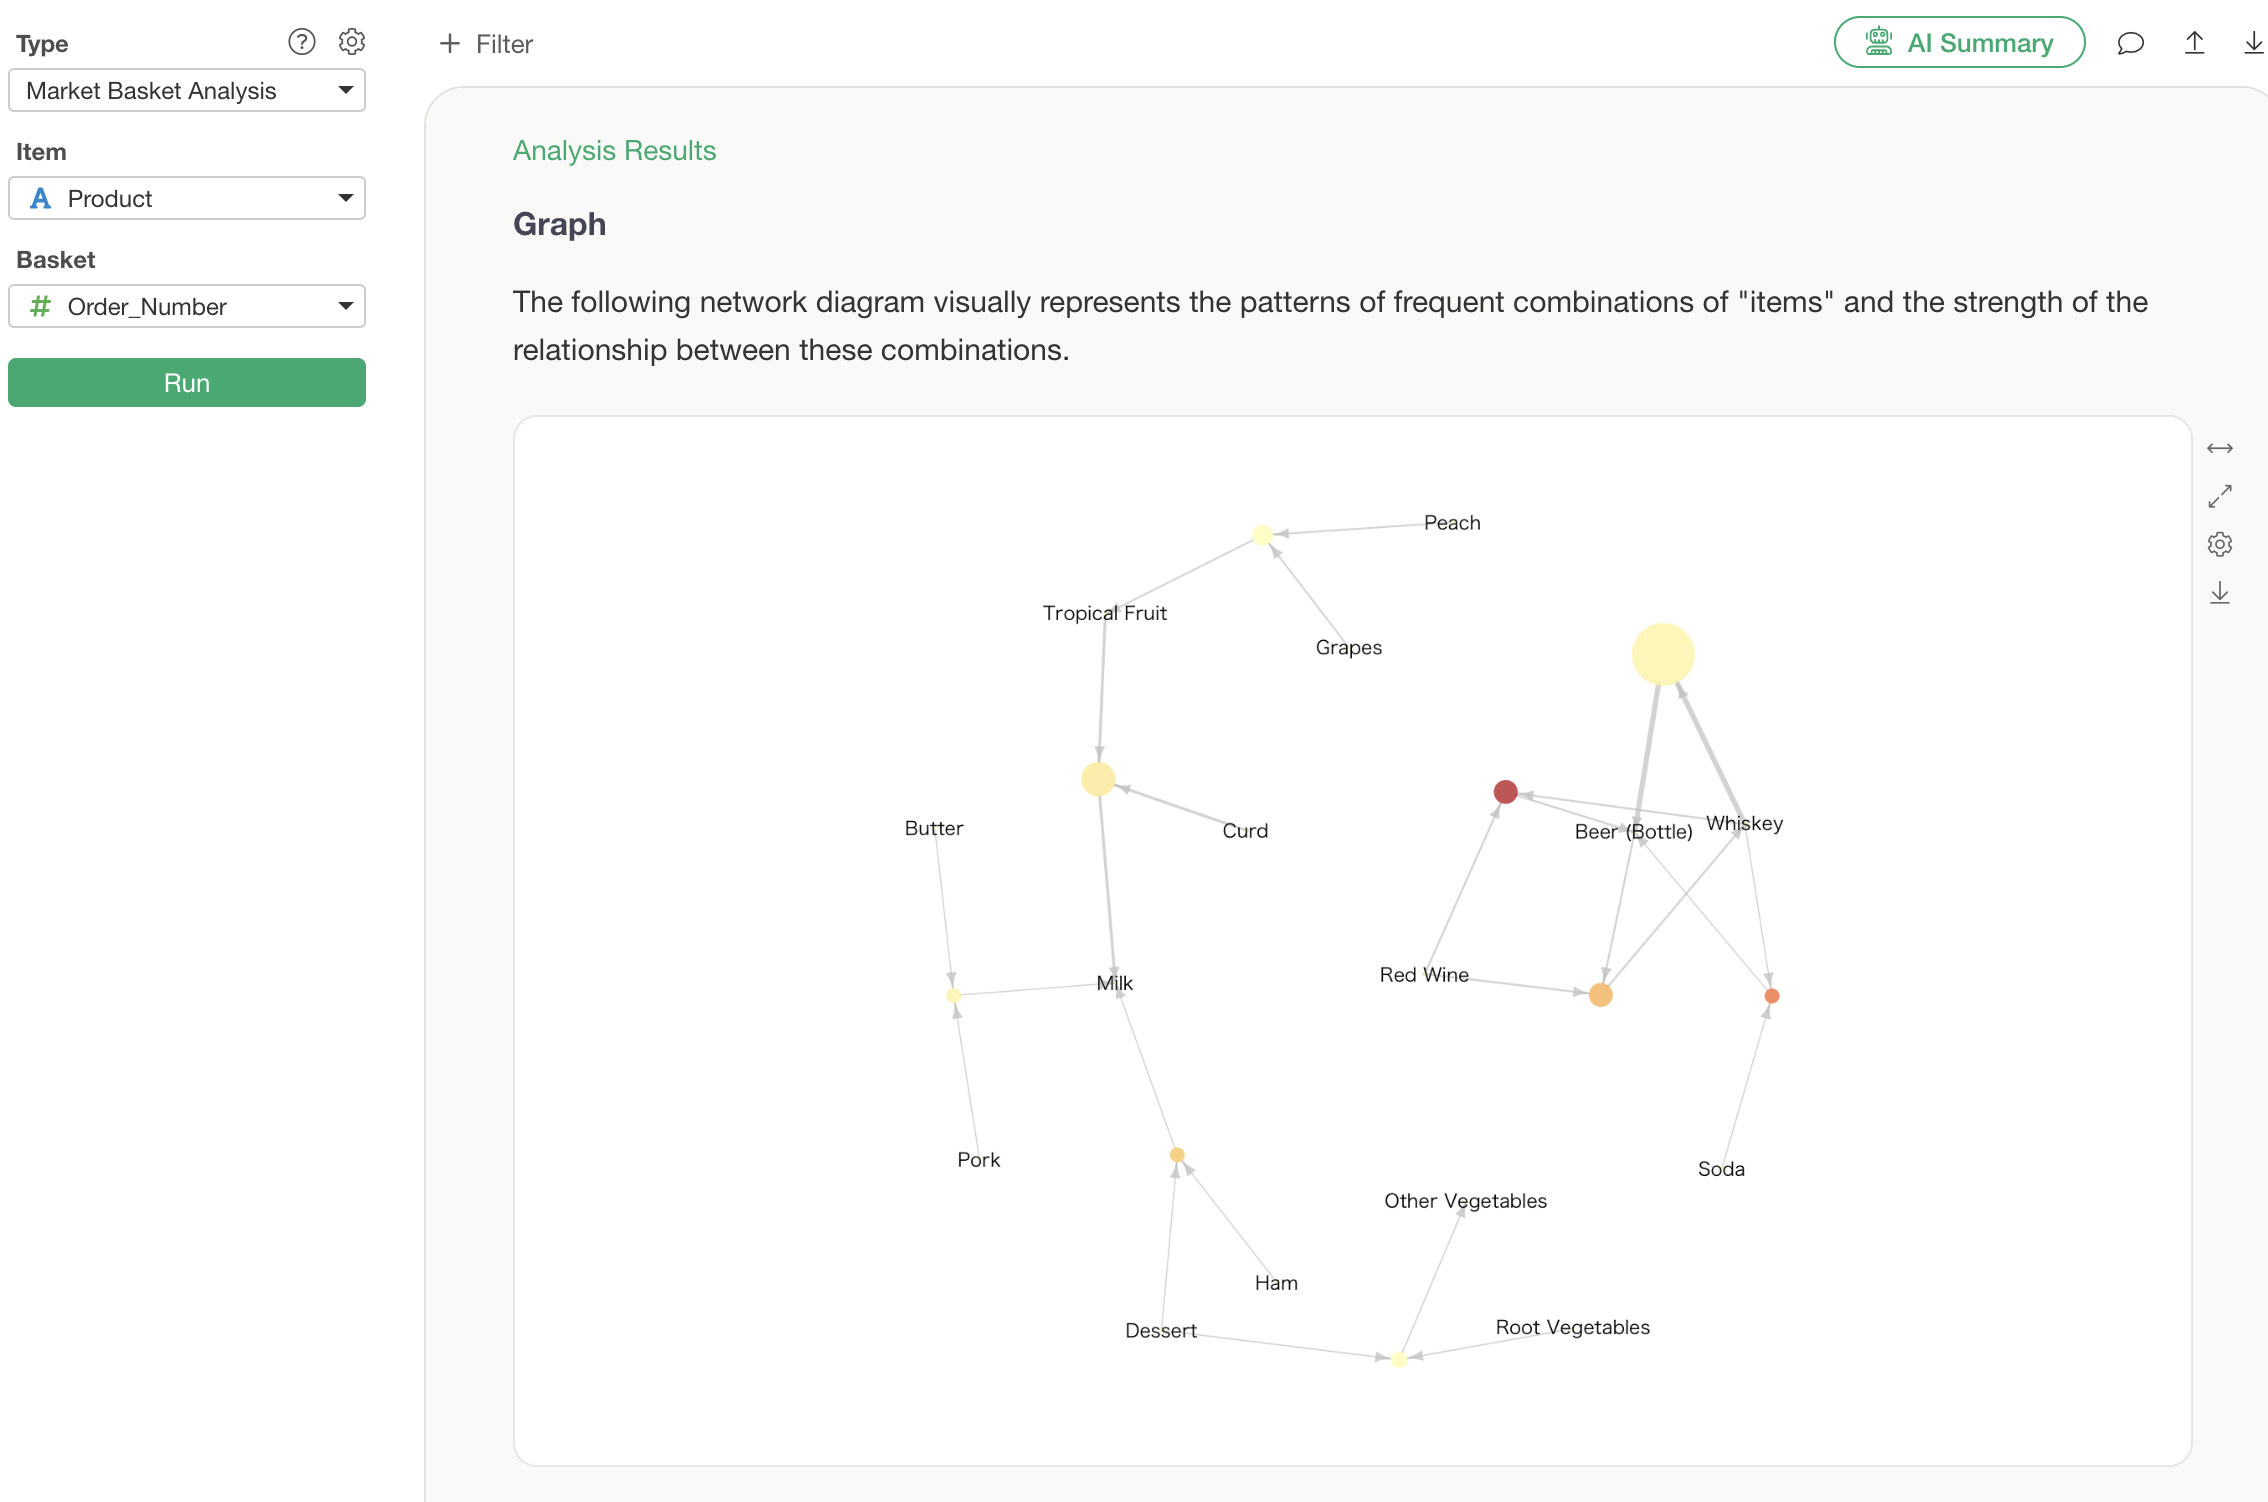
Graph
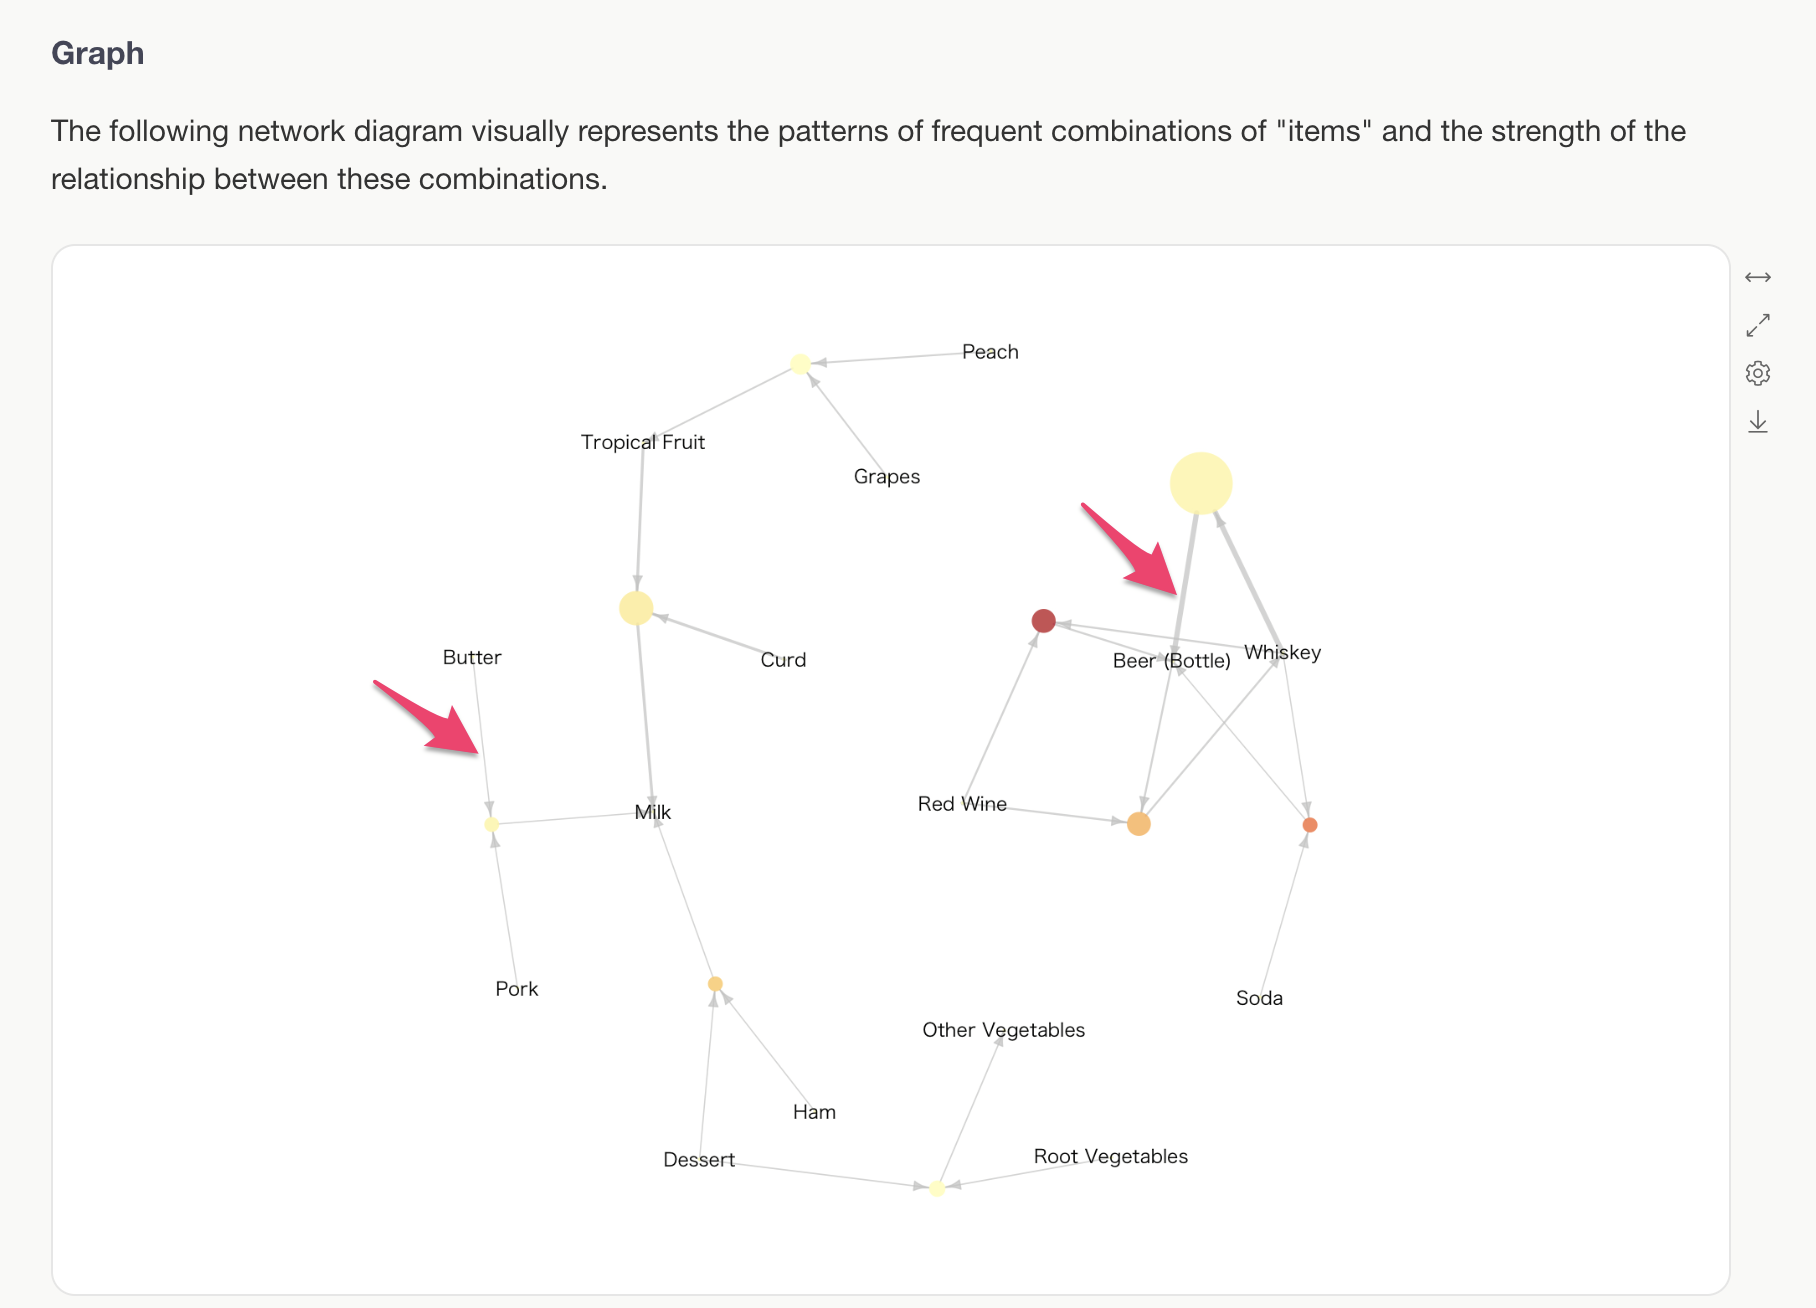
In the Graph section, the text displayed represents product names, and each circle represents a single “rule.”
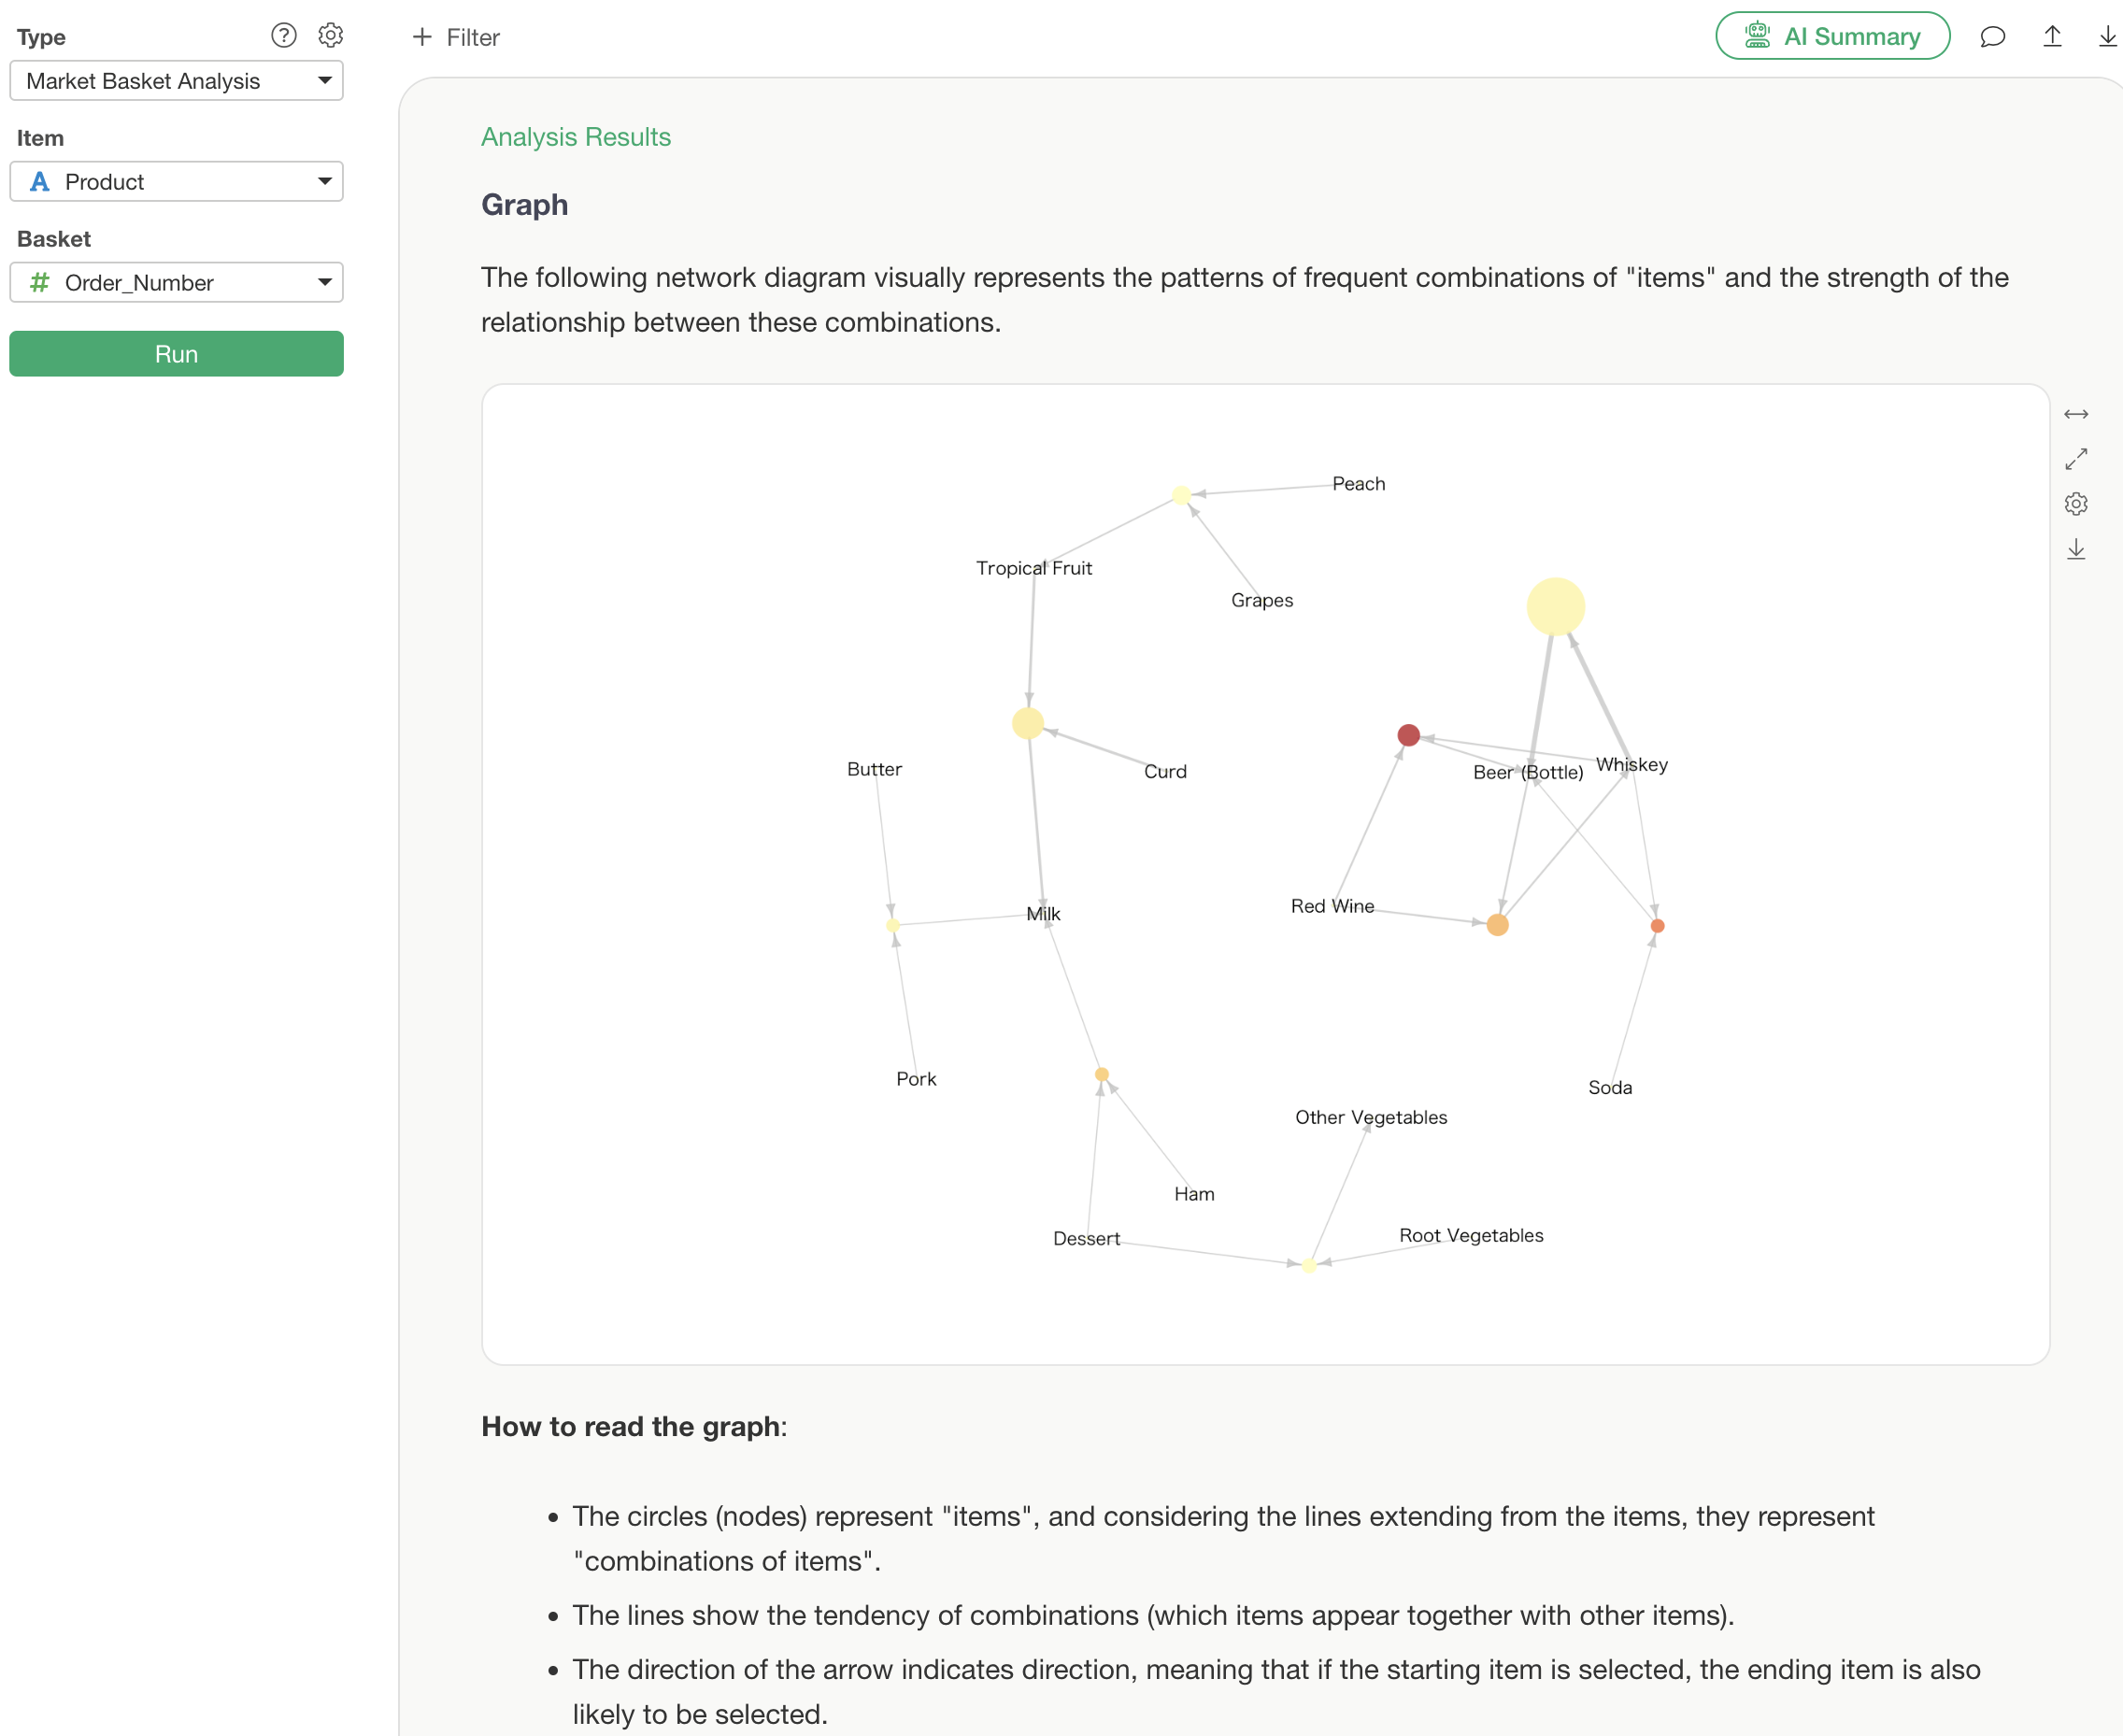
Looking at the rule in the upper right, an arrow points from “Whiskey” to the rule, and another arrow points from the rule to “Beer (Bottle).”
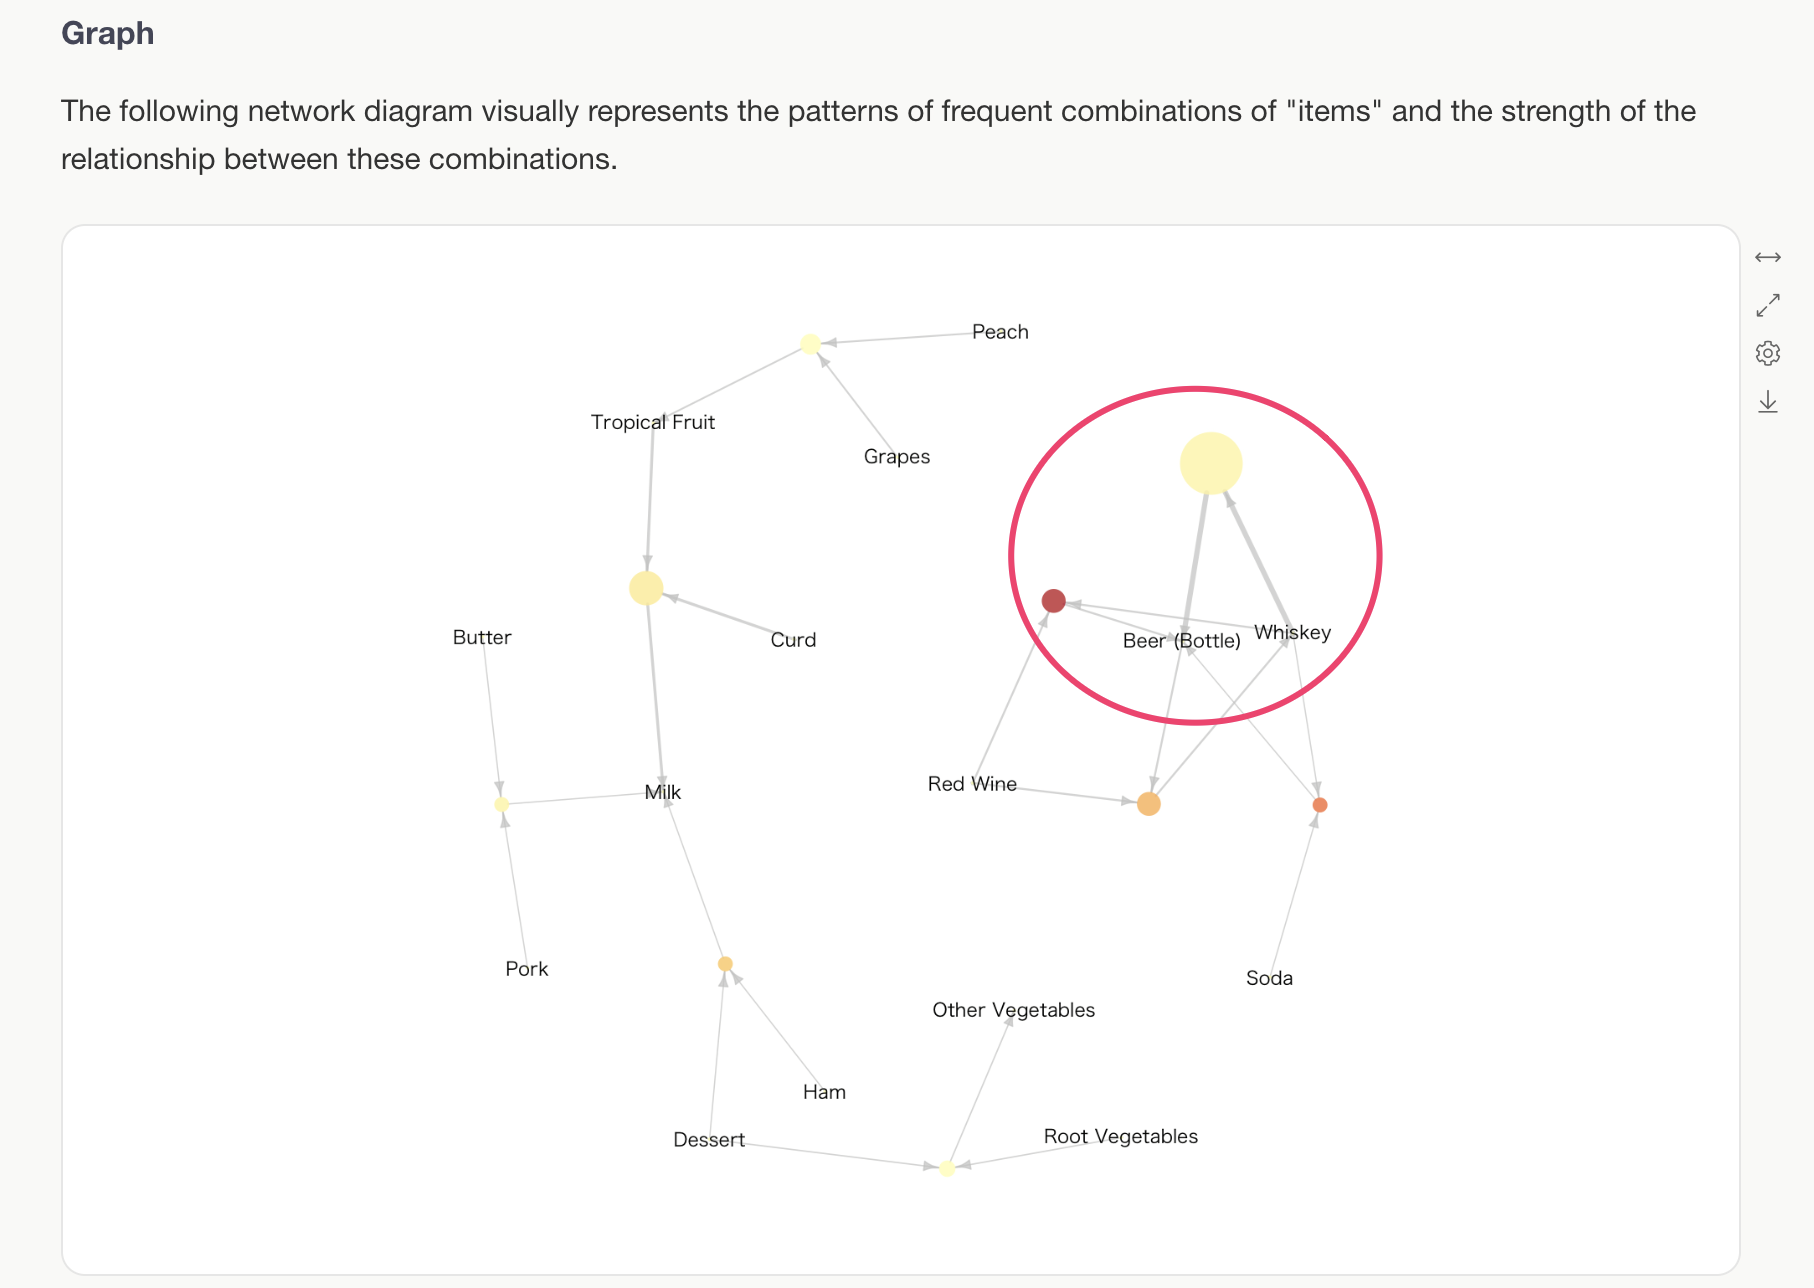
This represents the rule: “When whiskey is purchased, bottled beer tends to be purchased together.”
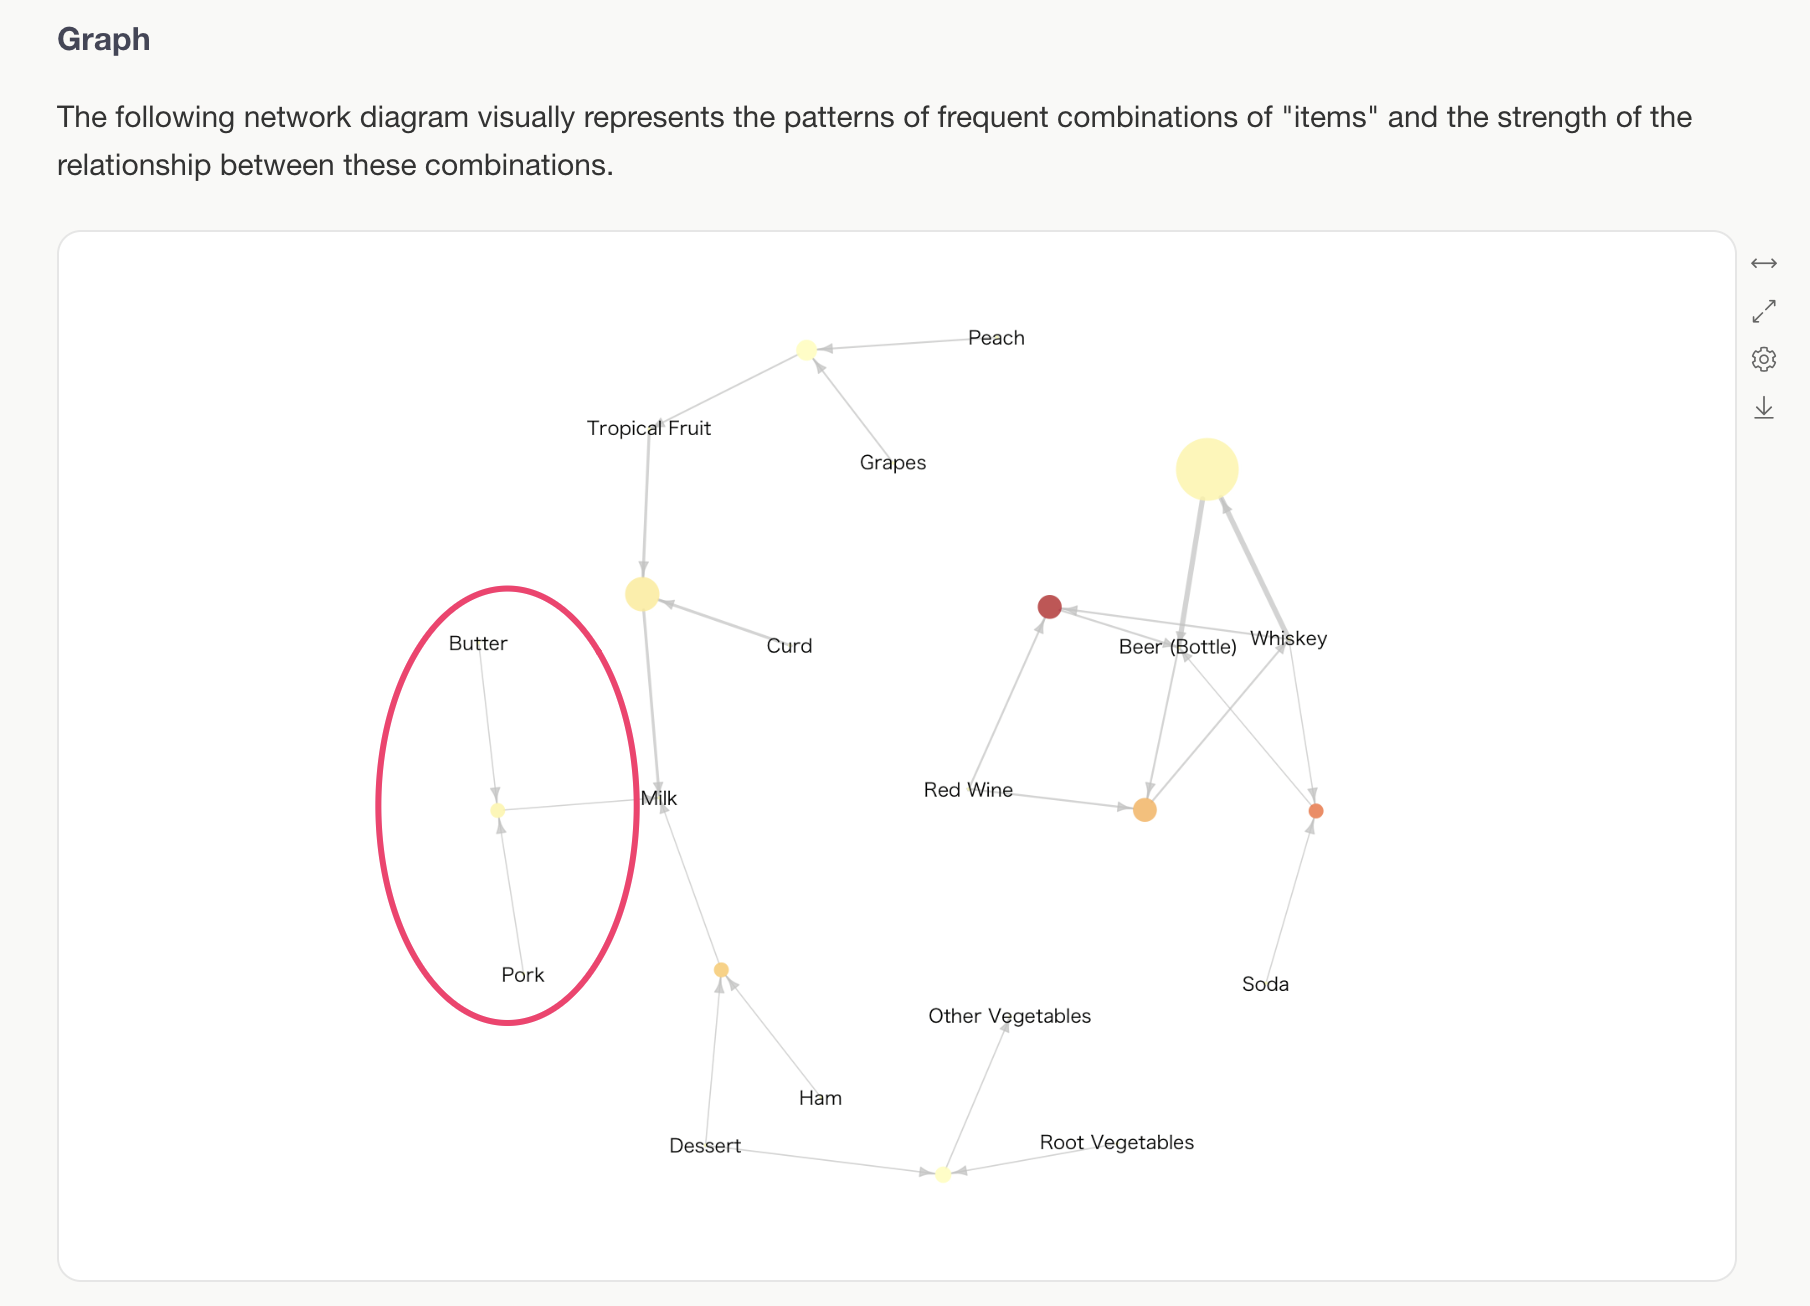
Note that if multiple lines extend to a rule, it means those items are purchased together. Therefore, the rule on the left can be interpreted as: “When both Butter and Pork are purchased, Milk tends to be purchased together.”
The size of the rule represents the relative magnitude of “Support.” Support indicates the proportion of all baskets in which that rule can be confirmed—in other words, the probability of that rule occurring.
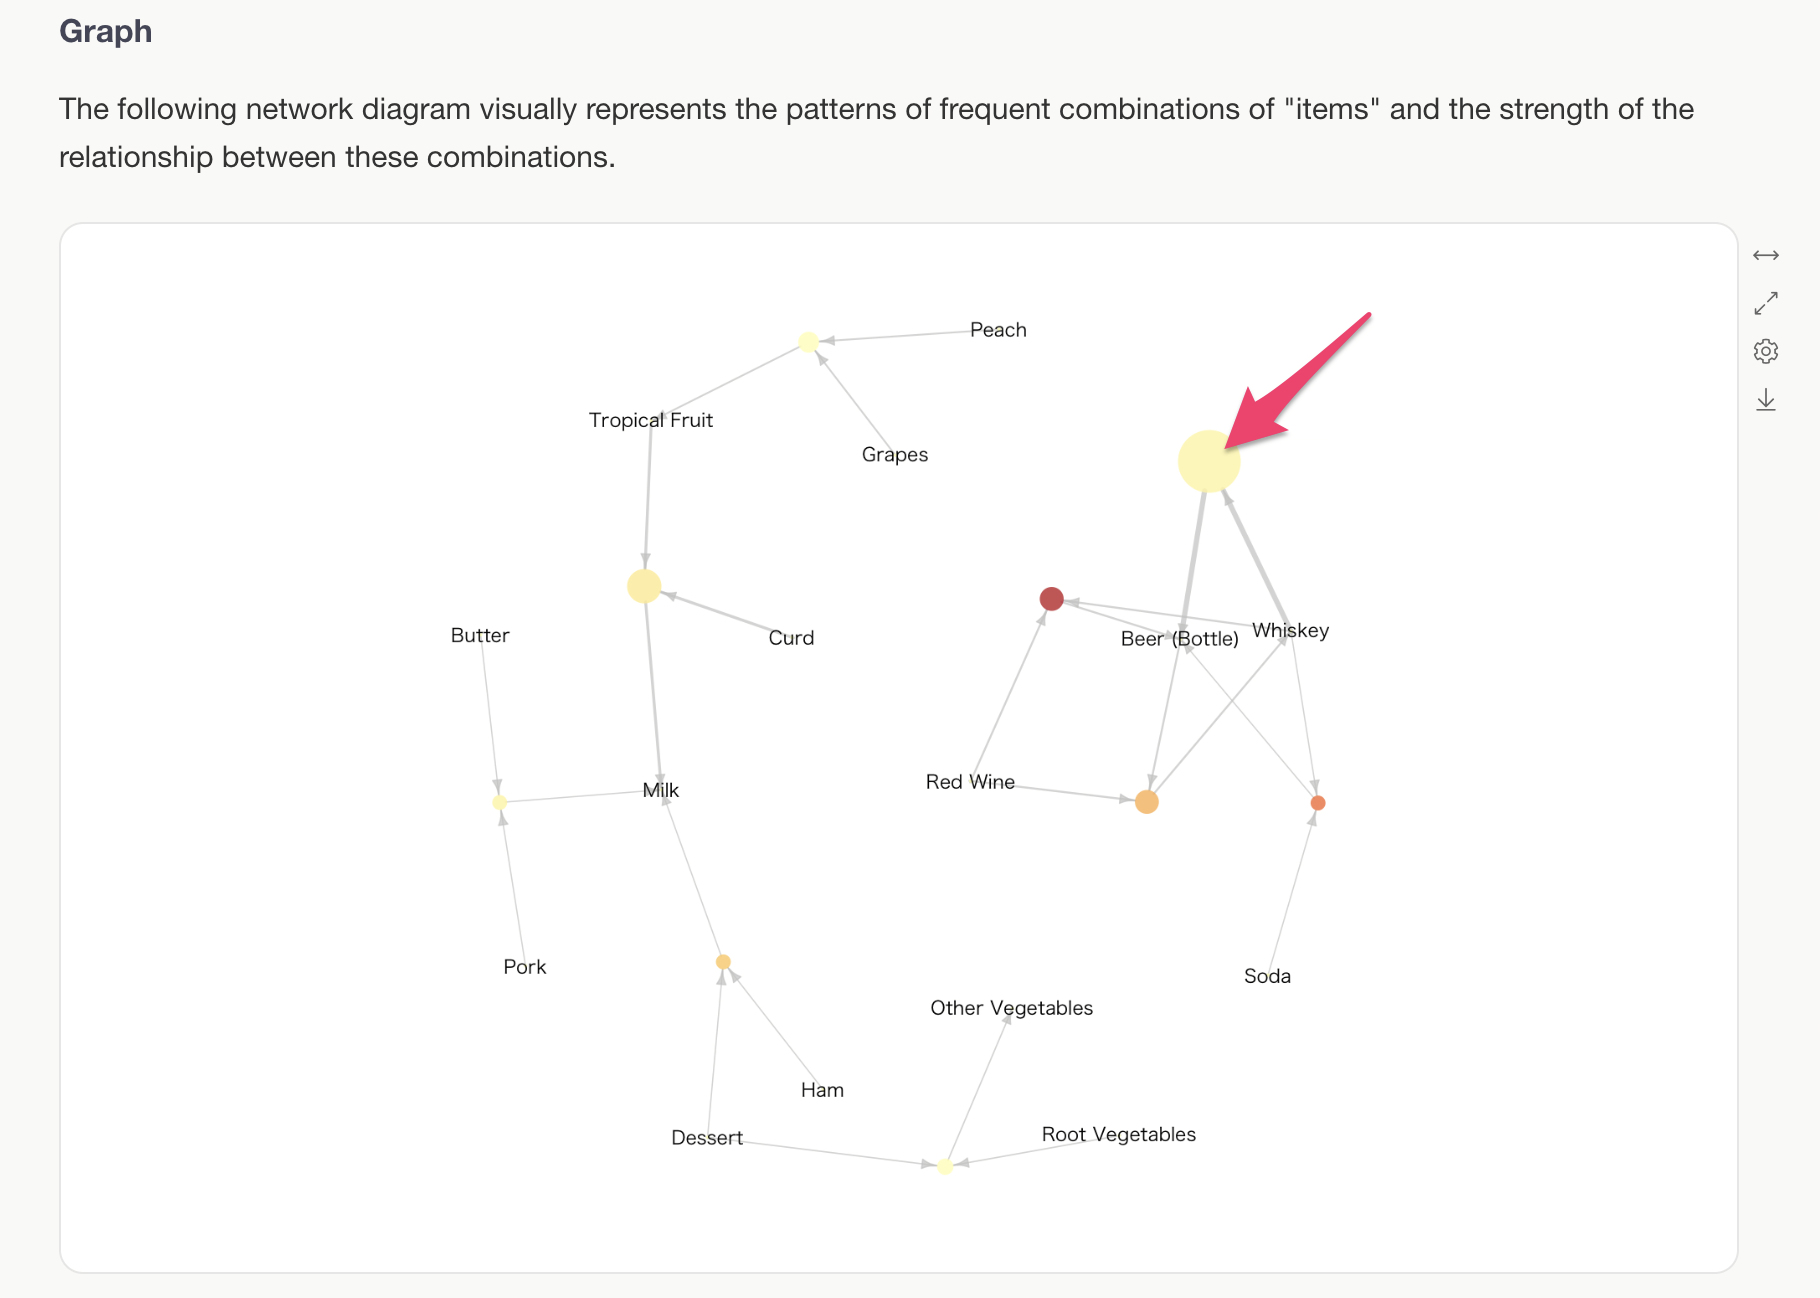
Therefore, the largest rule represents the combination with the highest number of purchases.
Additionally, the “thickness of the lines” changes based on the Support value, similar to the size. If Support is high, the line is thick; if Support is low, the line is thin.
The color of the rule represents the relative magnitude of “Confidence.” Confidence indicates the strength of the relationship of items being purchased together.
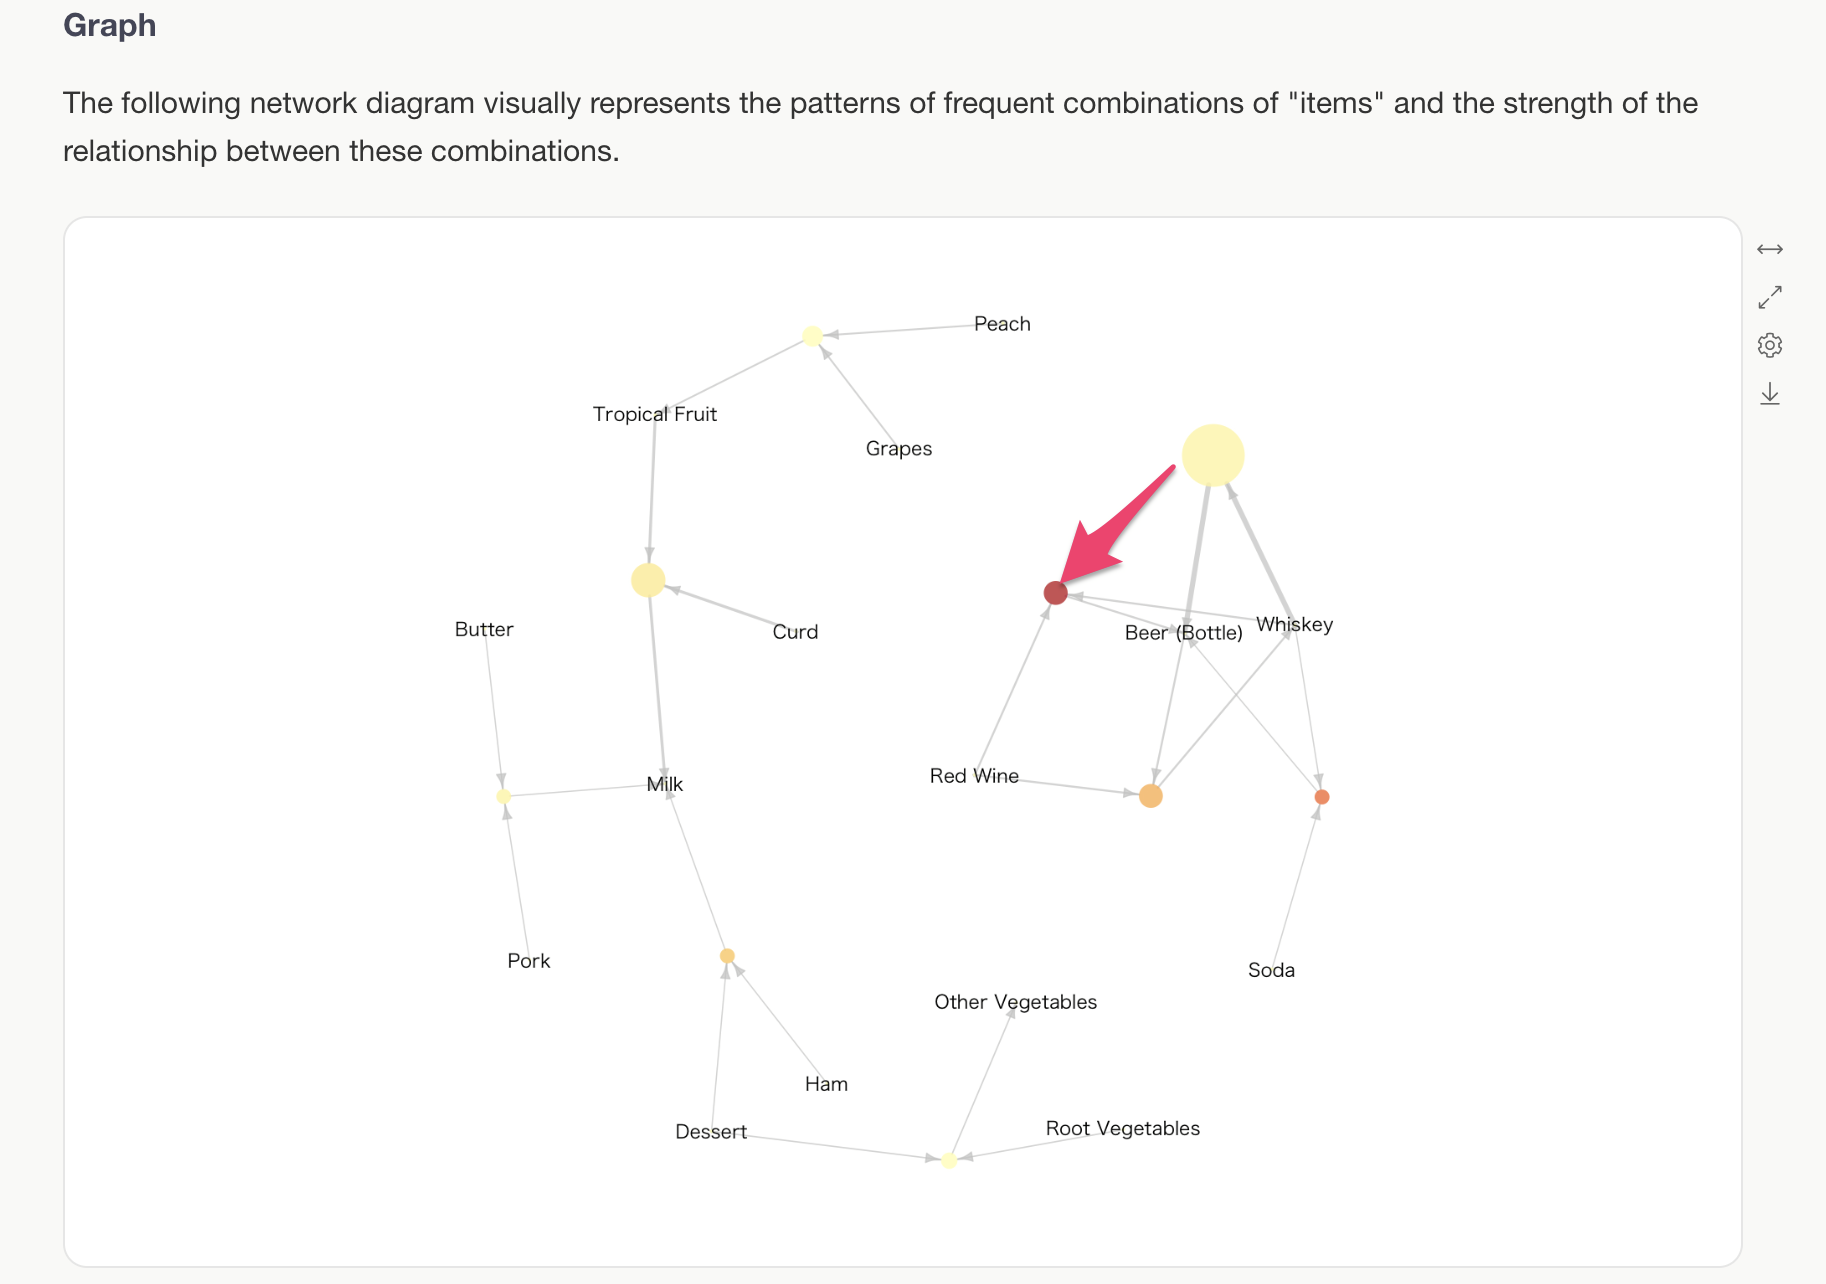
For example, focusing on the darkest red rule, we can see that “when whiskey and red wine are purchased together, there is a strong relationship where bottled beer is also likely to be purchased.”
Data
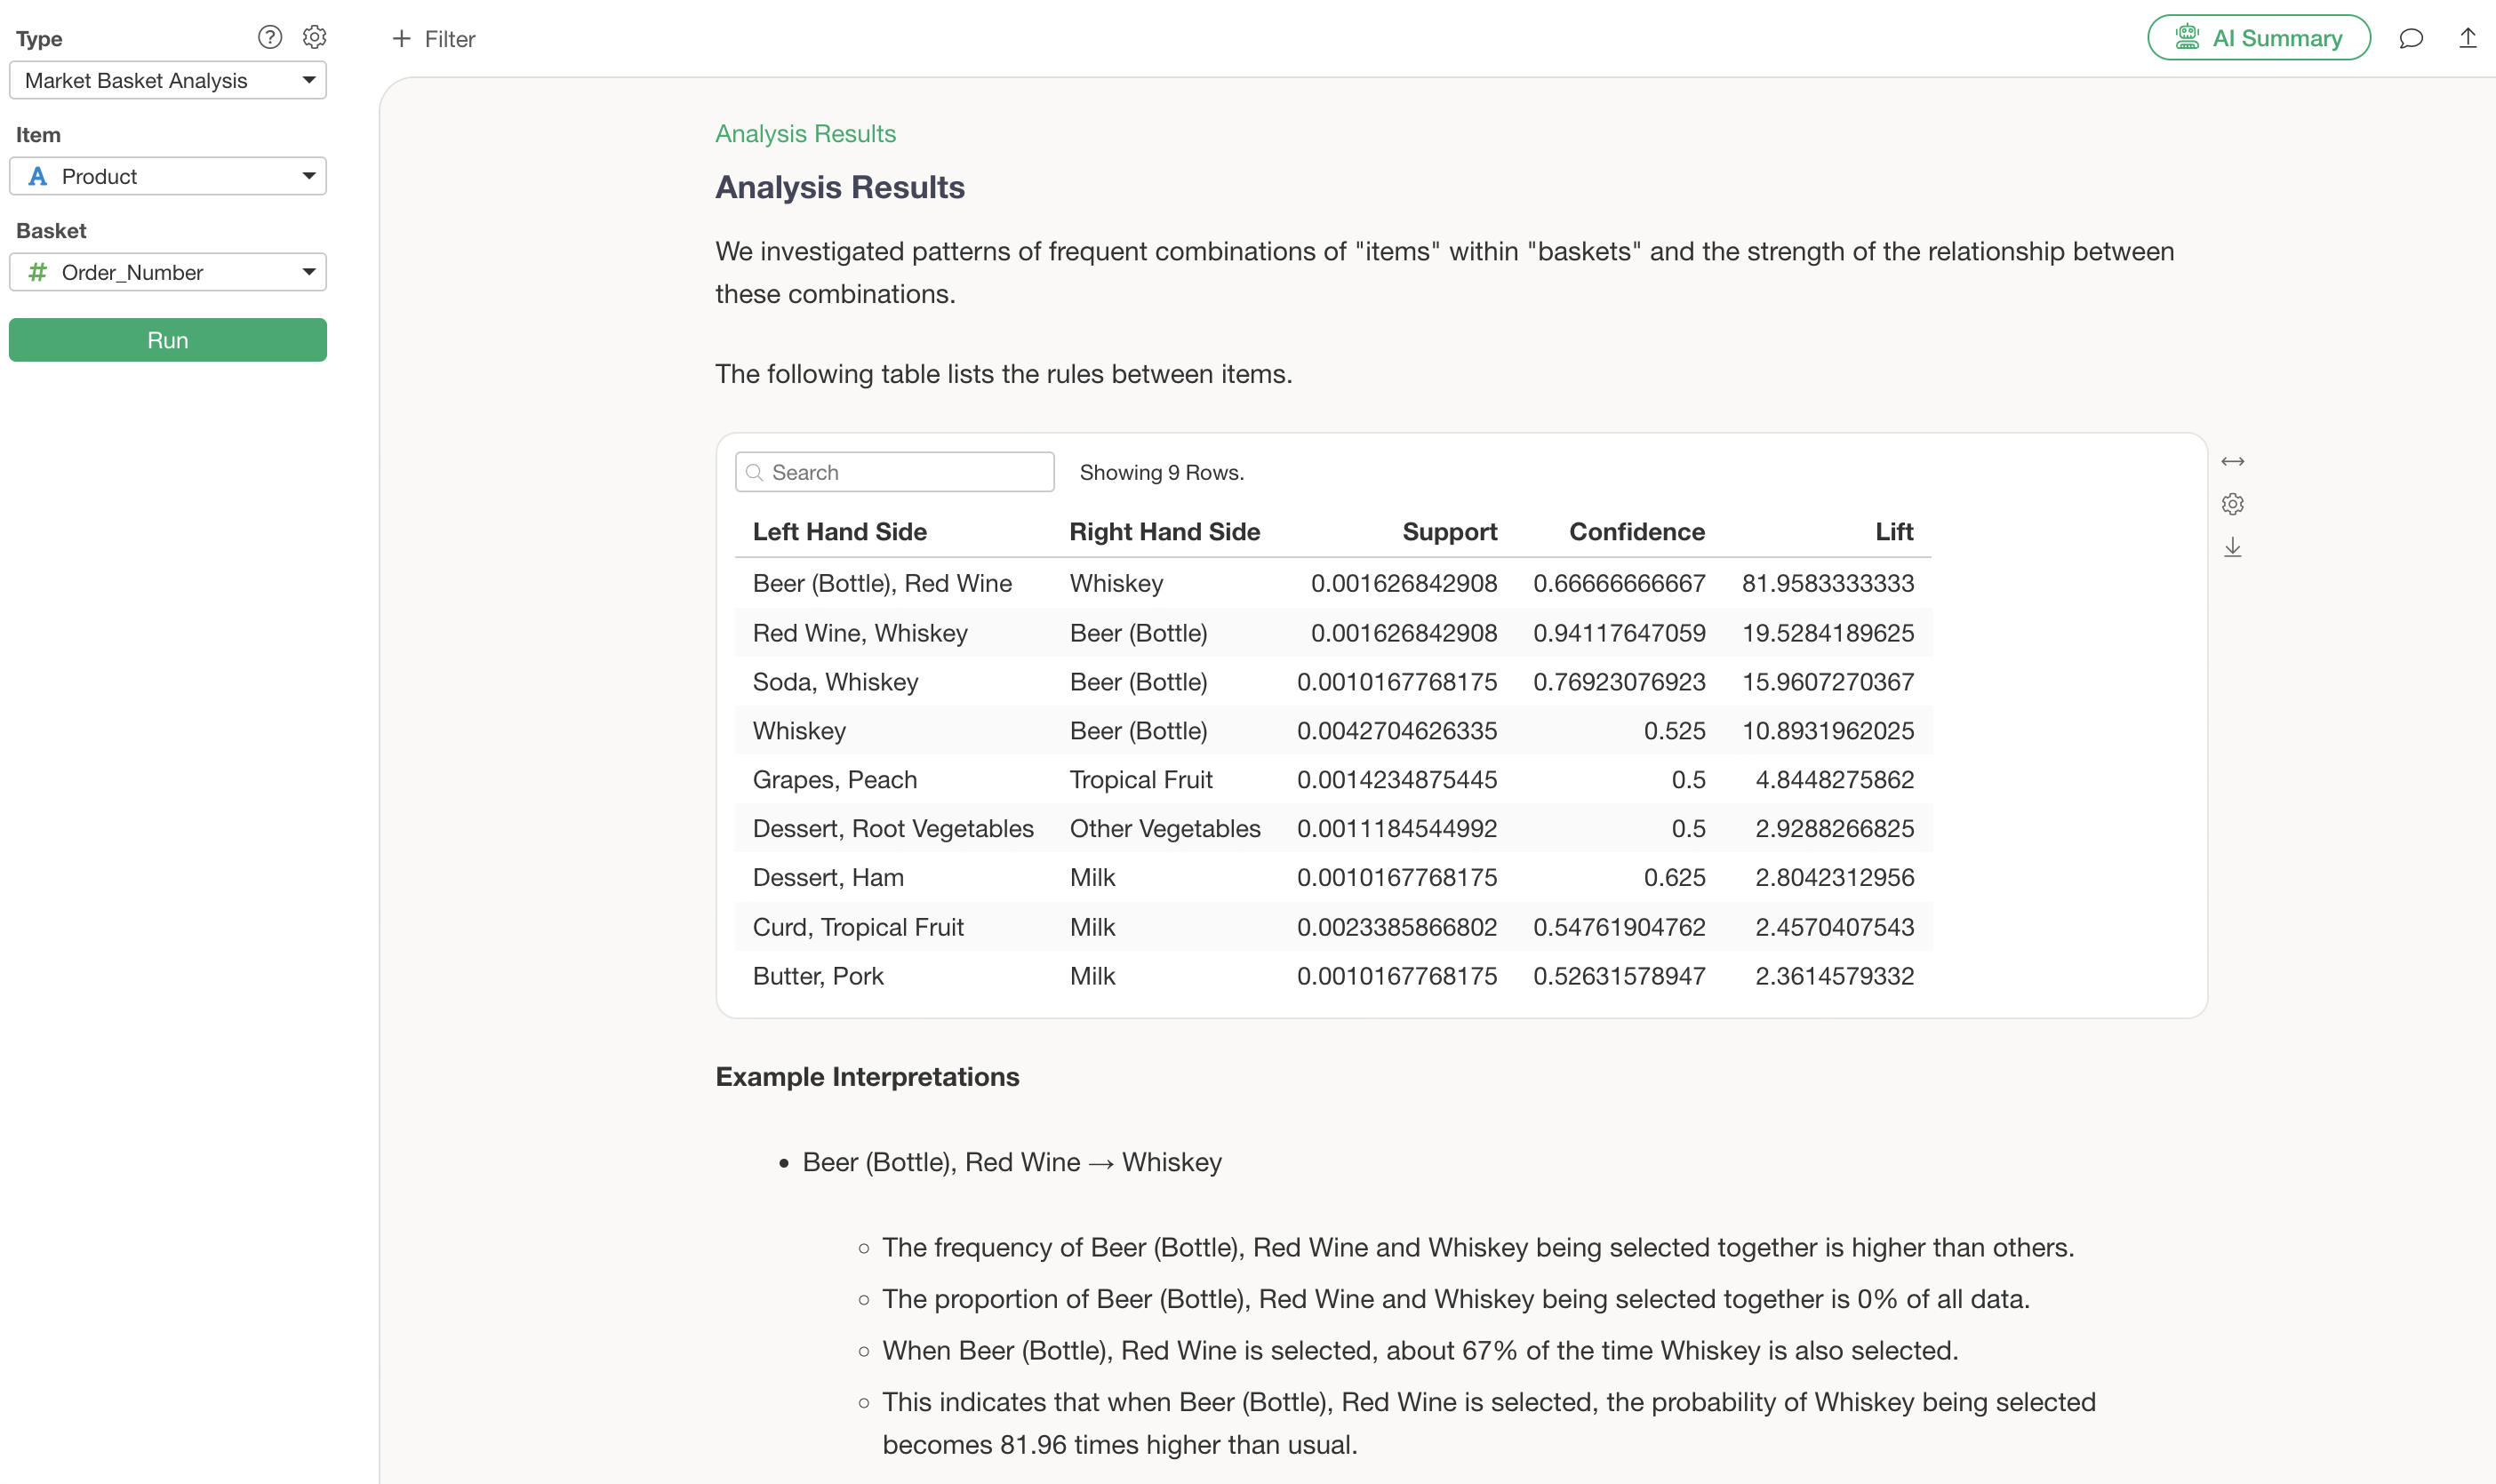
In the Data section, the table displayed shows one rule per row.
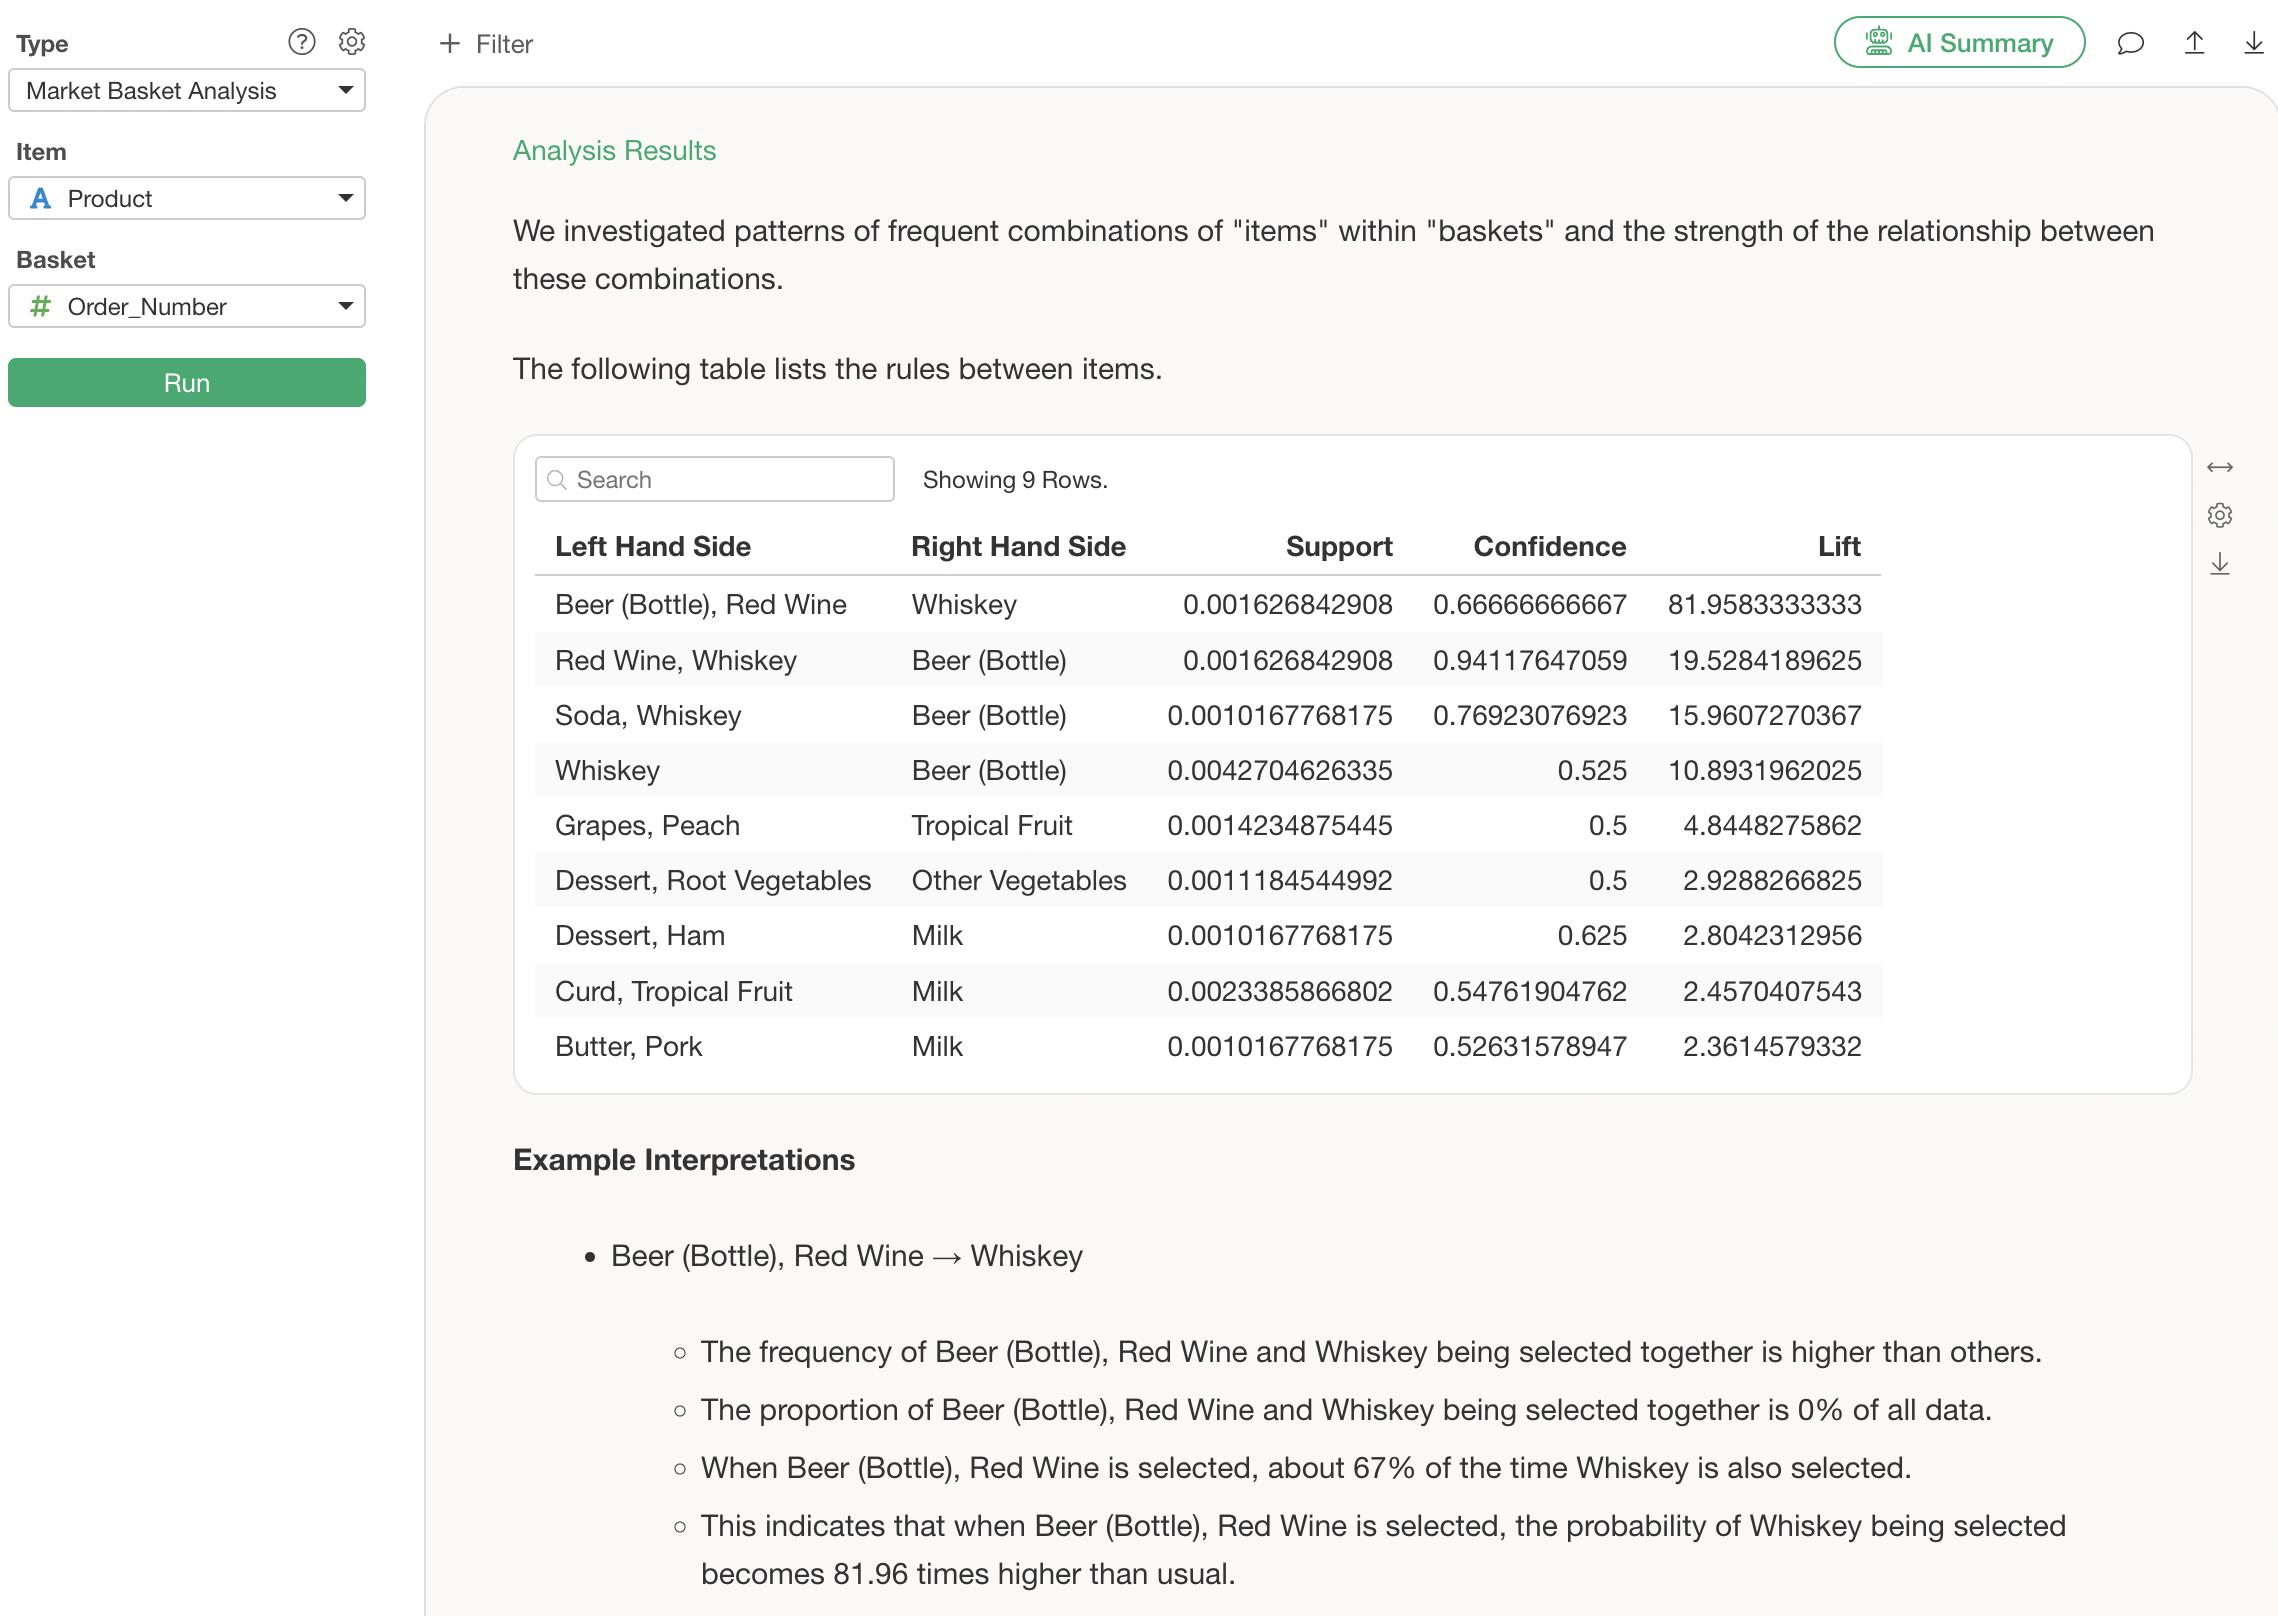
The “Item List” is the premise (antecedent), and the “Items Purchased Together” is the result (consequent). Therefore, the first row represents the rule: “When bottled beer and red wine are purchased,” then “whiskey is purchased.”
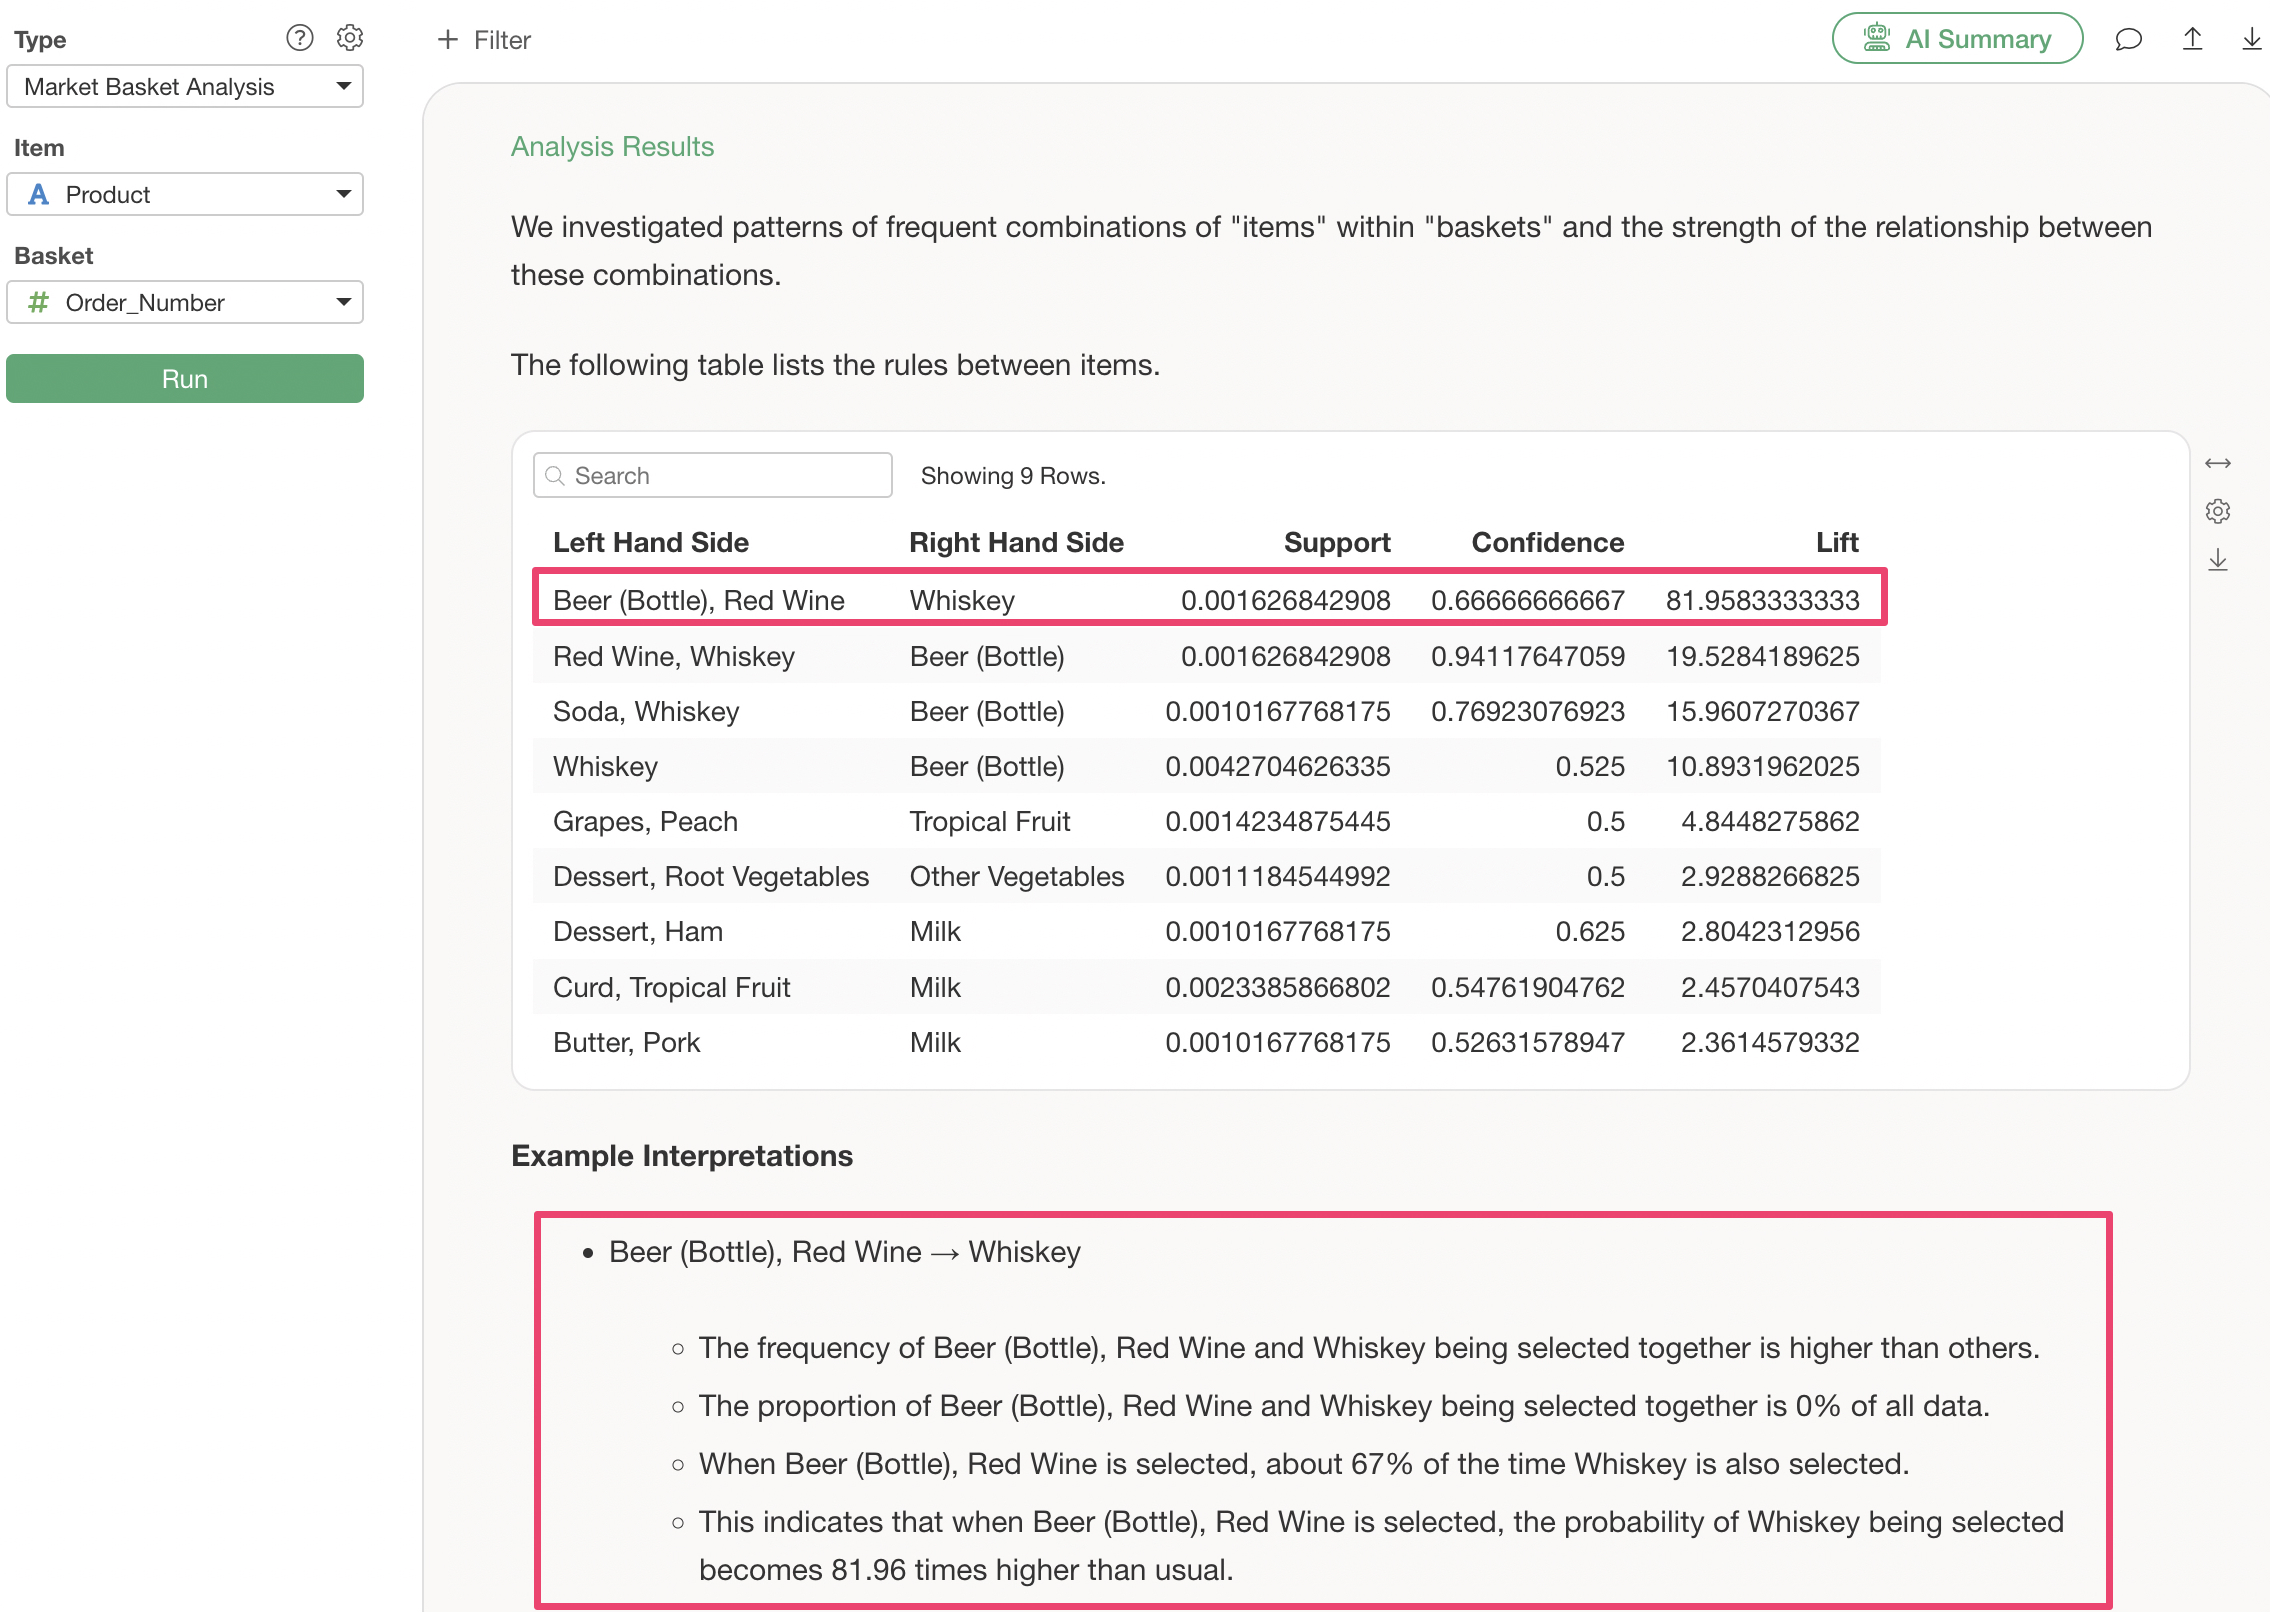
Examples of interpretation are provided, allowing you to interpret the results based on them.
In addition to Support and Confidence, you can also check “Lift.”
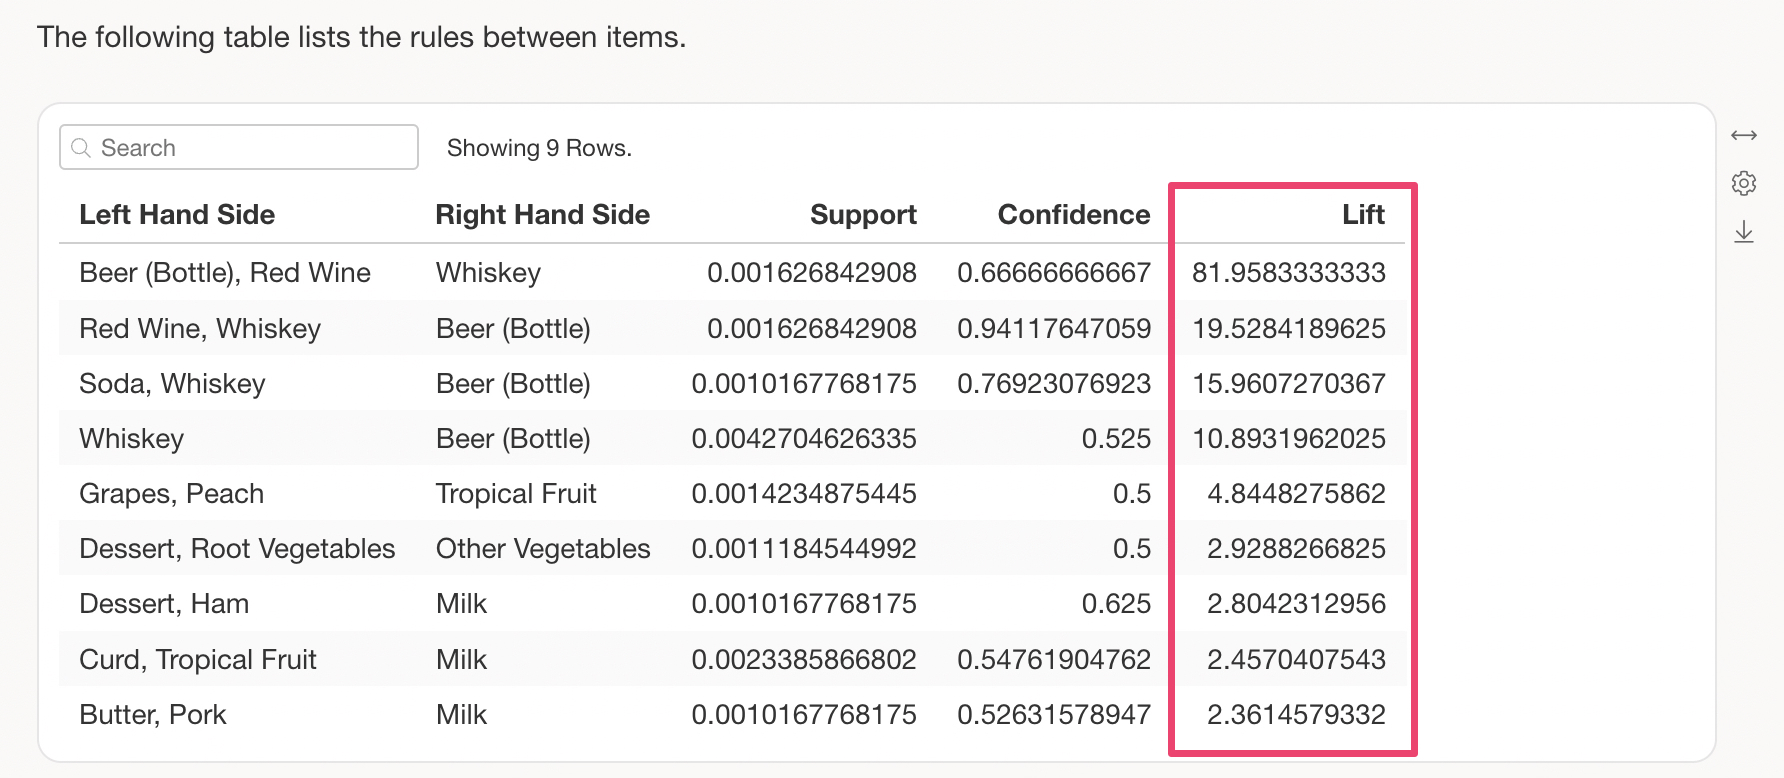
Lift is a metric that shows how much the probability of purchasing the “Items Purchased Together” increases when the premise in the “Item List” exists, compared to when that premise does not exist.
If Lift is 1 or less, the presence of the premise does not increase the probability of the items being purchased together, making it a negligible rule.
Frequently Asked Questions about Market Basket Analysis
Common questions and answers regarding Market Basket Analysis are summarized here.
Q: What kind of metric is Lift?
Lift is a metric that indicates whether the purchase rate increases (or decreases) due to items being purchased together, compared to the purchase rate of a single item on its own. If Lift is greater than 1, it means that having a certain item in the cart increases the probability that the other item will be purchased.
For example, suppose the probability of wine being purchased alone is 25% of the total, but the probability of wine being purchased with meat is 33%. Calculating the Lift would be 33% / 25%, resulting in a Lift of 1.32.
Q: Can I increase the number of rules when only a few are displayed?
When running Market Basket Analysis, the number of rules displayed may sometimes be small.
This often happens when there are many rows and many items (e.g., products), and the proportion of each combination relative to the total (known as Support) is low.
In Exploratory, rules are displayed based on this Support threshold, which is set to “Auto” by default.
By changing this Support threshold, you can increase the number of rules displayed. In the Properties, change the “Minimum Support Selection Method” to “Manual” and specify a value for the “Minimum Support.” The lower you set this Minimum Support value, the more rules will be displayed.
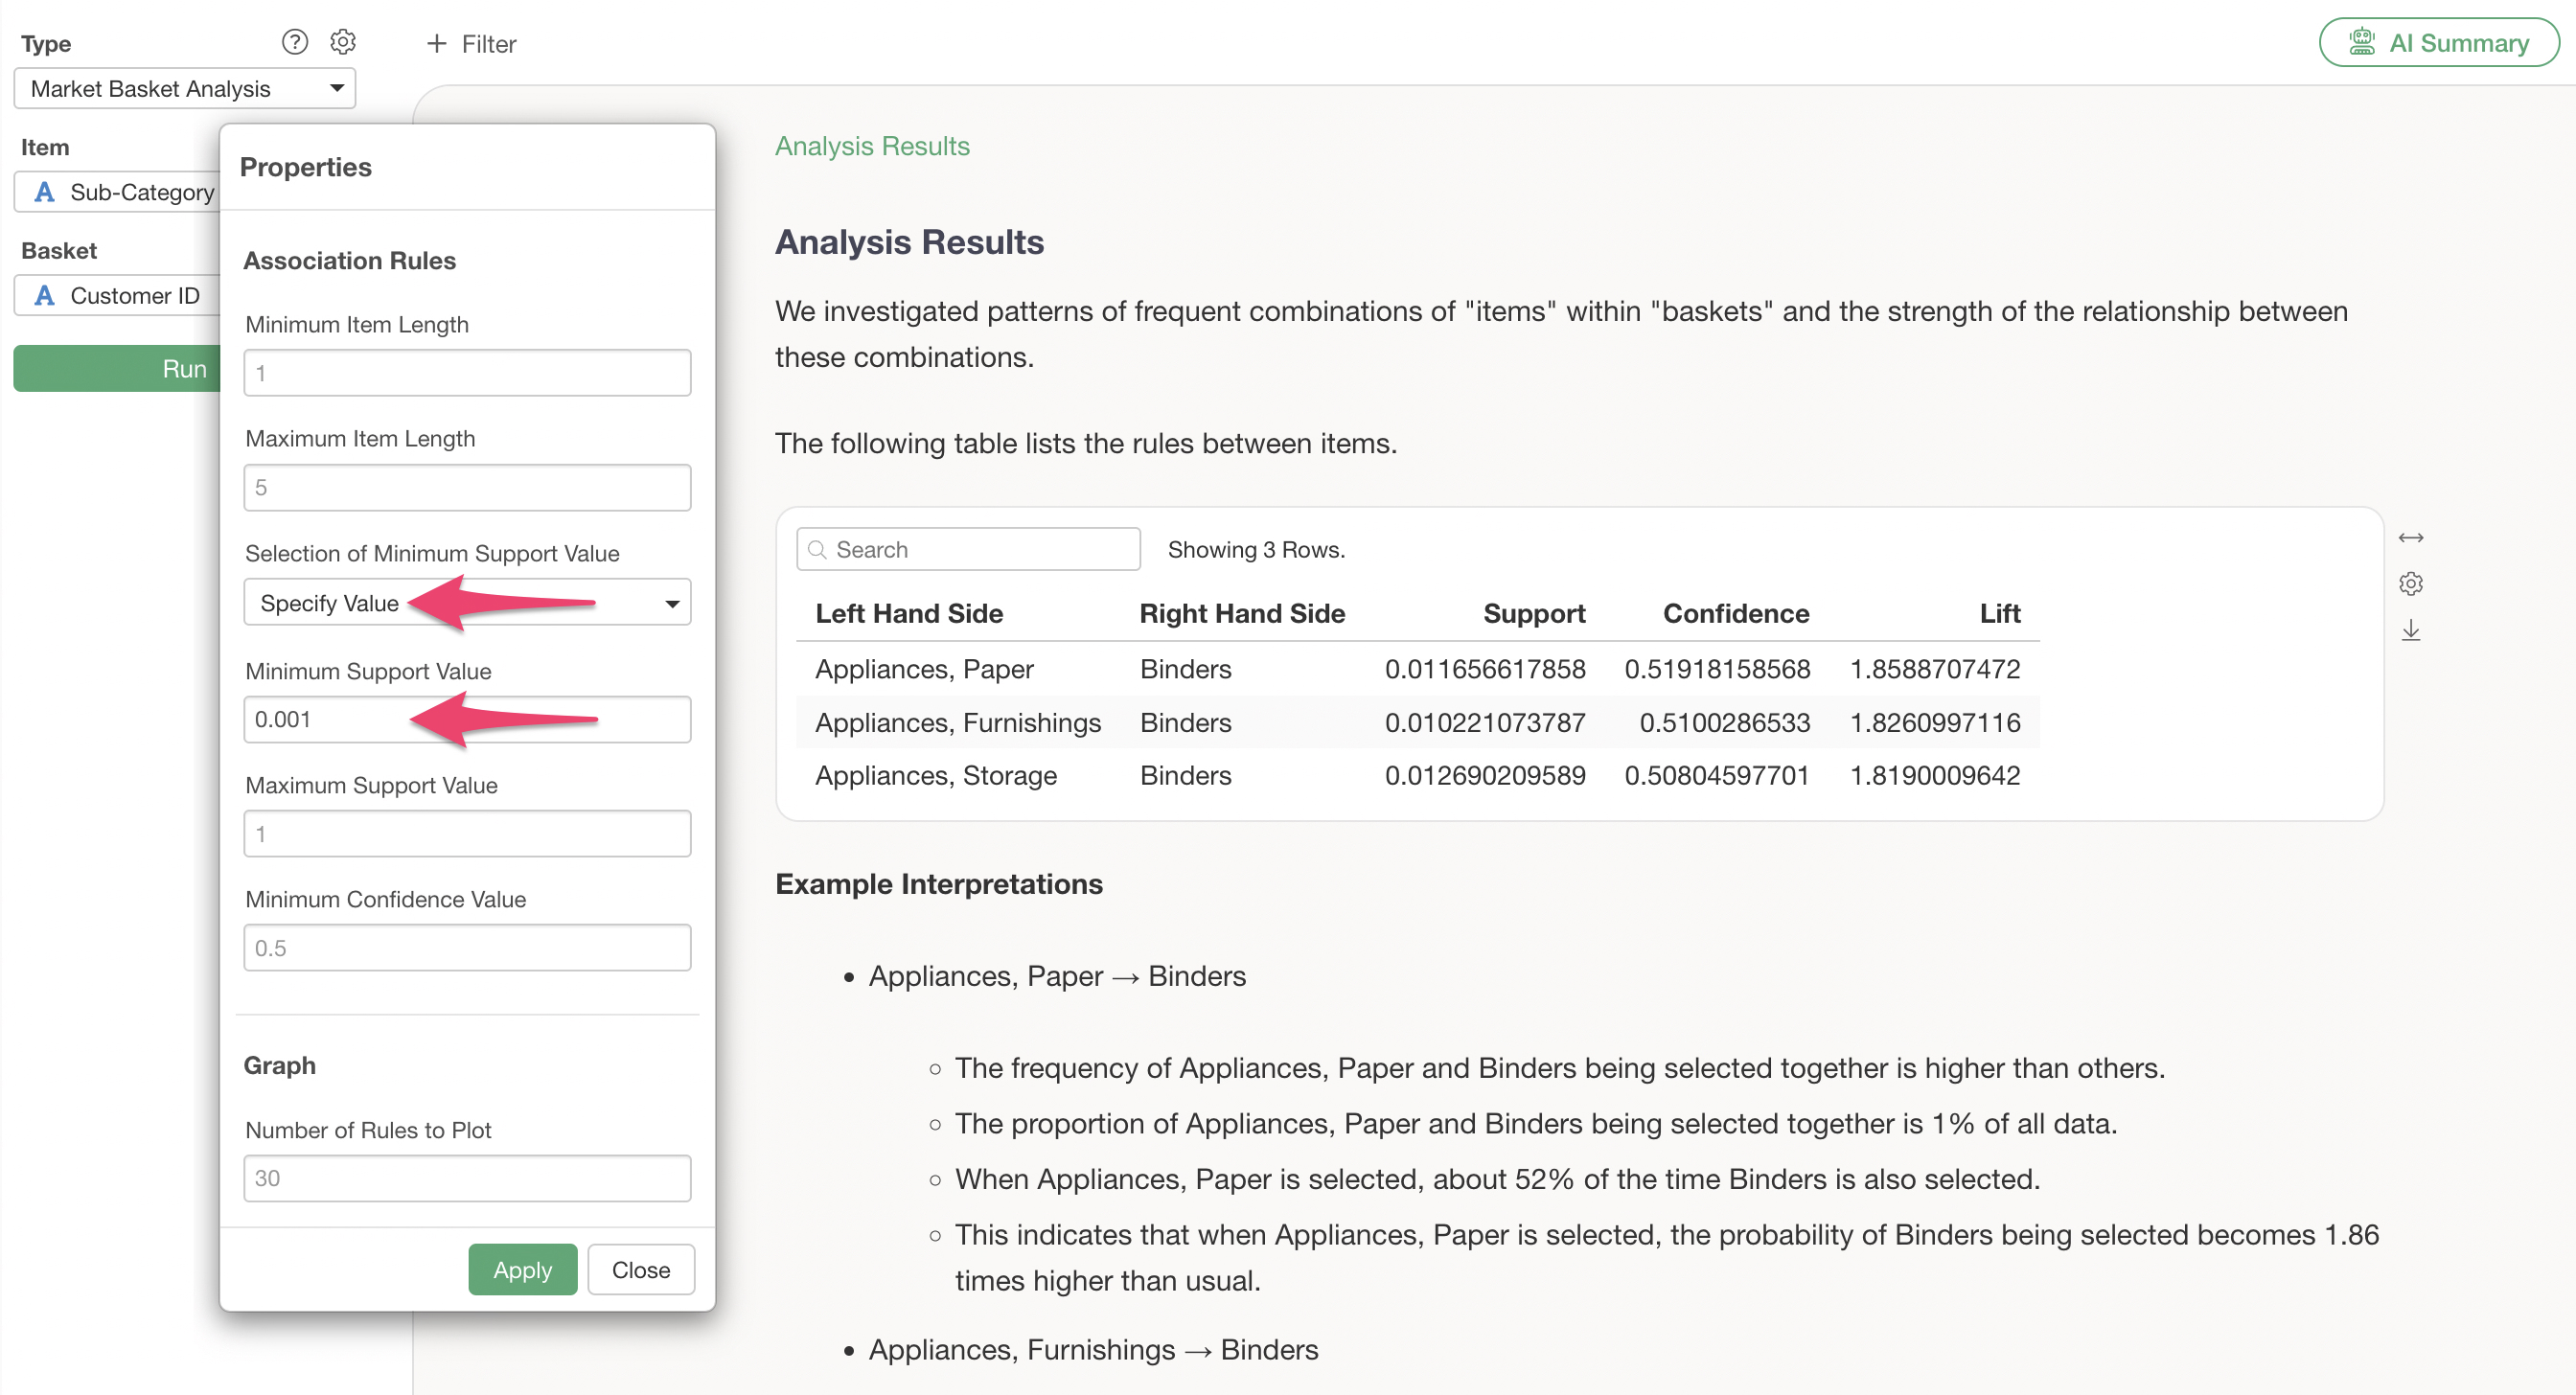
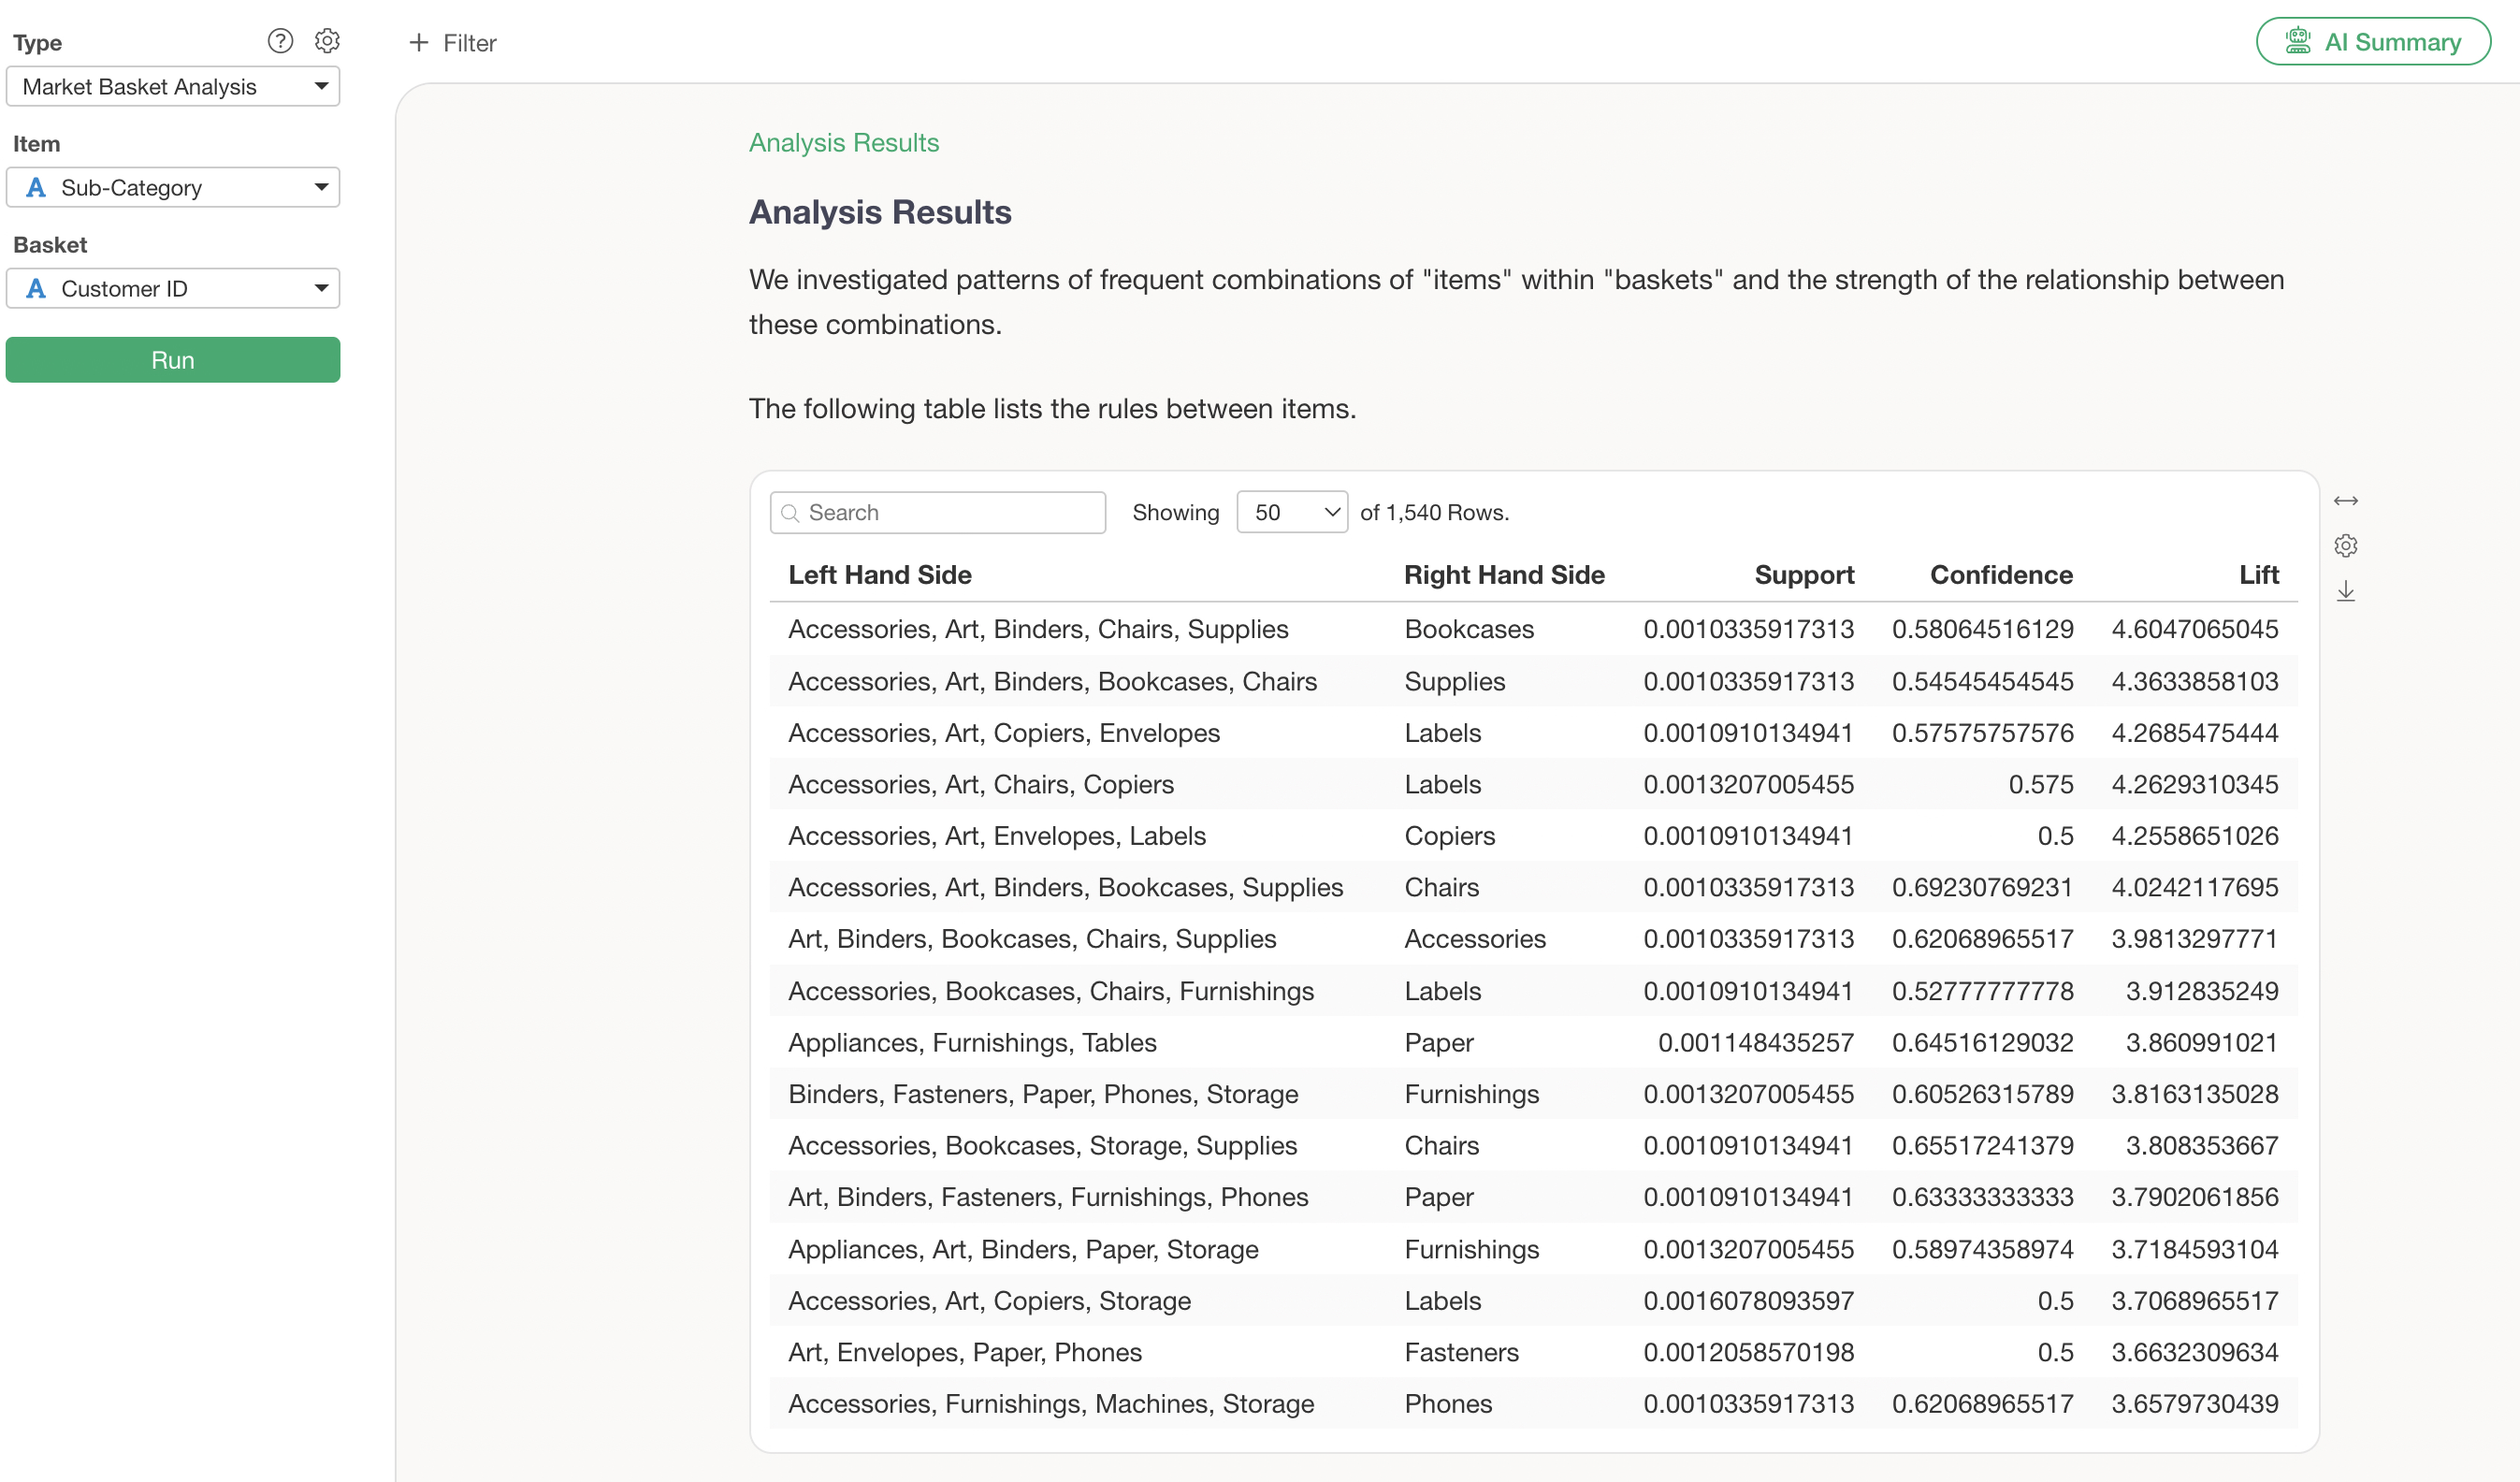
After applying the change, you can confirm that the number of displayed rules has increased.
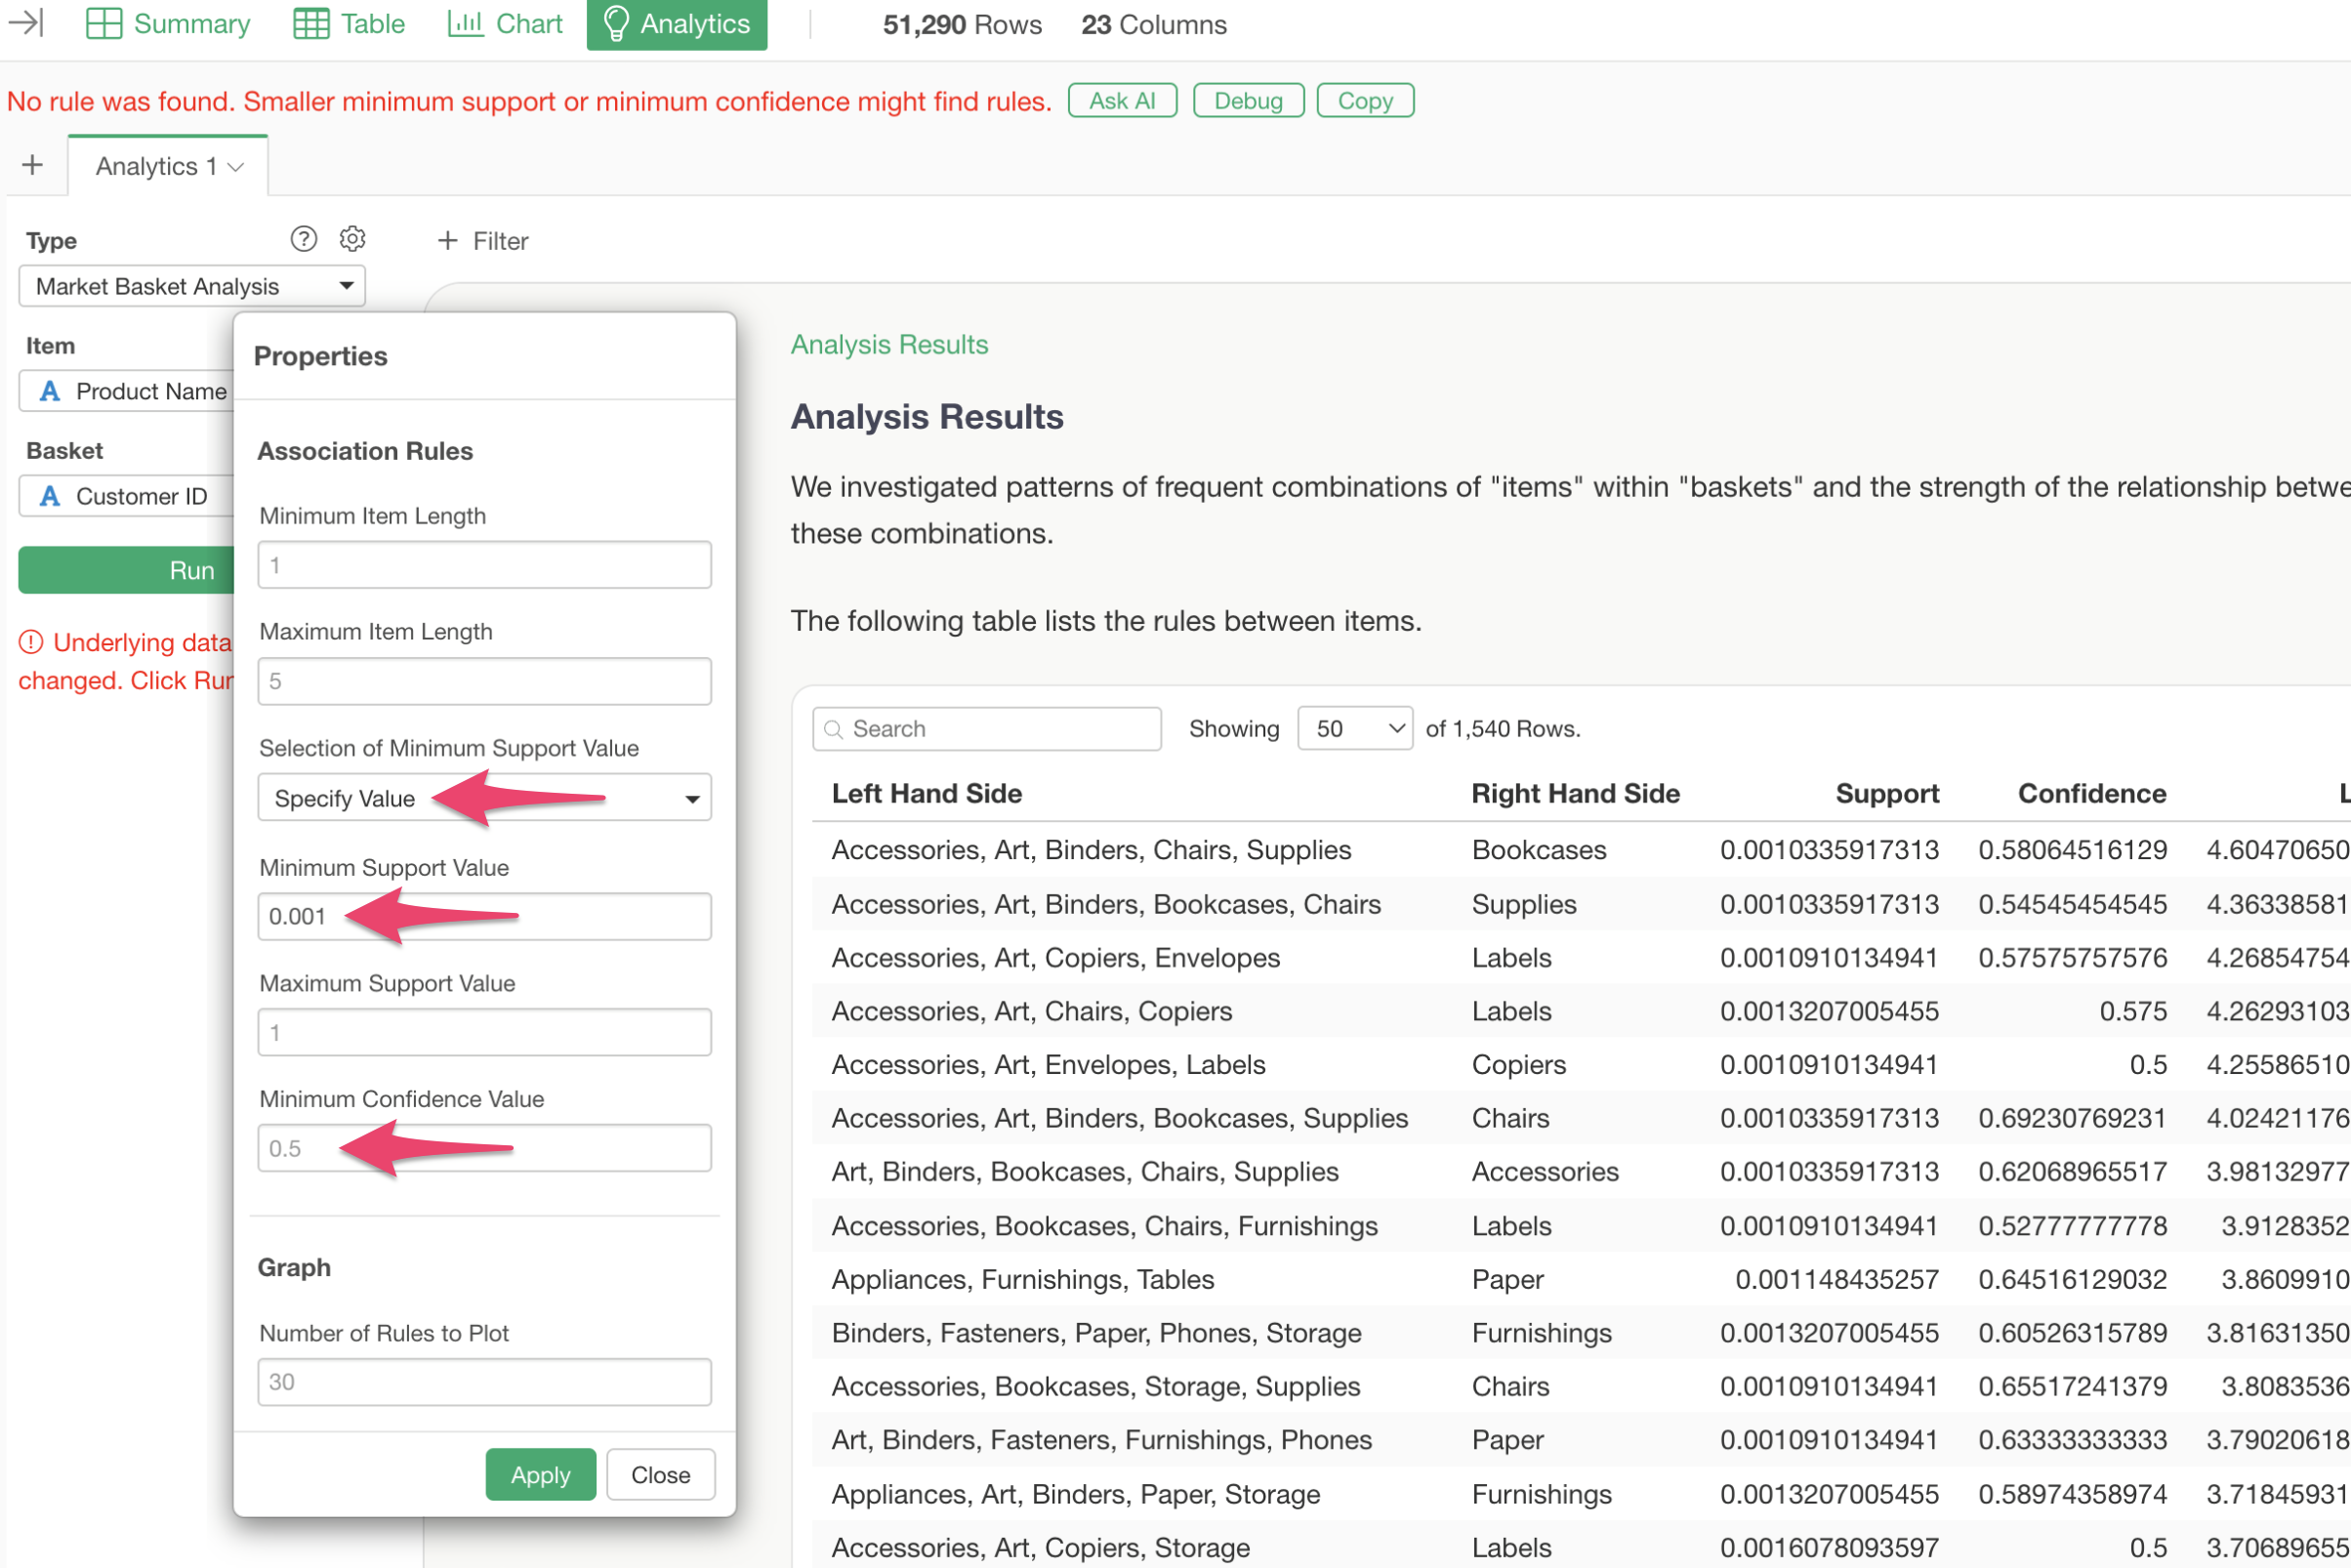
Q: When I run Market Basket Analysis, I get an error saying “No rule was found. Smaller minimum support or minimum confidence might find rules.”
When running Market Basket Analysis, you may encounter the following error:
No rule was found. Smaller minimum support or minimum confidence might find rules.
In most cases, this error occurs because no rules could be extracted using the current Minimum Support or Minimum Confidence thresholds.
You may be able to resolve this by going to the Analytics settings, changing the “Minimum Support Selection Method” to “Manual,” and lowering the minimum values for the Support or Confidence metrics.
On the other hand, if the error persists even after lowering the Minimum Support or Confidence, it is likely that no extractable rules exist within your data.