Introduction to Number
The Number is a great option if you want to show KPIs or metrics as number in Dashboard.
Here's how you can quickly create Numbers.
Sample Data
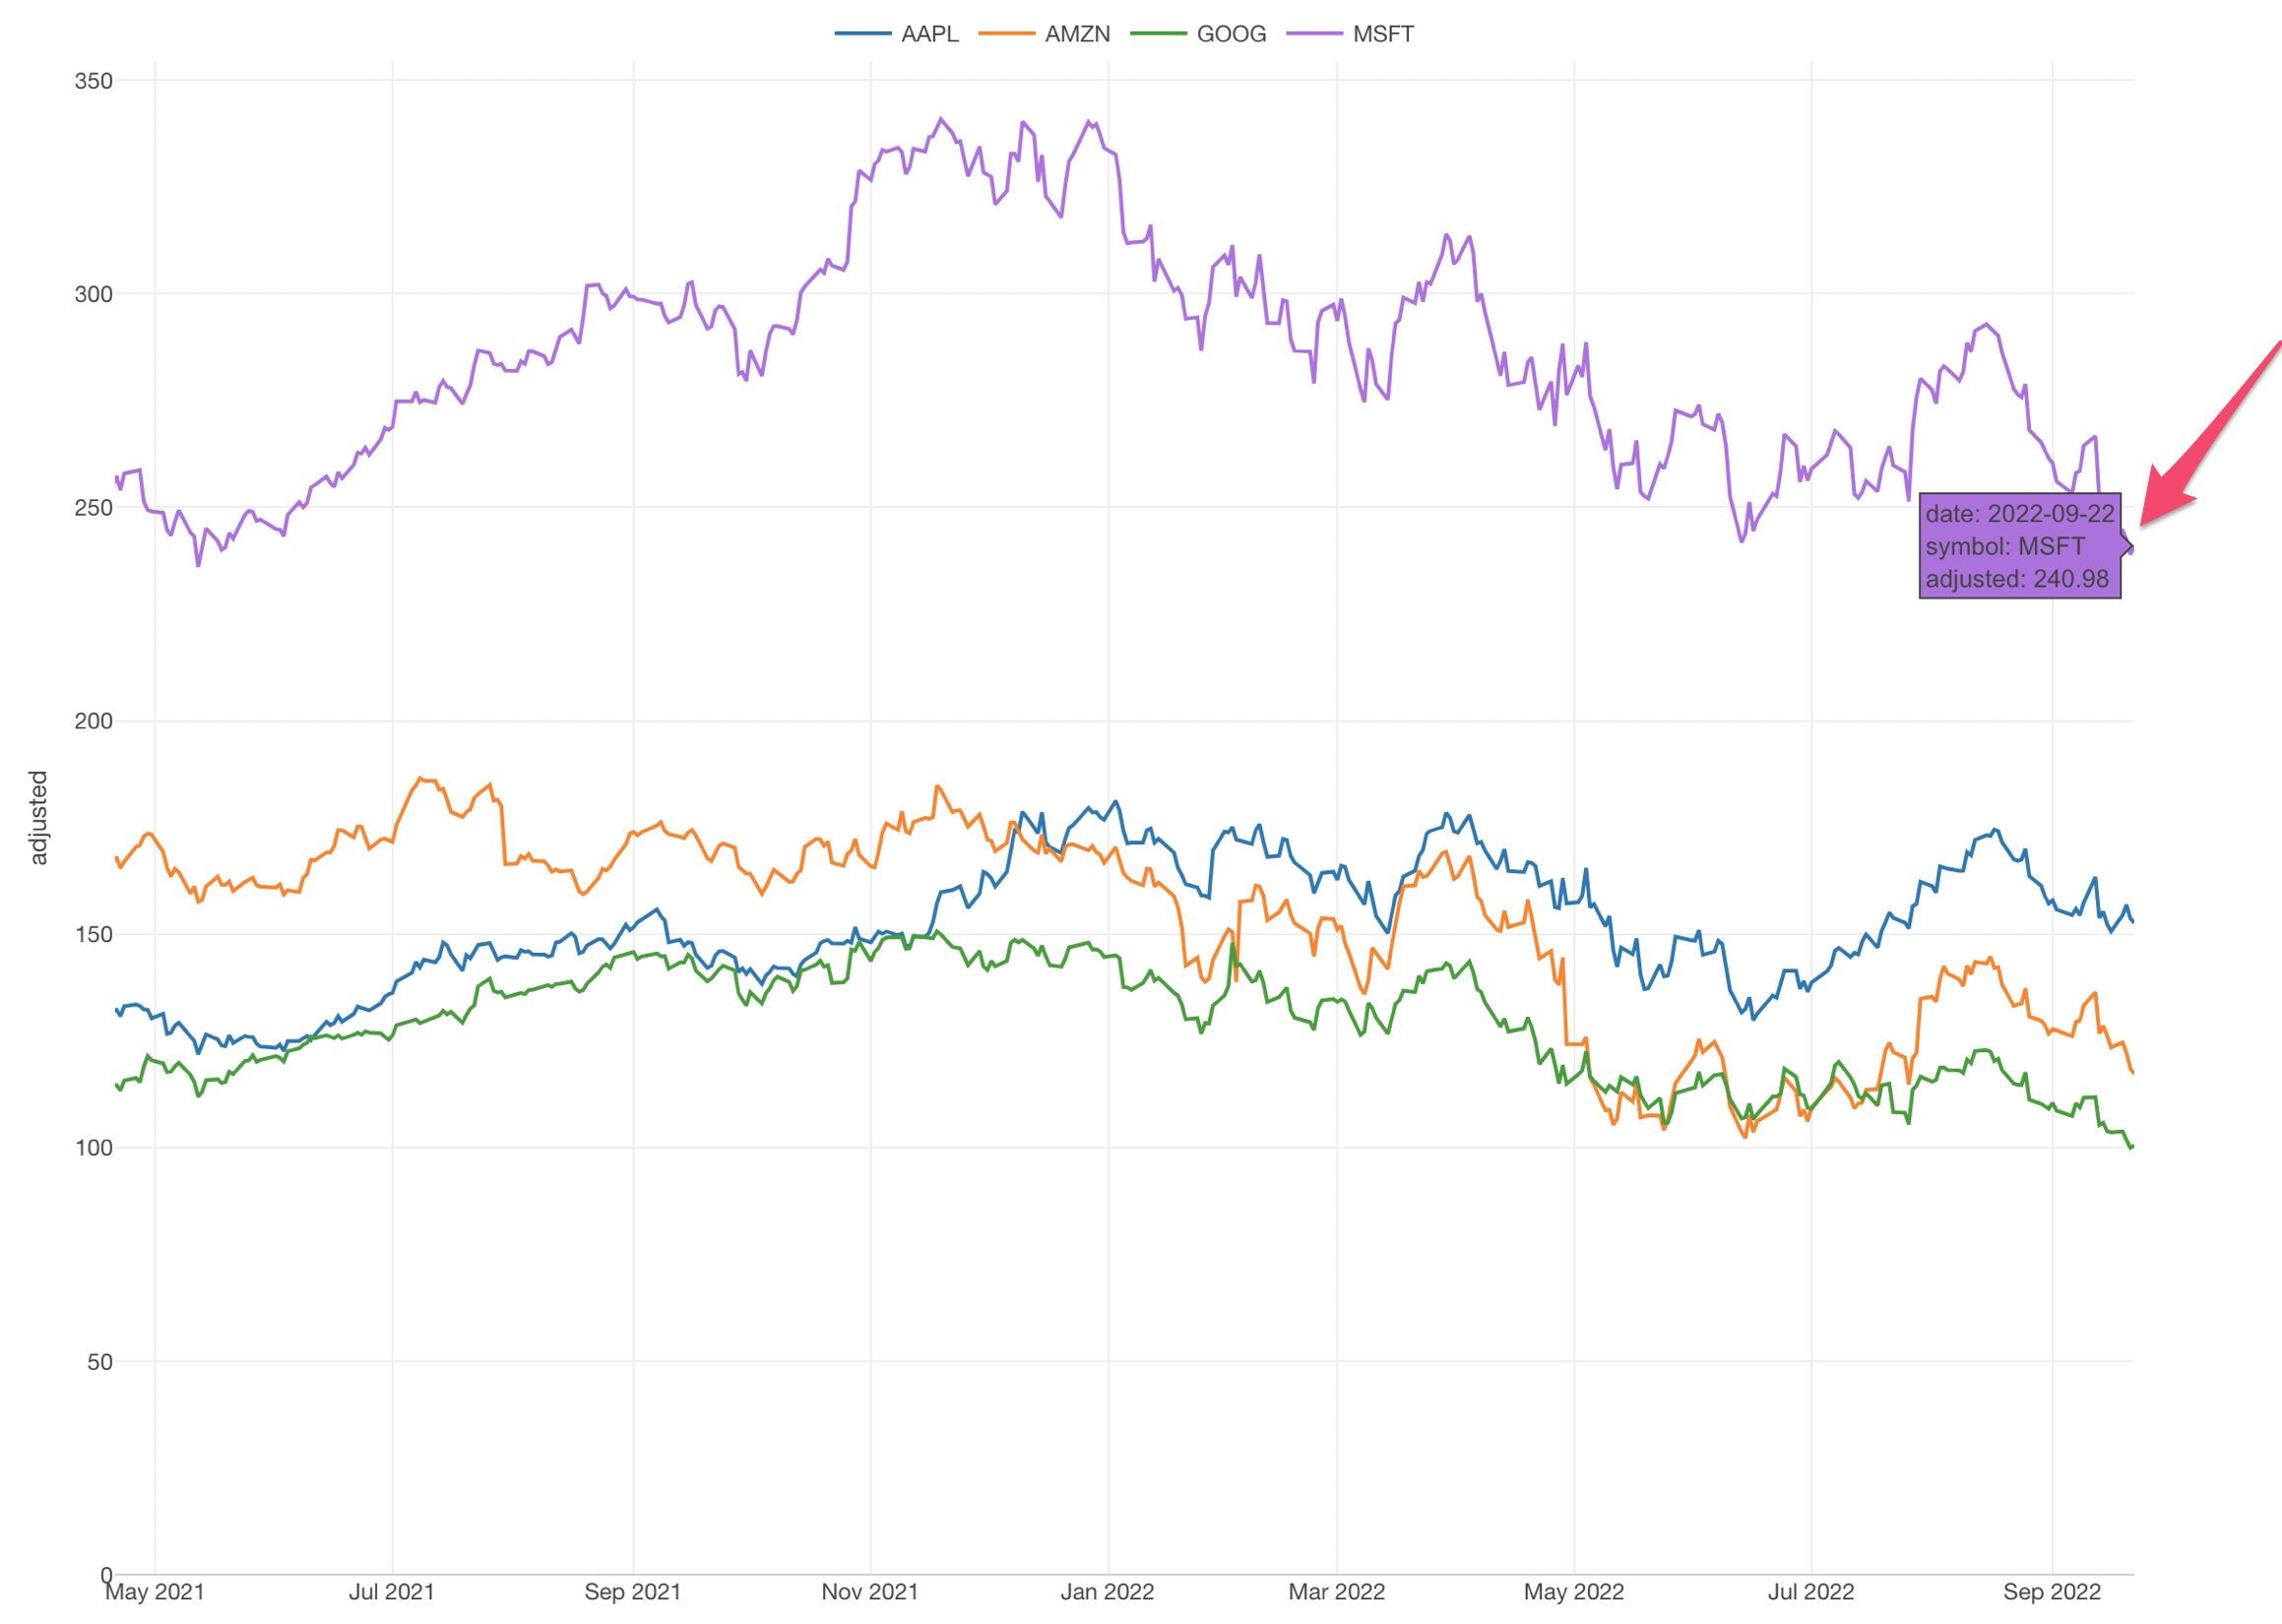
We'll use this Stock Price. You can download it from this page.
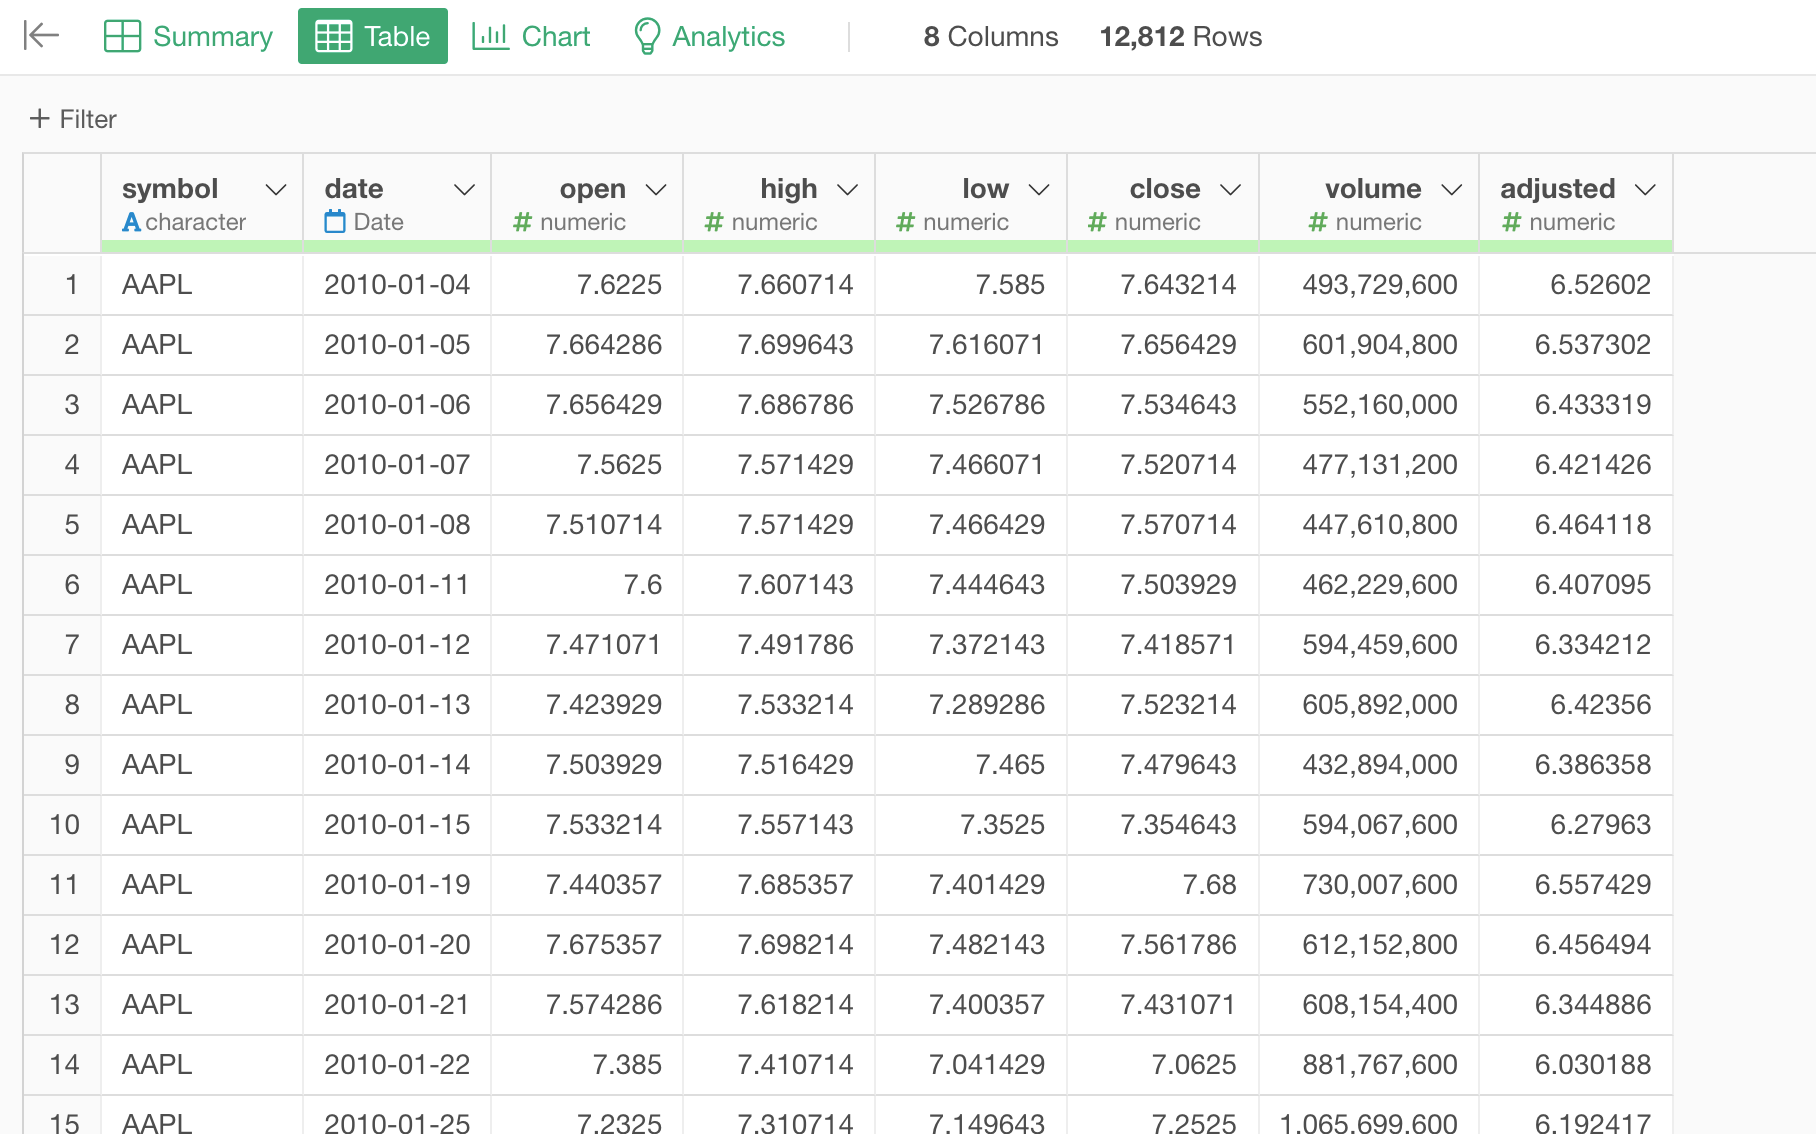
In this data, each row represents a daily stock price for each of the tech companies (e.g. Apple). The 'Adjusted' column holds the daily prices that have been adjusted for the price changes due to stock split events throughout the time.
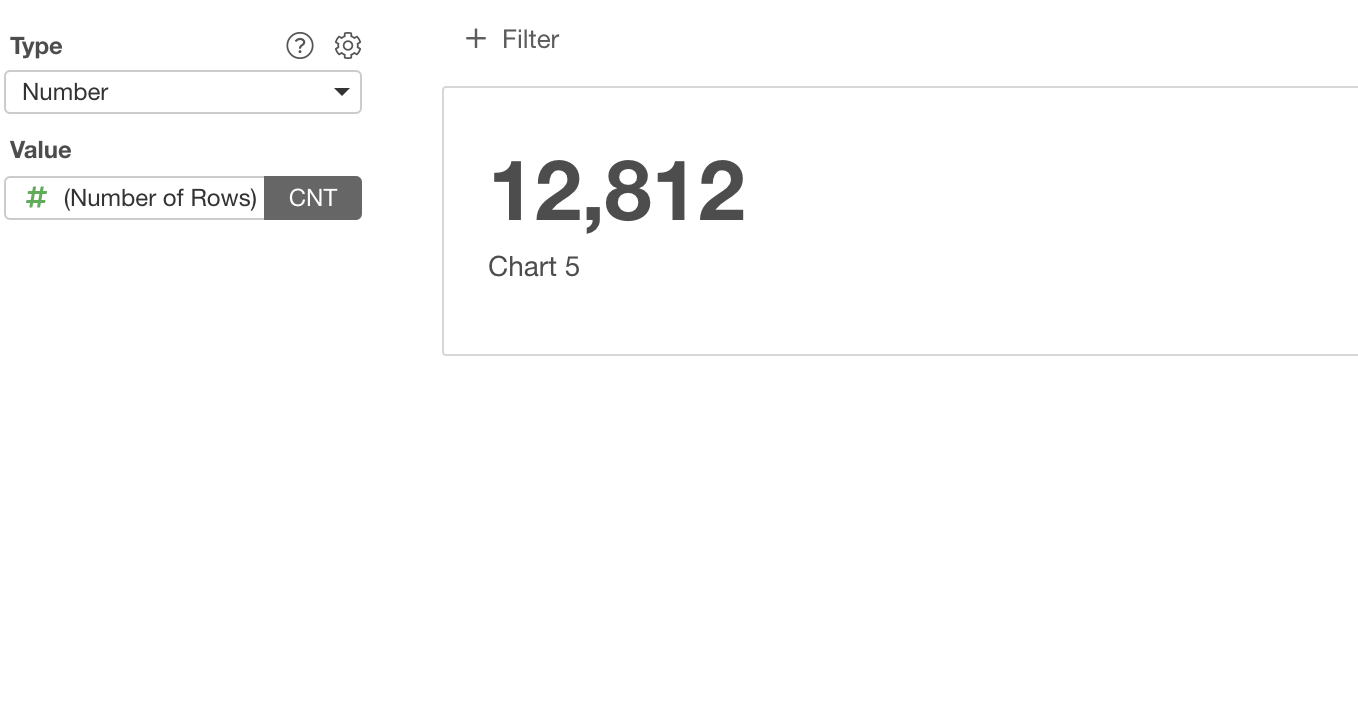
1. Create Number
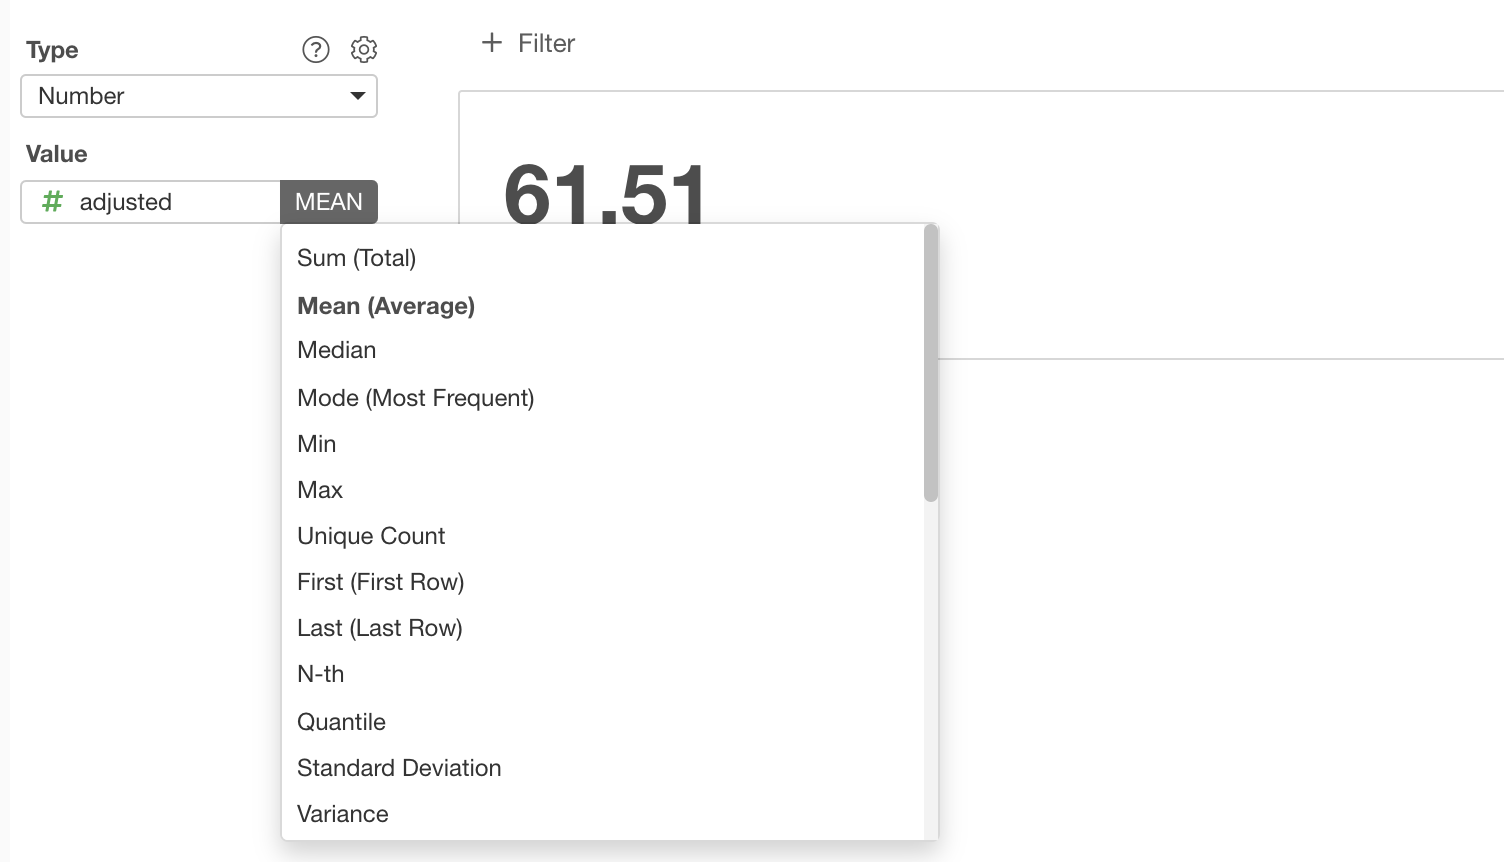
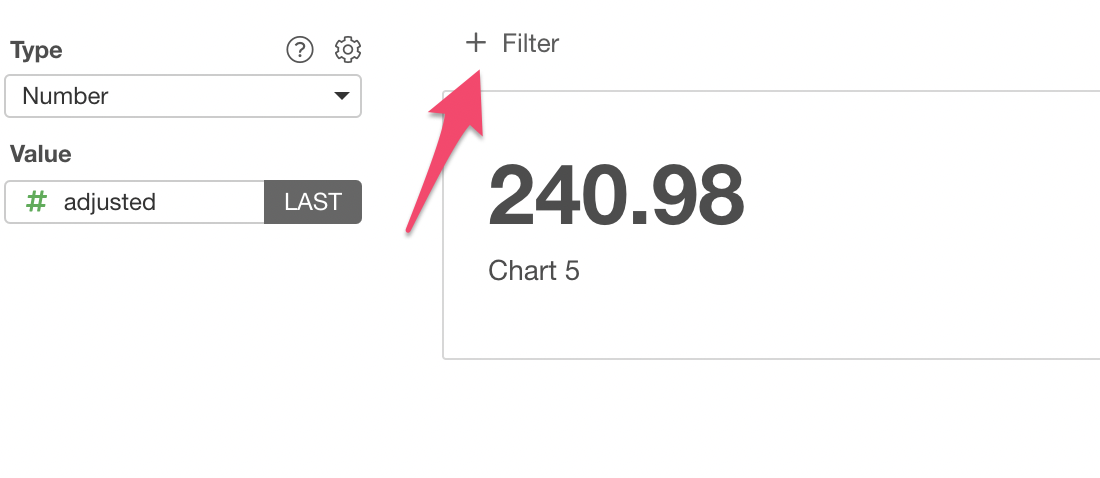
Select 'Number' as the Type.
Select 'Adjusted' column as the Value.
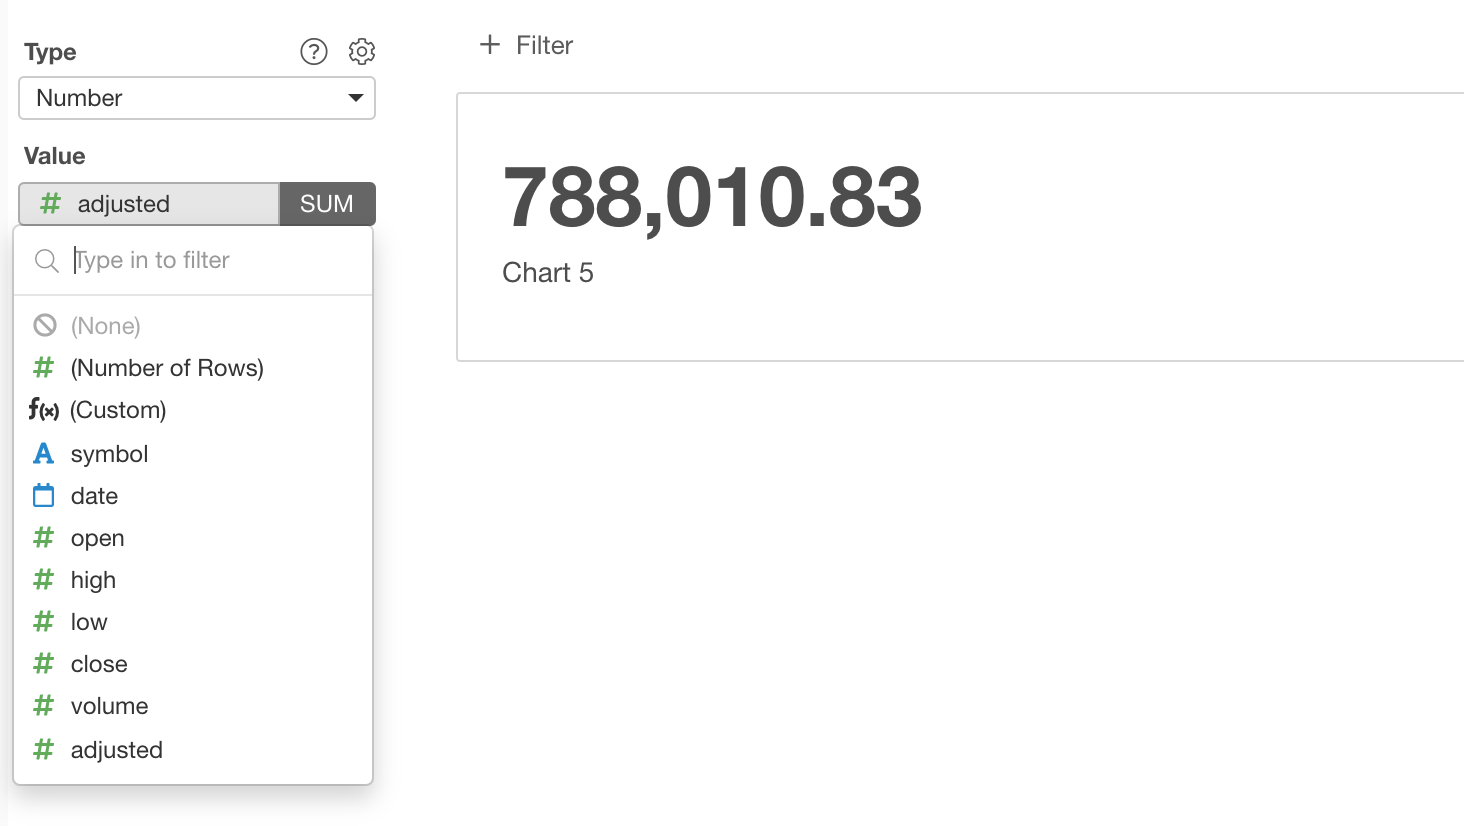
We can switch the aggregate function to Mean.
2. Use 'Last' to Show the Latest Value
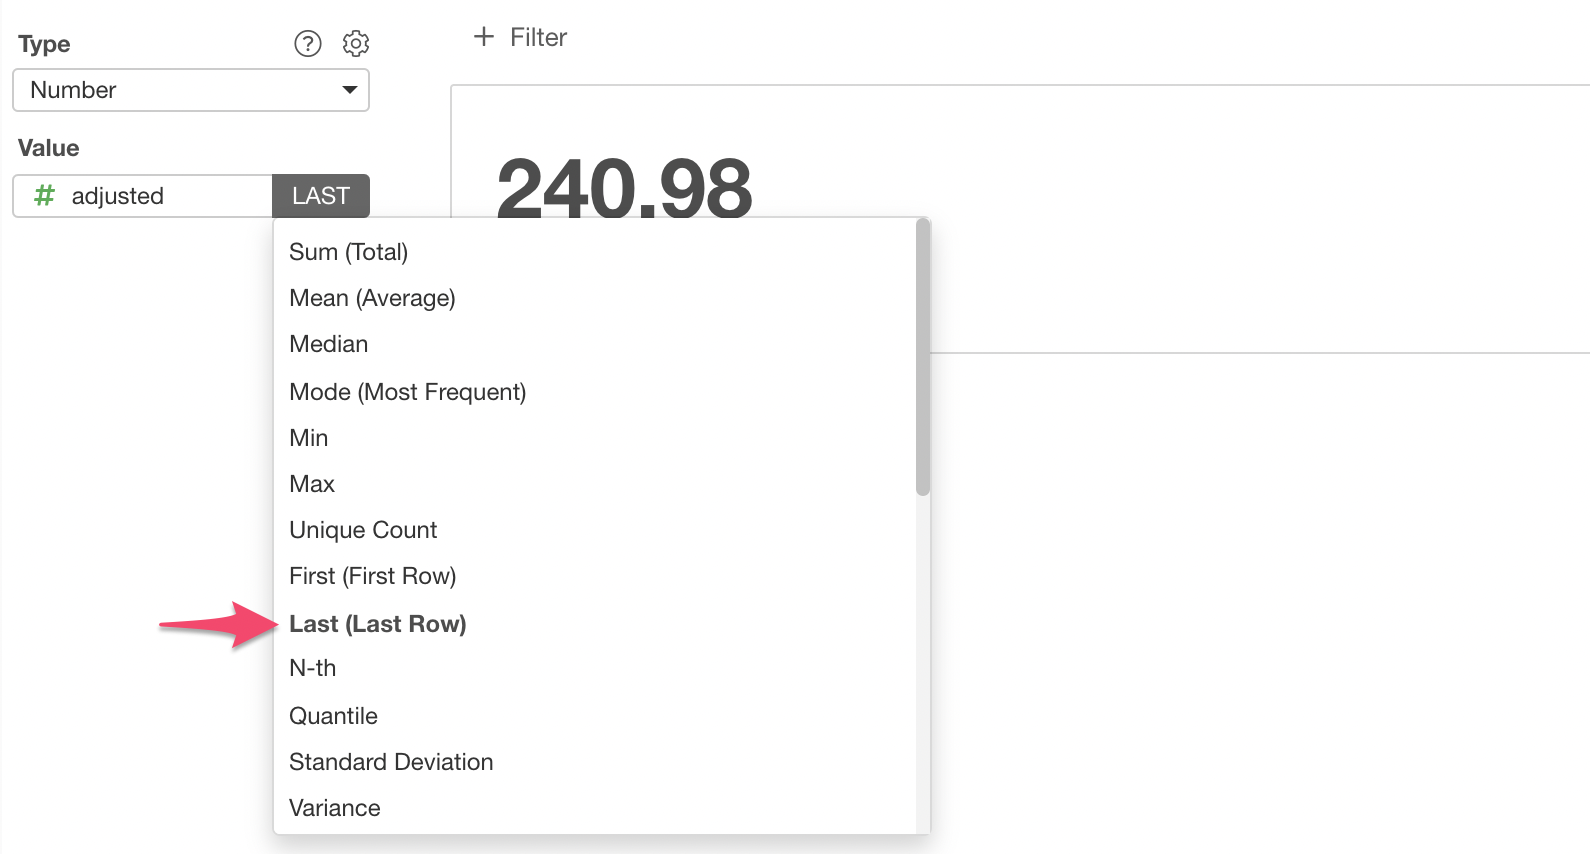
Sometimes, you might want to show the latest value of the series, rather than the average of the whole data.
In such cases, you can use 'Last' function.
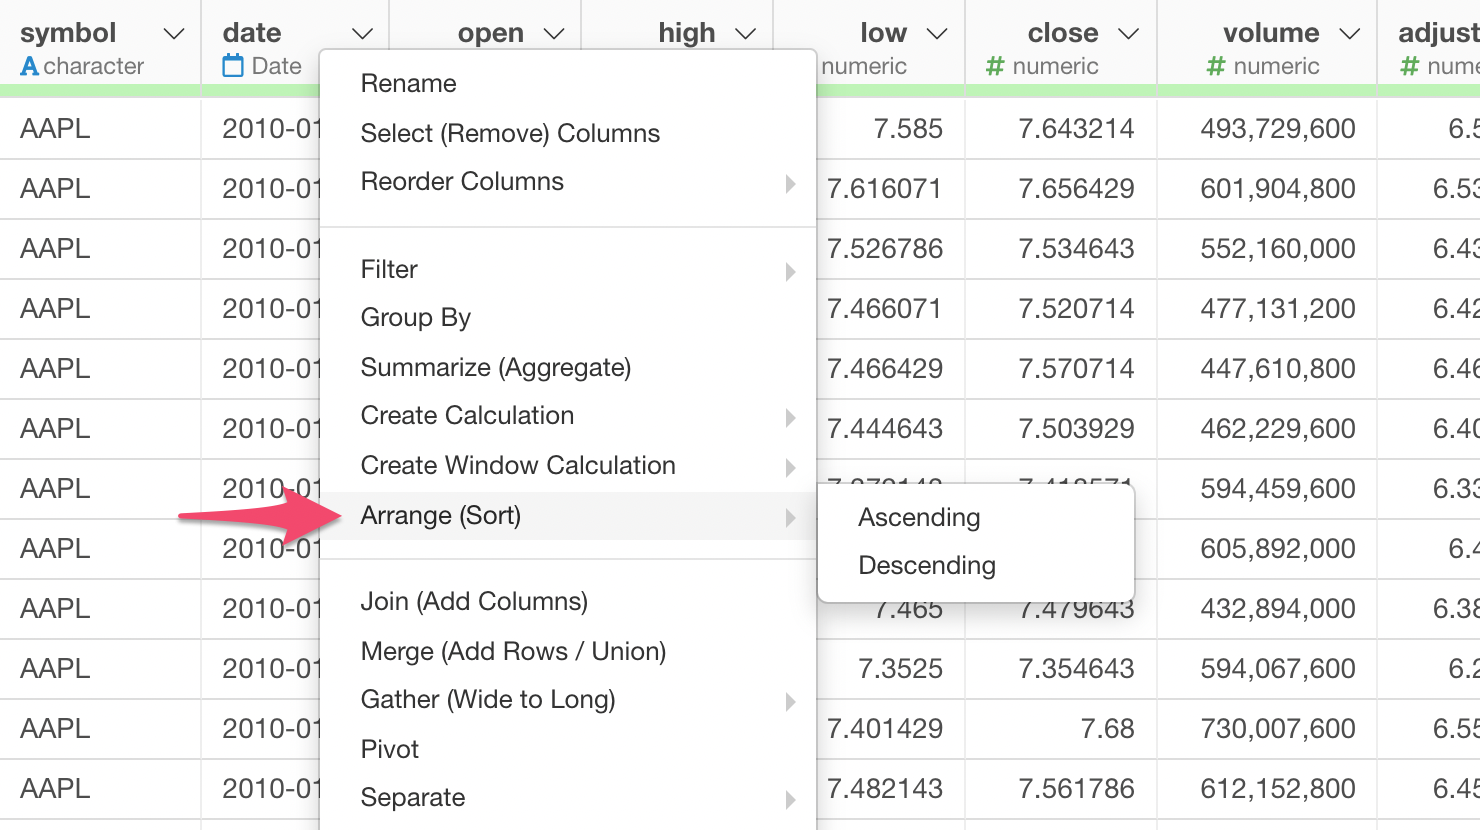
Make sure that the data is sorted by the date before you do this. If not, you can sort the data by selecting 'Arrange' from the column header menu.
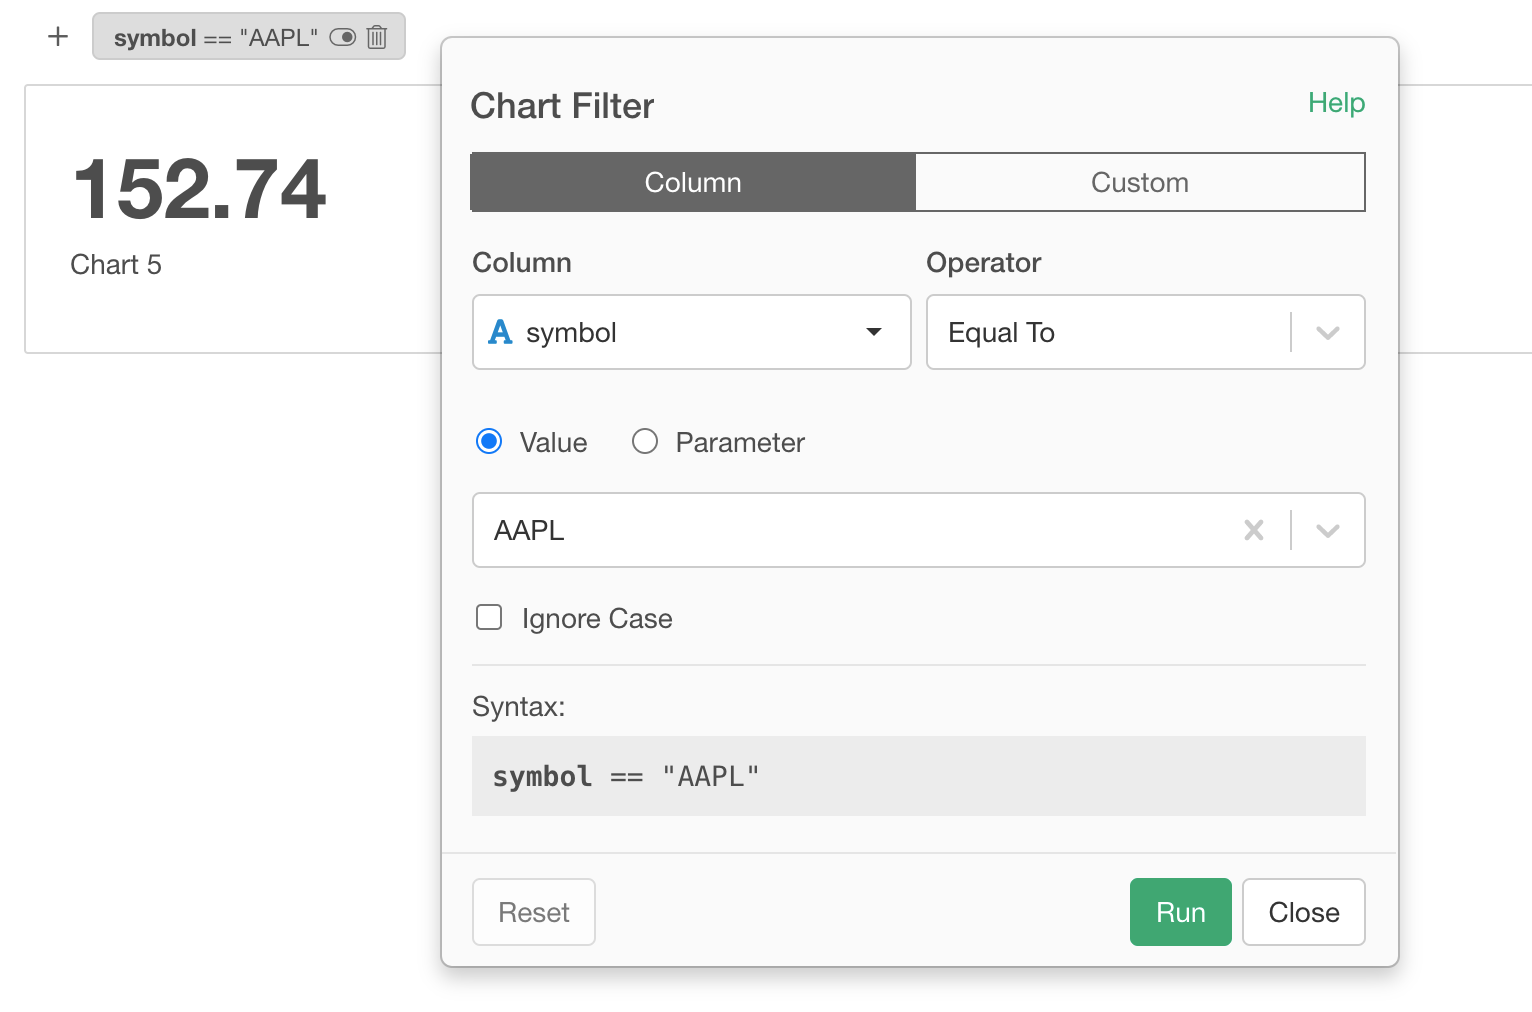
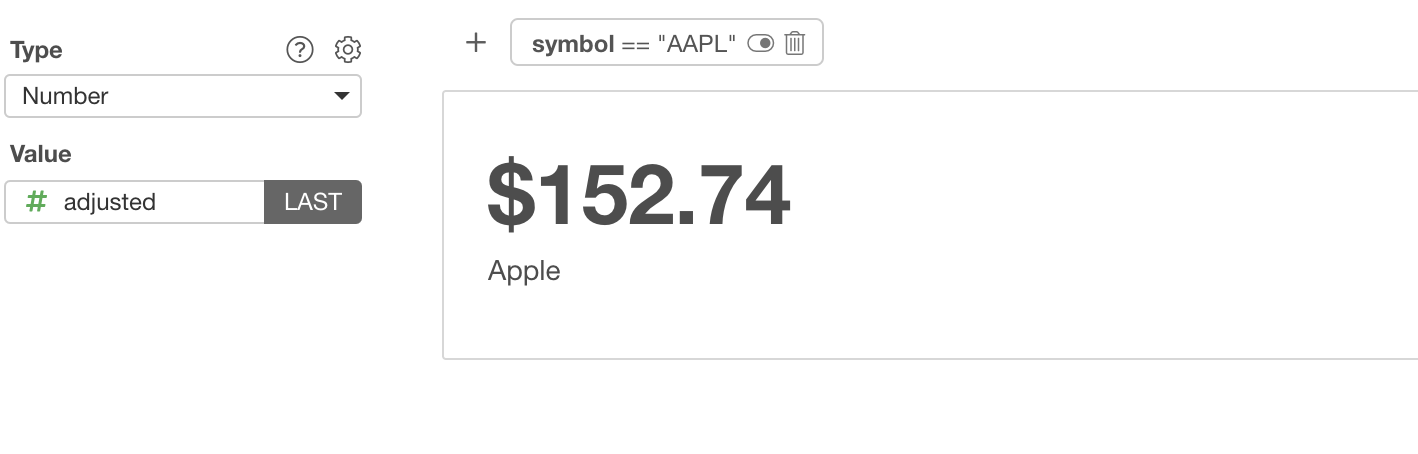
3. Use Chart Filter to Show Only Apple's Stock Price
So far, we have shown the last value of all the stock price data, and that happens to be the one for Microsoft (MSFT). But let's say we want to show the last price of Apple (AAPL), not Microsoft. If that's the case, we can use 'Chart Filter' to get the Apple's last price.
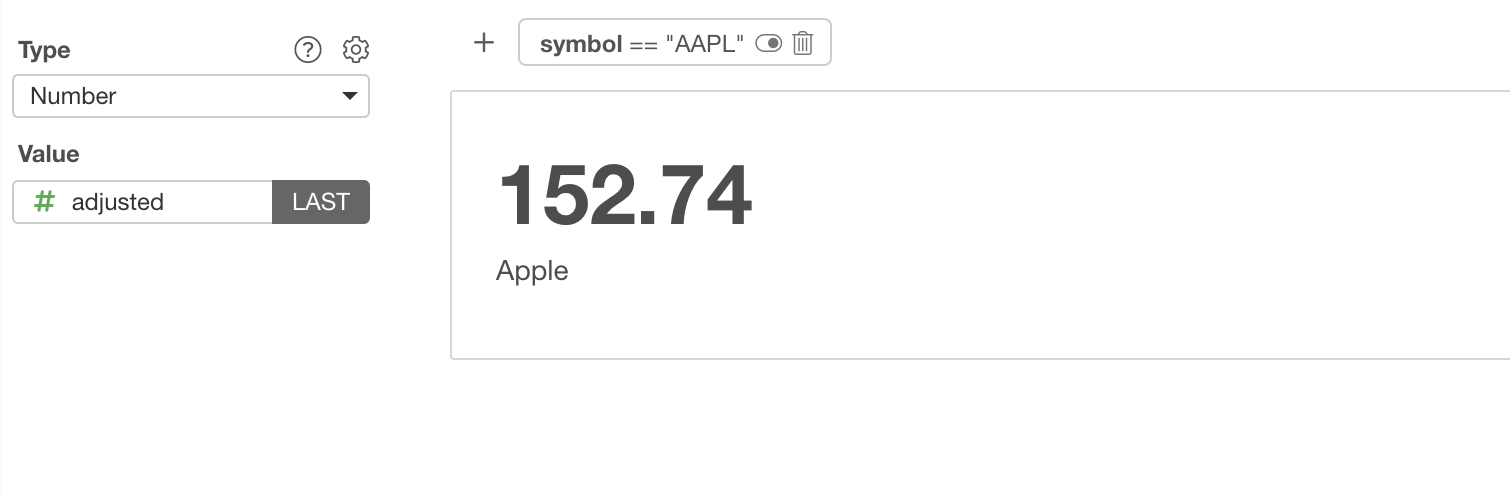
Now, you've got the Apple's last day price.
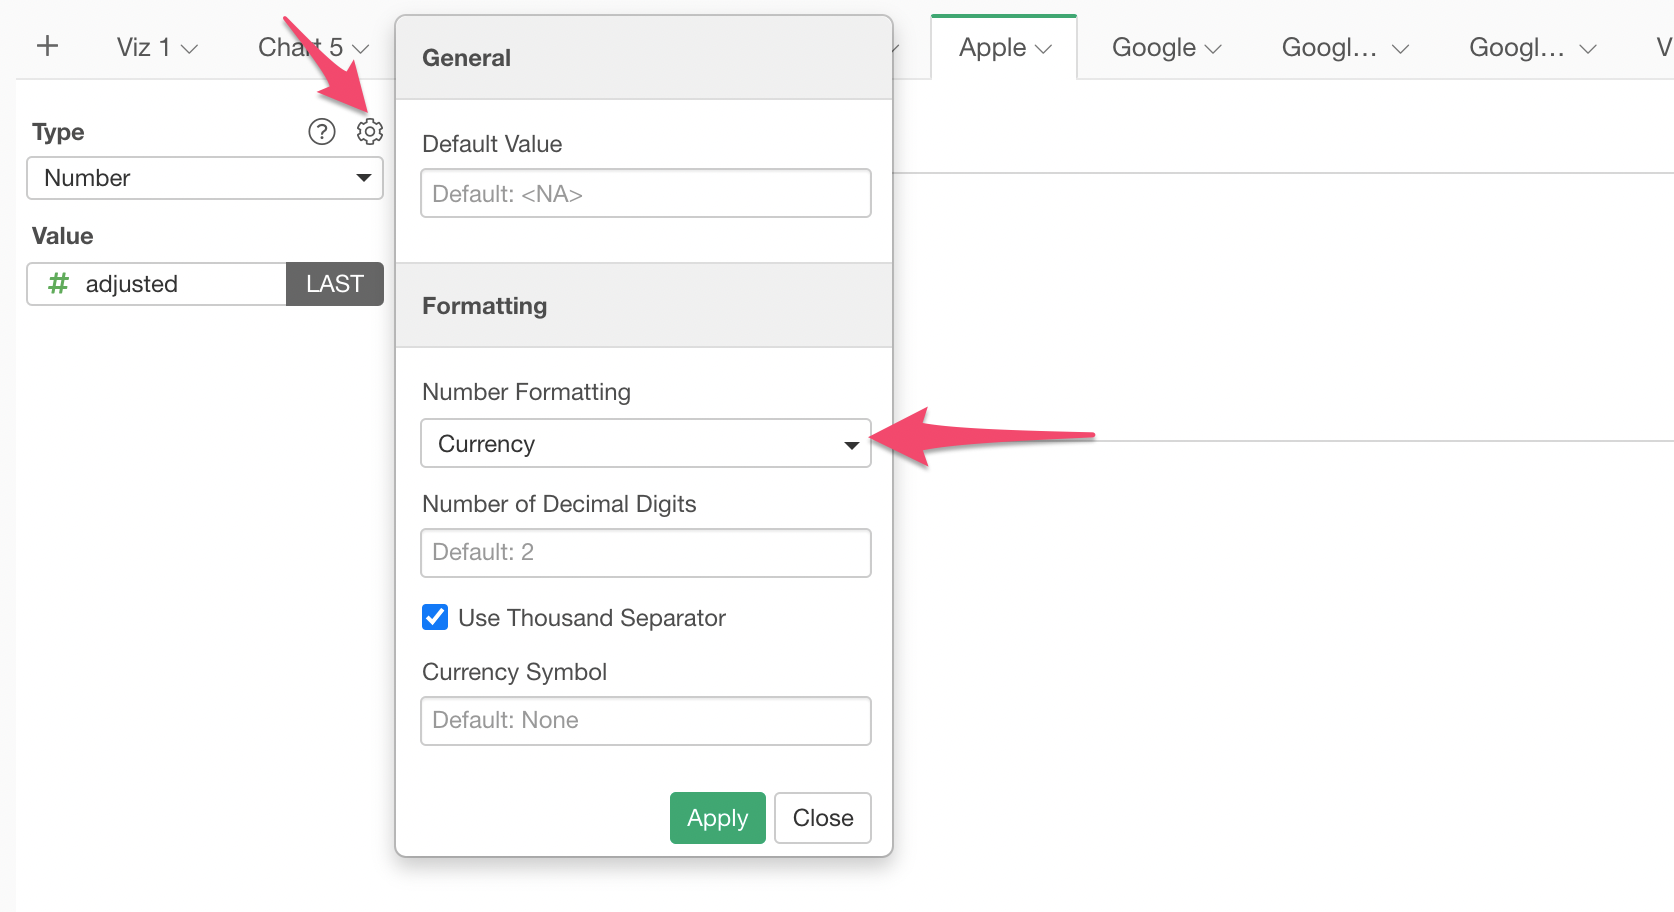
4. Format Numbers
You can format the number from the property.
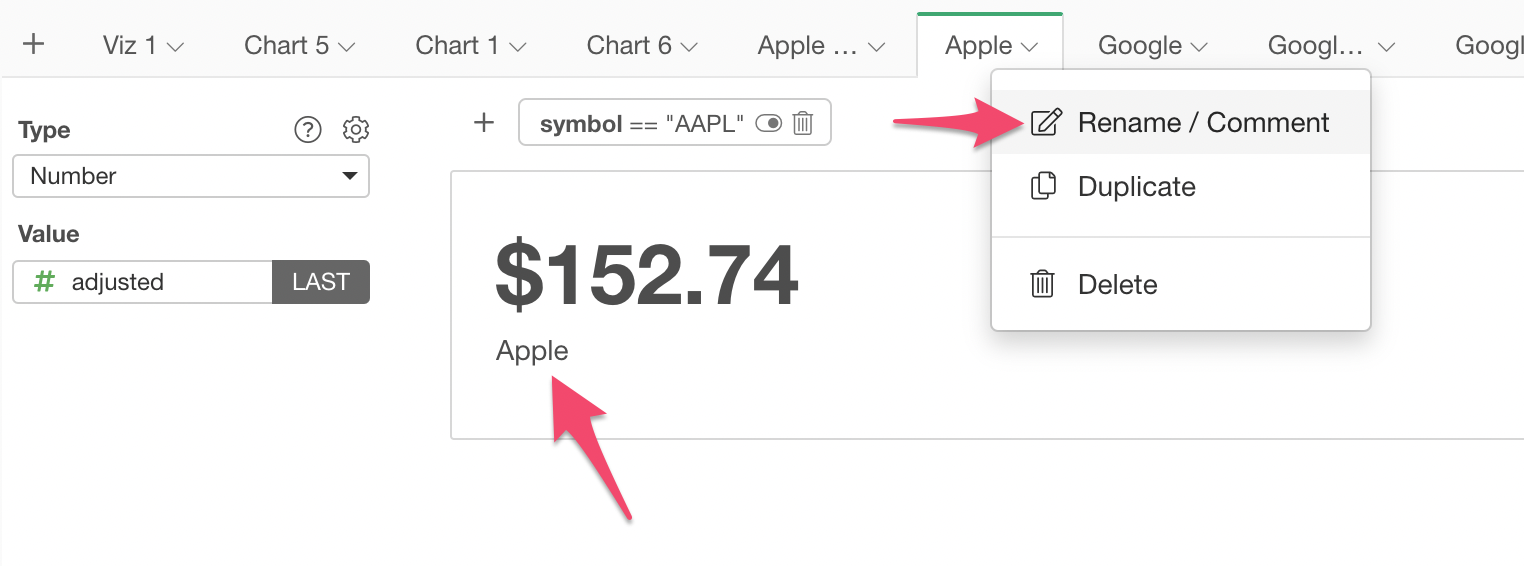
5. Change the Title Text
The text underneath the number is coming from the Chart Tab name. You can rename it by selecting 'Rename / Comment' from the tab menu.
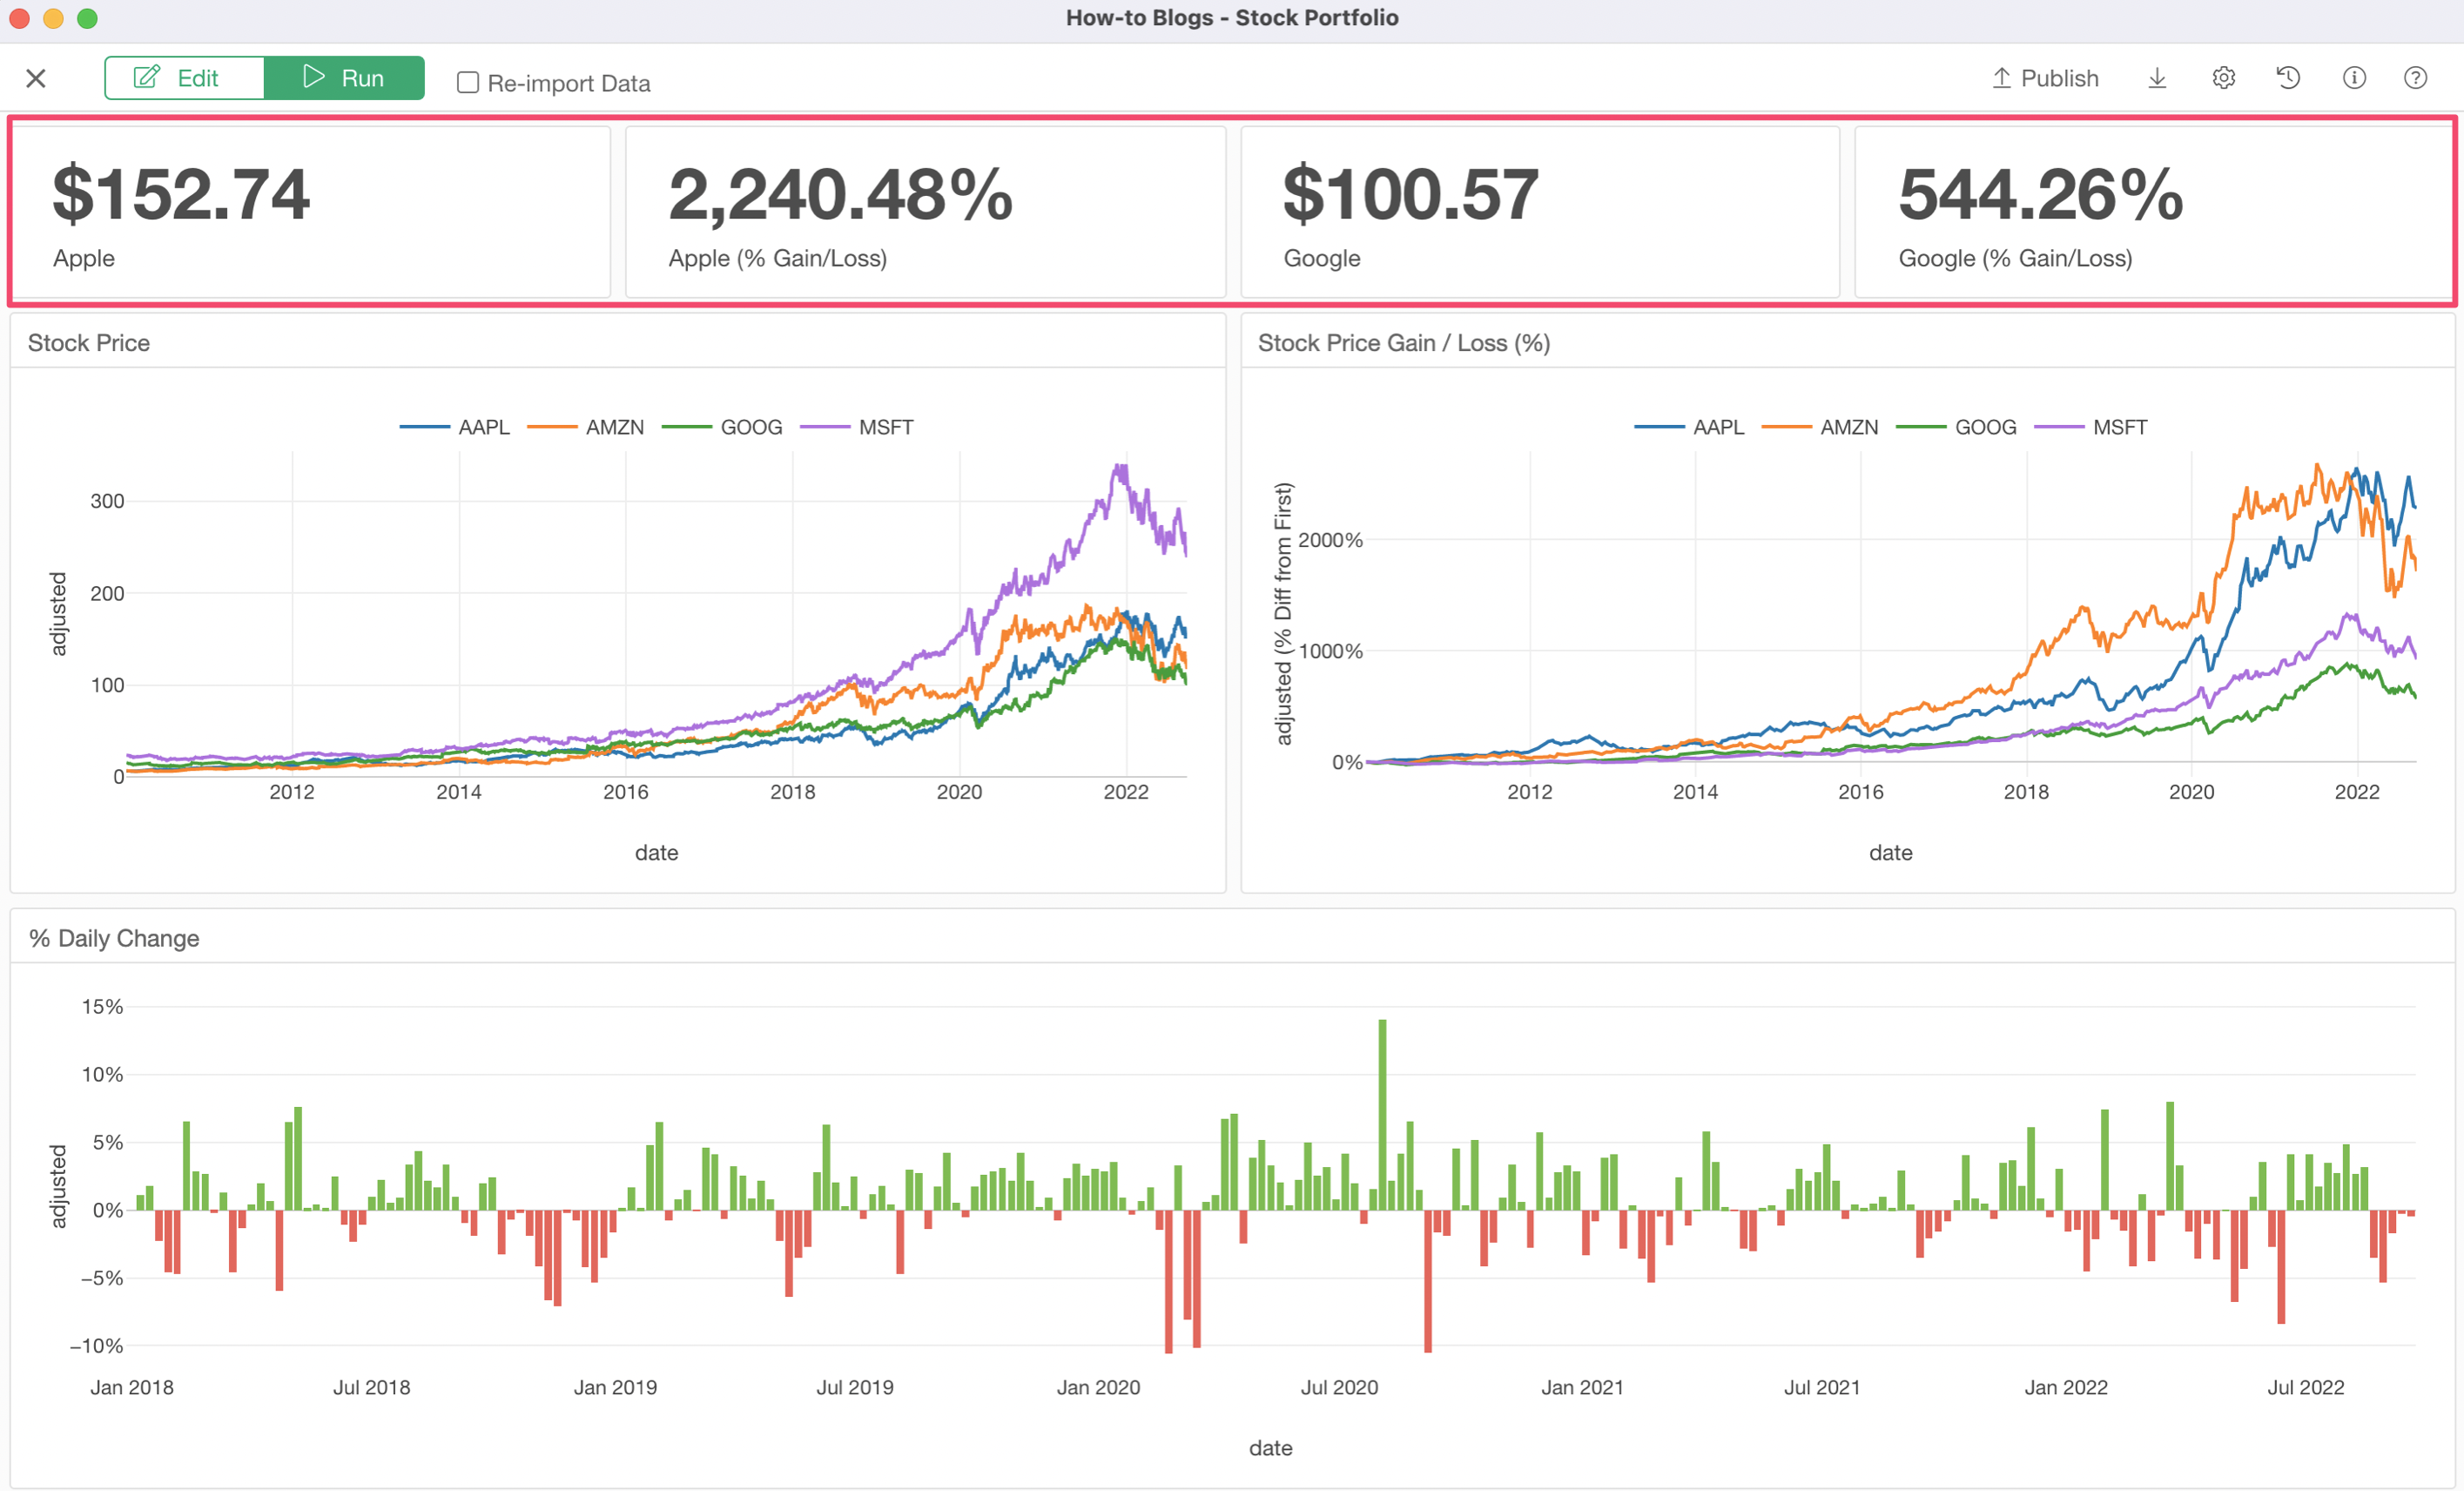
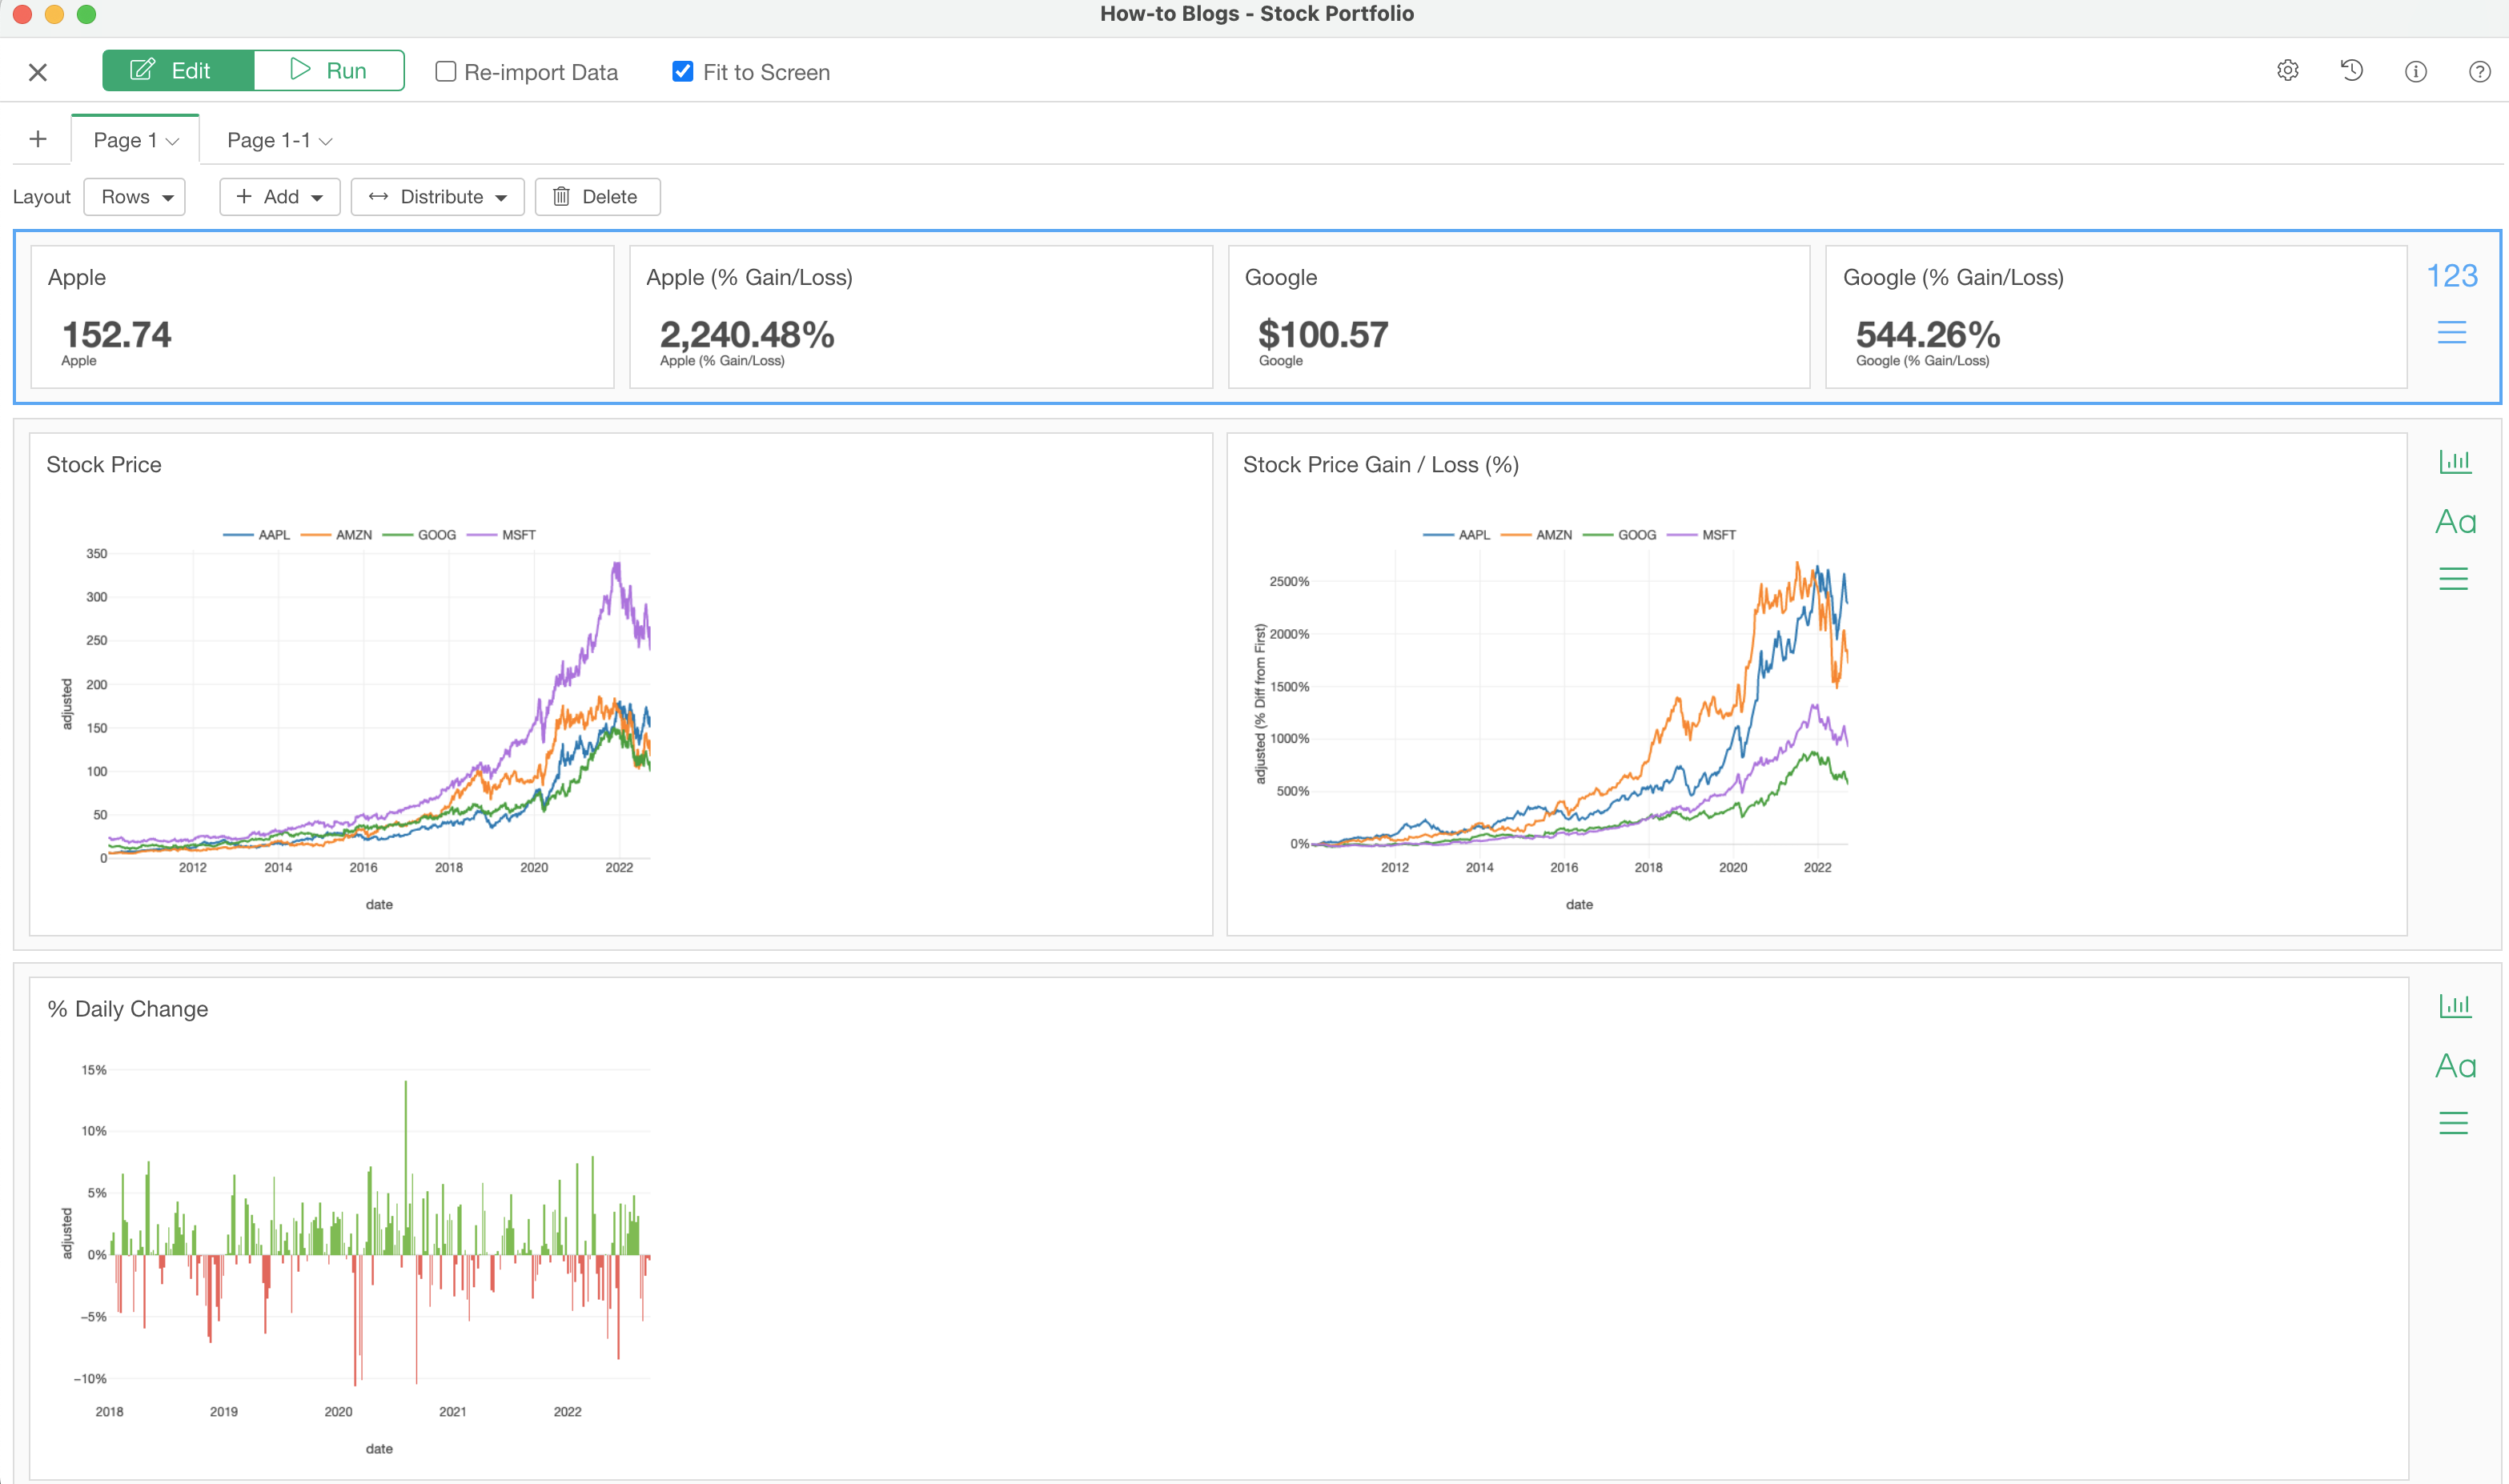
6. Add to Dashboard!
Now you can add the Number to Dashboard!
Make sure to add the Number specific row in the dashboard before adding the Number.
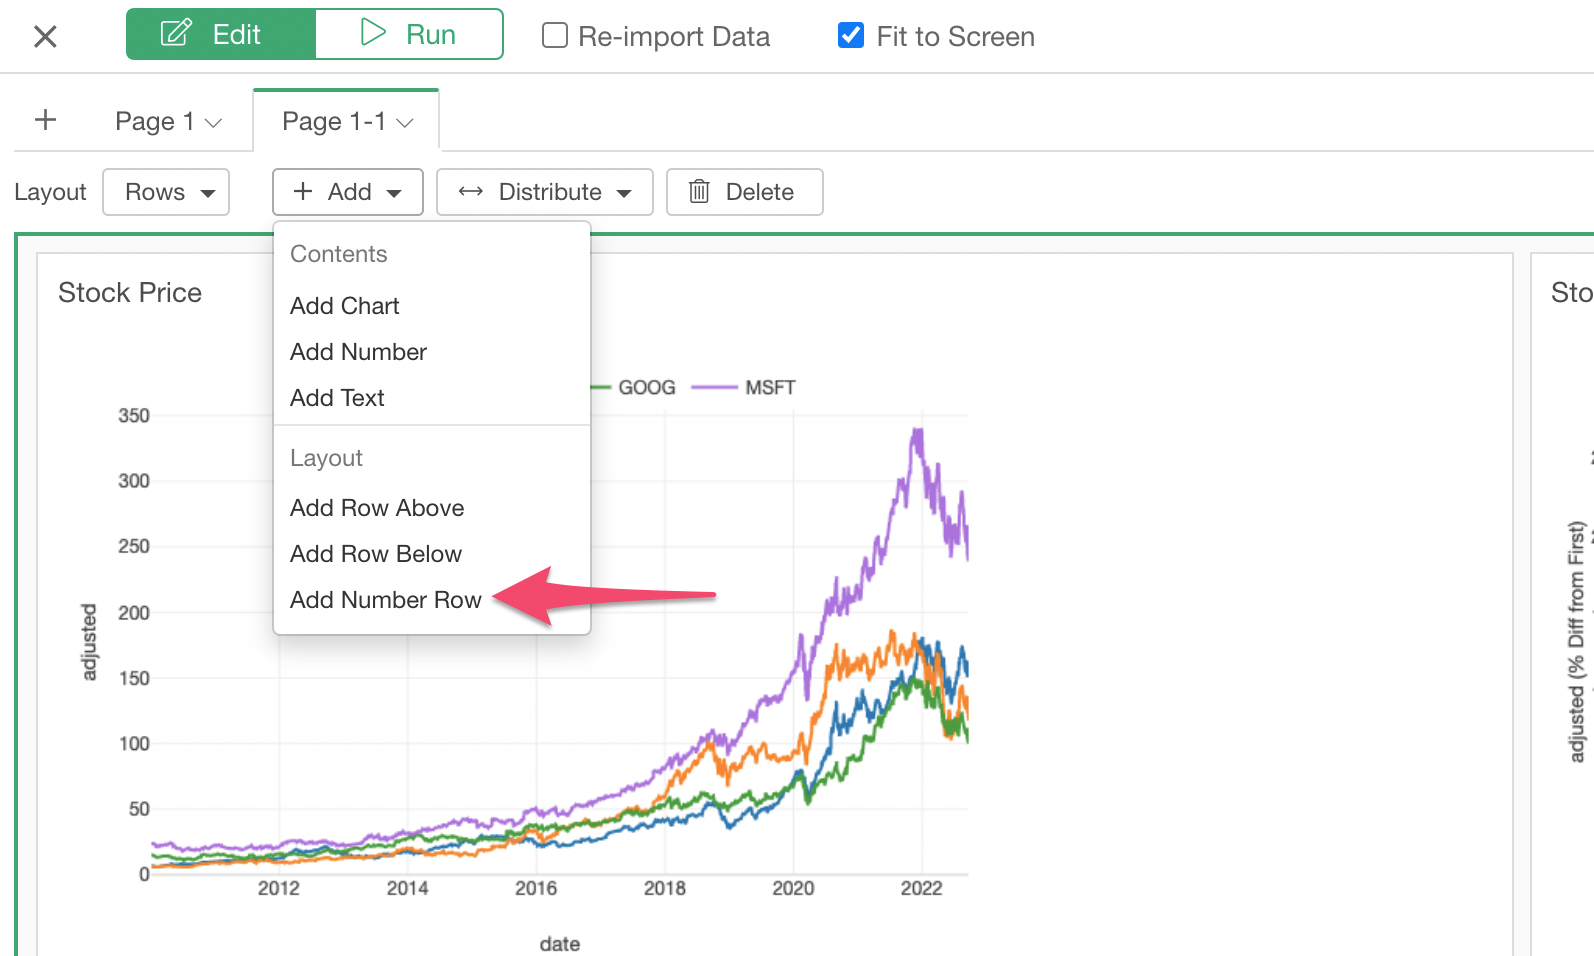
This Number Row maintain the fixed height so that the size of the Number would stay the same regardless of the window size. If you don't mind the size being changed dynamically depending on the window size then you can use the regular 'Row' rather than 'Number Row'.
In the Row, you want to select 'Add Number' to select the Number you have created.
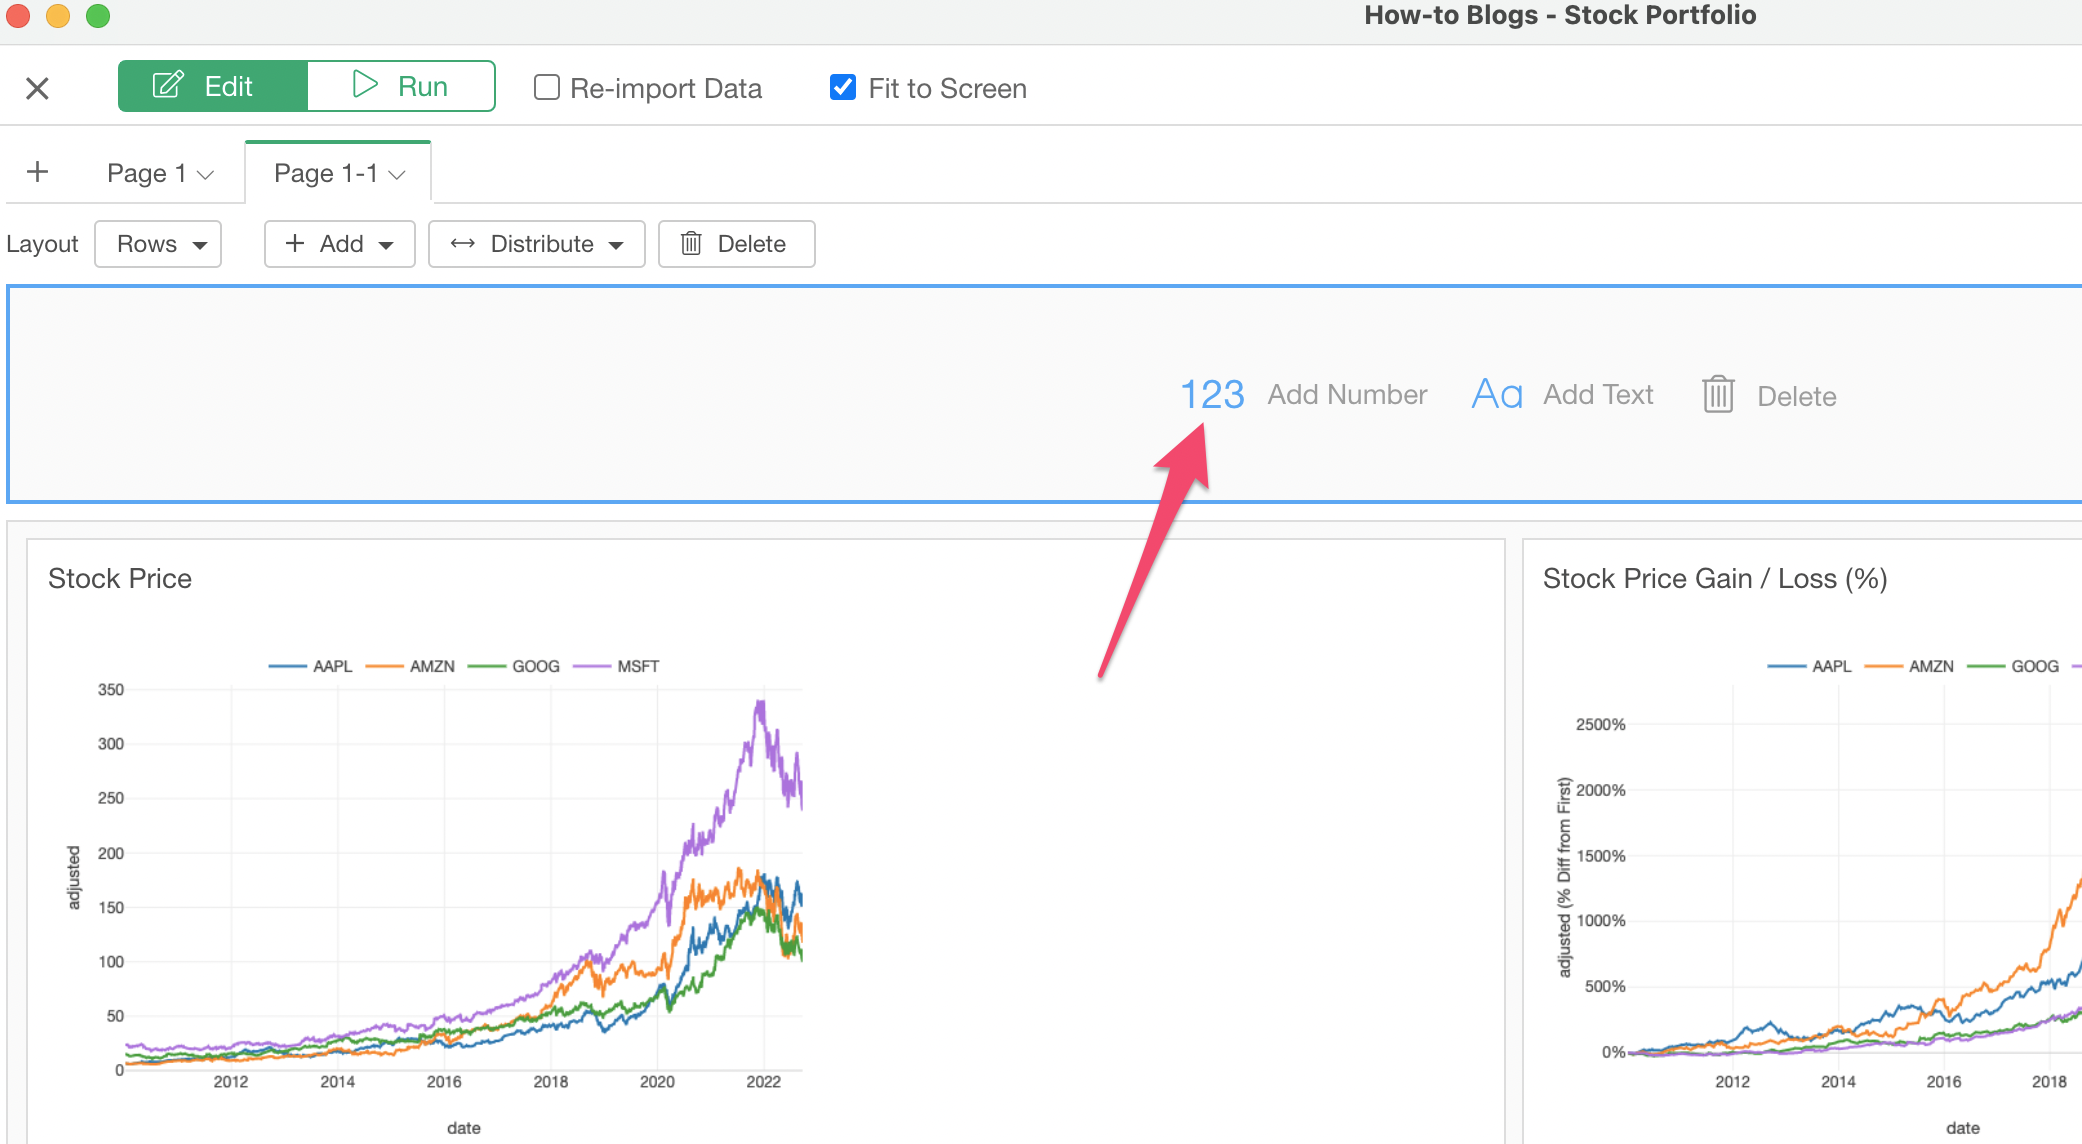
You can add multiple Numbers in a single row.
Try it for yourself!
If you want to quickly try it out and you don’t have an Exploratory account yet, sign up from our website for 30 days free trial without a credit card!
If you happen to be a current student or teacher at schools, it’s free! Sign up for Community Plan.
And, if you don’t mind sharing what you create publicly you can sign up for Public edition of Exploratory (FREE)!