Introduction to Two-Way ANOVA in Exploratory
This is an explanatory note on how to run Two-Way ANOVA in Exploratory and how to interpret various tabs that are automatically generated.
Two-Way ANOVA is one of the statistical testing methods and can be used to test if the difference in multiple means among multiple groups is significant when the effect might be coming from another categorical variable with multiple groups or from the interaction between the two categorical variables.
As the name suggests, there is another version of similar test called One-Way ANOVA. In this document, we'll focus on Two-Way ANOVA.
Objective and Data
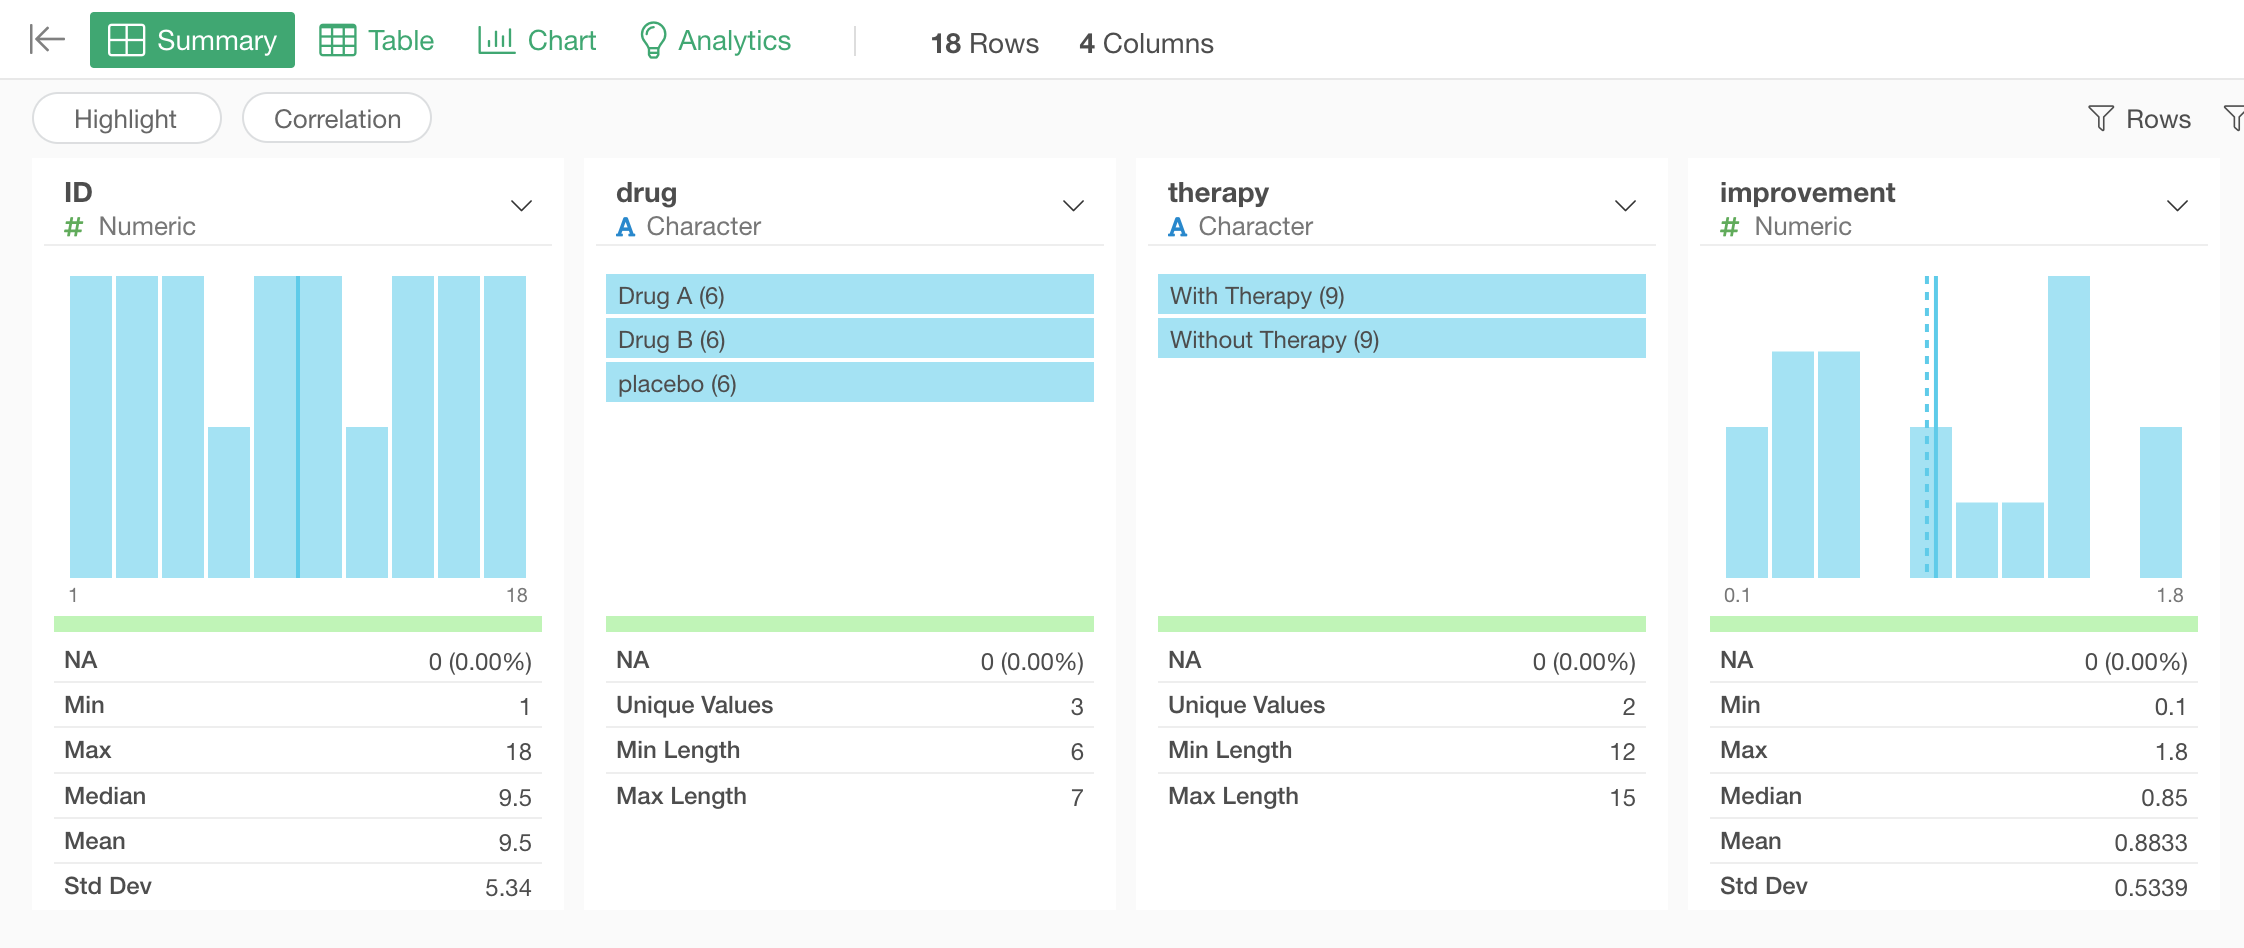
We have this clinical trial data about the effectiveness of two drugs - Drug A and Drug B.
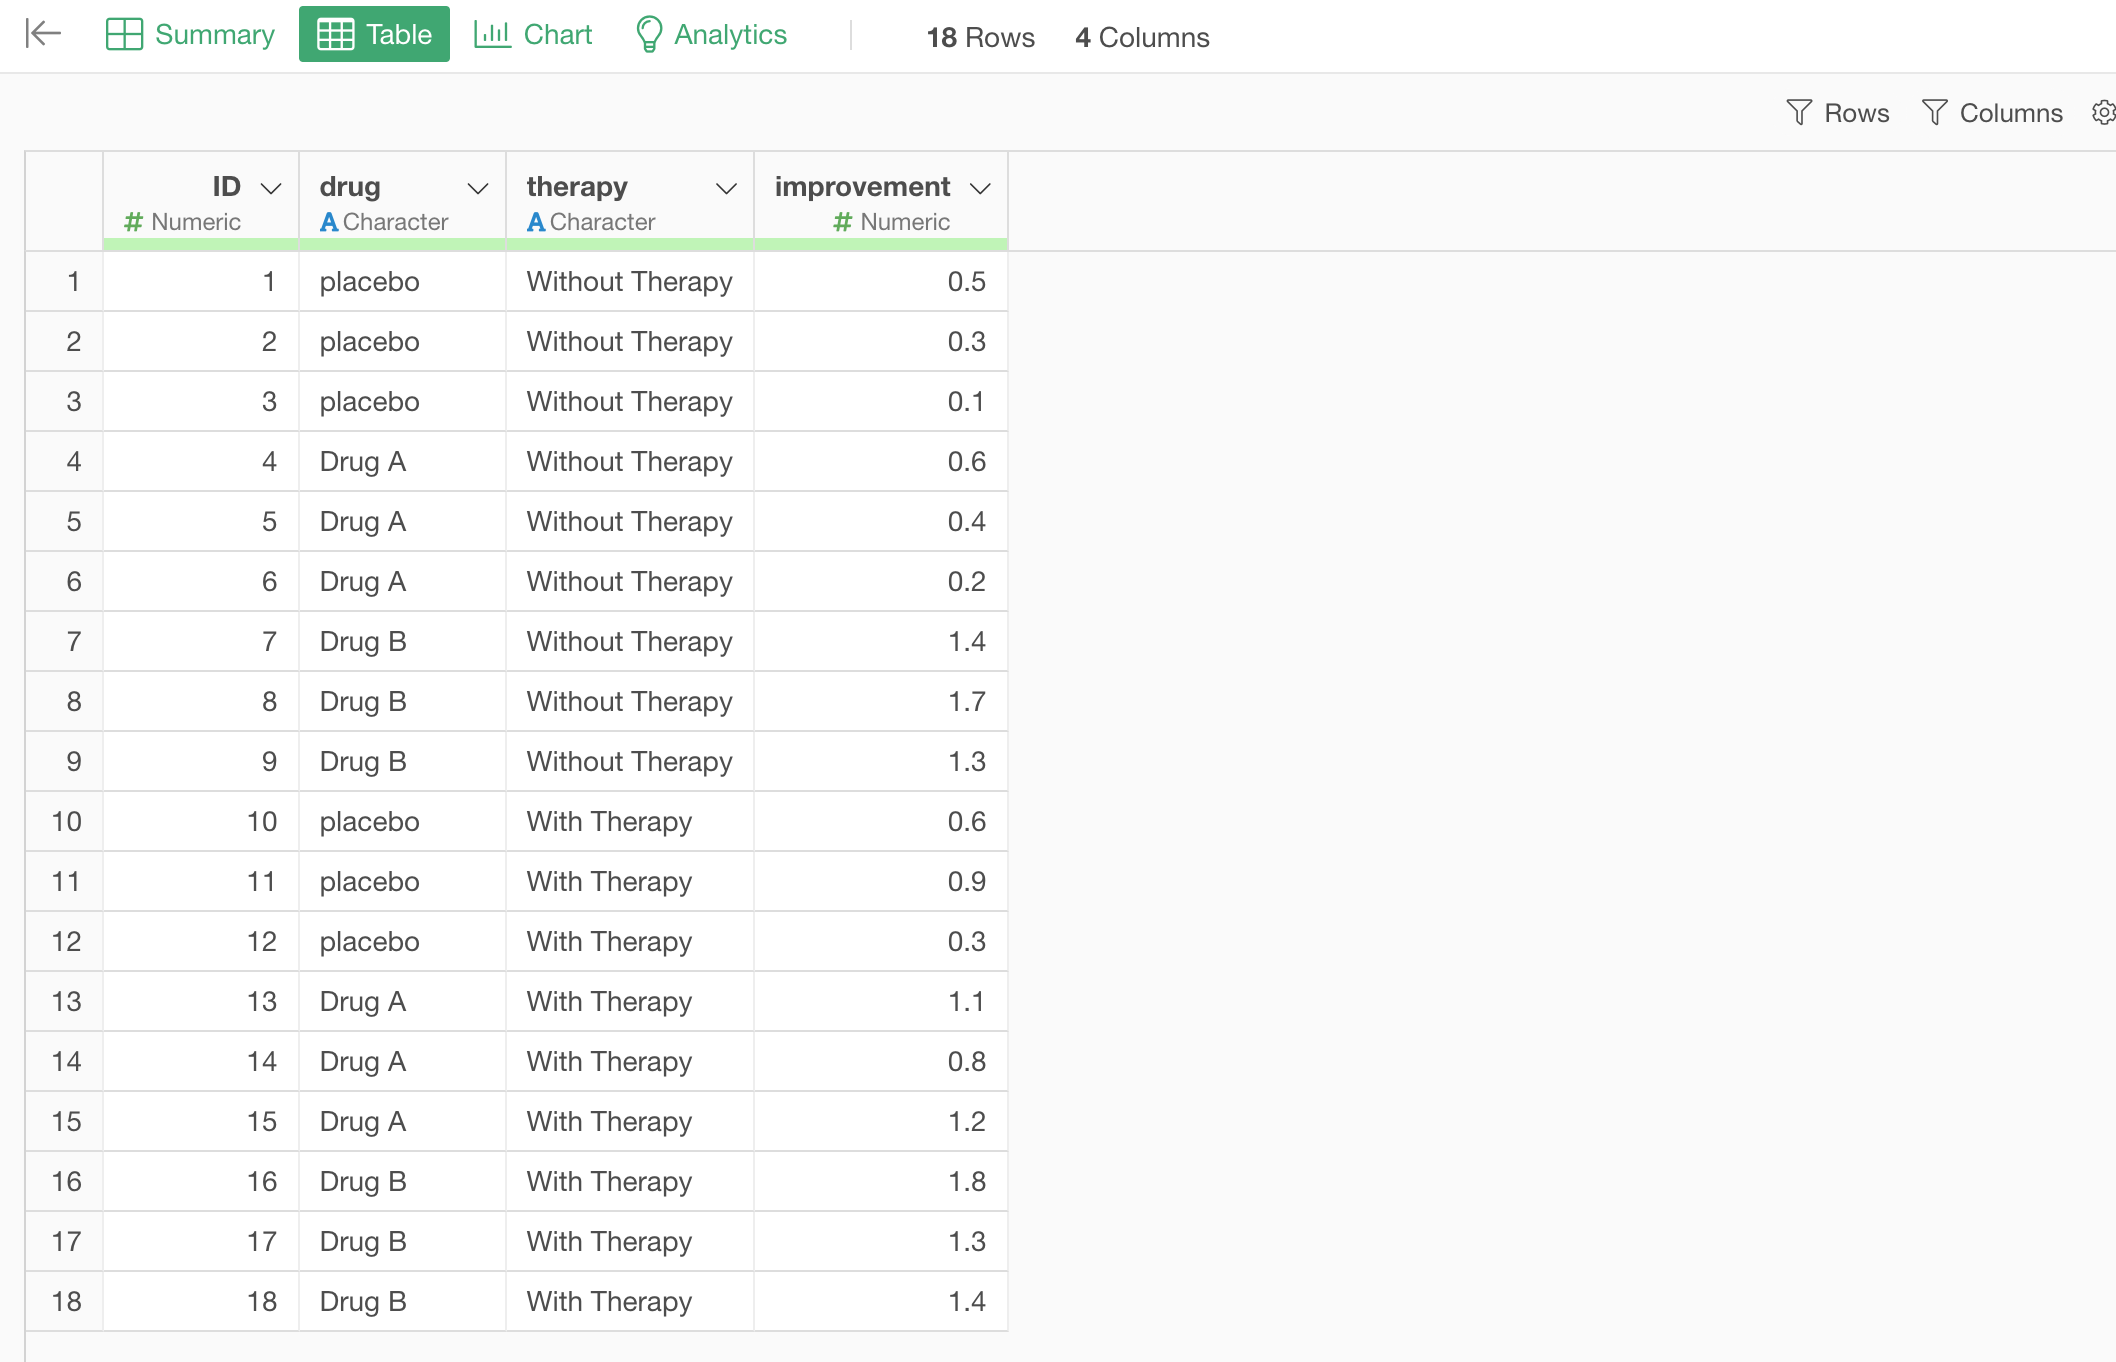
The data can be downloaded from here.
In order to see the effectiveness patients are assigned to 3 groups of Drug A, Drug B, and Placebo (No Drug). However, some of them are also taking psychology therapy.
We want to see if there is a difference in the improvement among the 3 groups alone regardless of whether they are taking the psychology therapy or not. Also, we want to see if there is any effect of the psychology therapy on the improvement as well as the effect of the interaction between the Drug and the Therapy.
We can visualize the means of the improvements among the 3 groups of the Drug separated by 2 groups of Therapy as below.
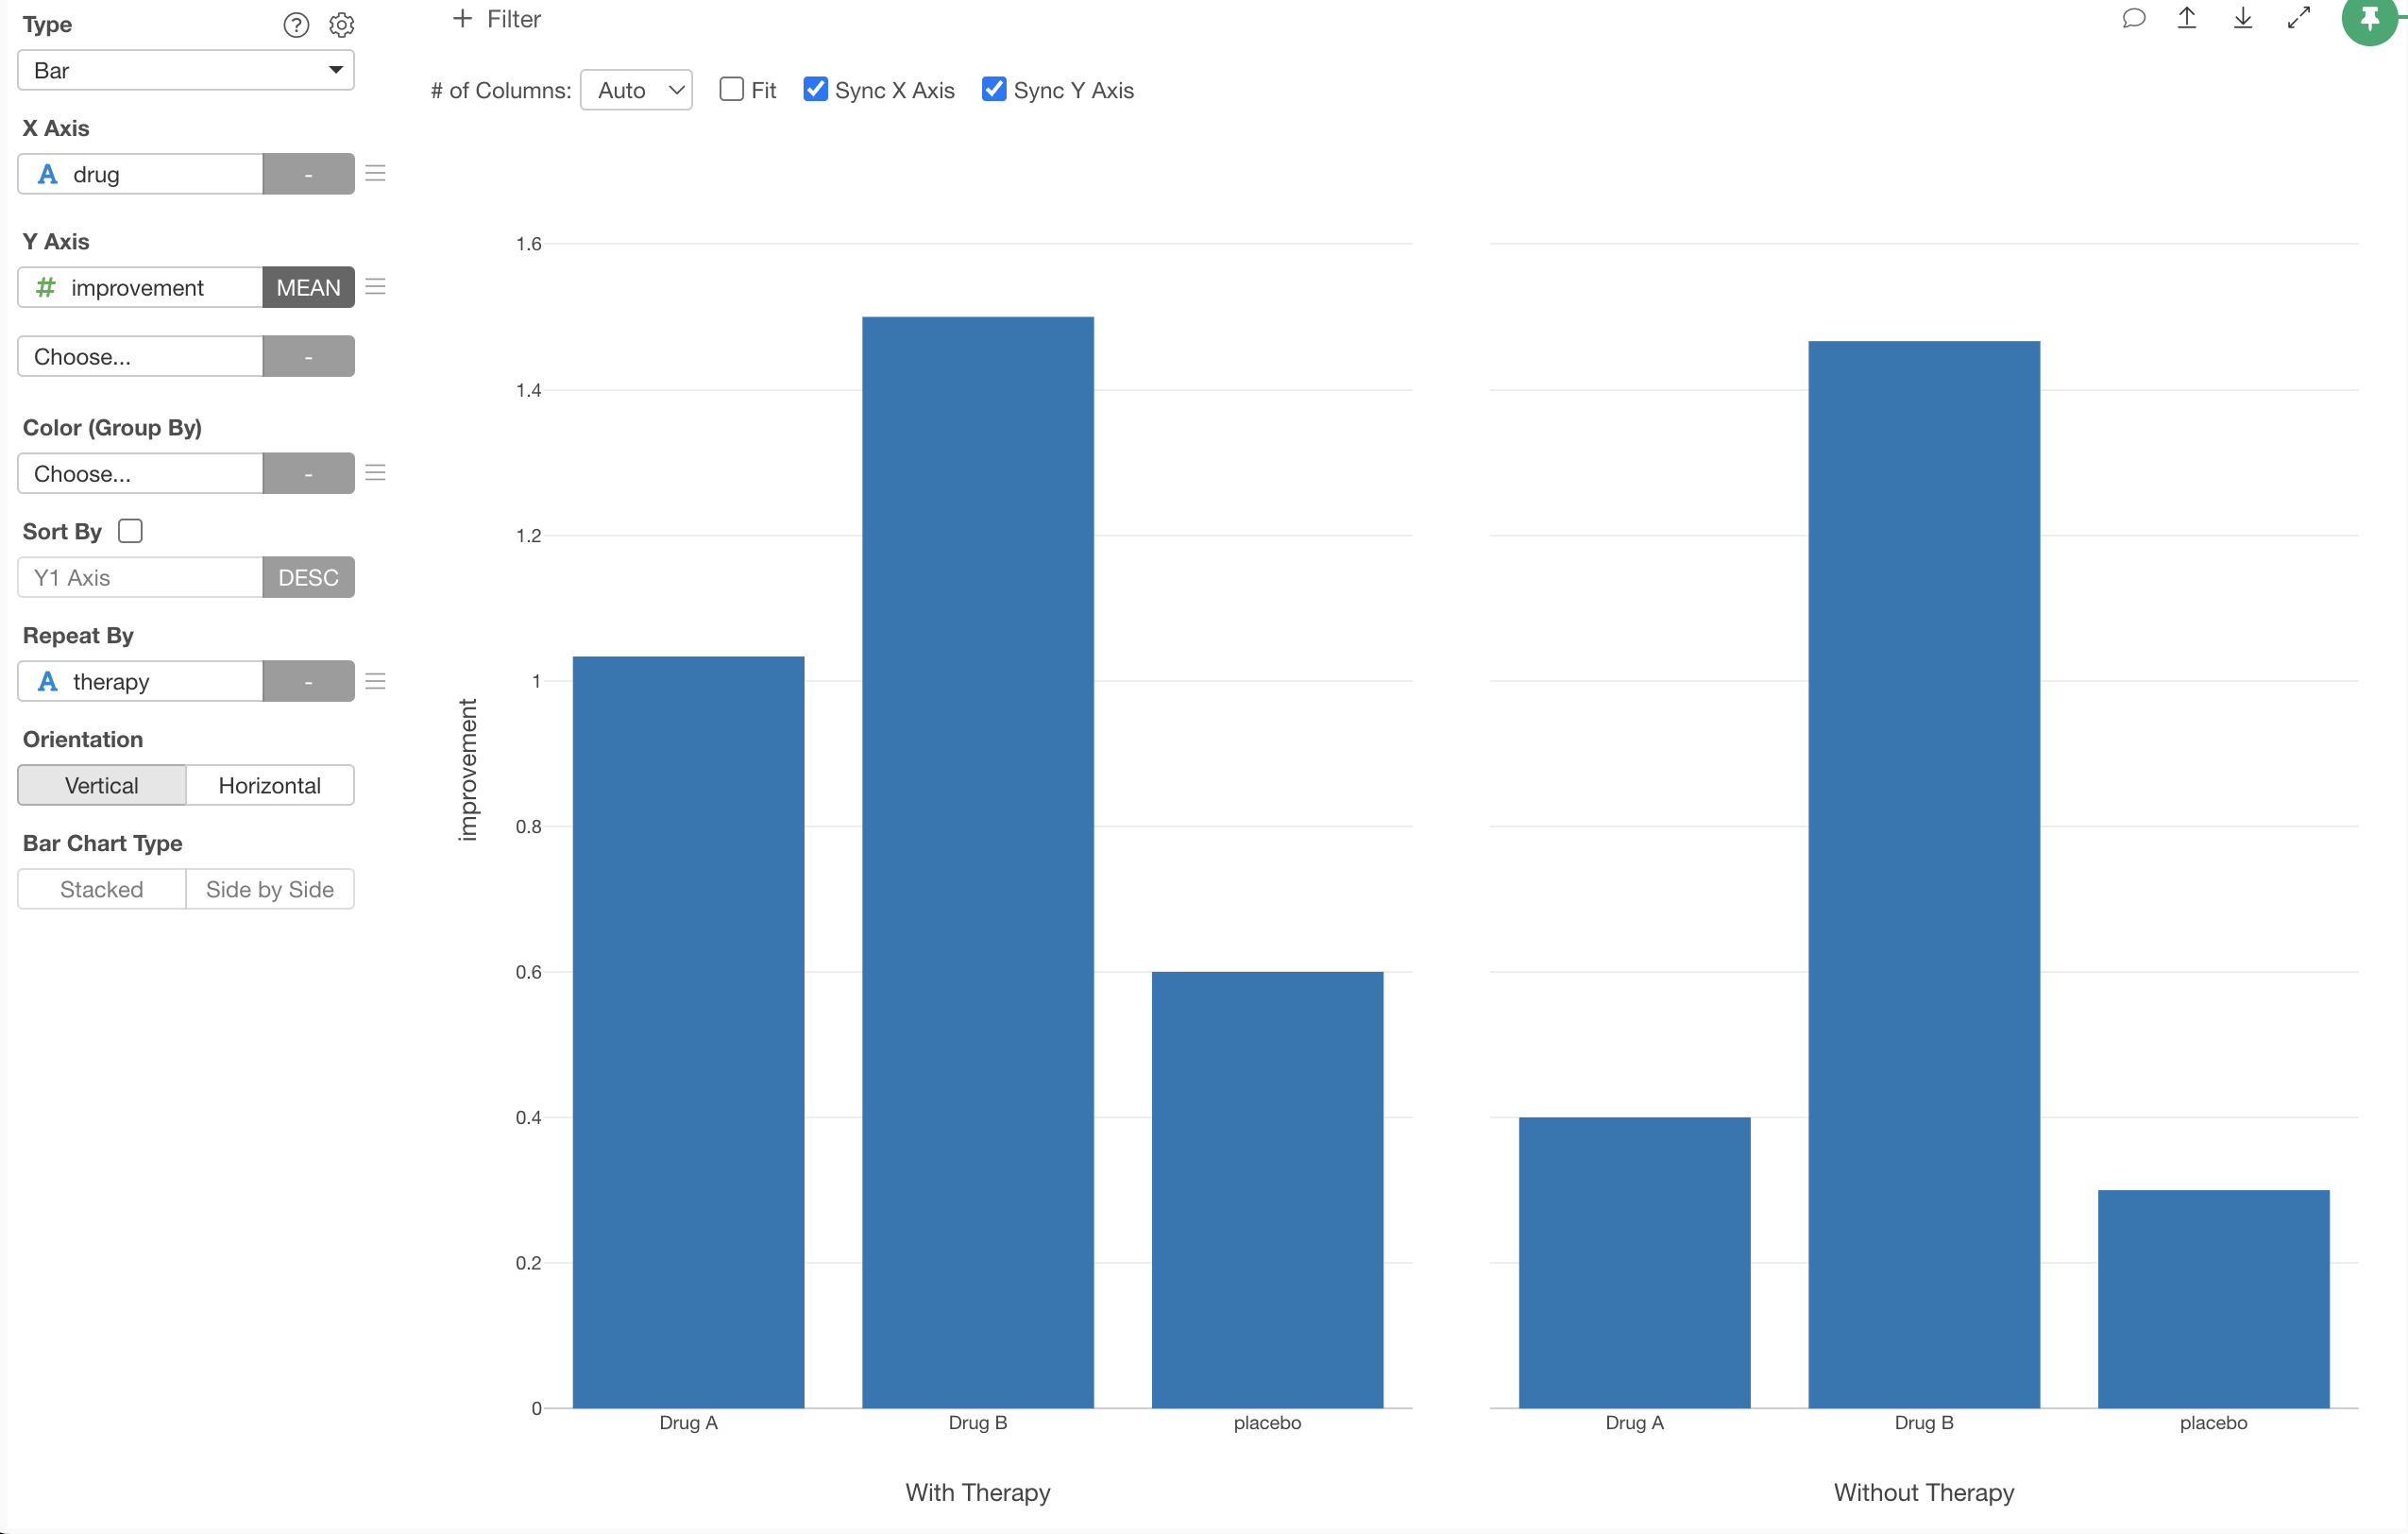
Looks in both groups of Therapy, both Drug A and Drug B have better improvements compared to Placebo. But are they statistically significant, maybe because of the therapy not drug, or just a consequence of randomness in data.
Run One-Way ANOVA
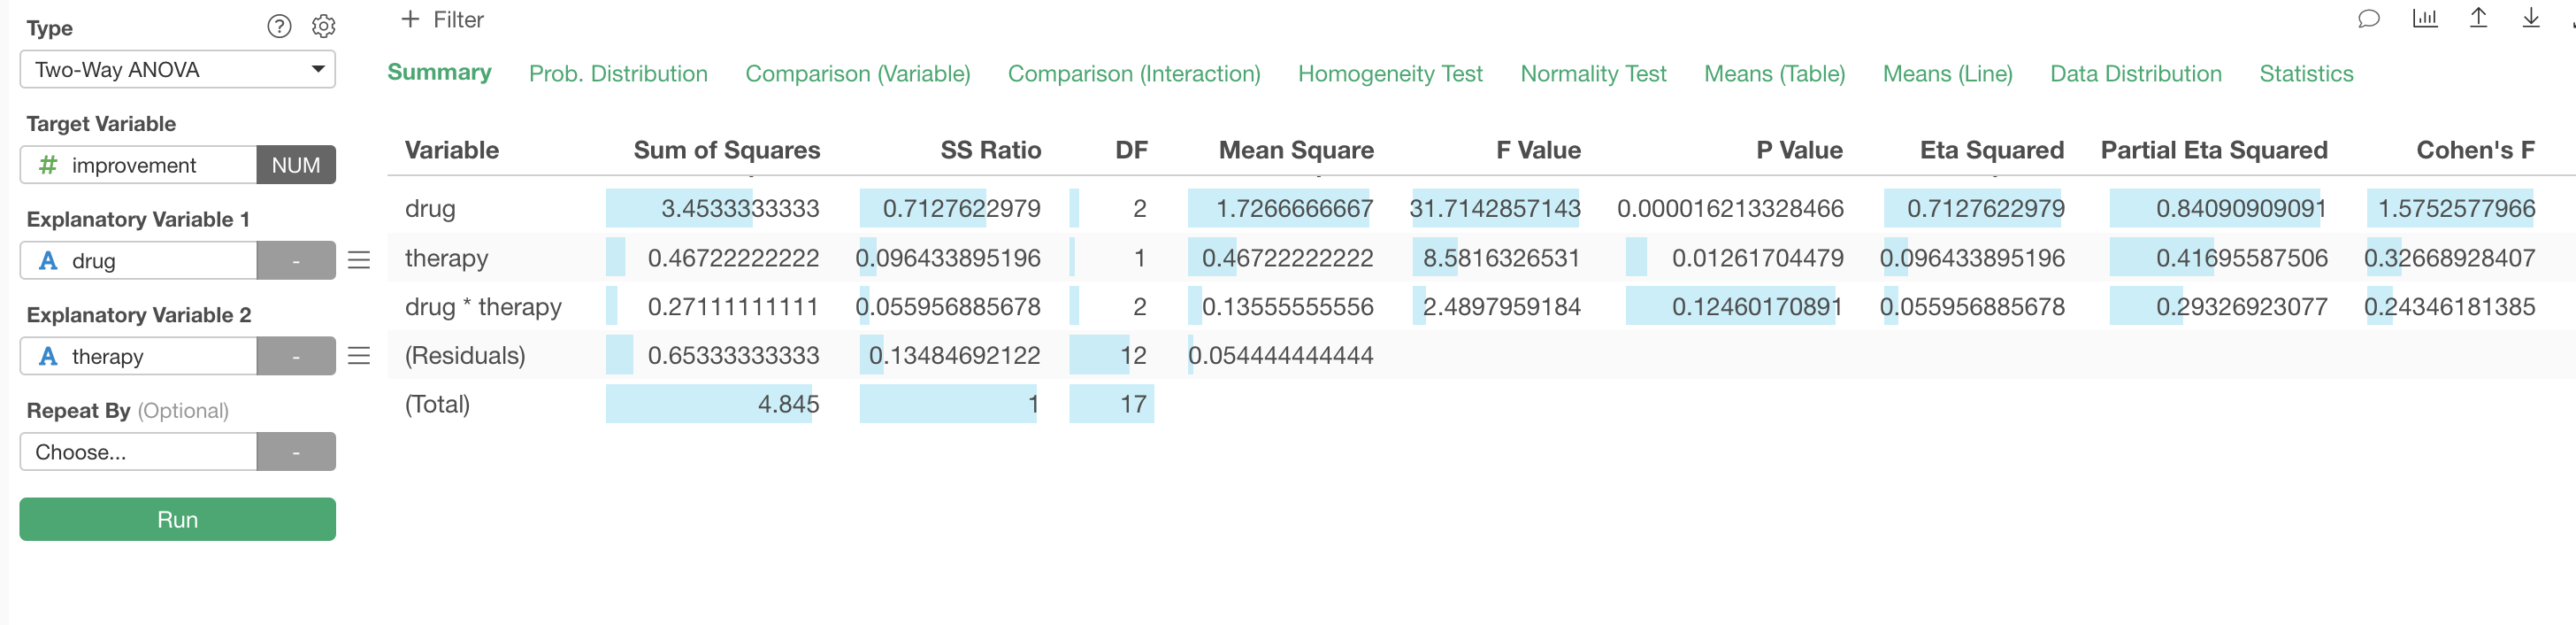
Under the Analytics view, select 'Two-Way ANOVA' from the Type, and select the 'Improvement' column for the Target Variable, the 'drug' column for the Explanatory Variable 1, and the 'therapy' column for the Explanatory Variable 2.
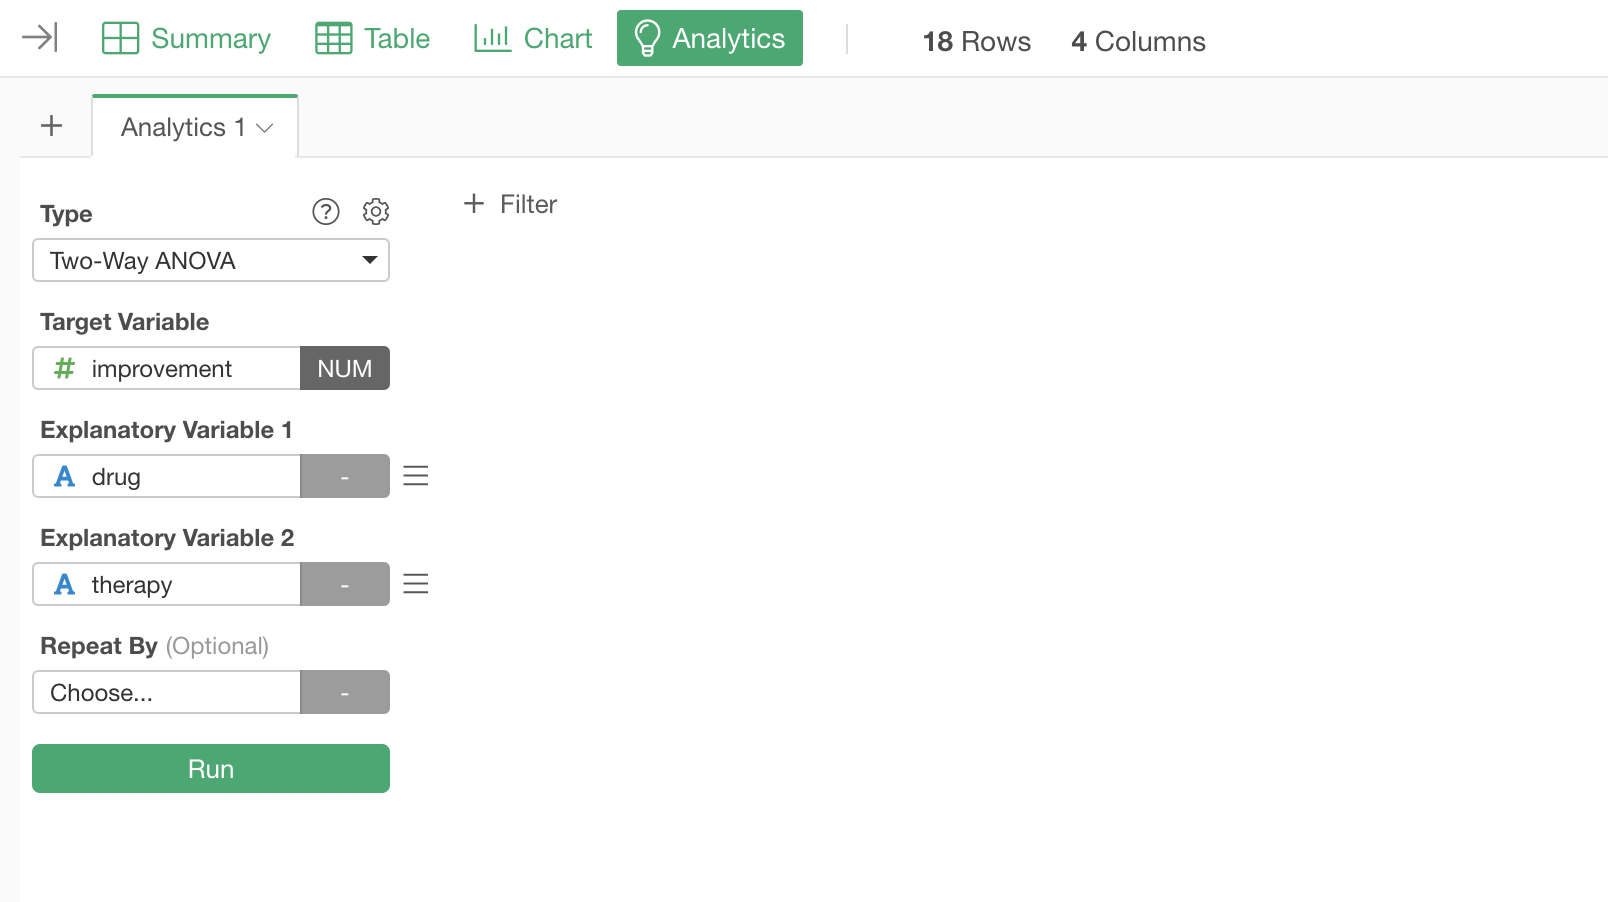
Then, click the Run button.
You will see a Summary tab being generated as below.
Result Summary
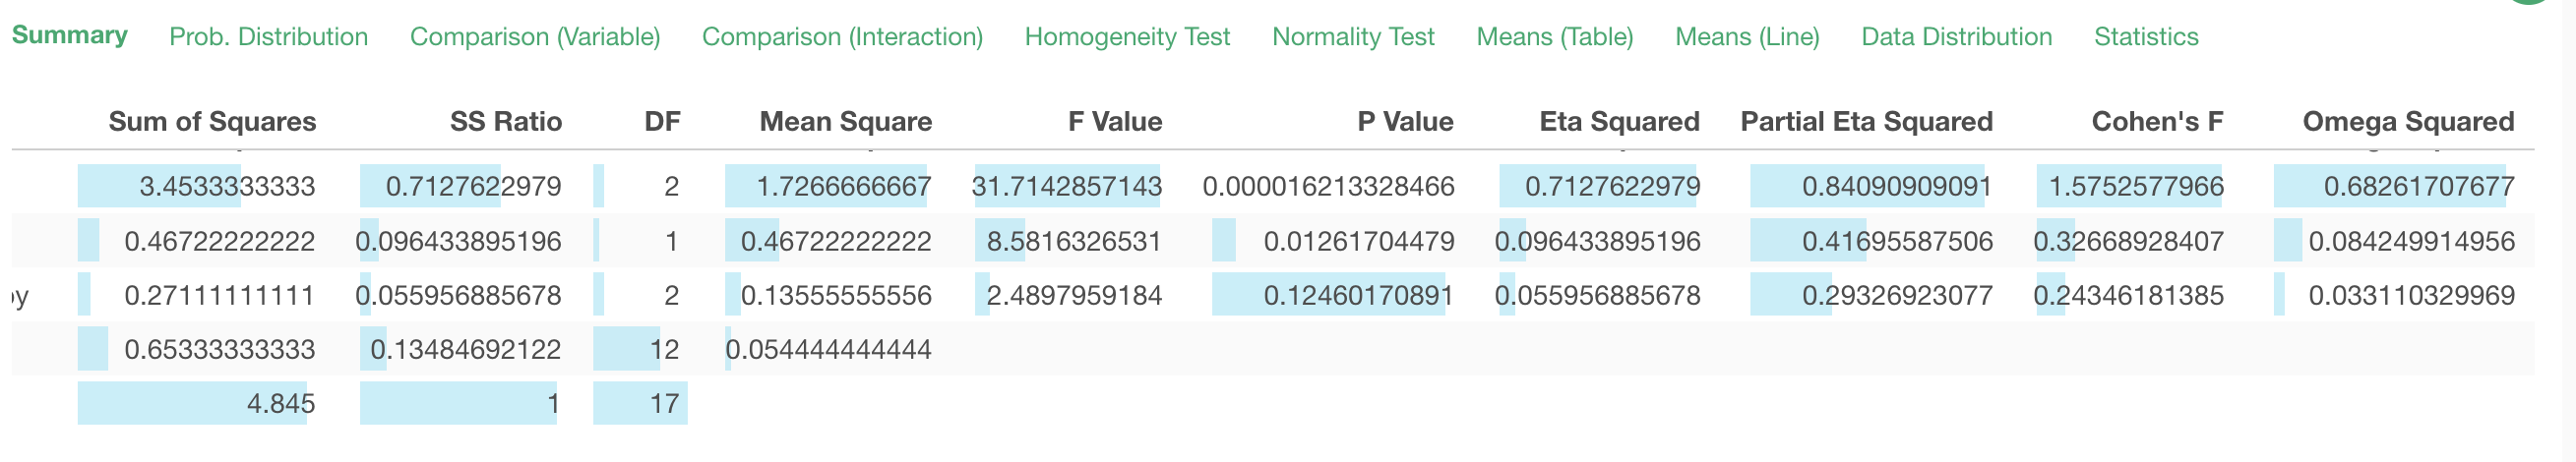
The first row shows various metrics about the explanatory variable 'drug'.
Significance
Main Effect of Explanatory Variables
The Sum of Squares indicates the total variance of the 3 means (the means for each group of Drug A, Drug B, and Placebo). The Mean Square is the mean of the variance.
The F Value is calculated as a ratio of the explained variance by the 'drug' variable compared against the unexplained variance (residuals).
The P Value indicates a probability of observing the difference between several means from the multiple groups if we accept a null hypothesis (assumption) that there is no difference among them.
Given that the P Value here is less than 0.05 (5%), we can conclude that the difference among the 'drug' groups is statistically significant (assuming that the threshold value is 0.05).
Similarly, you can check the 2nd row which has the result for the 'therapy' variable. Since the P Value for the 'therapy' is less than 0.05 (5%), we can conclude that the difference among the 'therapy' groups is statistically significant (assuming that the threshold value is 0.05).
Interaction
The 3rd row is the test result of the interaction of the 'drug' variable and the 'therapy' variable. In this case, given that the P Value here is greater than 0.05 (5%), the effect of the interaction between the two variable is not statistically significant (assuming that the threshold value is 0.05).
Effect Size
Testing if the difference or the effect is significant or not is one thing, but even when it's significant we want to know how big is the difference or the effect.
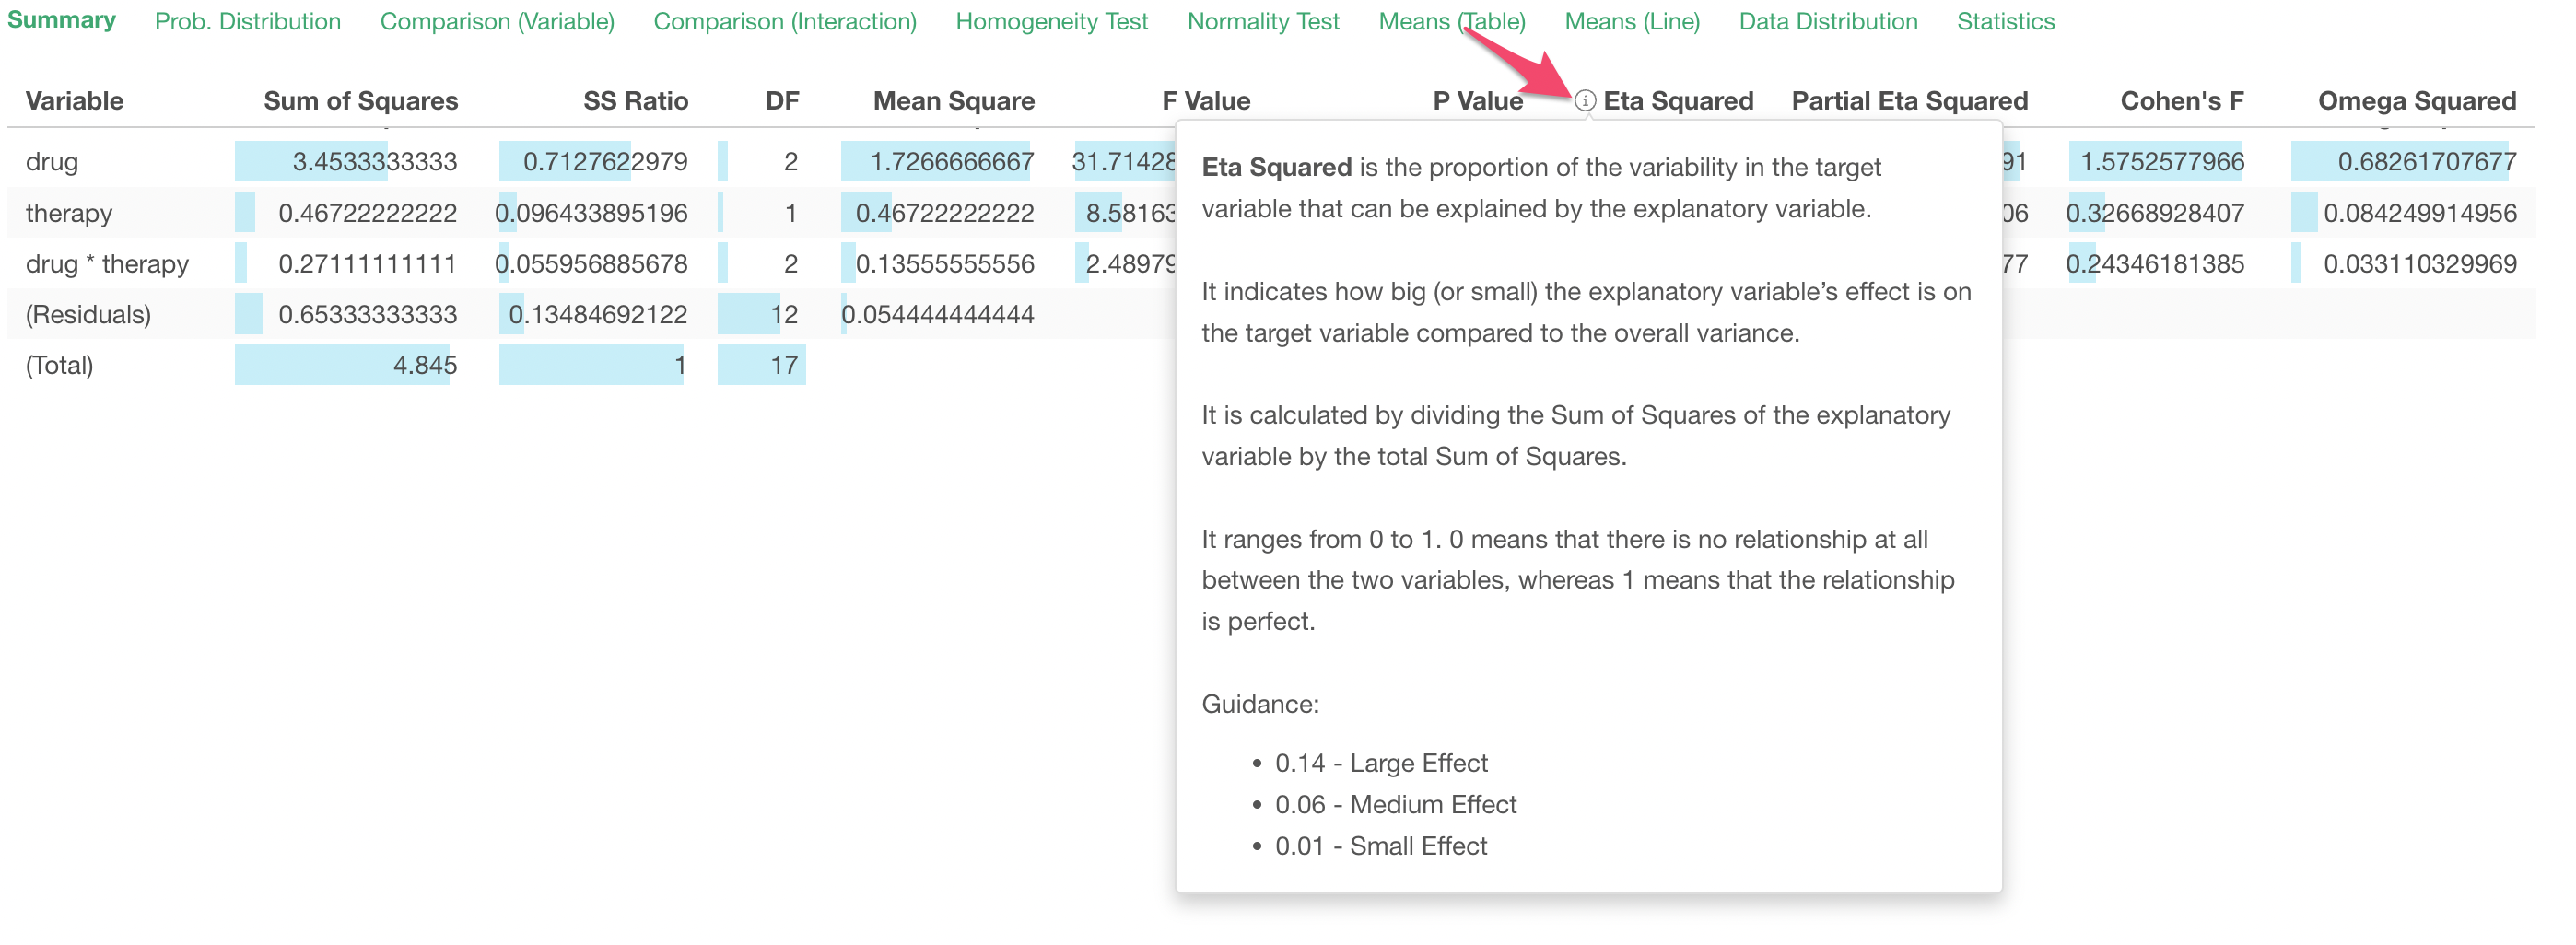
There are 4 effect size metrics provided under the Summary table.
- Eta Squared
- Partial Eta Squared
- Cohen's F
- Omega Squared
You can see what these metrics mean by clicking on the information icon in the column header.
Probability Distribution
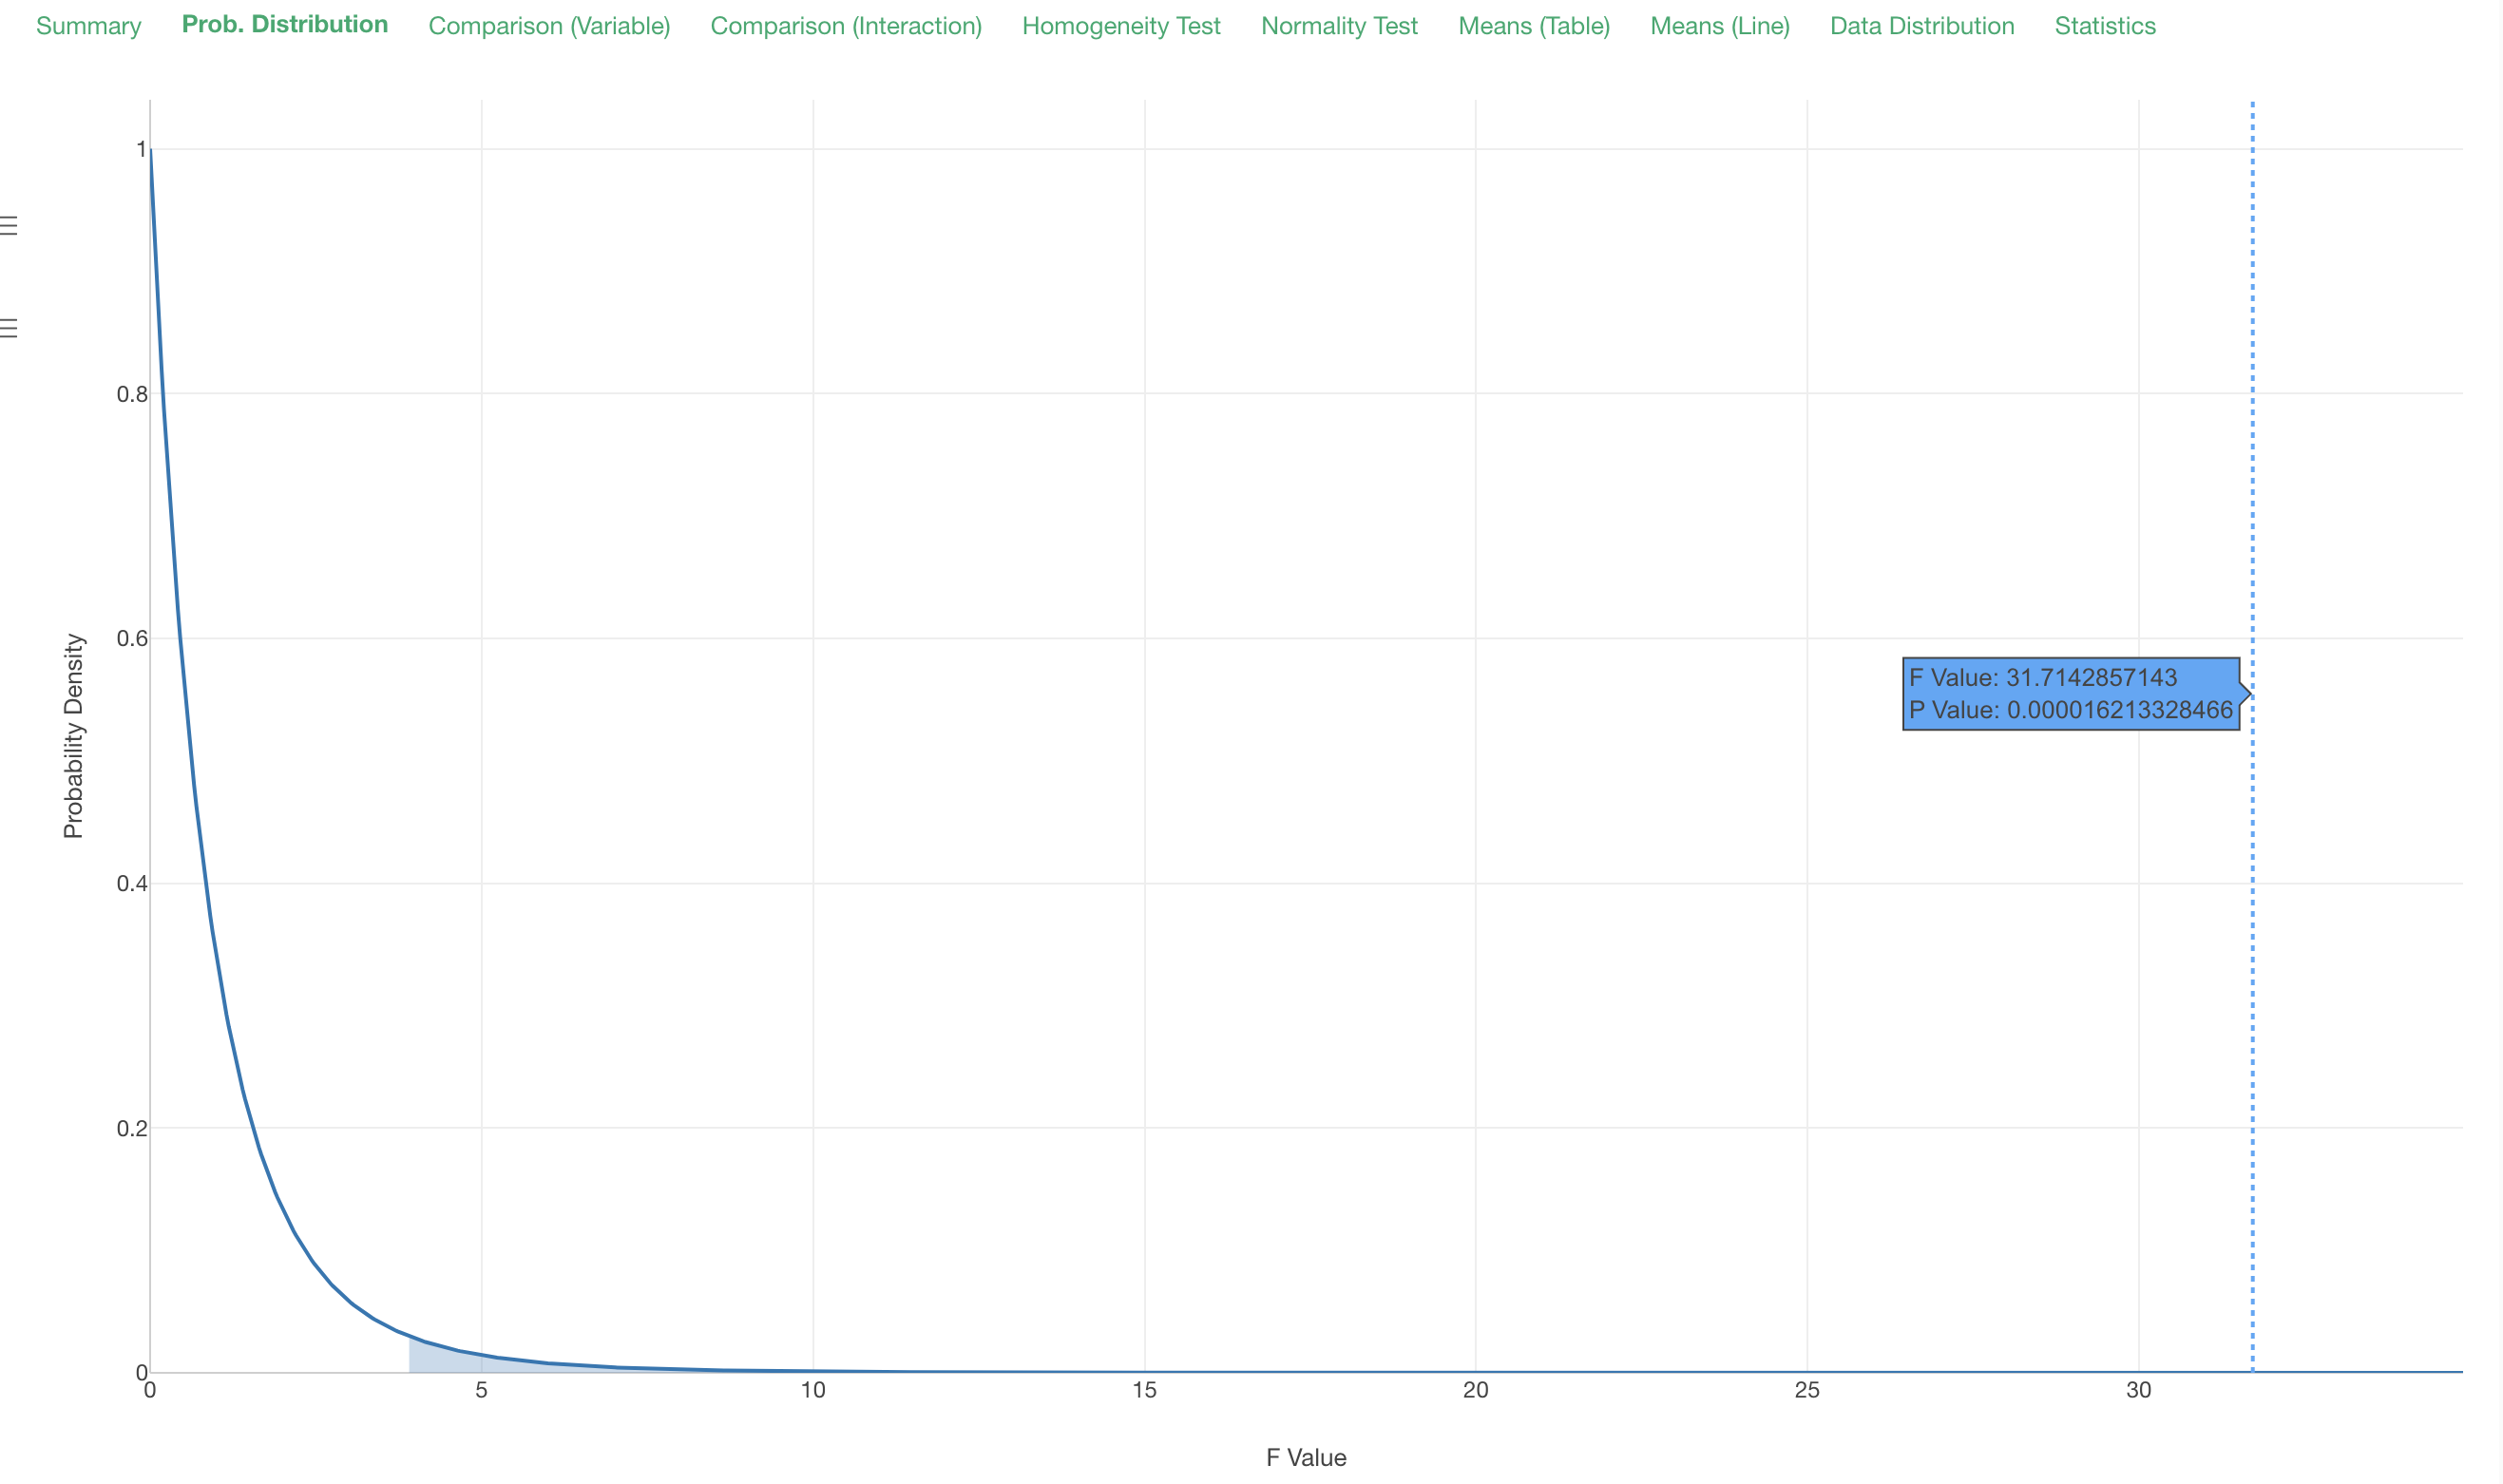
Under the Probability Distribution tab, you can see where the given F value from this test is located on the underlying probability curve 'F distribution' as the blue dotted vertical line.
Comparison
By Variable
Under the Comparison tab, you can see the result of 'Post Hoc Test', which test the significance of each pair of the groups. In this case, we have 3 groups - Drug A, Drug B, and Placebo - we have 3 combinations of the pairs.
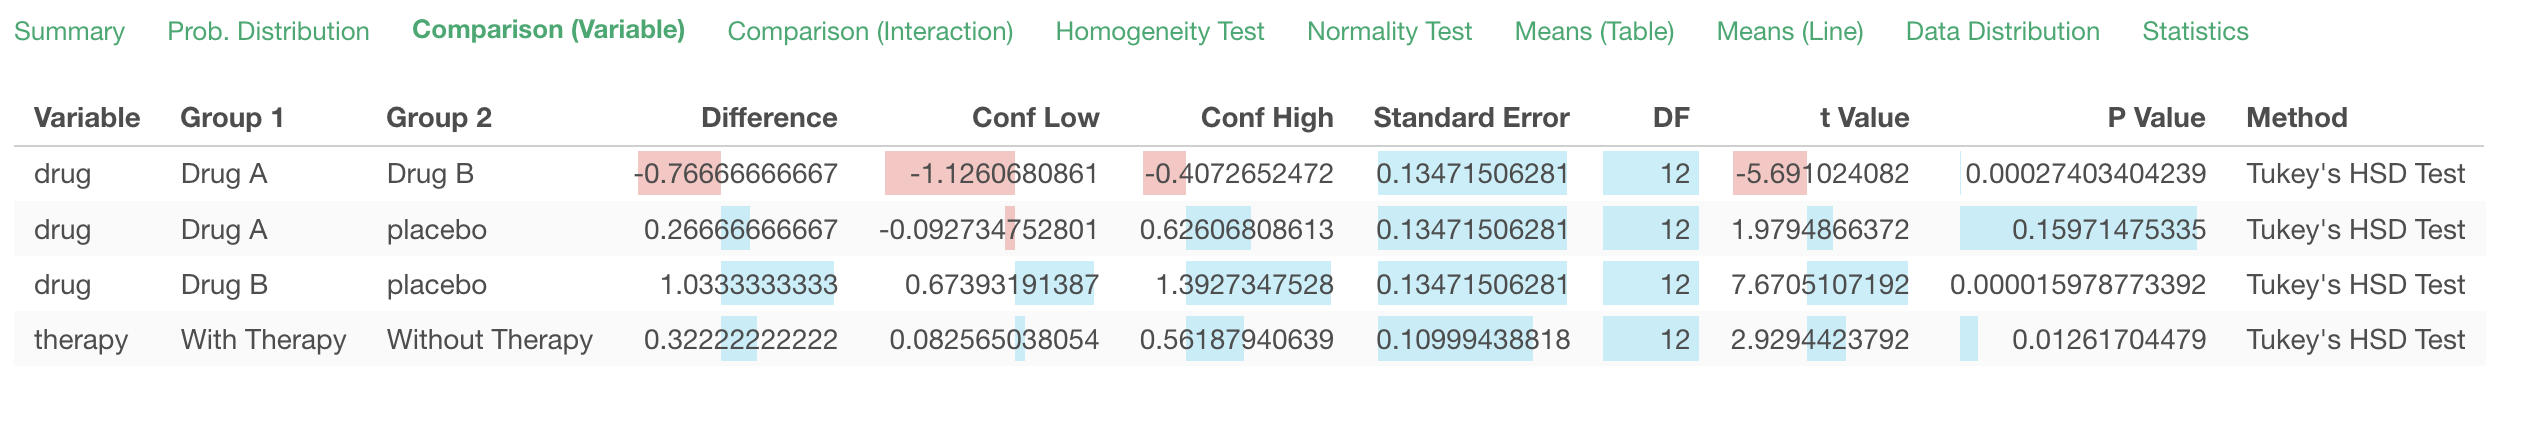
The default method for this multiple comparisons is Tukey's HSD Test. Based on the result, we can conclude that the difference between Drug A and Drug B and the one between Drug A and Placebo are significant, but the difference between Drug B and Placebo is not.
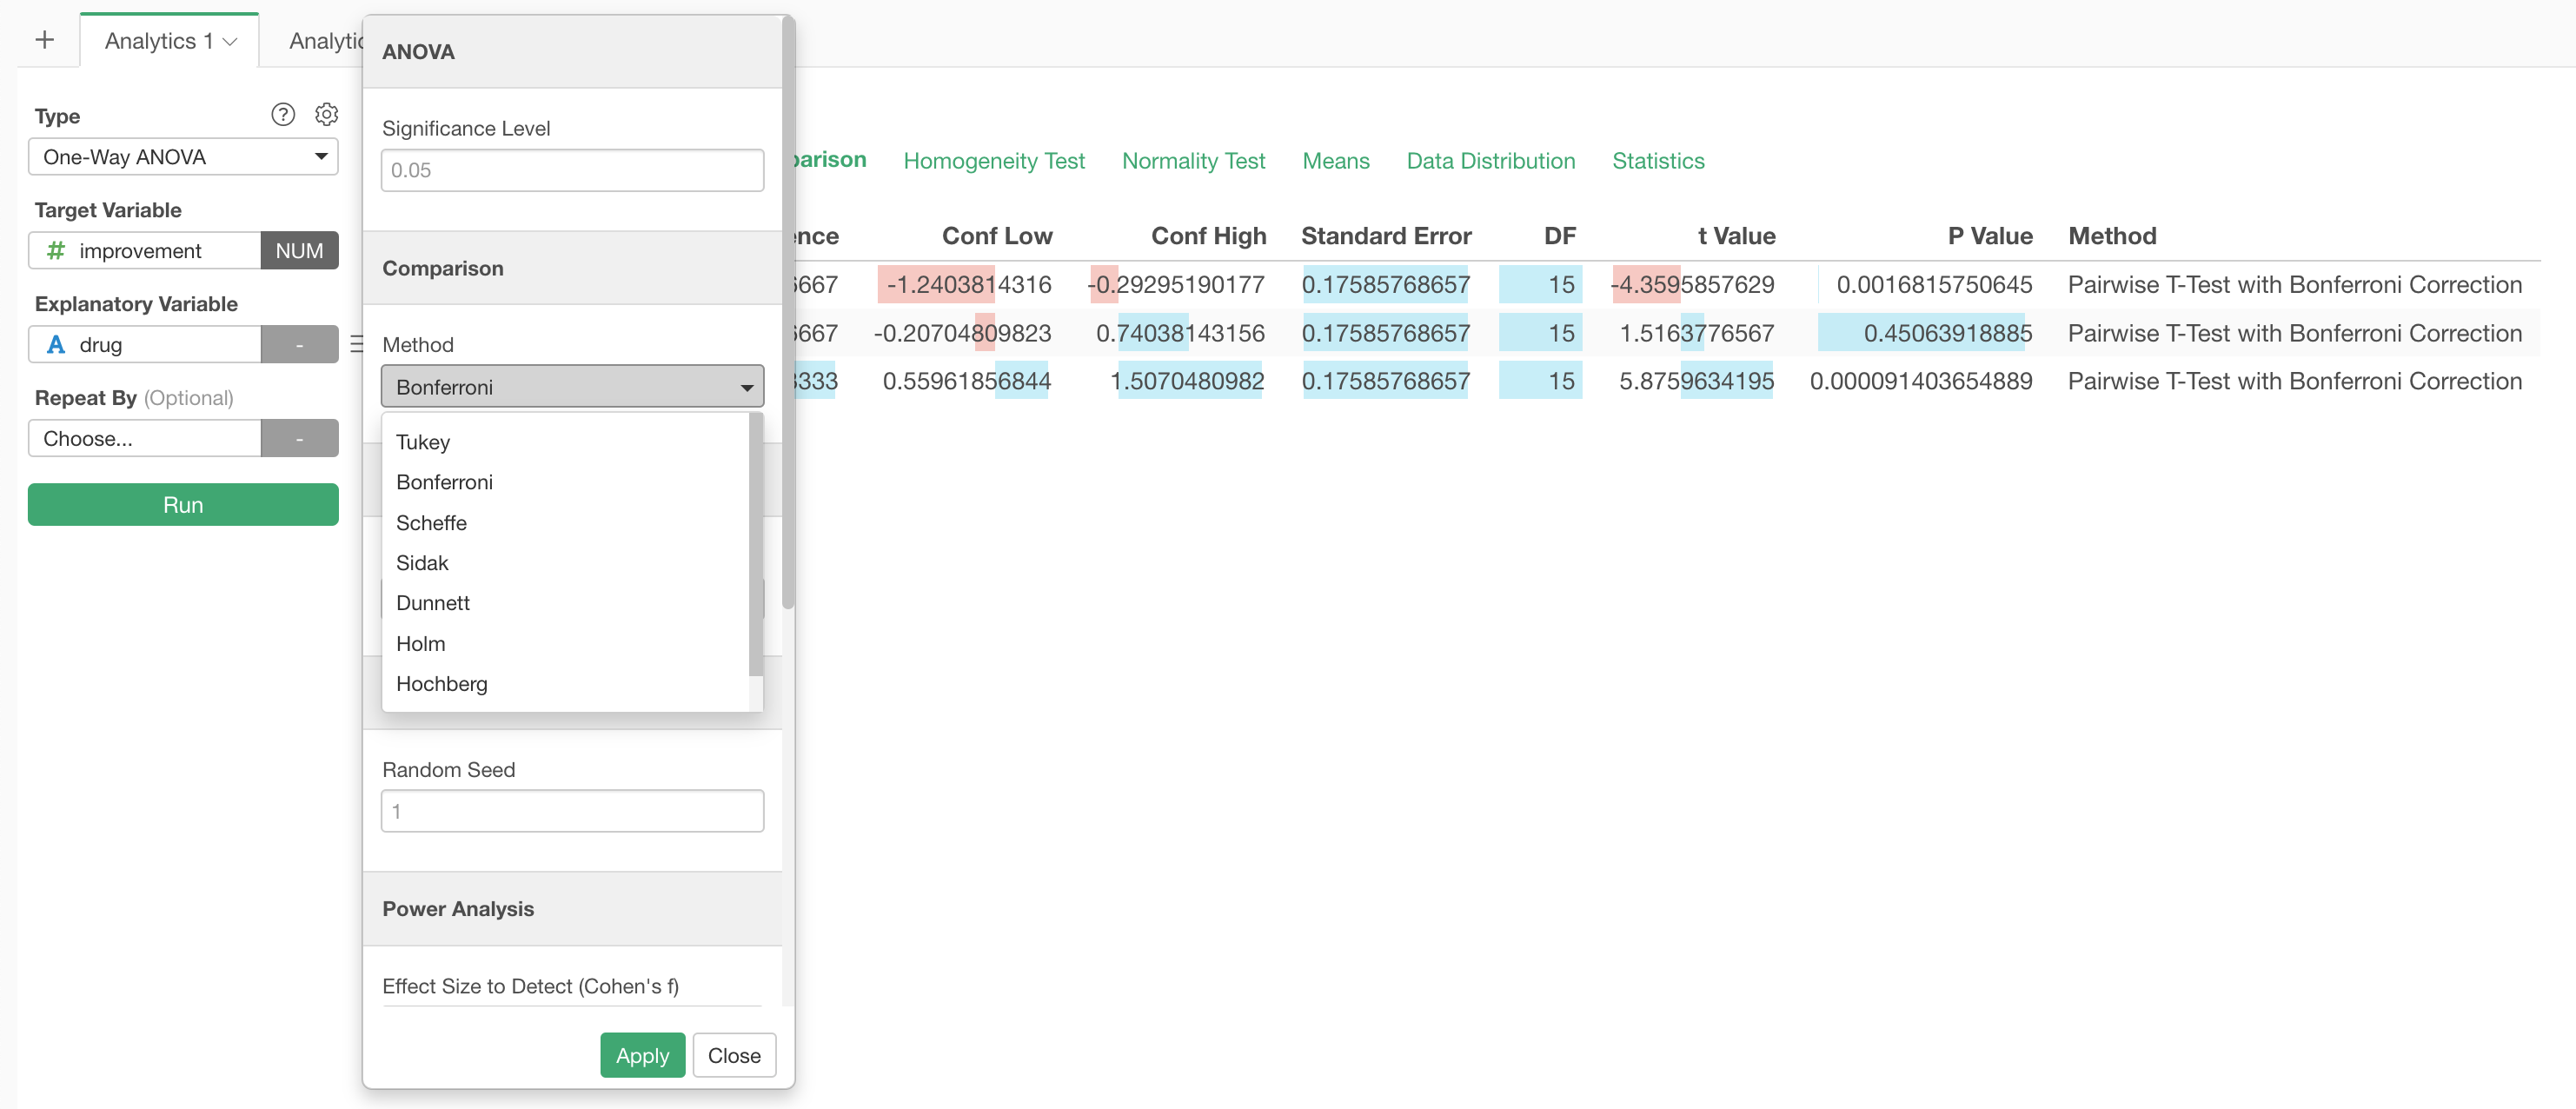
Given this is a post hoc test you might want to add a correction to the P values. You can choose from various methods for the correction in the Property dialog.
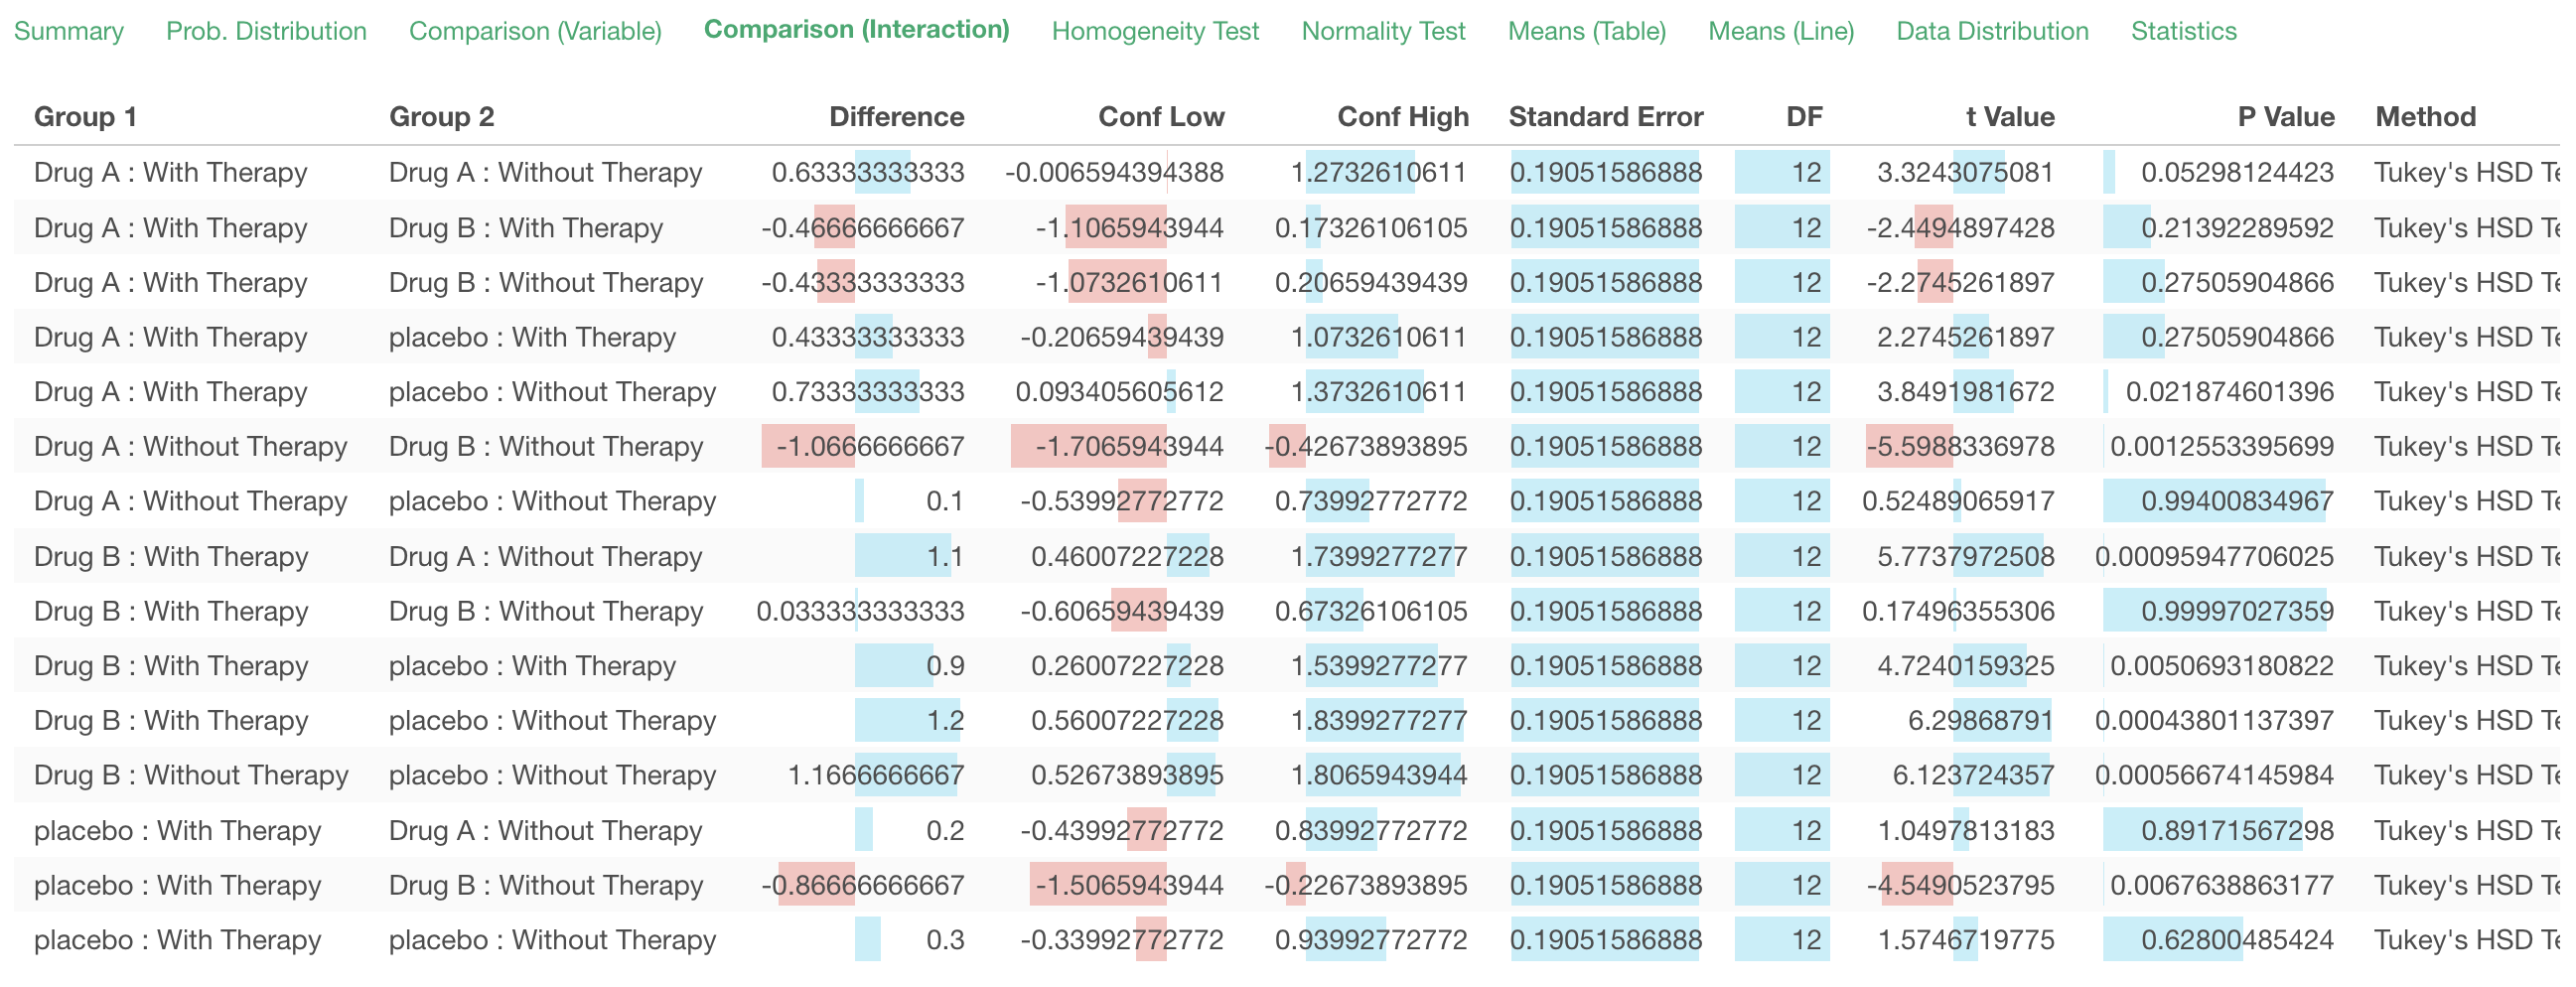
By Interaction
Assumption Check
ANOVA test is designed based on a few assumptions. You can check the following two assumptions about the underlying data in Exploratory.
- The data variances among Groups are equal.
- The data is normally distributed.
Homogeneity Test for Equal Variance
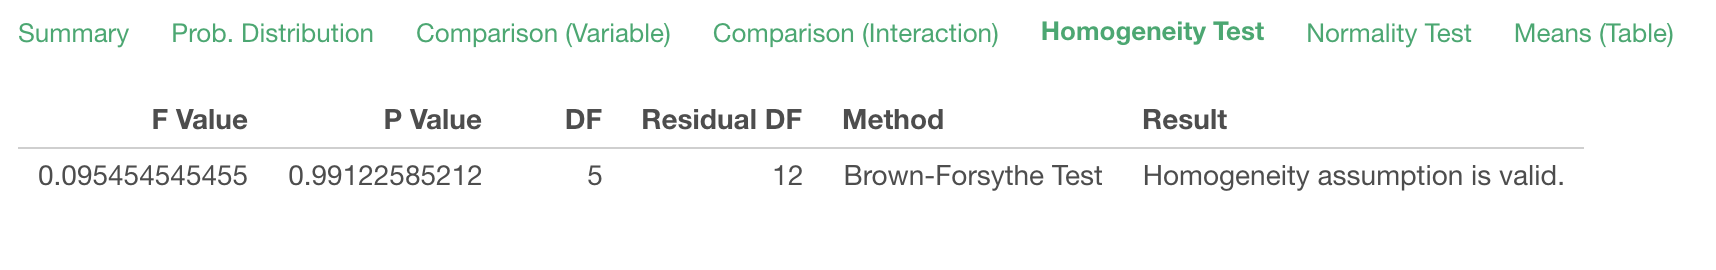
The null hypothesis is there is no difference (equal) in the variance among the groups.
If the P value is less than a threshold value (it's 0.05 (5%) by default in Exploratory) we can reject the null hypothesis hence there is a difference and this invalidates the assumption.
If the P value is greater than a threshold value (it's 0.05 (5%) by default in Exploratory) then we can't reject the null hypothesis hence the variances are equal and the assumption is valid.
Normality Test for Normal Distribution
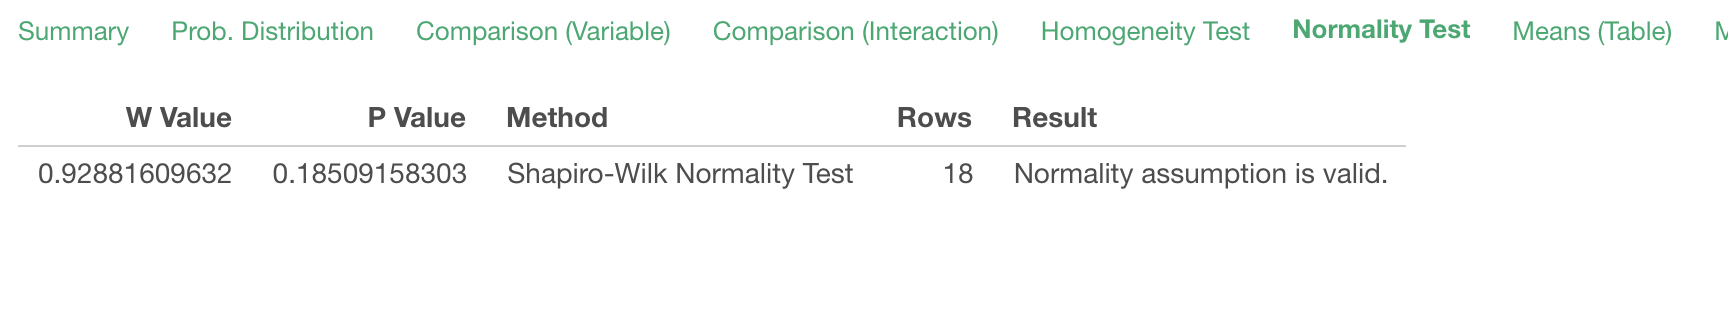
The null hypothesis is there is no difference between a normal distribution and the distribution of data in hands.
If the P value is less than a threshold value (it's 0.05 (5%) by default in Exploratory) we can reject the null hypothesis hence the underlying data distribution is difference from the normal distribution and this invalidates the assumption.
If the P value is greater than a threshold value (it's 0.05 (5%) by default in Exploratory) then we can't reject the null hypothesis hence the underlying data distribution is equal to the normal distribution and the assumption is valid.
Descriptive Statistics
You can see the descriptive statics of the data in various ways.
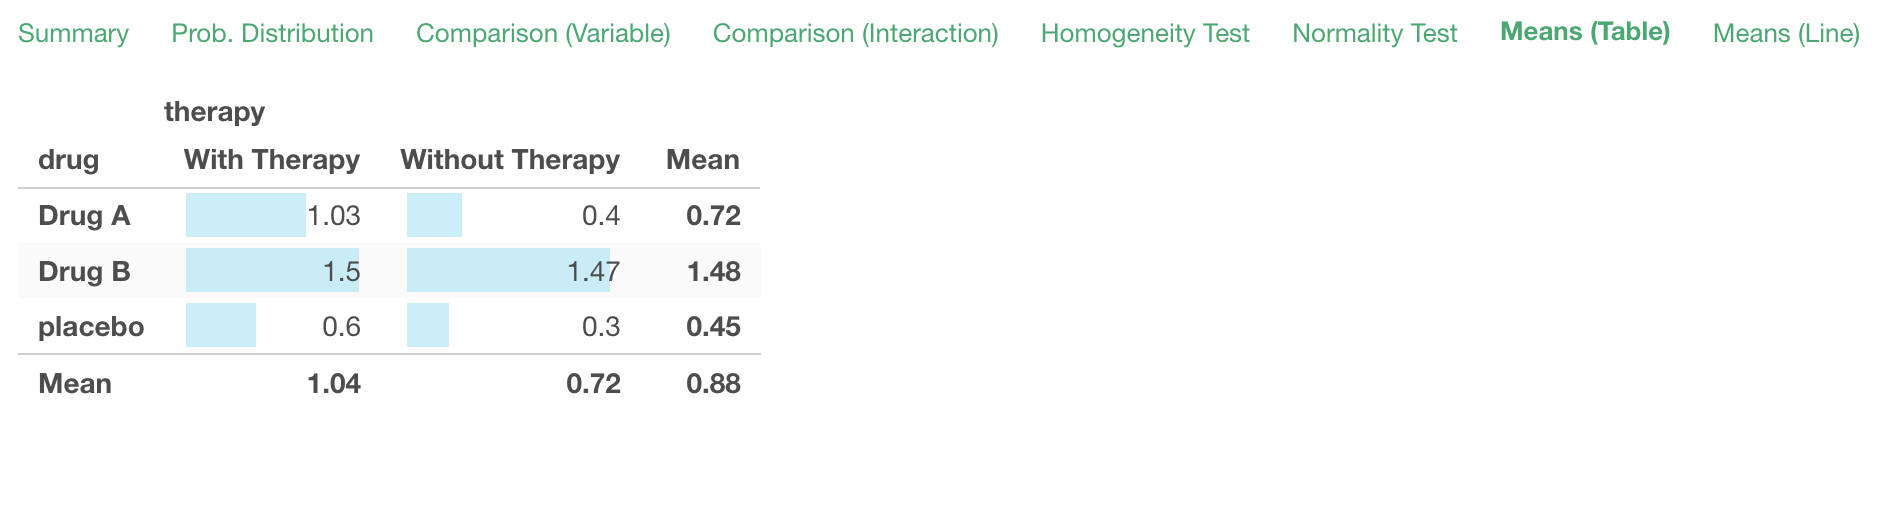
Means (Table)
You can see the means of multiple groups by the explanatory variable 1 and the explanatory variable 2.
Means (Line)
The line chart under the 'Means (Line)' tab visualize the mean statistics from the Means (Table) tab.
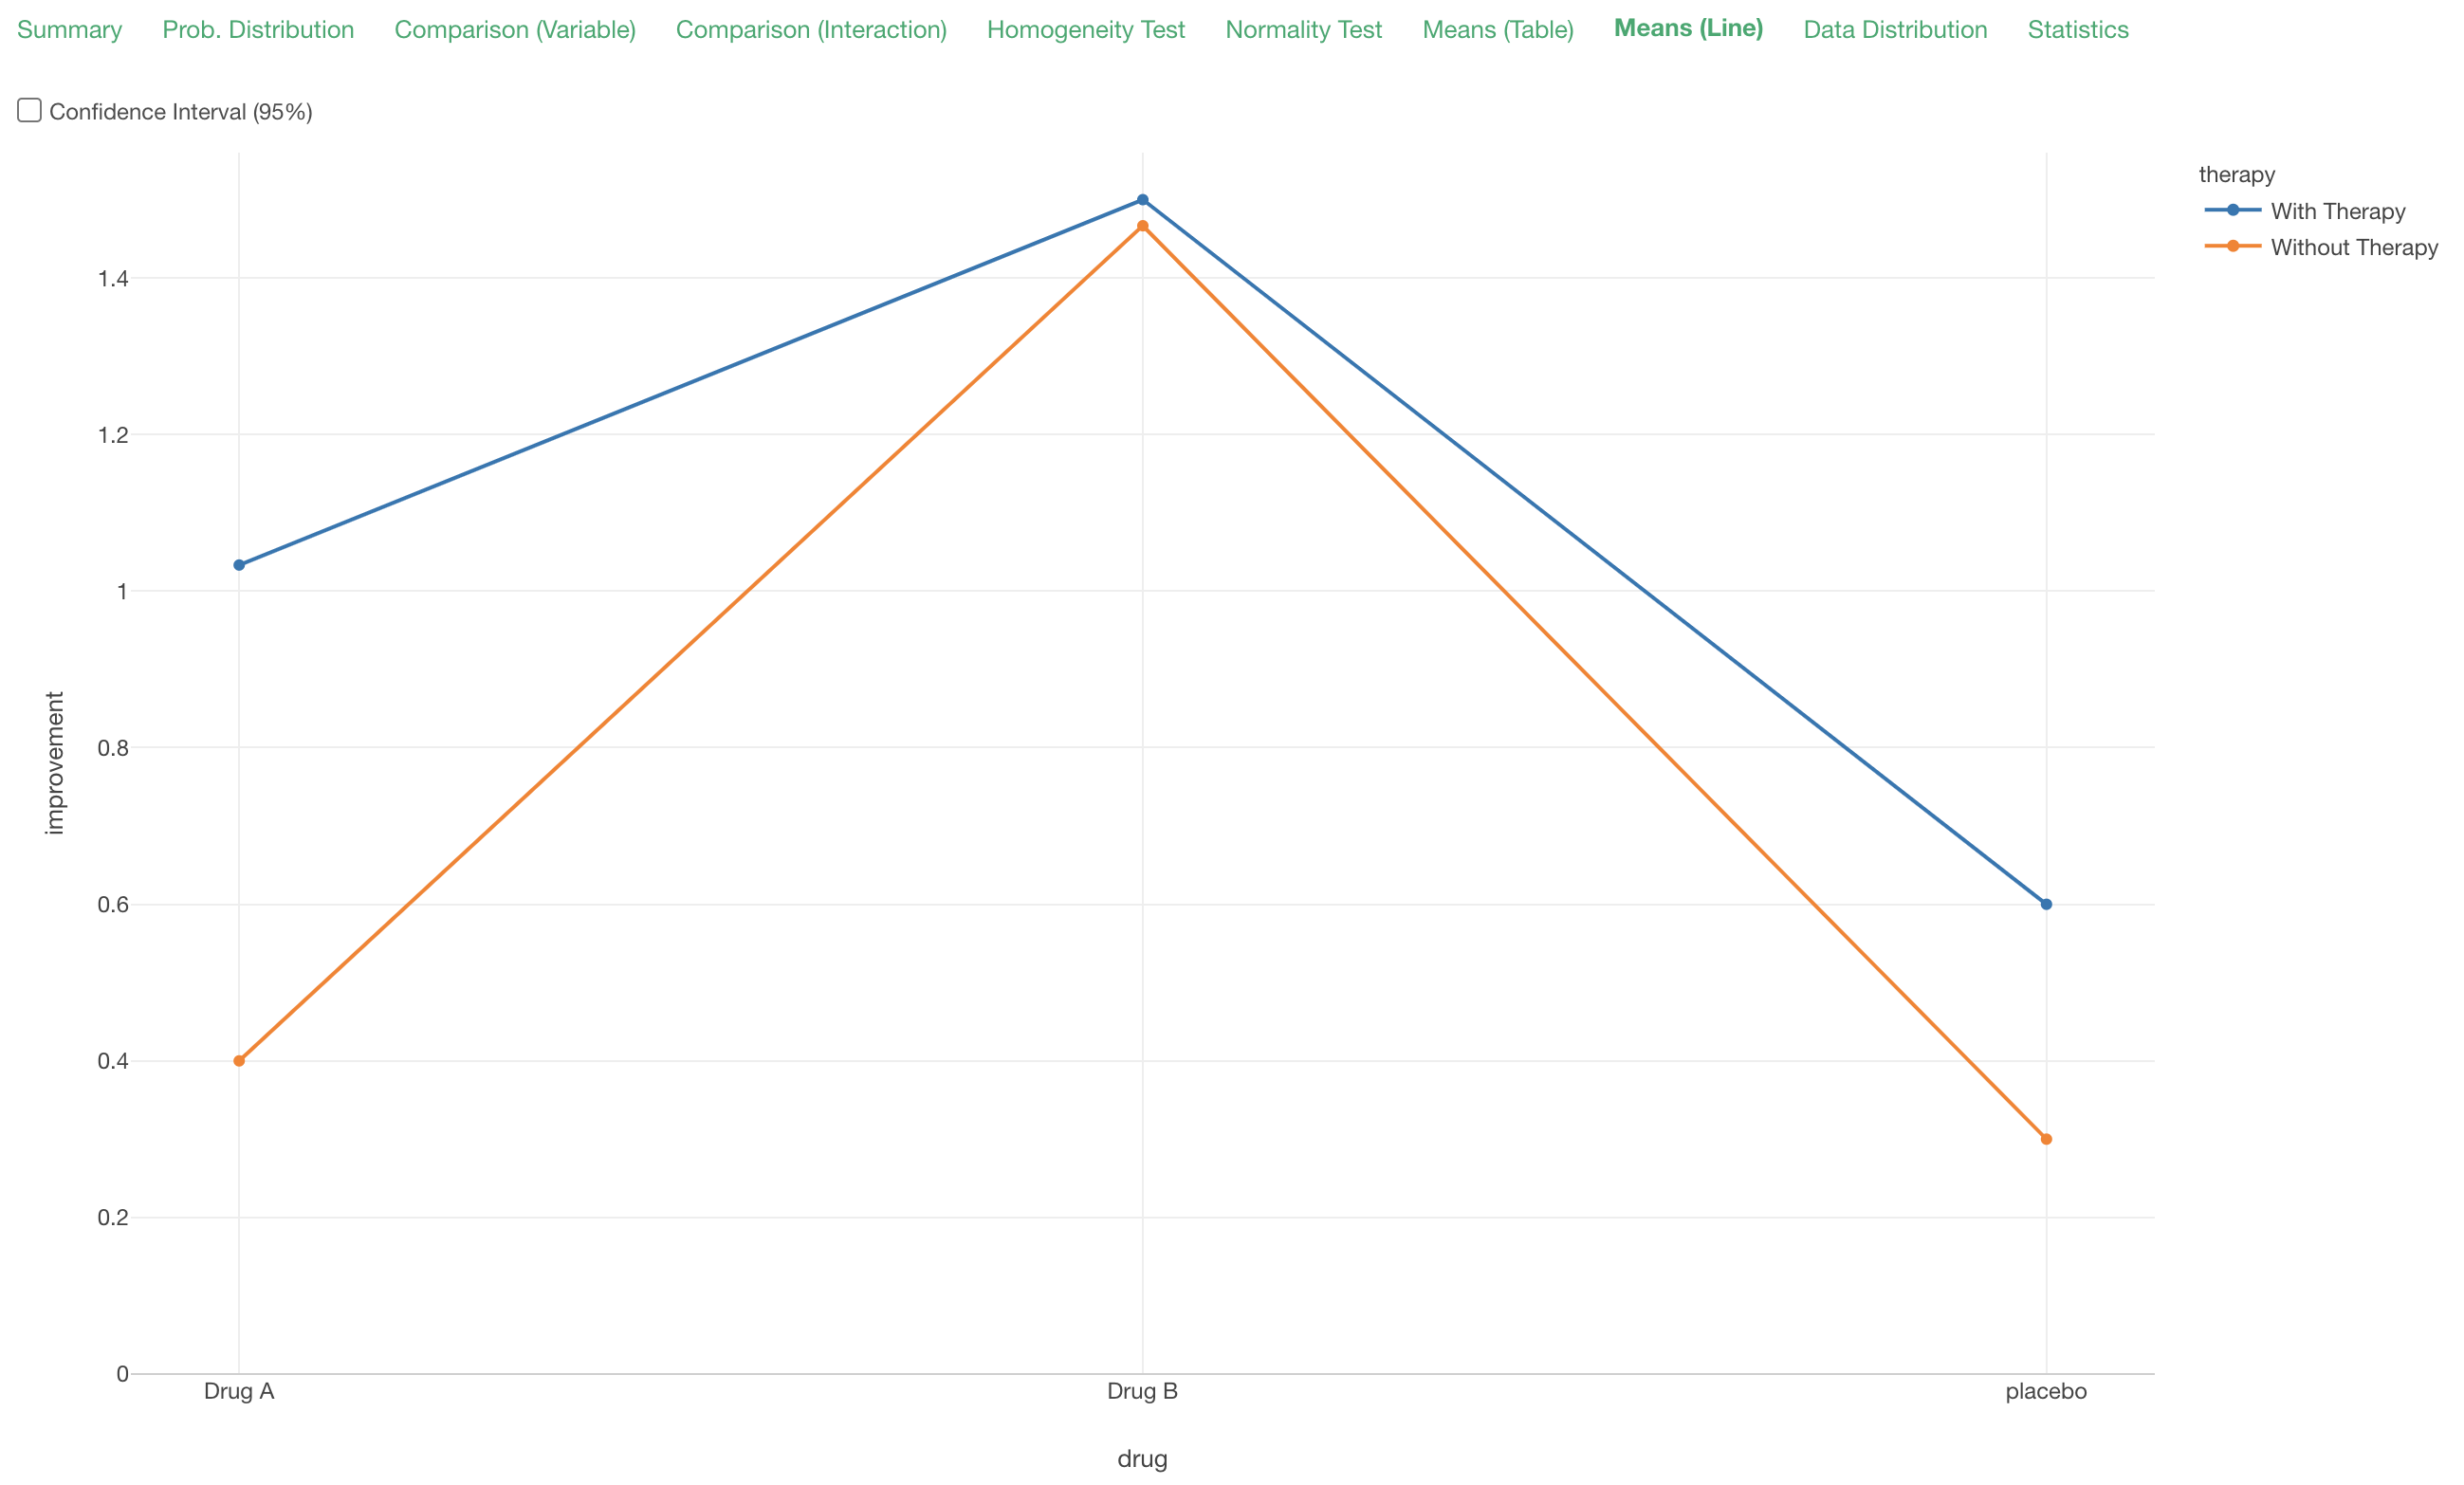
The key is to check if the multiple lines (in this case there are 2 lines) are crossing or not. If they're crossing then there are interactions between the two variables are taking effect on the target variable.
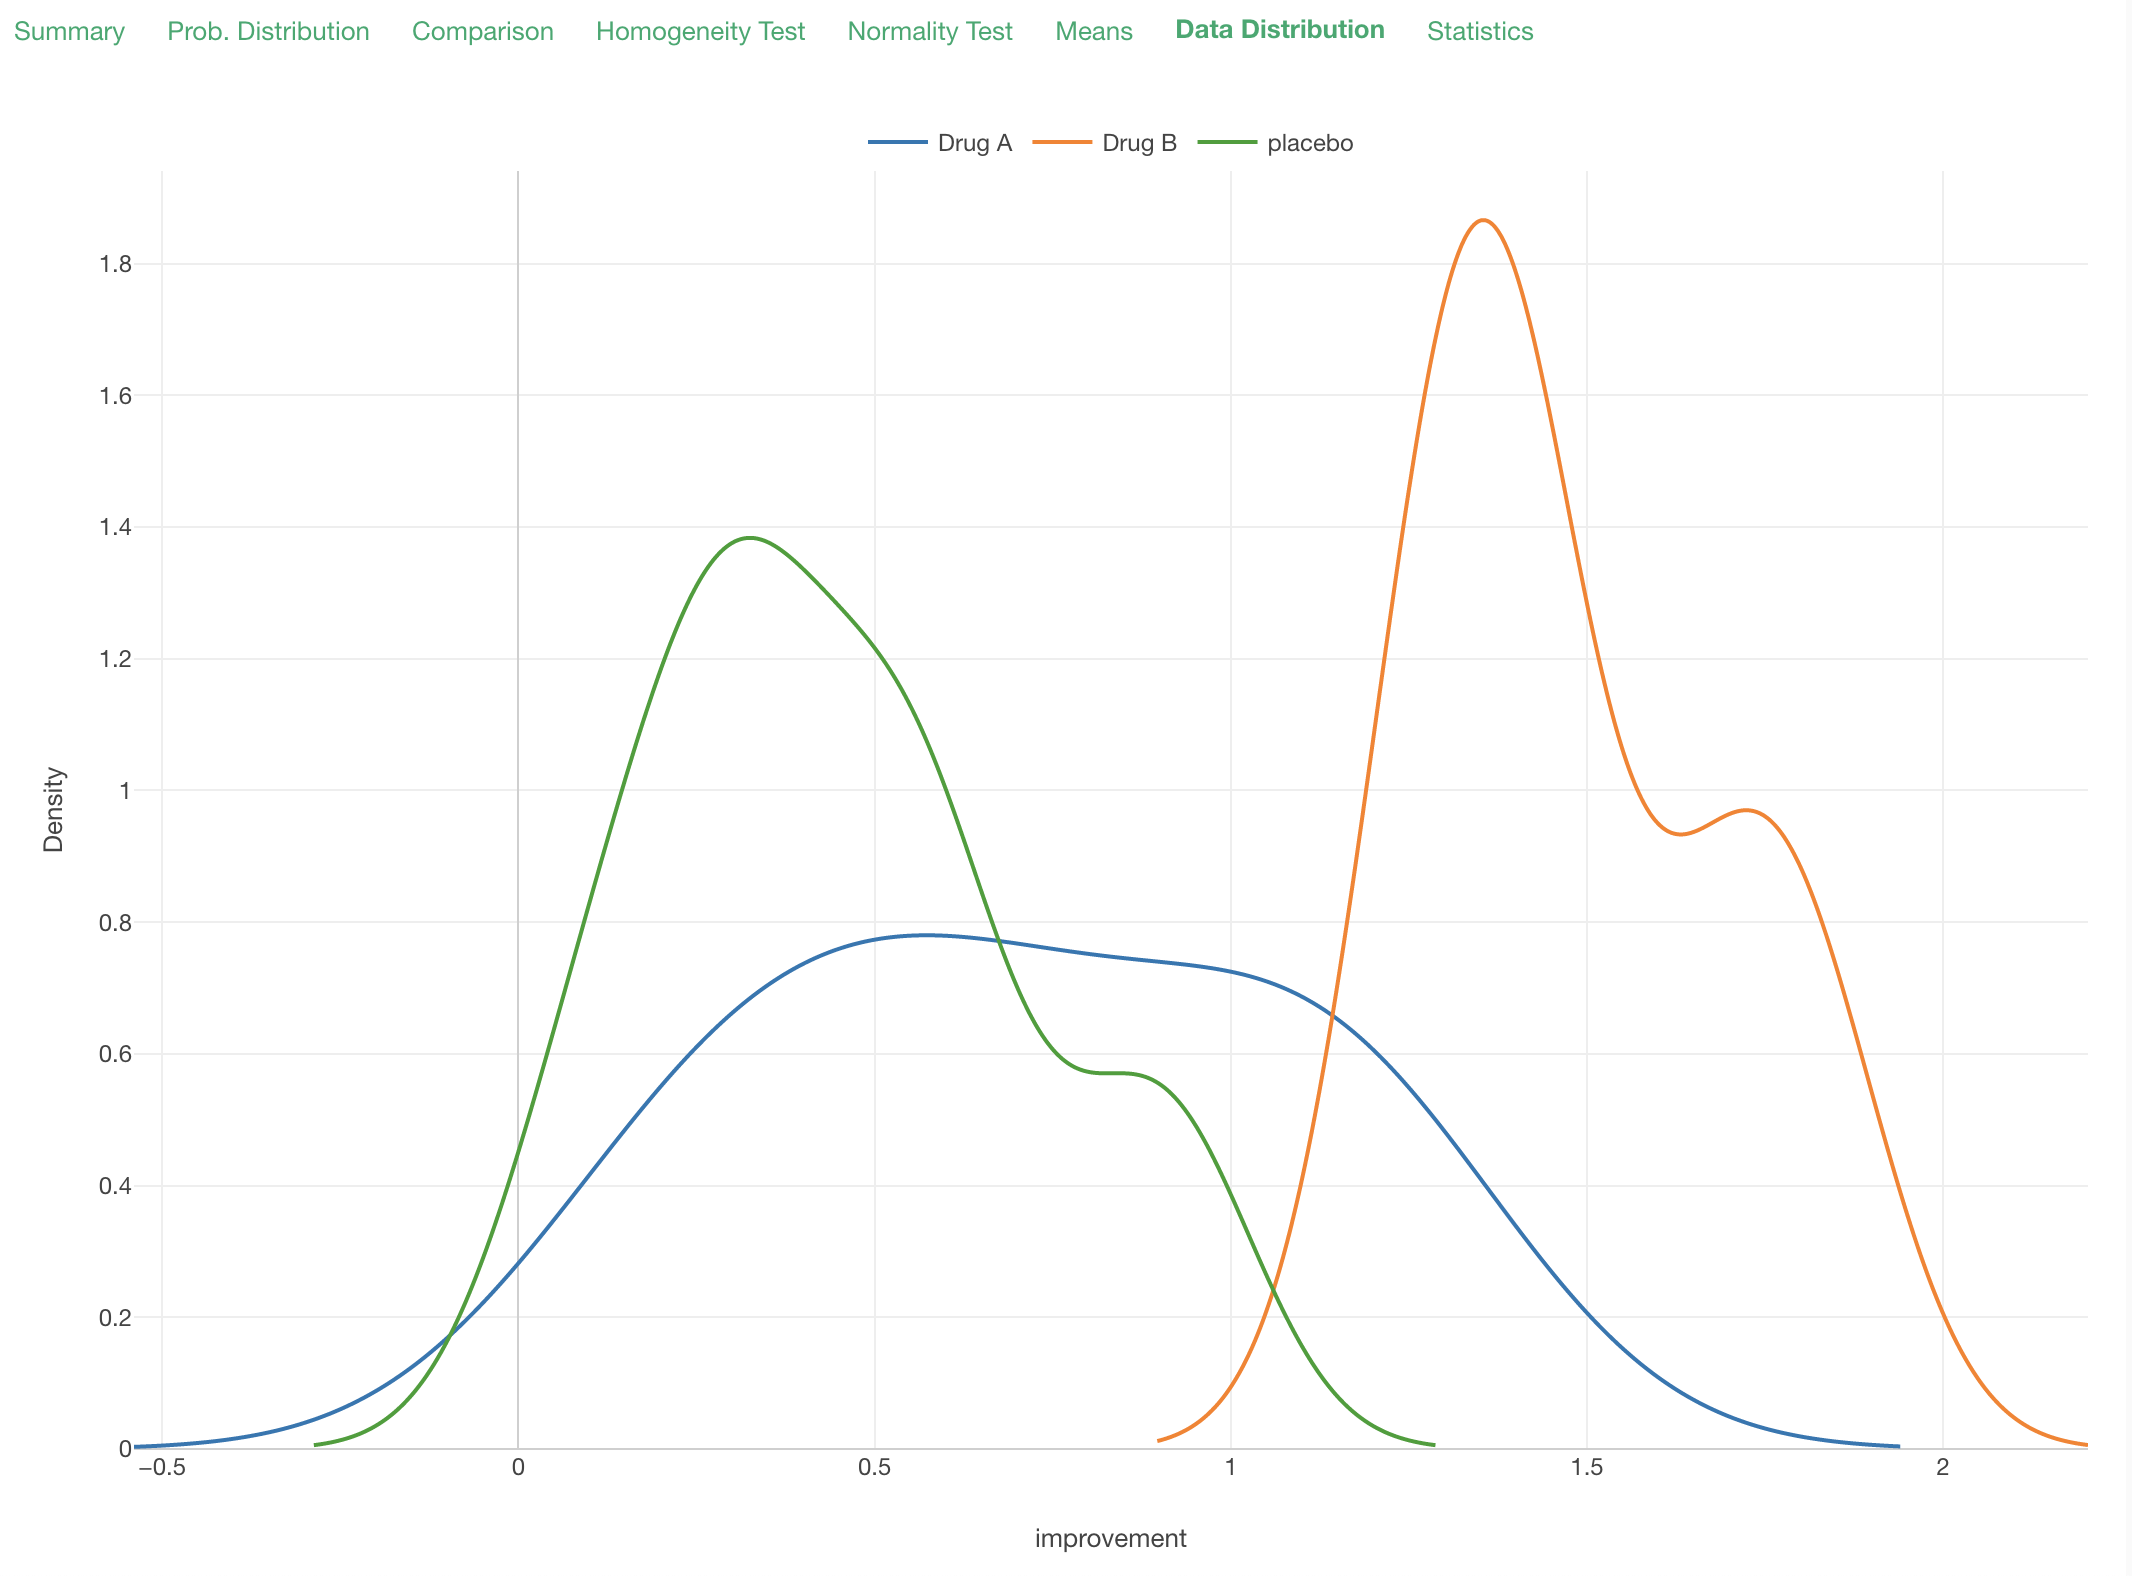
Data Distribution
Under the Data Distribution tab, you can see how the data is distributed by each group.
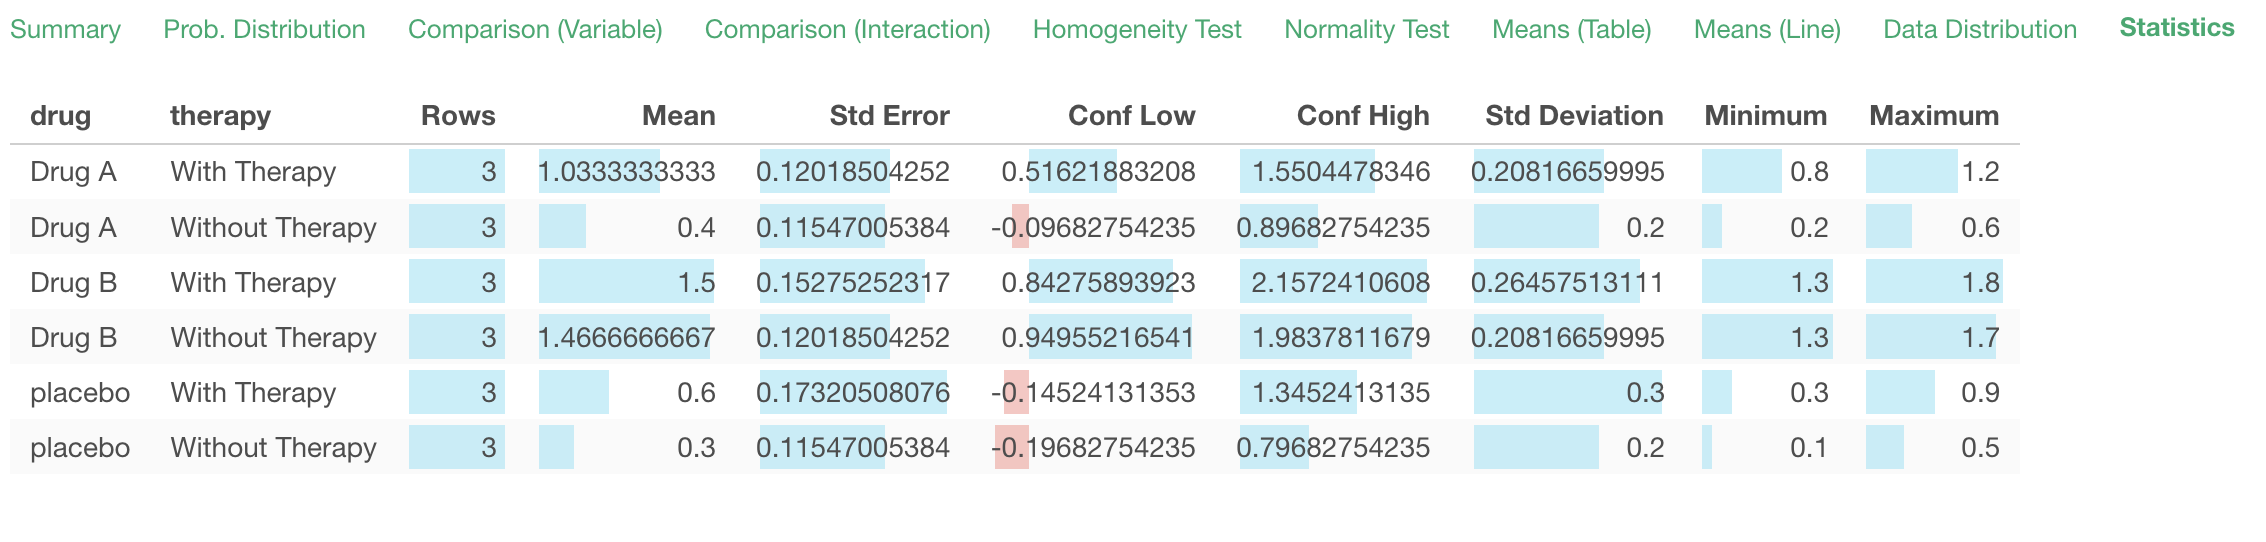
Statistics
Under the Statistics tab, you can see various summary statistics for each group.