Introduction to Word Cloud
This note shows you how to use Word Cloud chart in Exploratory.
If you are interested in analyzing text data we'd strongly suggest you to use 'Word Count' under Analytics view, which tokenizes the text by separating words from sentences and visualize how they are used.
But if you already have data that already has tokenized as words or many categorical data and visualize which words are more used than the others, then this Word Cloud chart is a way to go!
Sample Data
We'll use this 'Hurricane Ian' related tweet data. You can download it from this page.

We have already tokenized the tweet text. This means that words contained in the tweets are separated and each word is presented as each row.
1. Create Word Cloud Chart
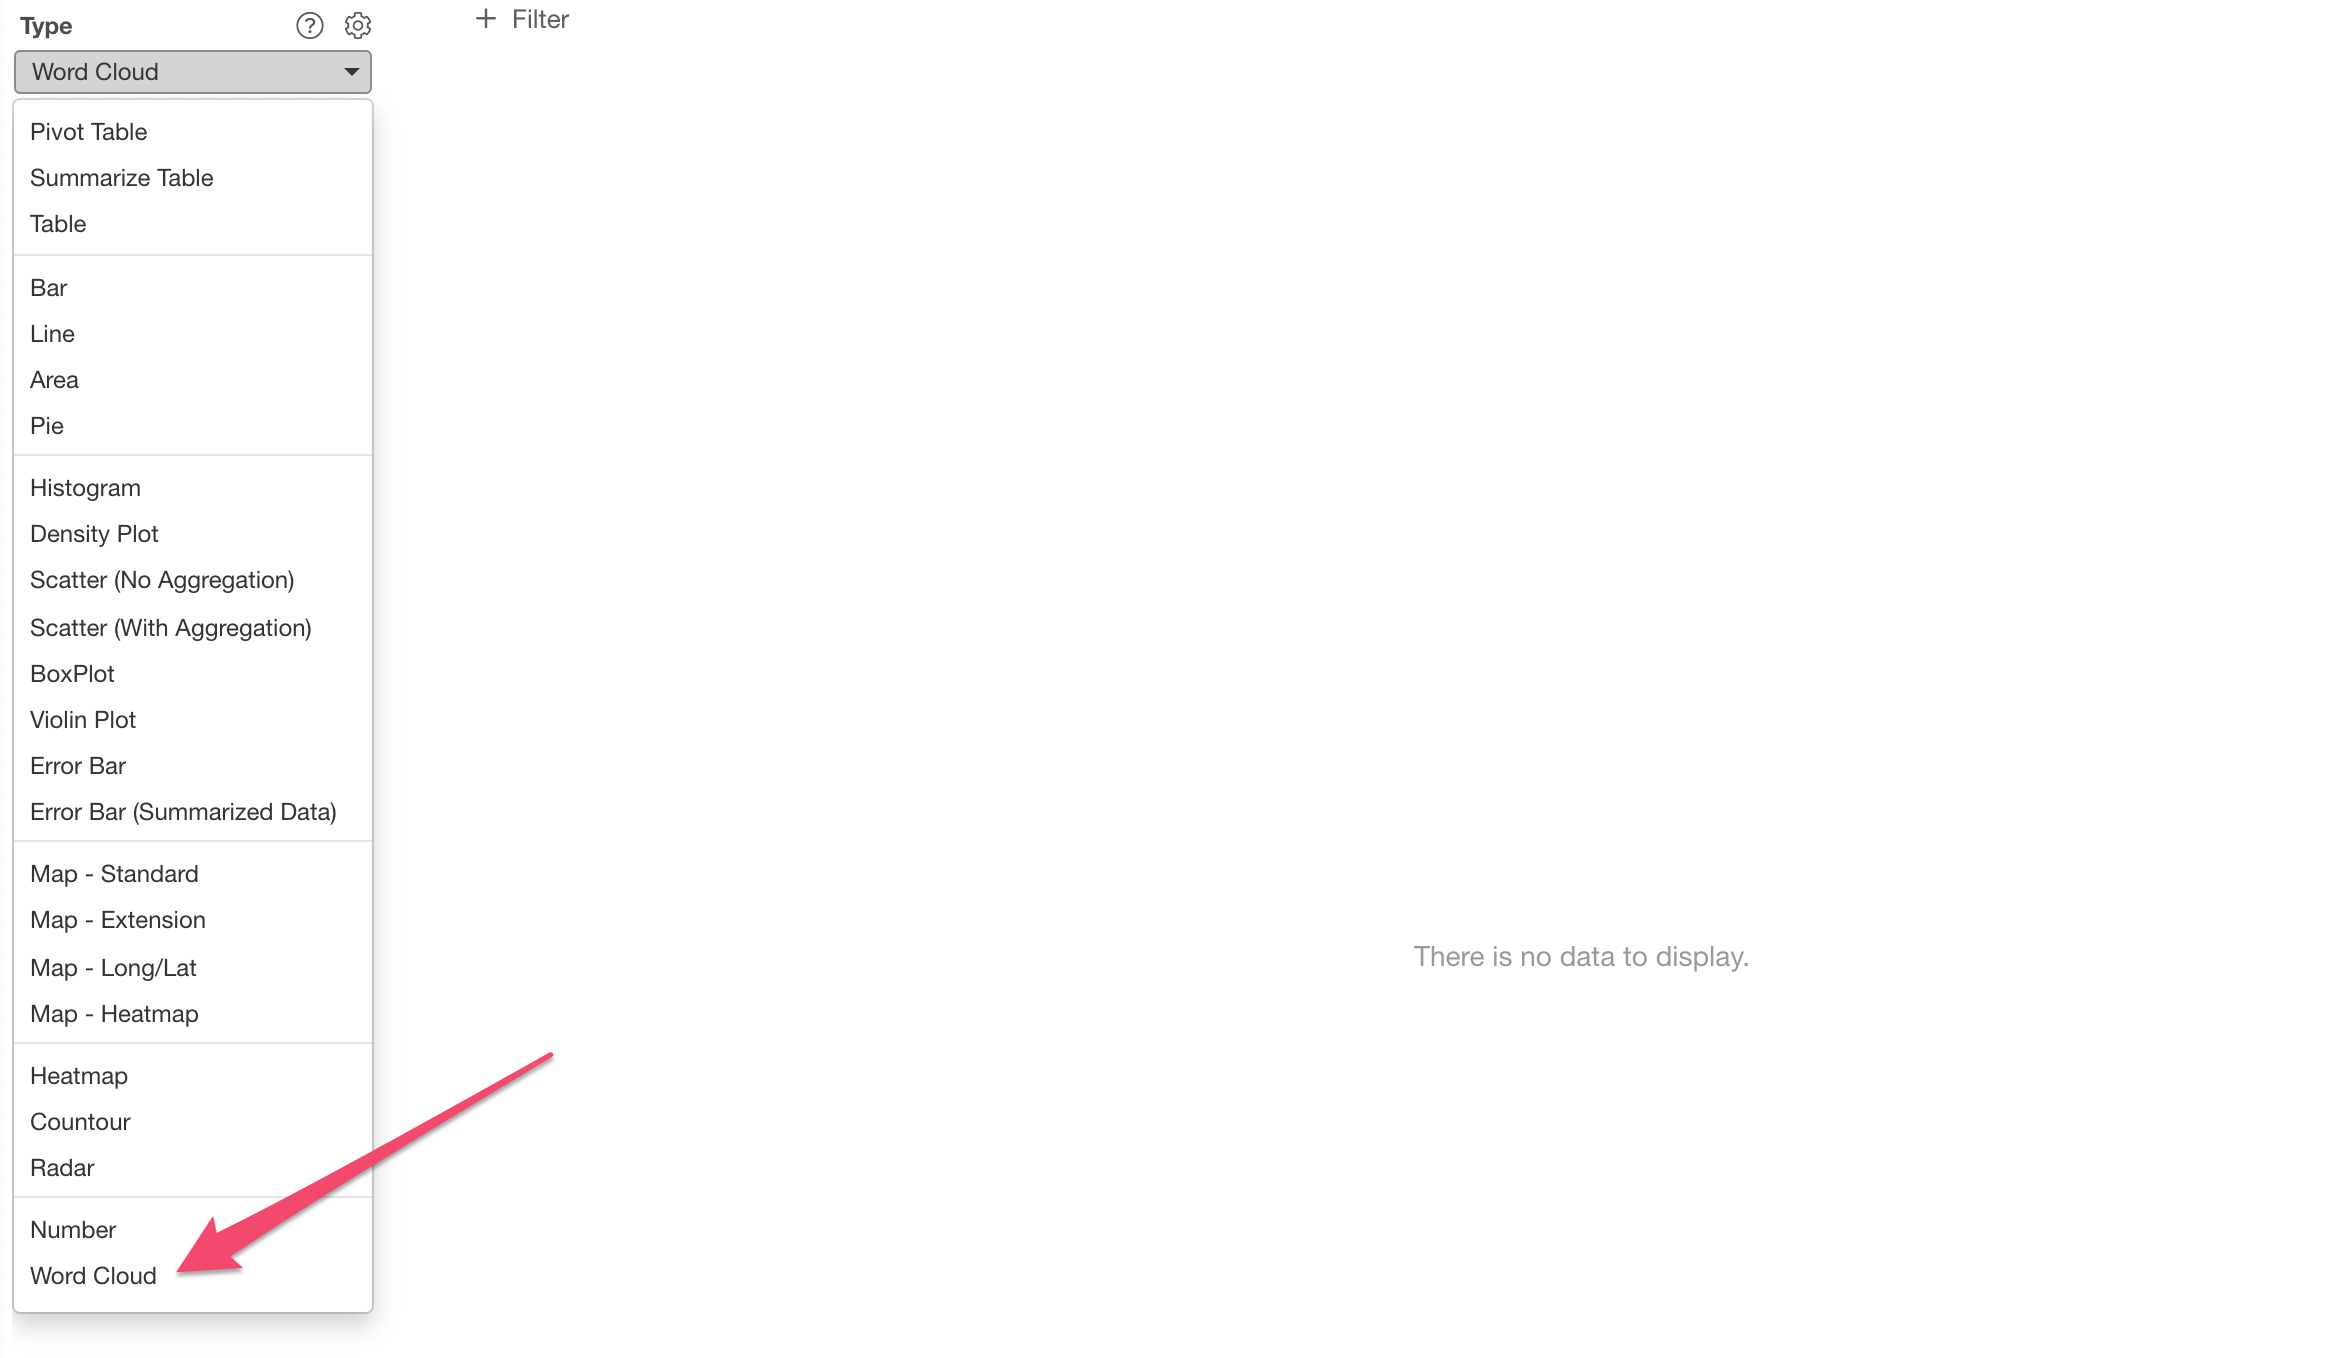
Select 'Word Cloud' from the Chart list.
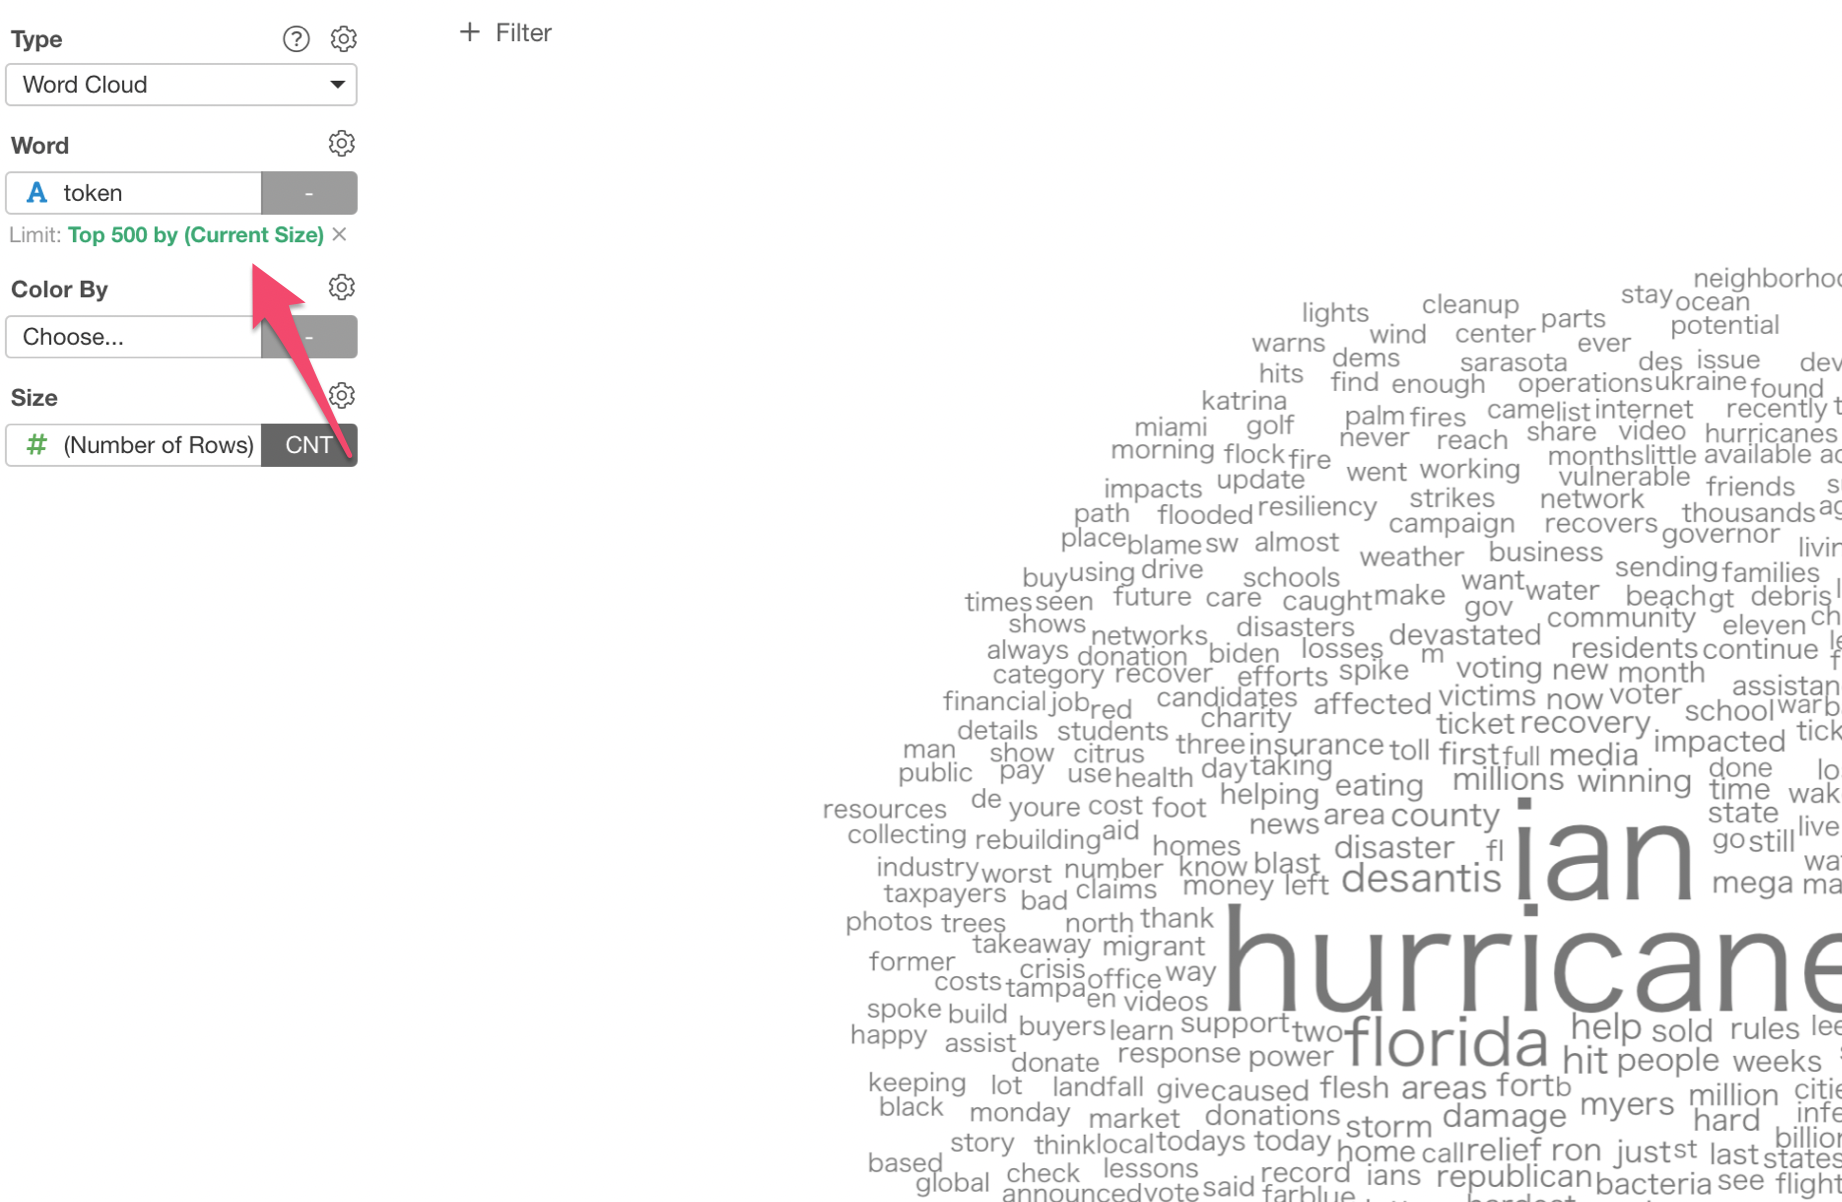
And select 'token' column, which has the words.
When you have too many unique values (words) like this time you will see a dialog popping up, which suggests you to reduce the number of values by keeping only the top 500 most frequent values or try to show all the values if you don't mind waiting for a long time of processing / rendering.
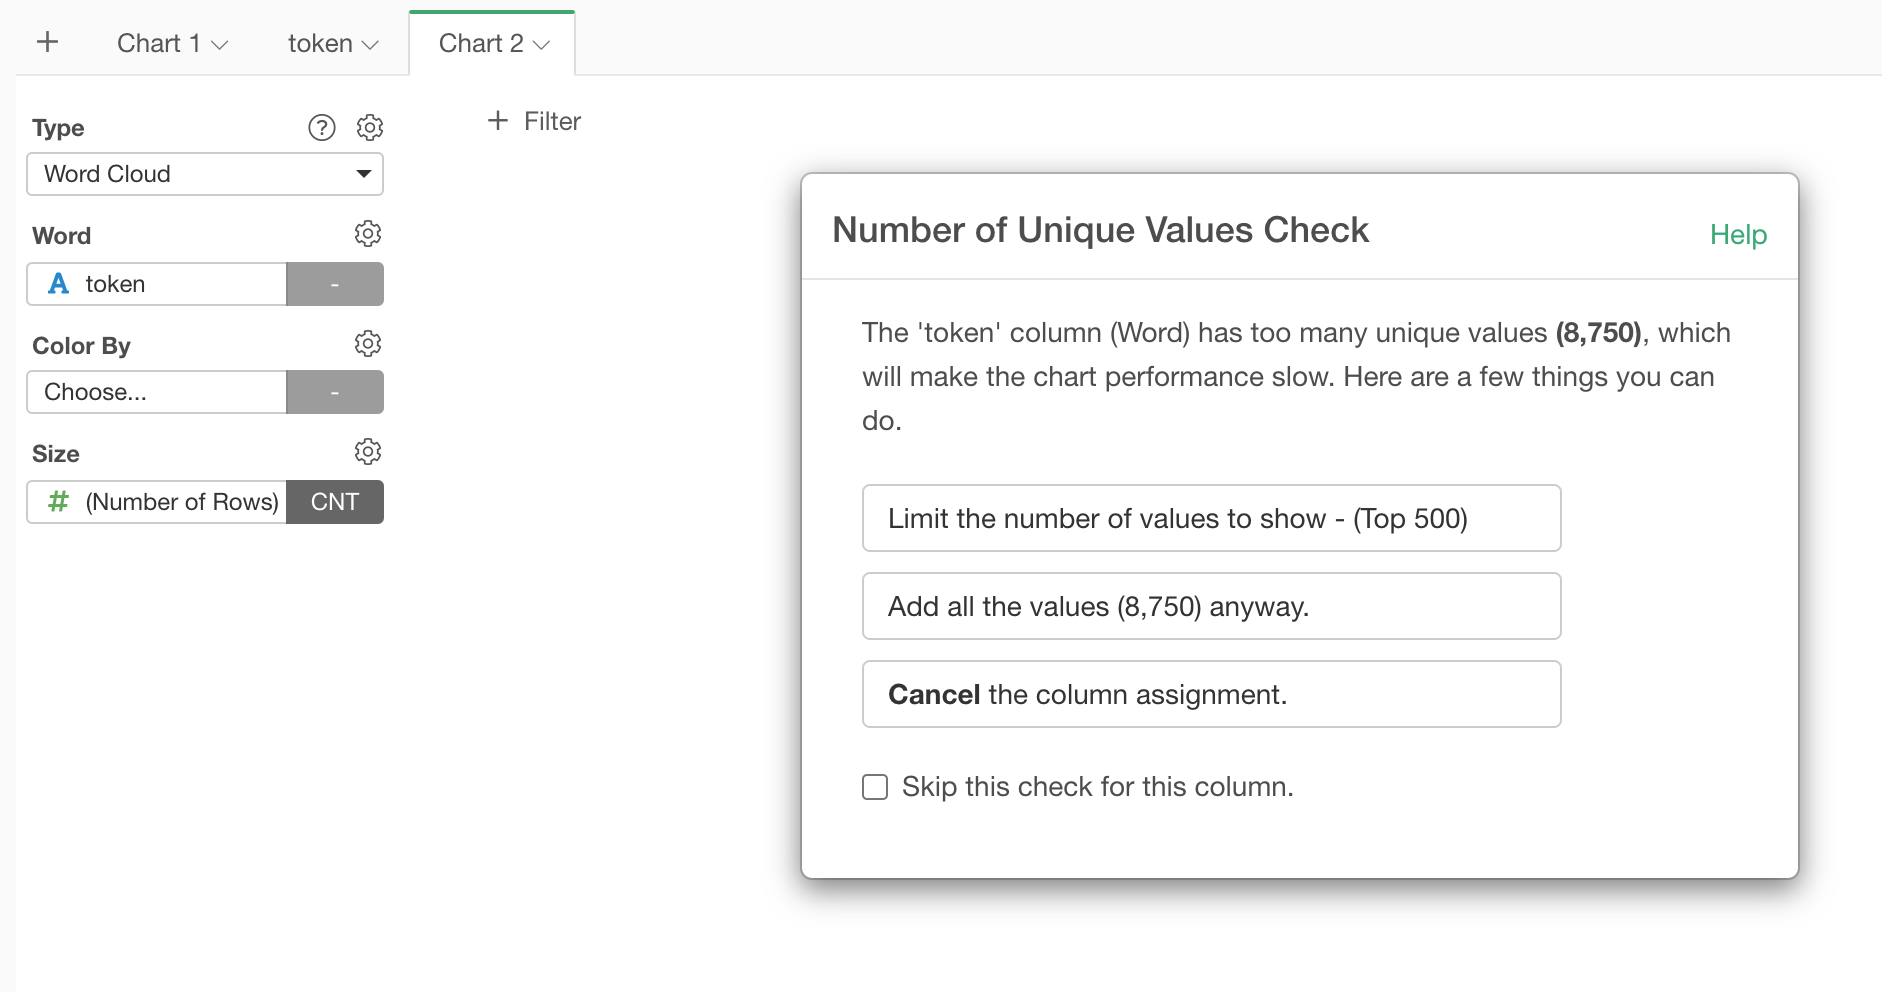
We'd suggest you to click 'Limit the number of values to show' button so that the Word Cloud chart will be generated relatively quickly.
2. Change the Limit Size
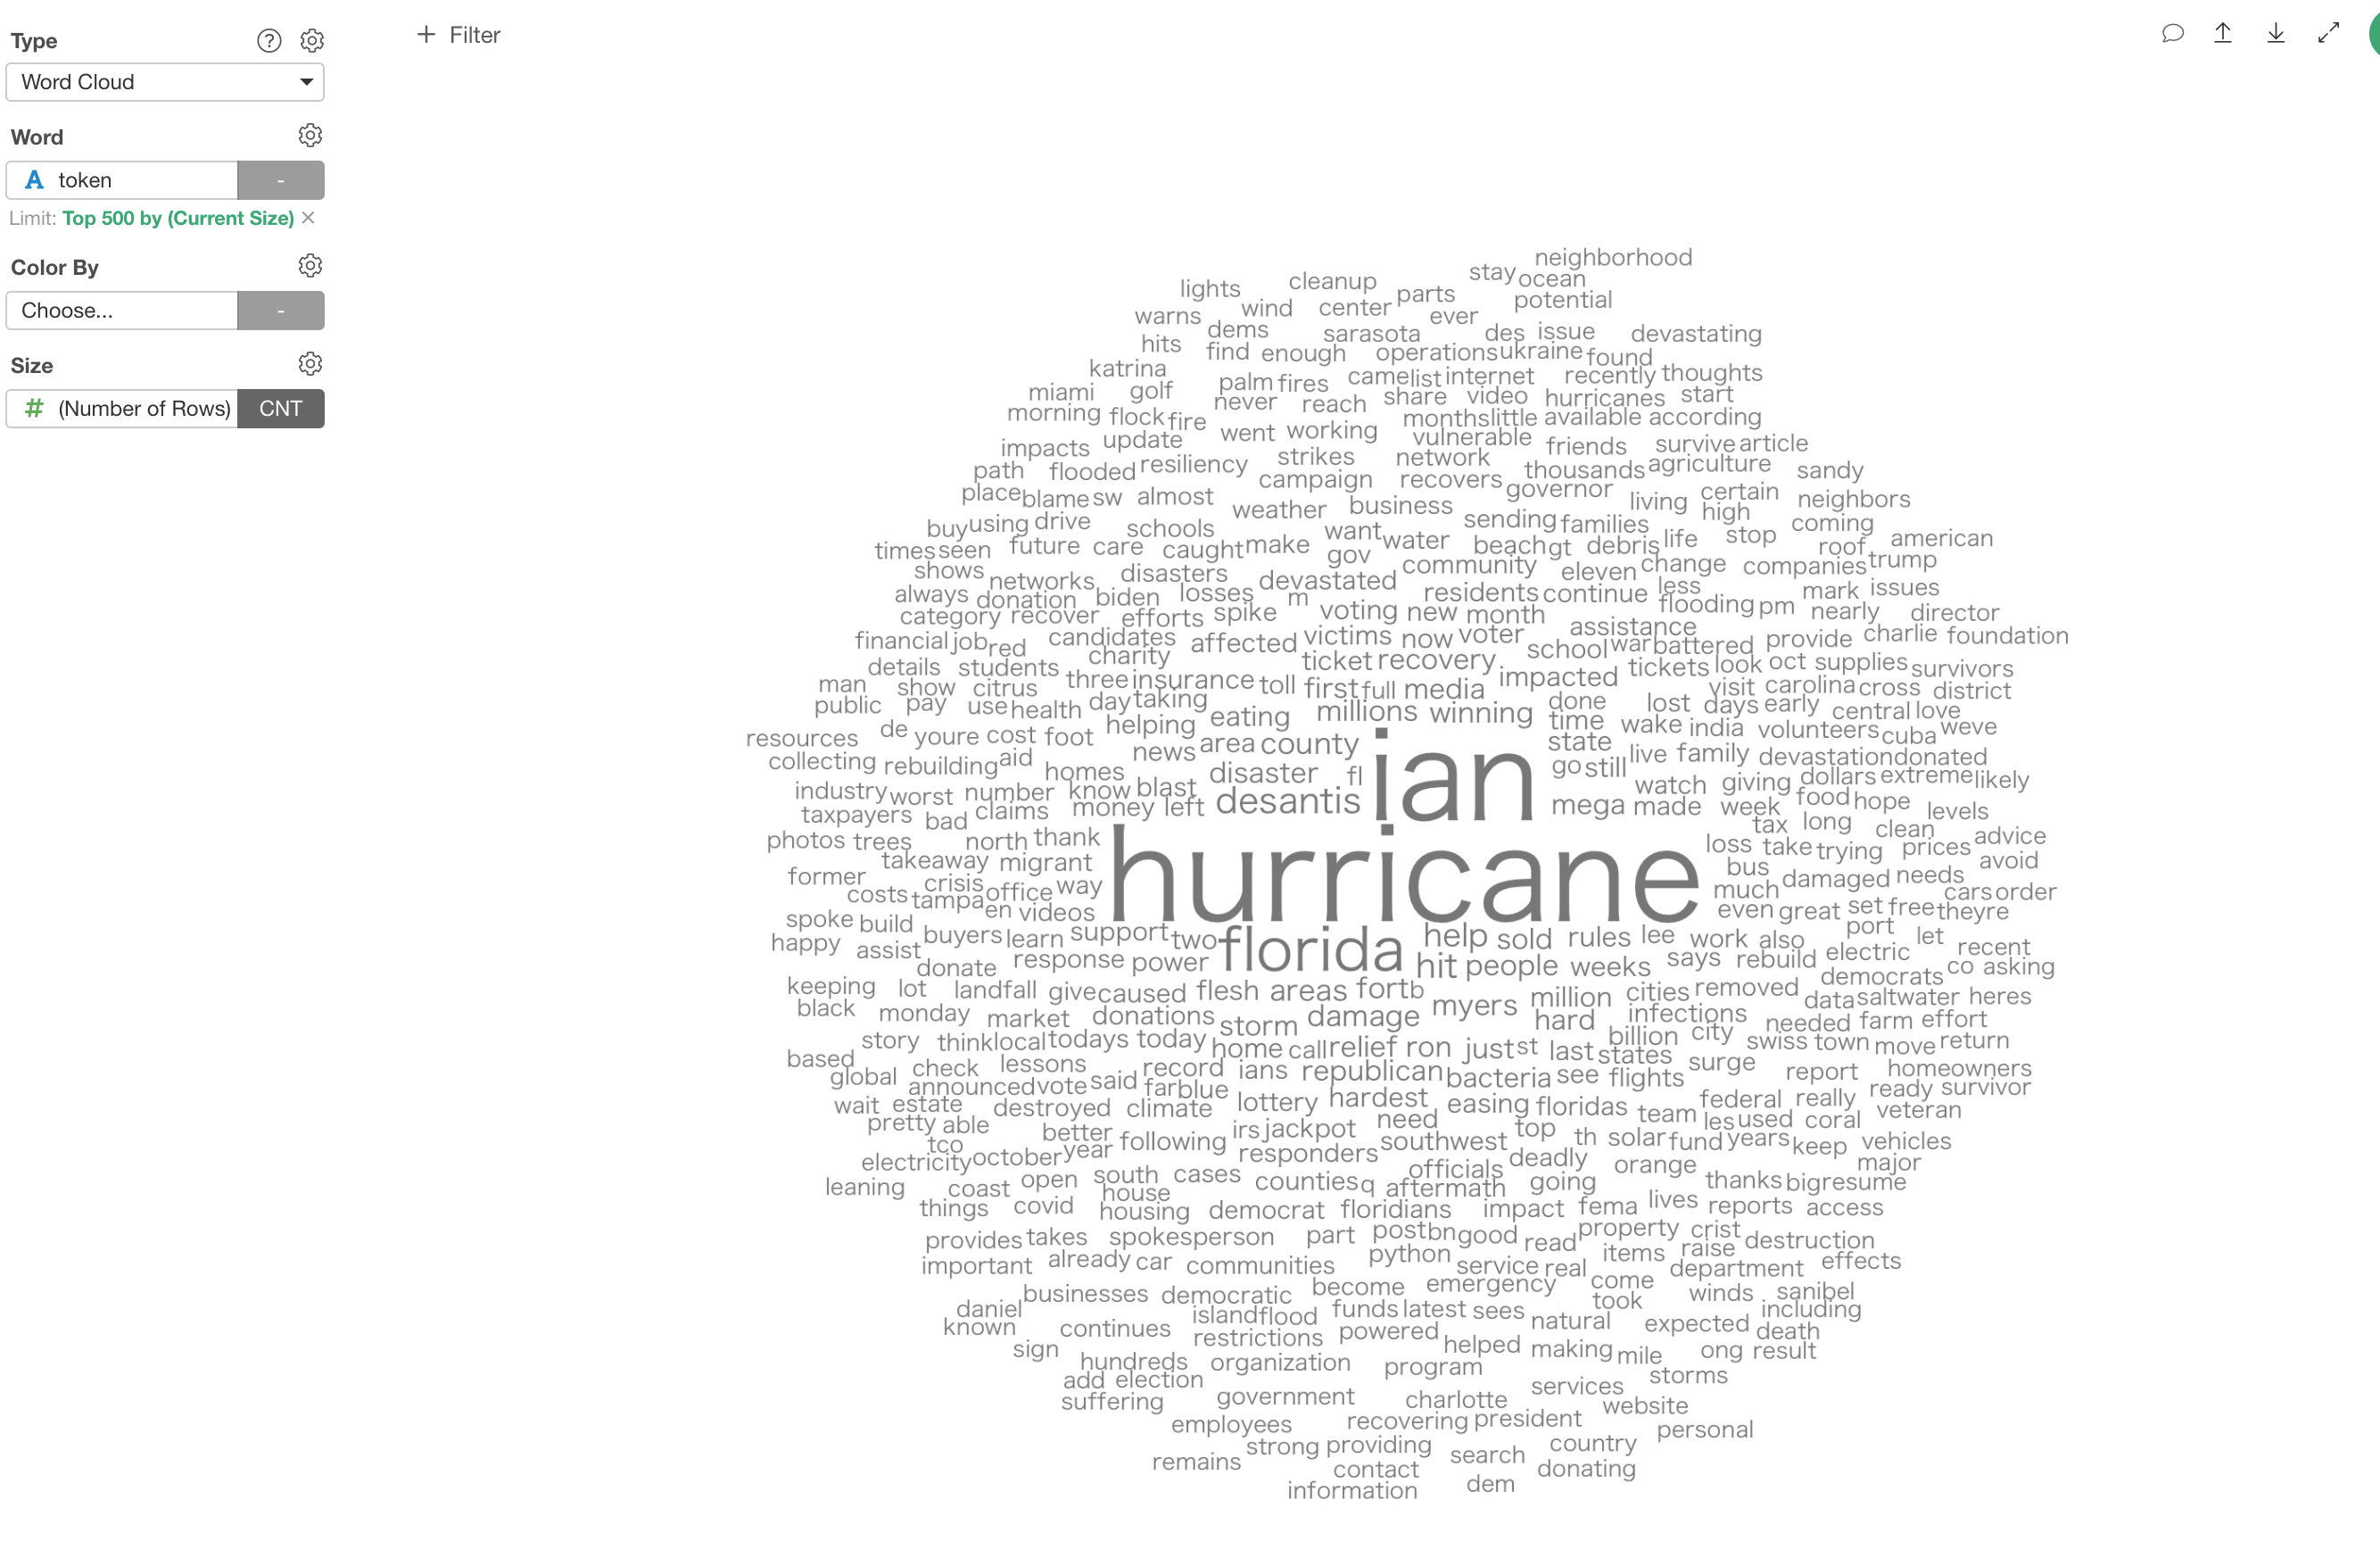
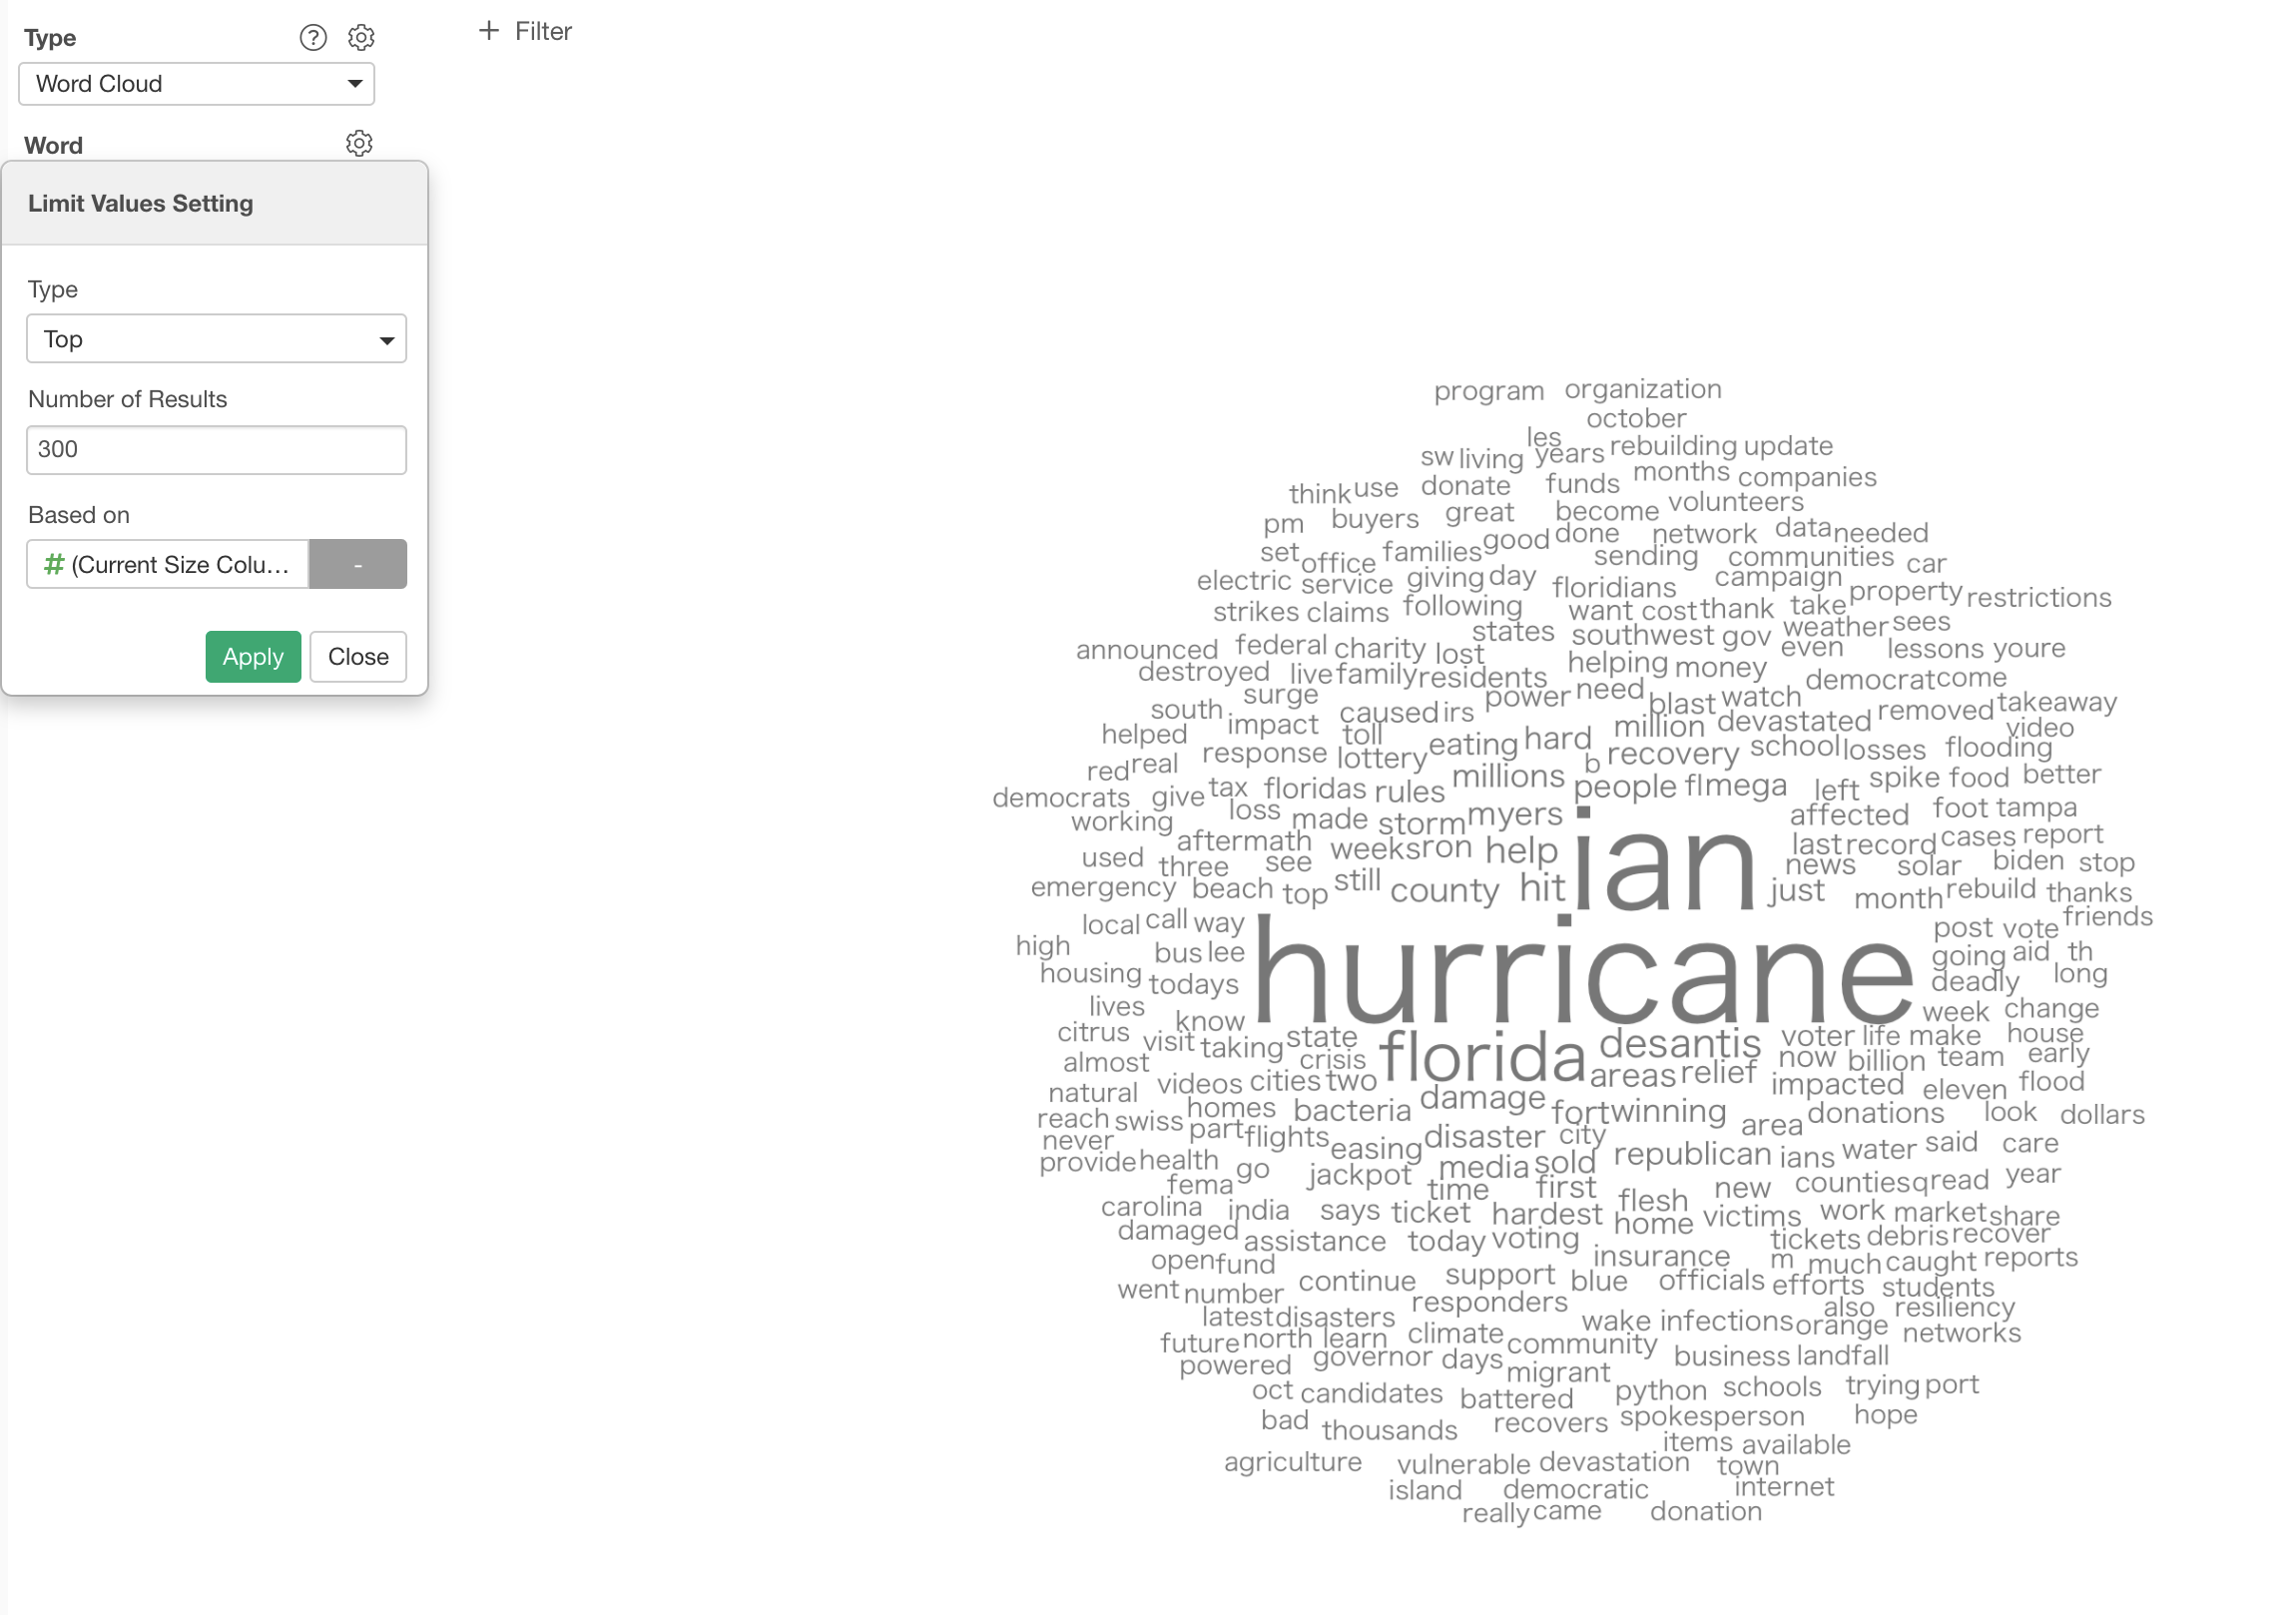
At the previous step, we have selected the word limiting number to be 500, but we can change it by clicking on the green text underneath the Word column.
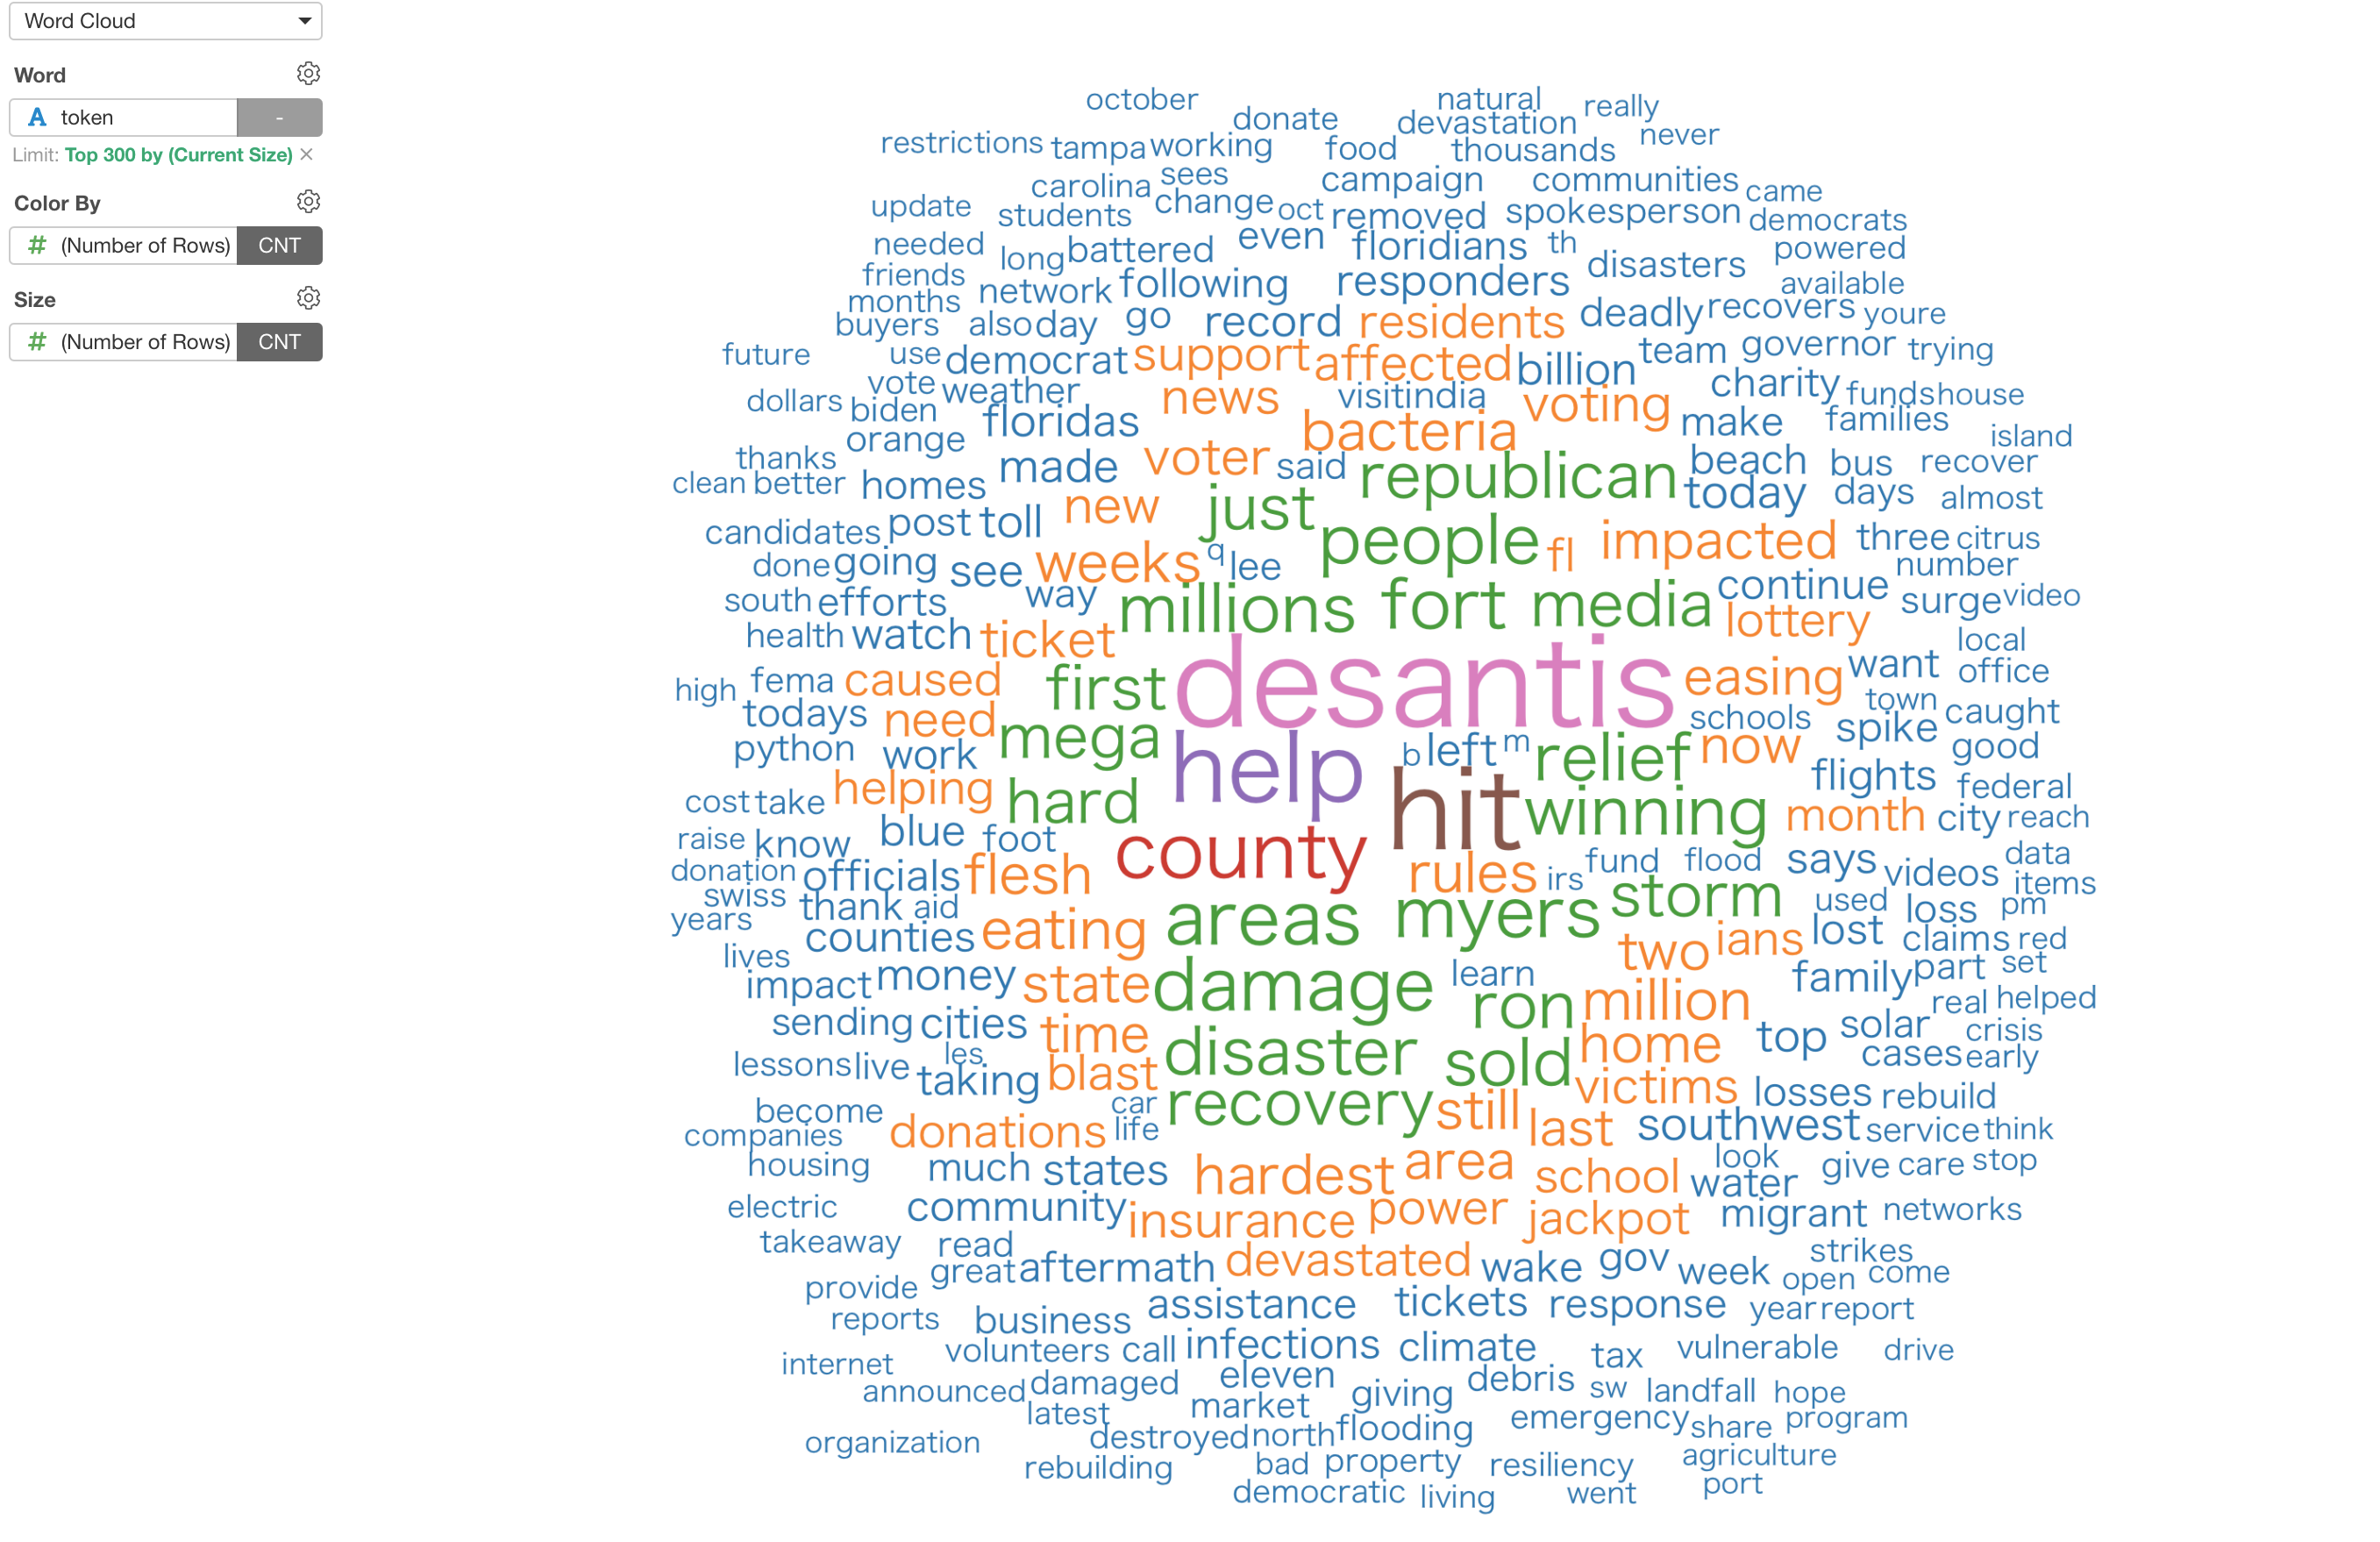
Type the number you like. Here, we have typed 300, which will show 300 words.
3. Filter Out Unnecessary Words
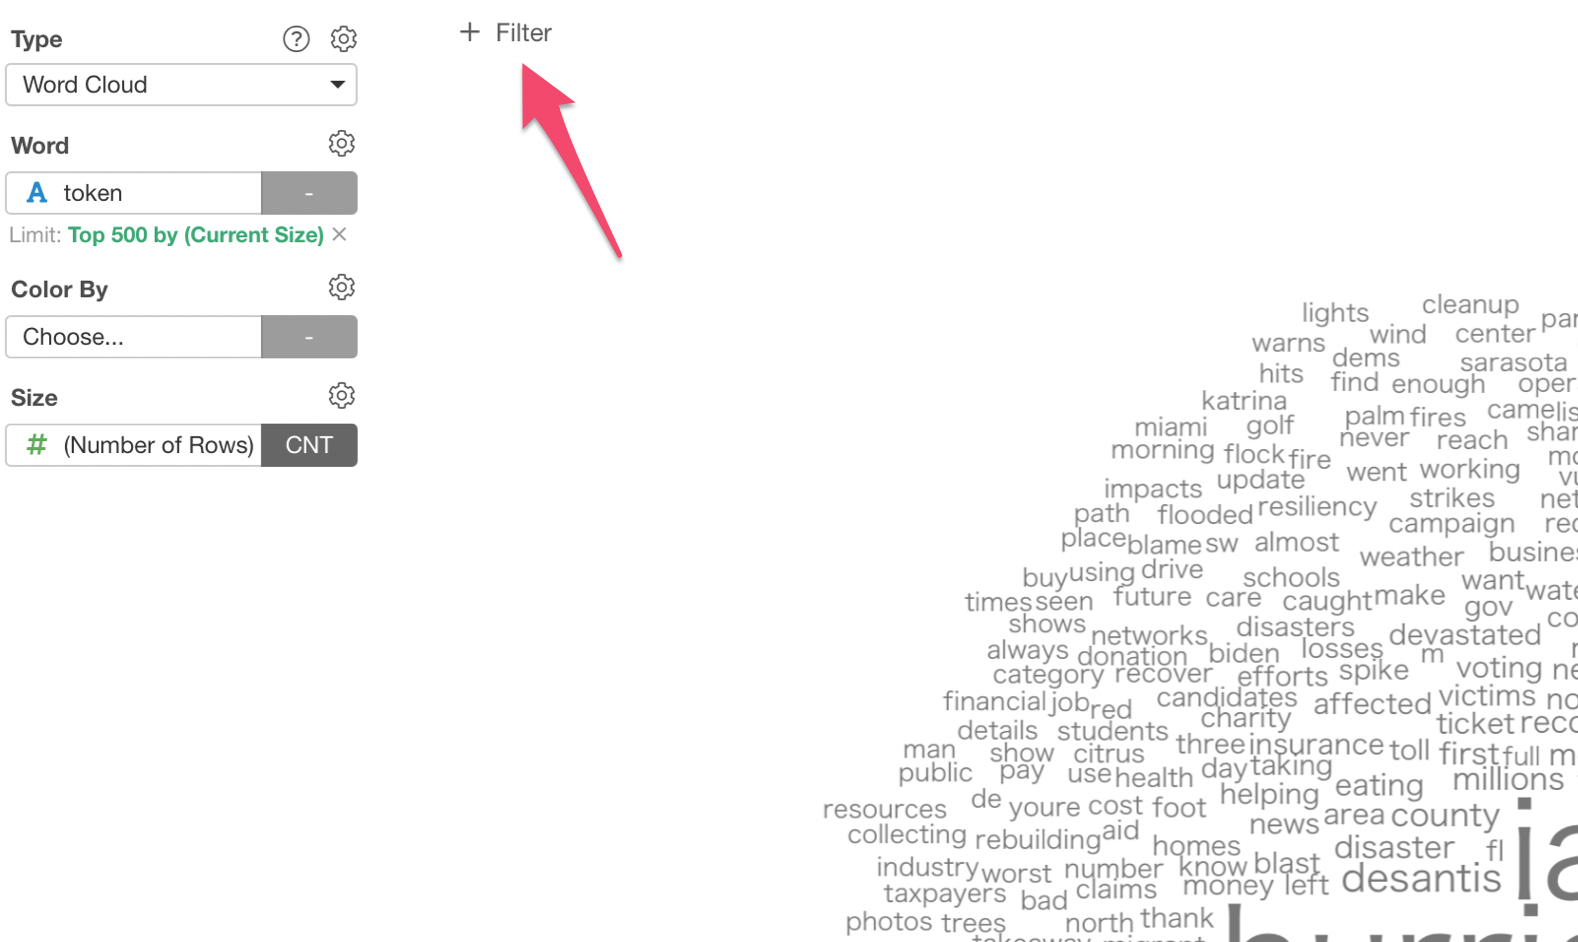
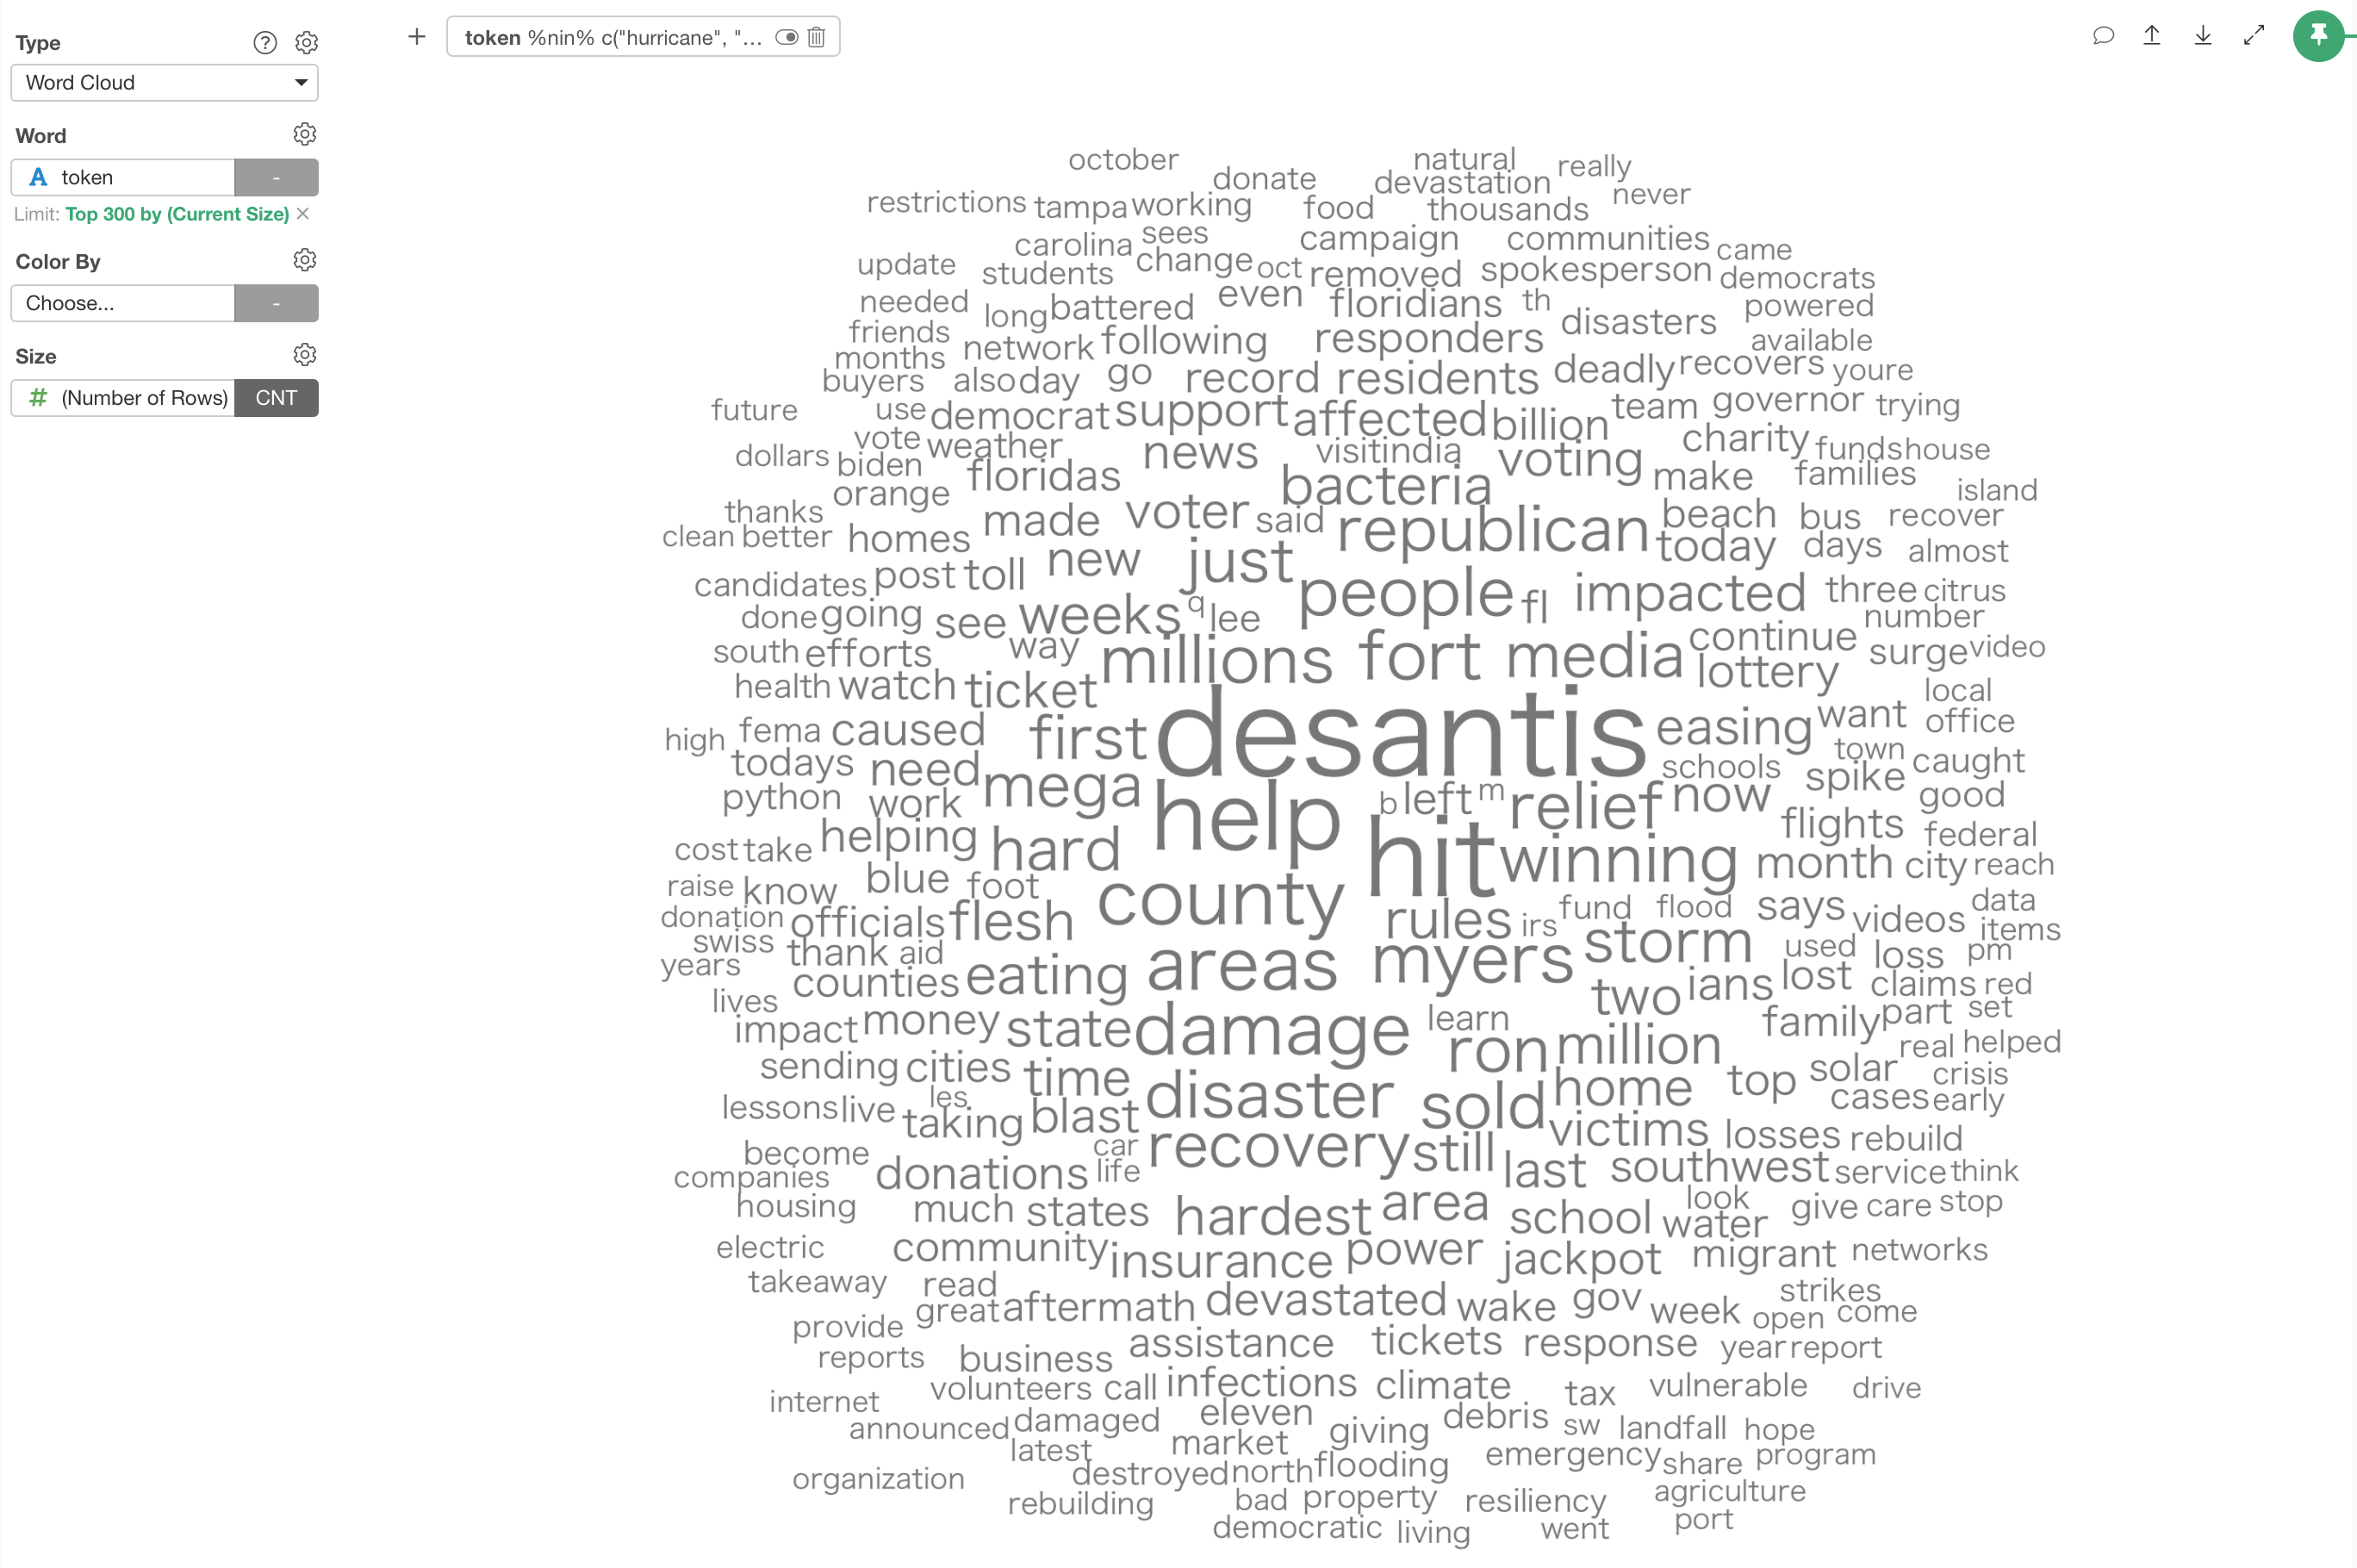
The most frequently used words are 'Hurricane' and 'Ian' as expected. This is about 'Hurricane Ian' data, ha! ;)
You can use the 'Chart Filter' to filter them out so that we can see other words more clearly.
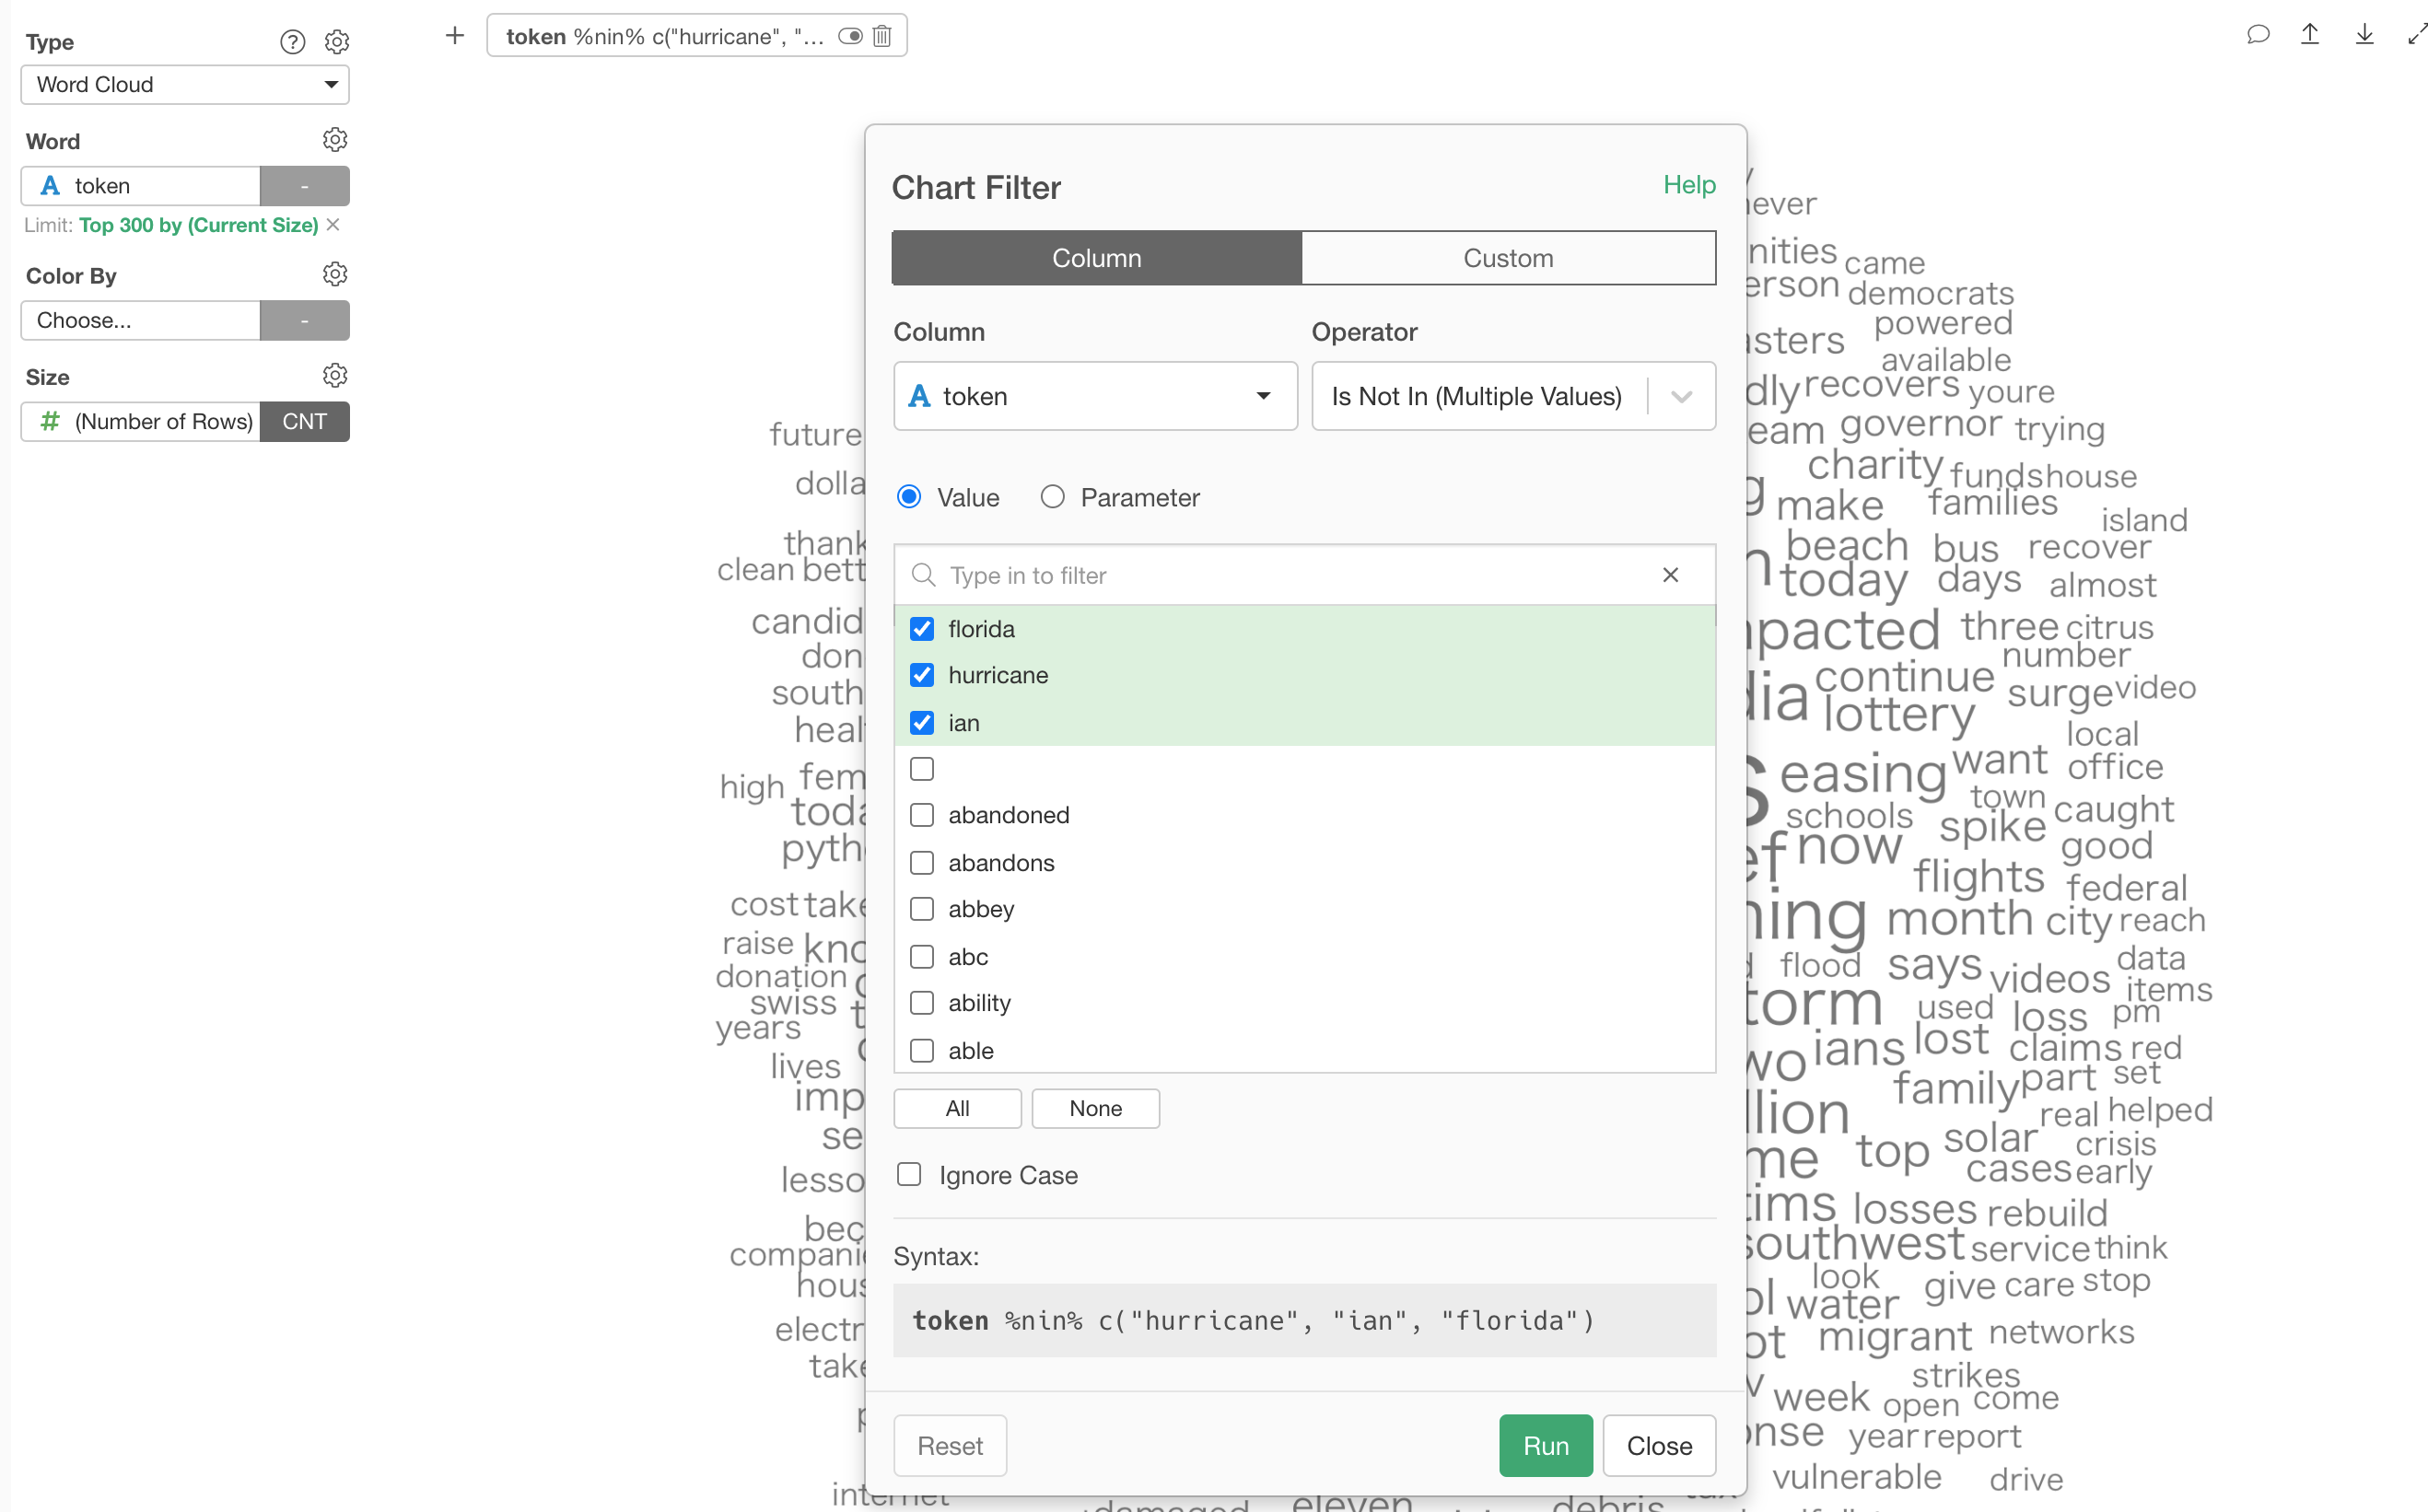
After I've removed 'Hurricane', 'Ian', and 'Florida'.
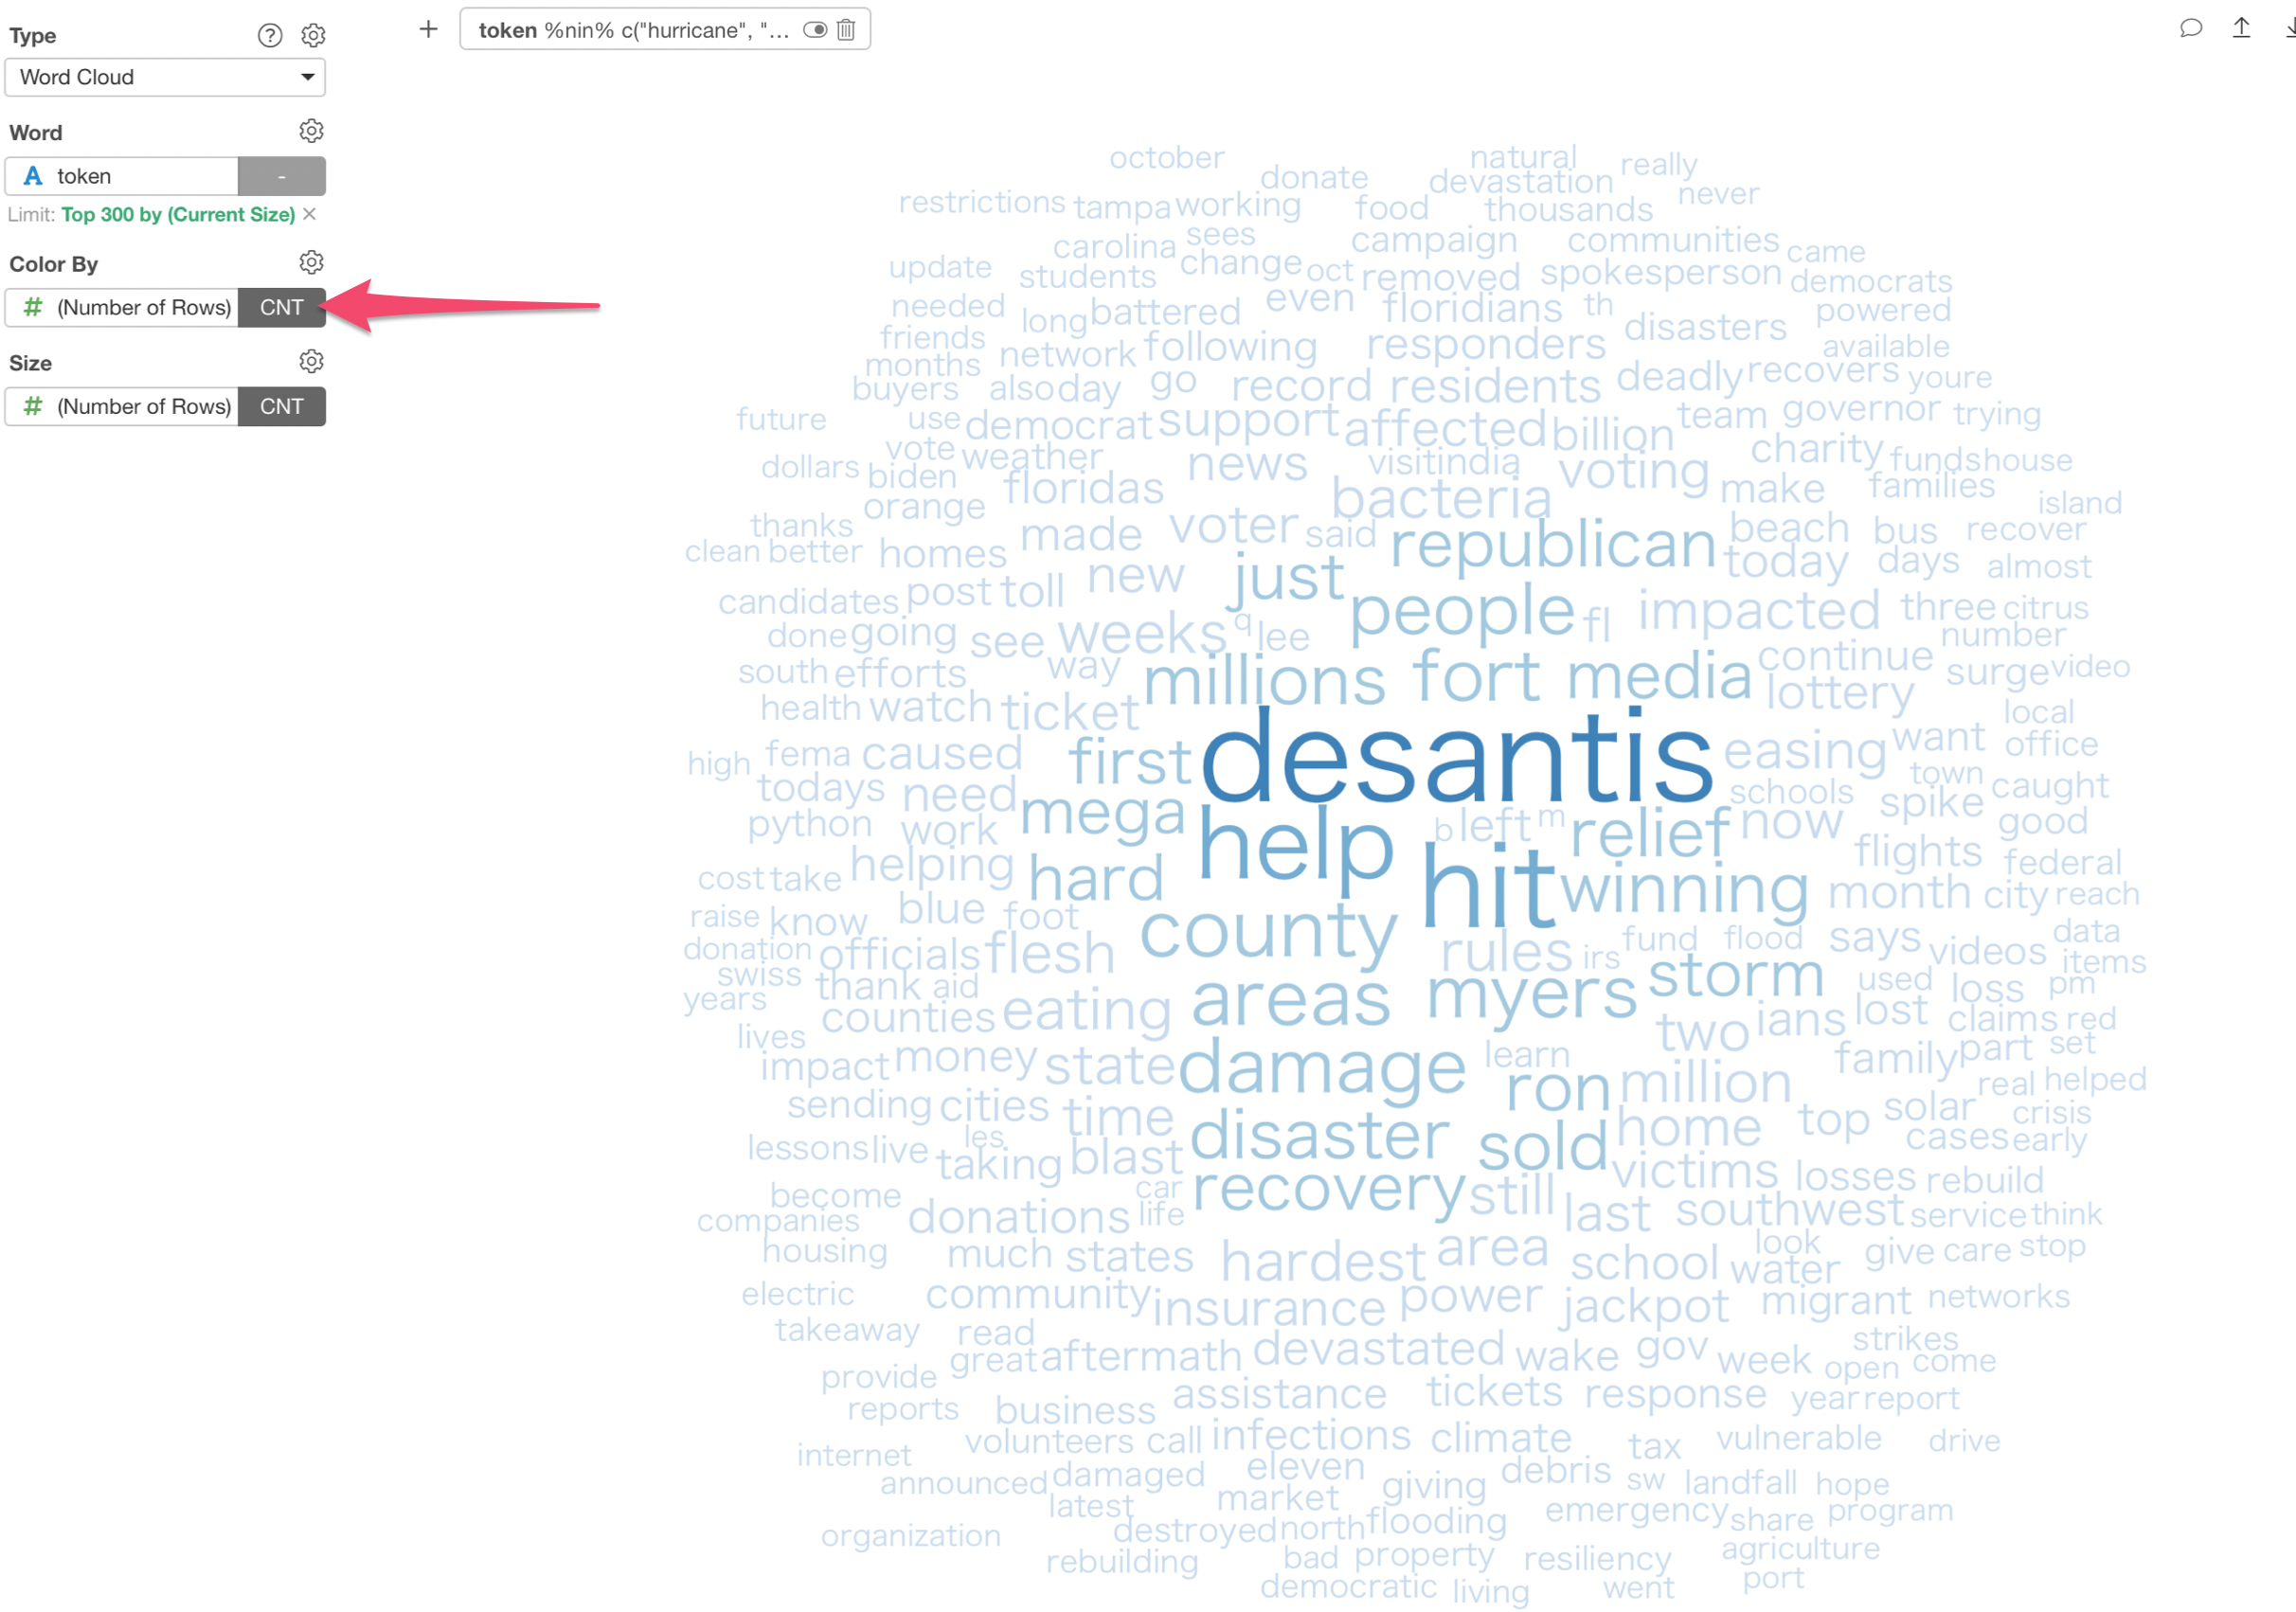
4. Use Color to Create Groups
We can use Color, too.
You can change the Color Palette.
Here's one with a distinctive color palette.
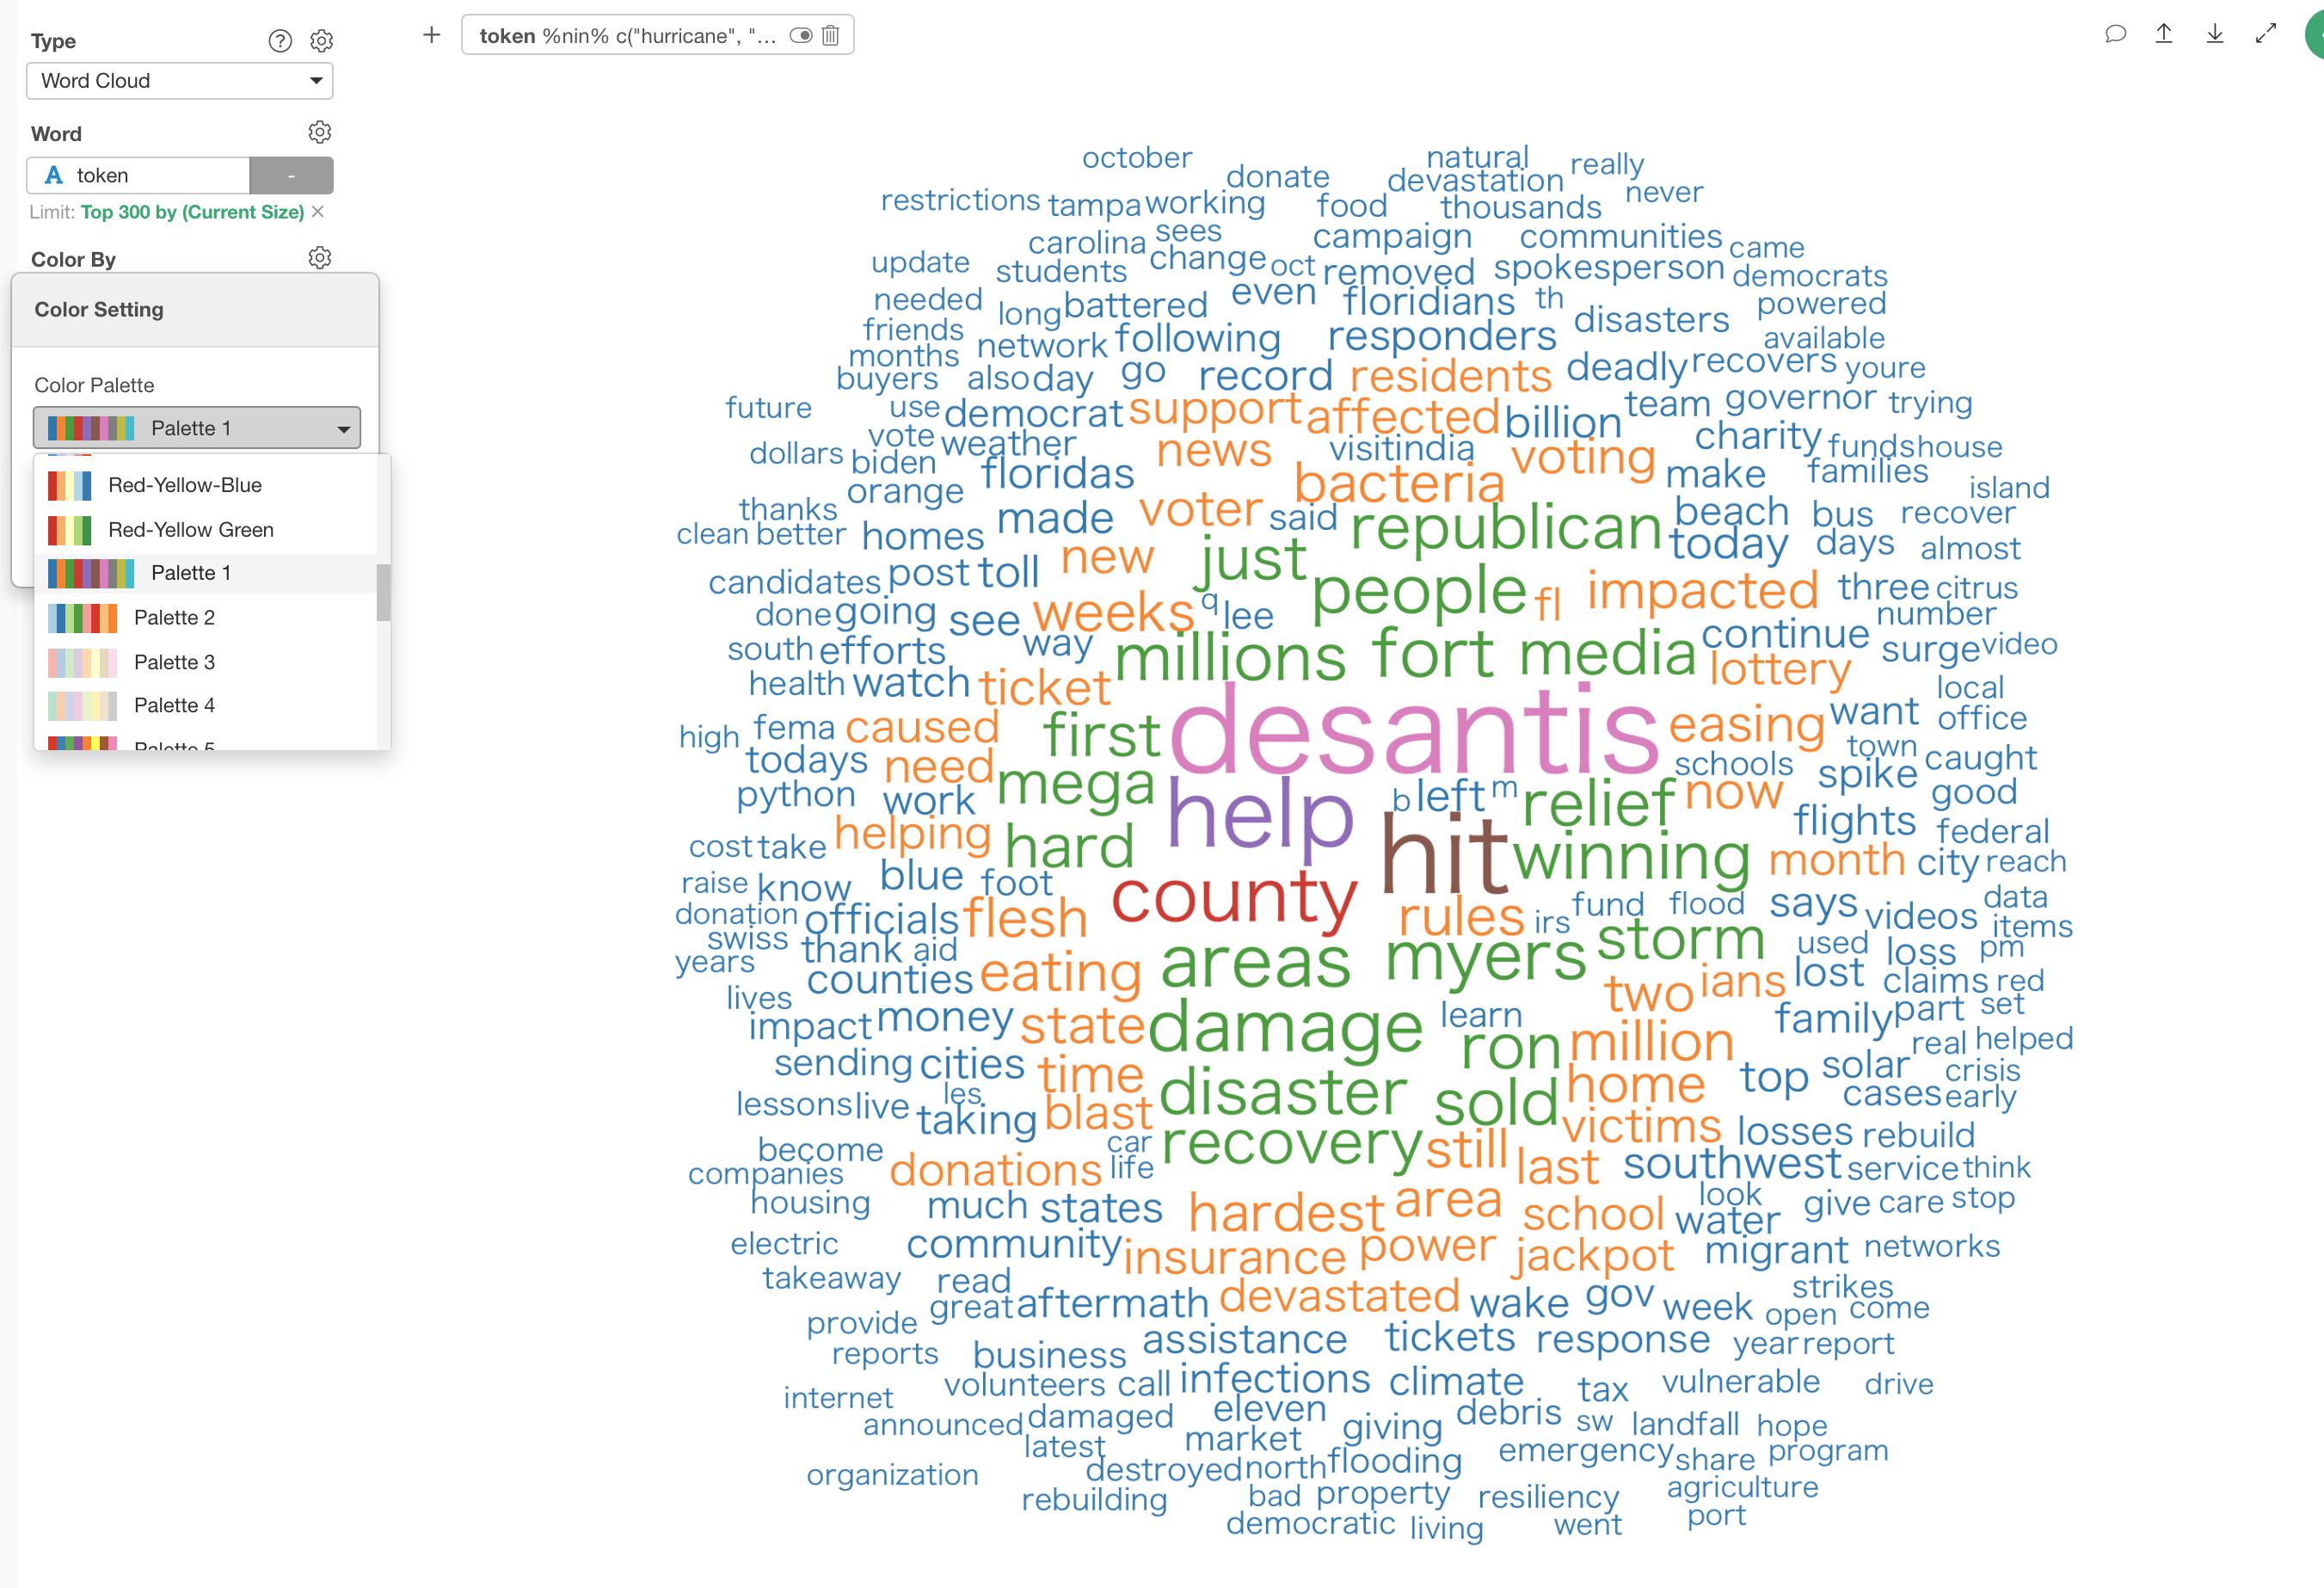
Try it for yourself!
If you want to quickly try it out and you don’t have an Exploratory account yet, sign up from our website for 30 days free trial without a credit card!
If you happen to be a current student or teacher at schools, it’s free! Sign up for Community Plan.
And, if you don’t mind sharing what you create publicly you can sign up for Public edition of Exploratory (FREE)!