Introduction to writing a Mermaid.js Flow Diagram
In this note, we will introduce how to create Flow Diagrams that can be used in Exploratory notes and dashboards.
What is a Flow Diagram?
A Flow Diagram is a diagram that visually represents a sequence of processes or decision-making steps.
By drawing complex flows—such as business processes, data processing procedures, or analytical workflows—as diagrams, you can understand the “order” and “branching” at a glance, which can be difficult to convey with text alone.
For example, Flow Diagrams are useful when you want to visually and clearly communicate content such as “what procedures are used for data preprocessing” or “how the customer support flow is designed” on a note or dashboard.
What is Mermaid.js?
Mermaid.js is a JavaScript library that allows you to create diagrams using text-based notation. You can draw beautiful Flow Diagrams simply by writing simple syntax, much like writing a program.
Since you can manage diagrams with code without using image editing tools, updating and reusing content is easy.
Exploratory supports Mermaid.js, allowing you to directly embed Flow Diagrams as content into notes and dashboards.
Please refer to the following official documentation for more details on the syntax.
How to Use in Exploratory
To create a Flow Diagram in Exploratory, select “Flow Diagram” from the add content button in a note or dashboard.
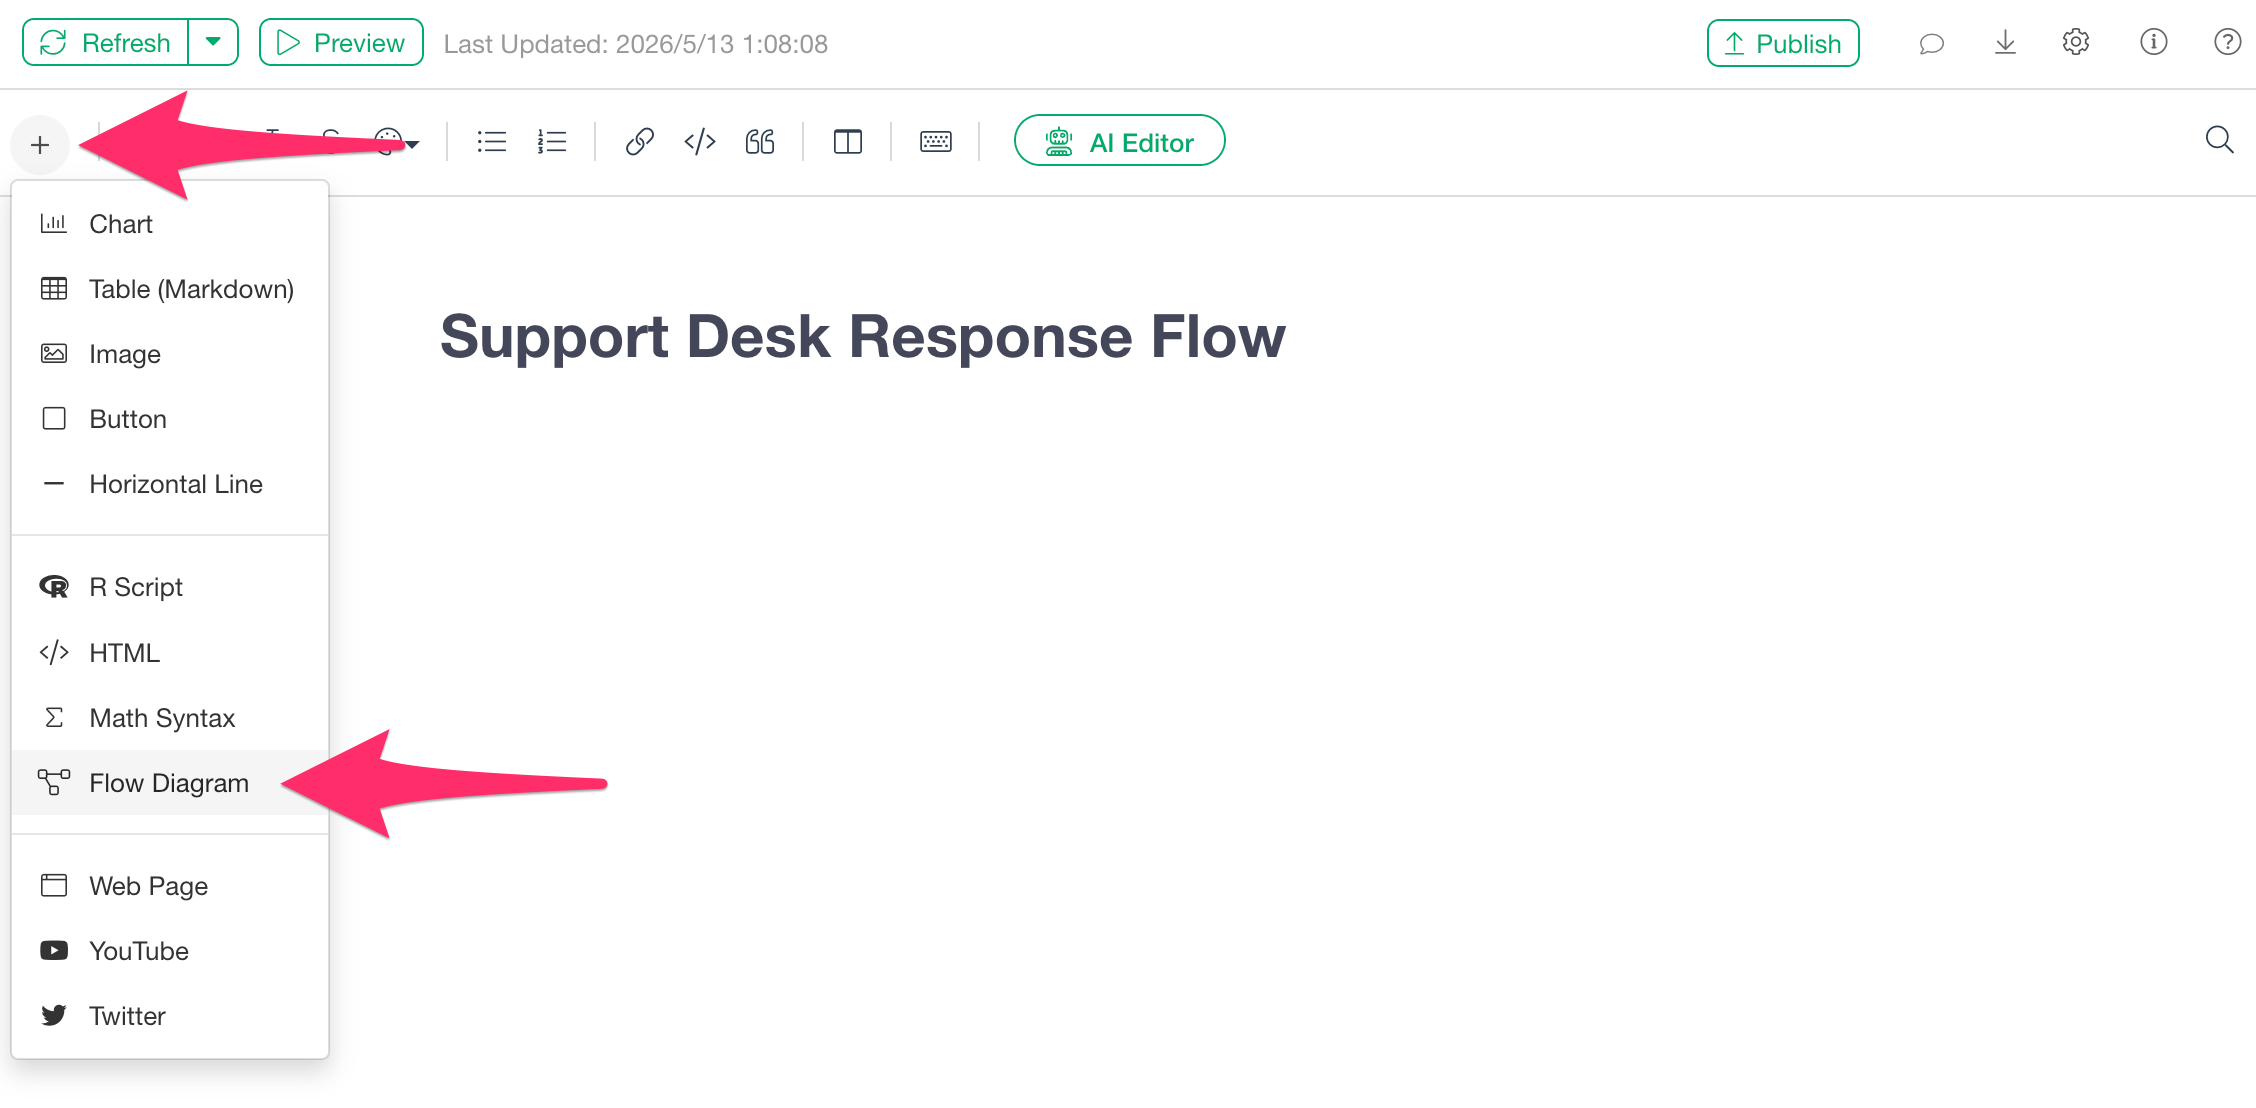
Then, the Mermaid.js code editor will be added to the report.
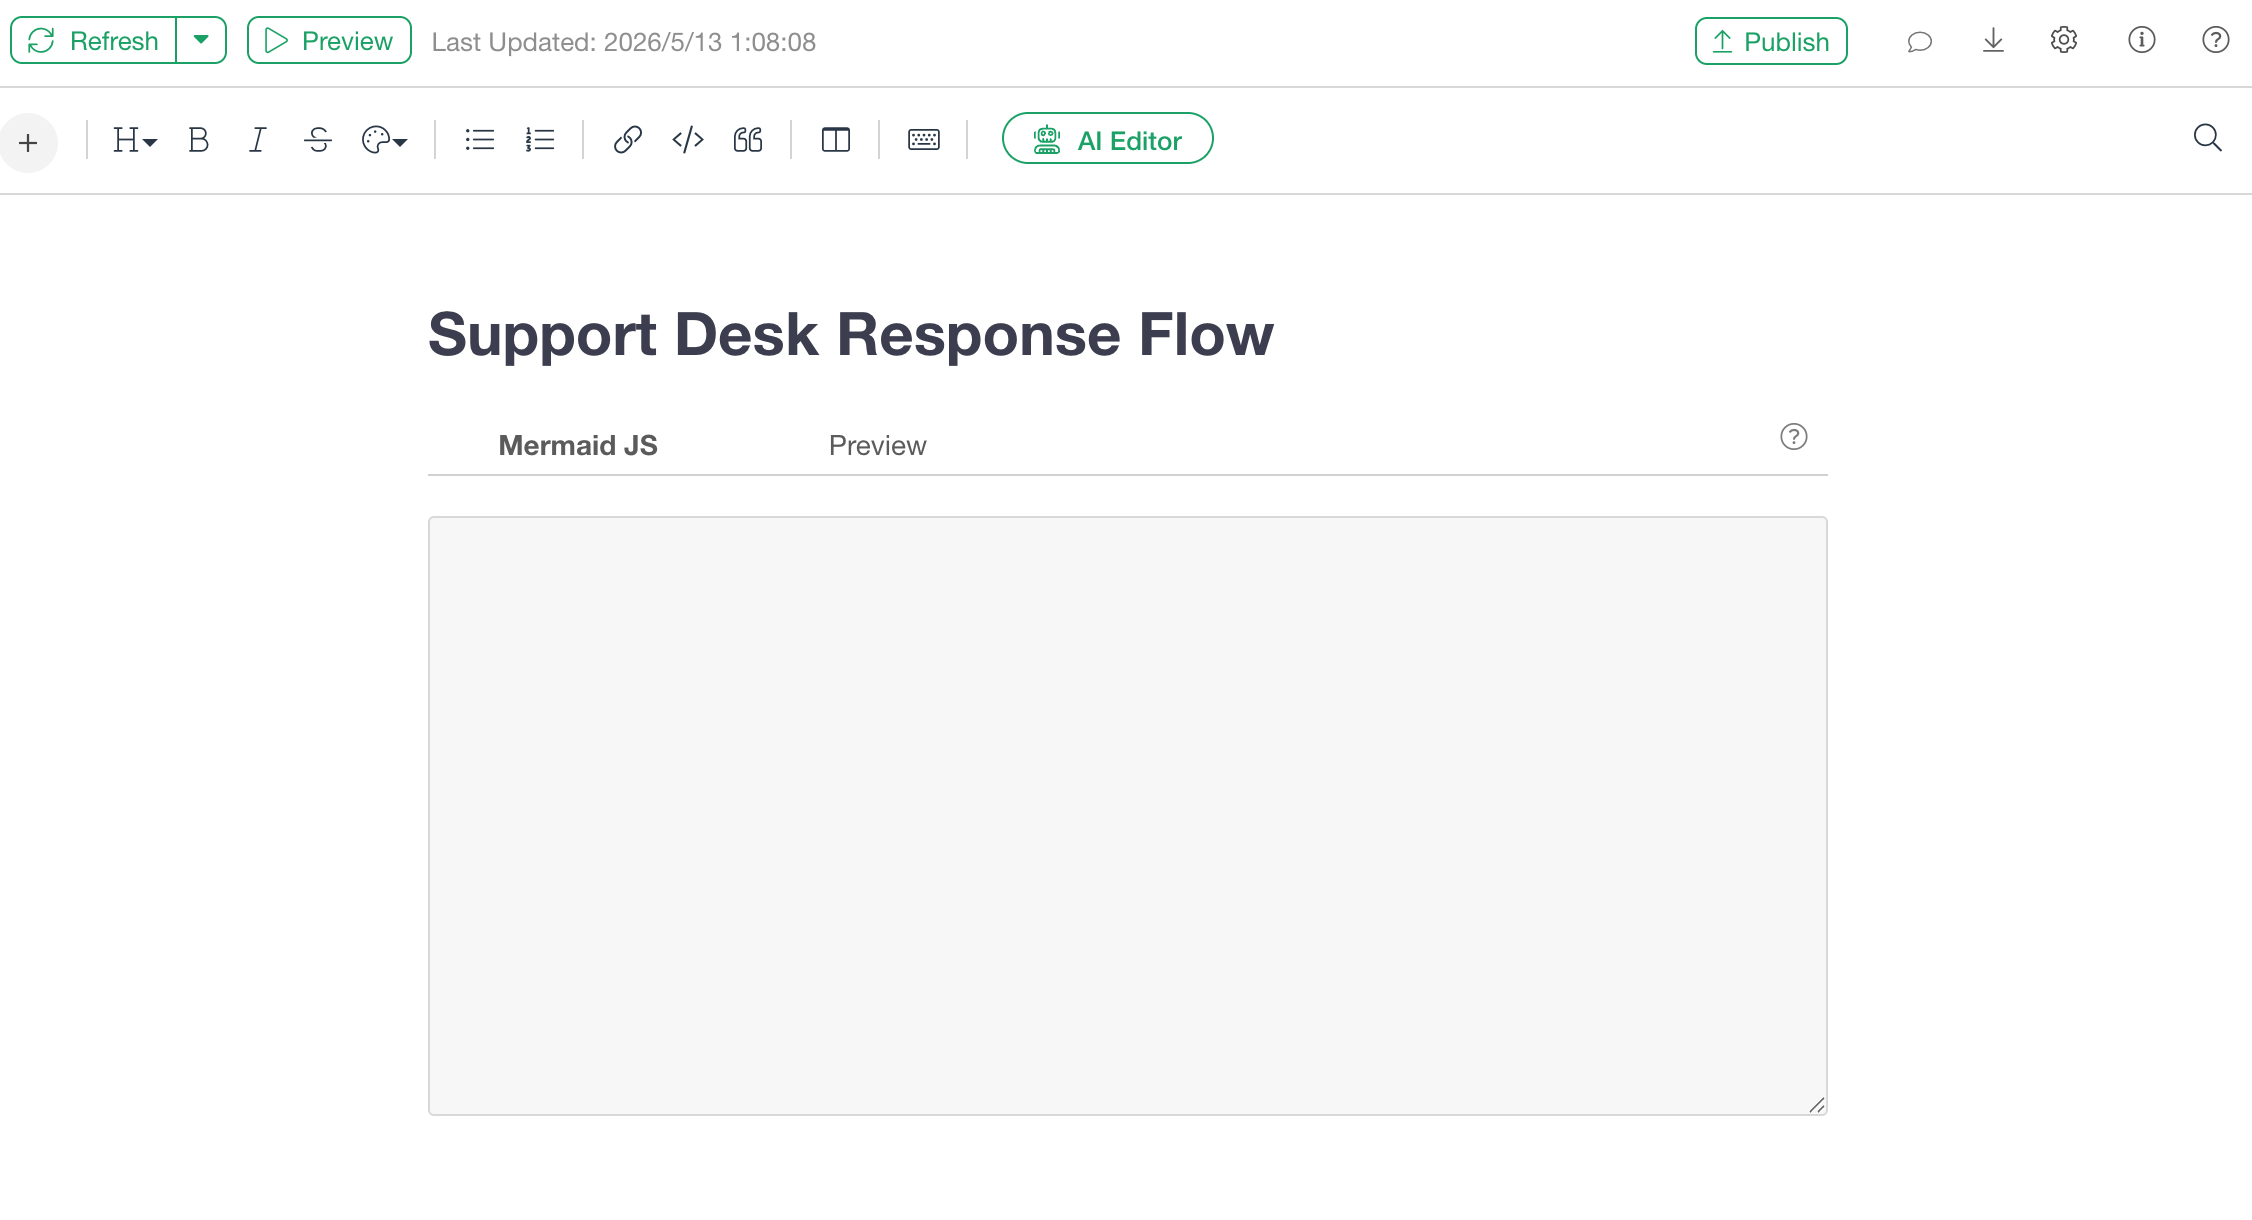
Once you have entered the Mermaid.js code into the editor, click the “Preview” button.
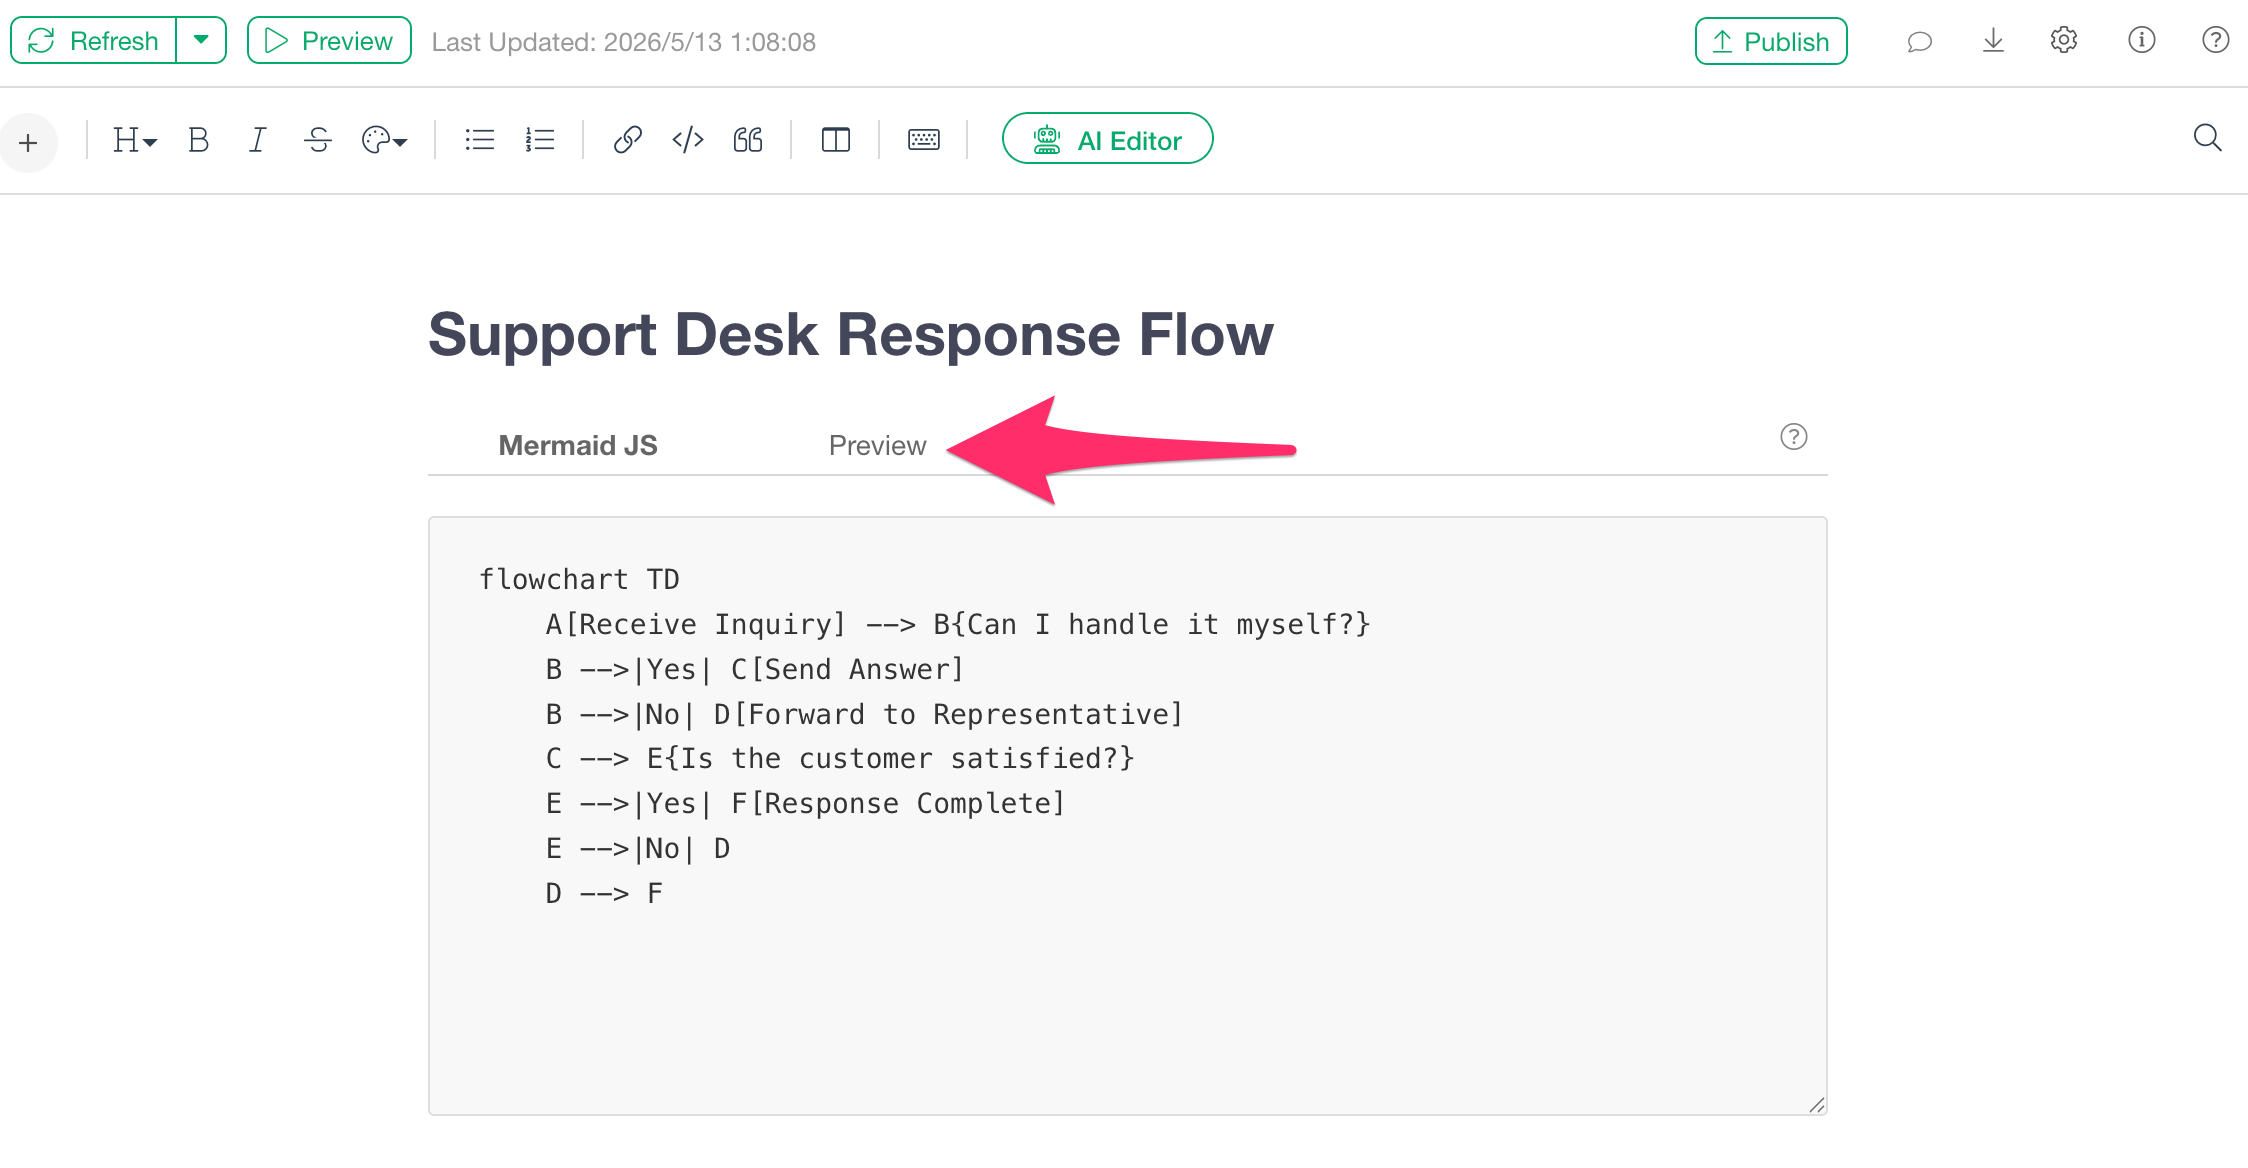
The Flow Diagram will be rendered based on the code you entered.
How to Write Mermaid.js
Basic Syntax
A Mermaid.js Flow Diagram starts with the flowchart
keyword and a direction specification. Directions can be specified
asTD(Top to Down) orLR (Left to Right), among
others.
flowchart TD
    A[Start] --> B[Execute Process]
    B --> C[End]
The individual elements (boxes) that make up the diagram are called
“nodes.” Nodes are defined in the format ID[Label], and
--> represents an arrow (connection).
Note that the ID is a name like A or B in
the example above, used to identify the node within the code, while the
label is the actual text displayed on the diagram.
Node Shapes
The shape of a node can be changed by the symbols surrounding the label.
[ ] represents a rectangle, ( ) represents
a rounded rectangle, { } represents a diamond (decision),
and (( )) represents a circle. In business flows, it is
common to use rectangles for processing steps and diamonds for
conditional branching.
Types of Arrows
There are two types of arrows: solid lines (-->) and
dotted lines (-.->). Additionally, you can explicitly
state the meaning of a branch or flow by adding a label to the arrow in
the format -->|Label|.
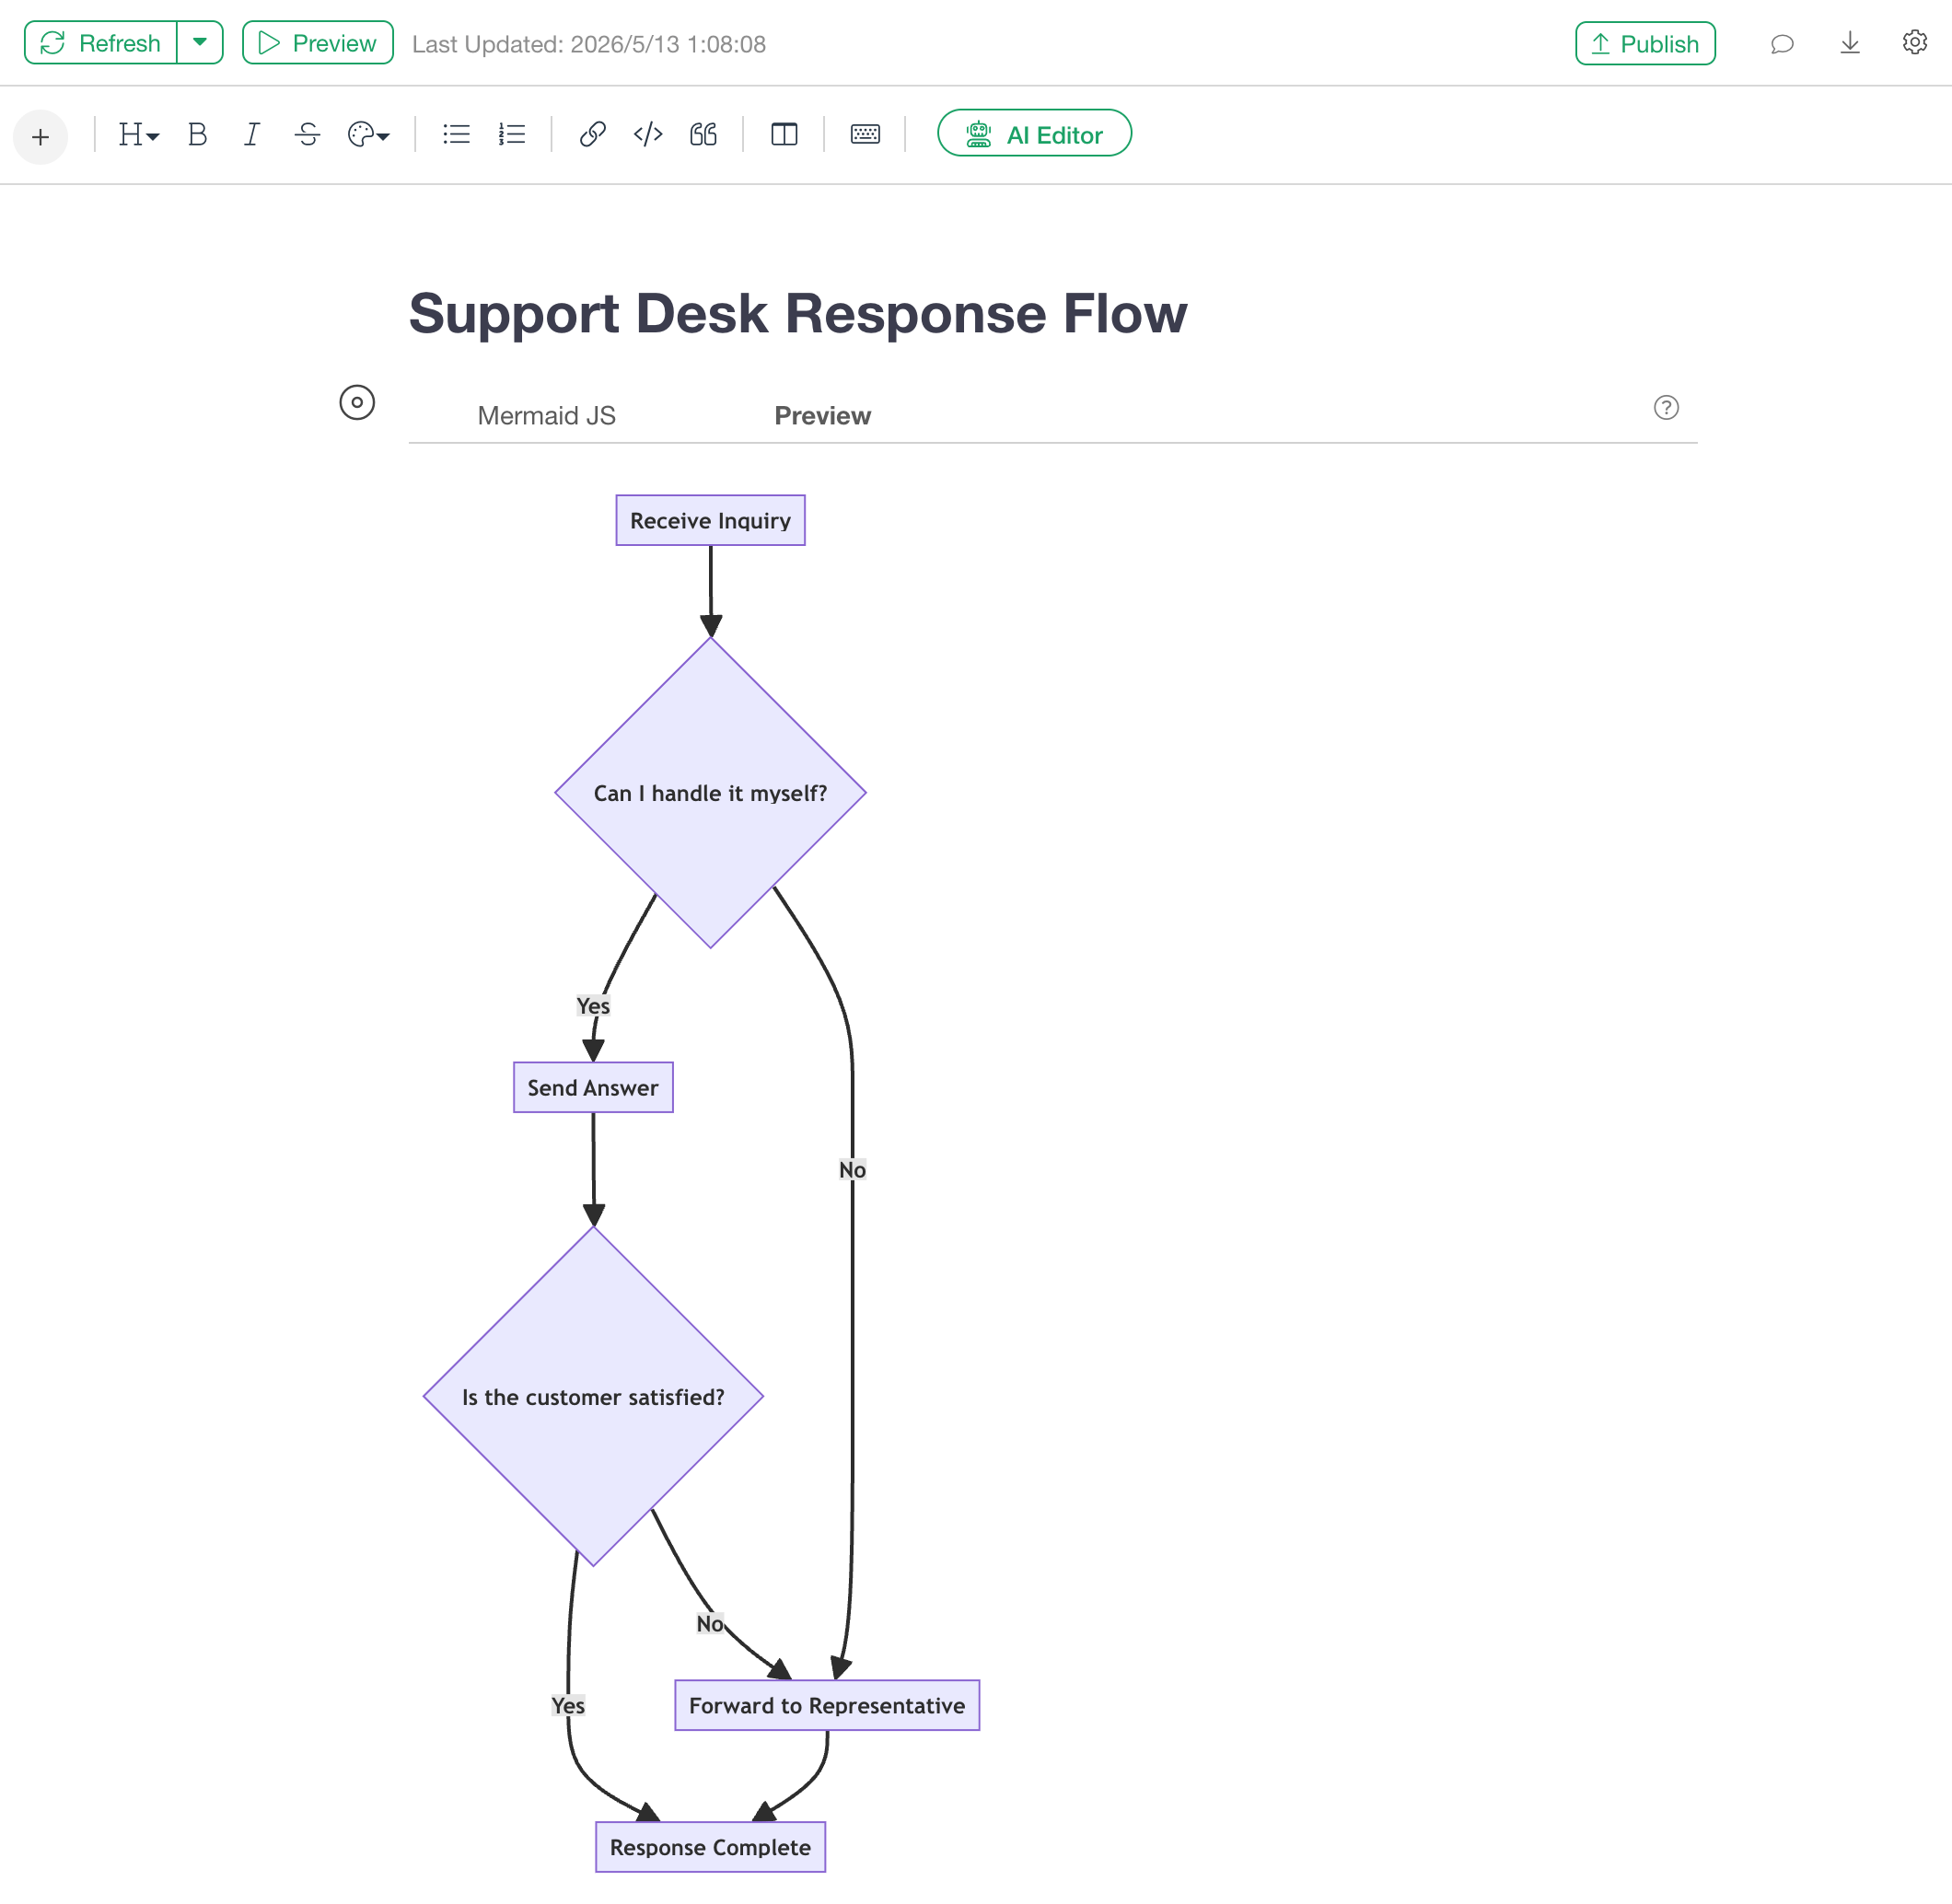
Example: Support Desk Response Flow
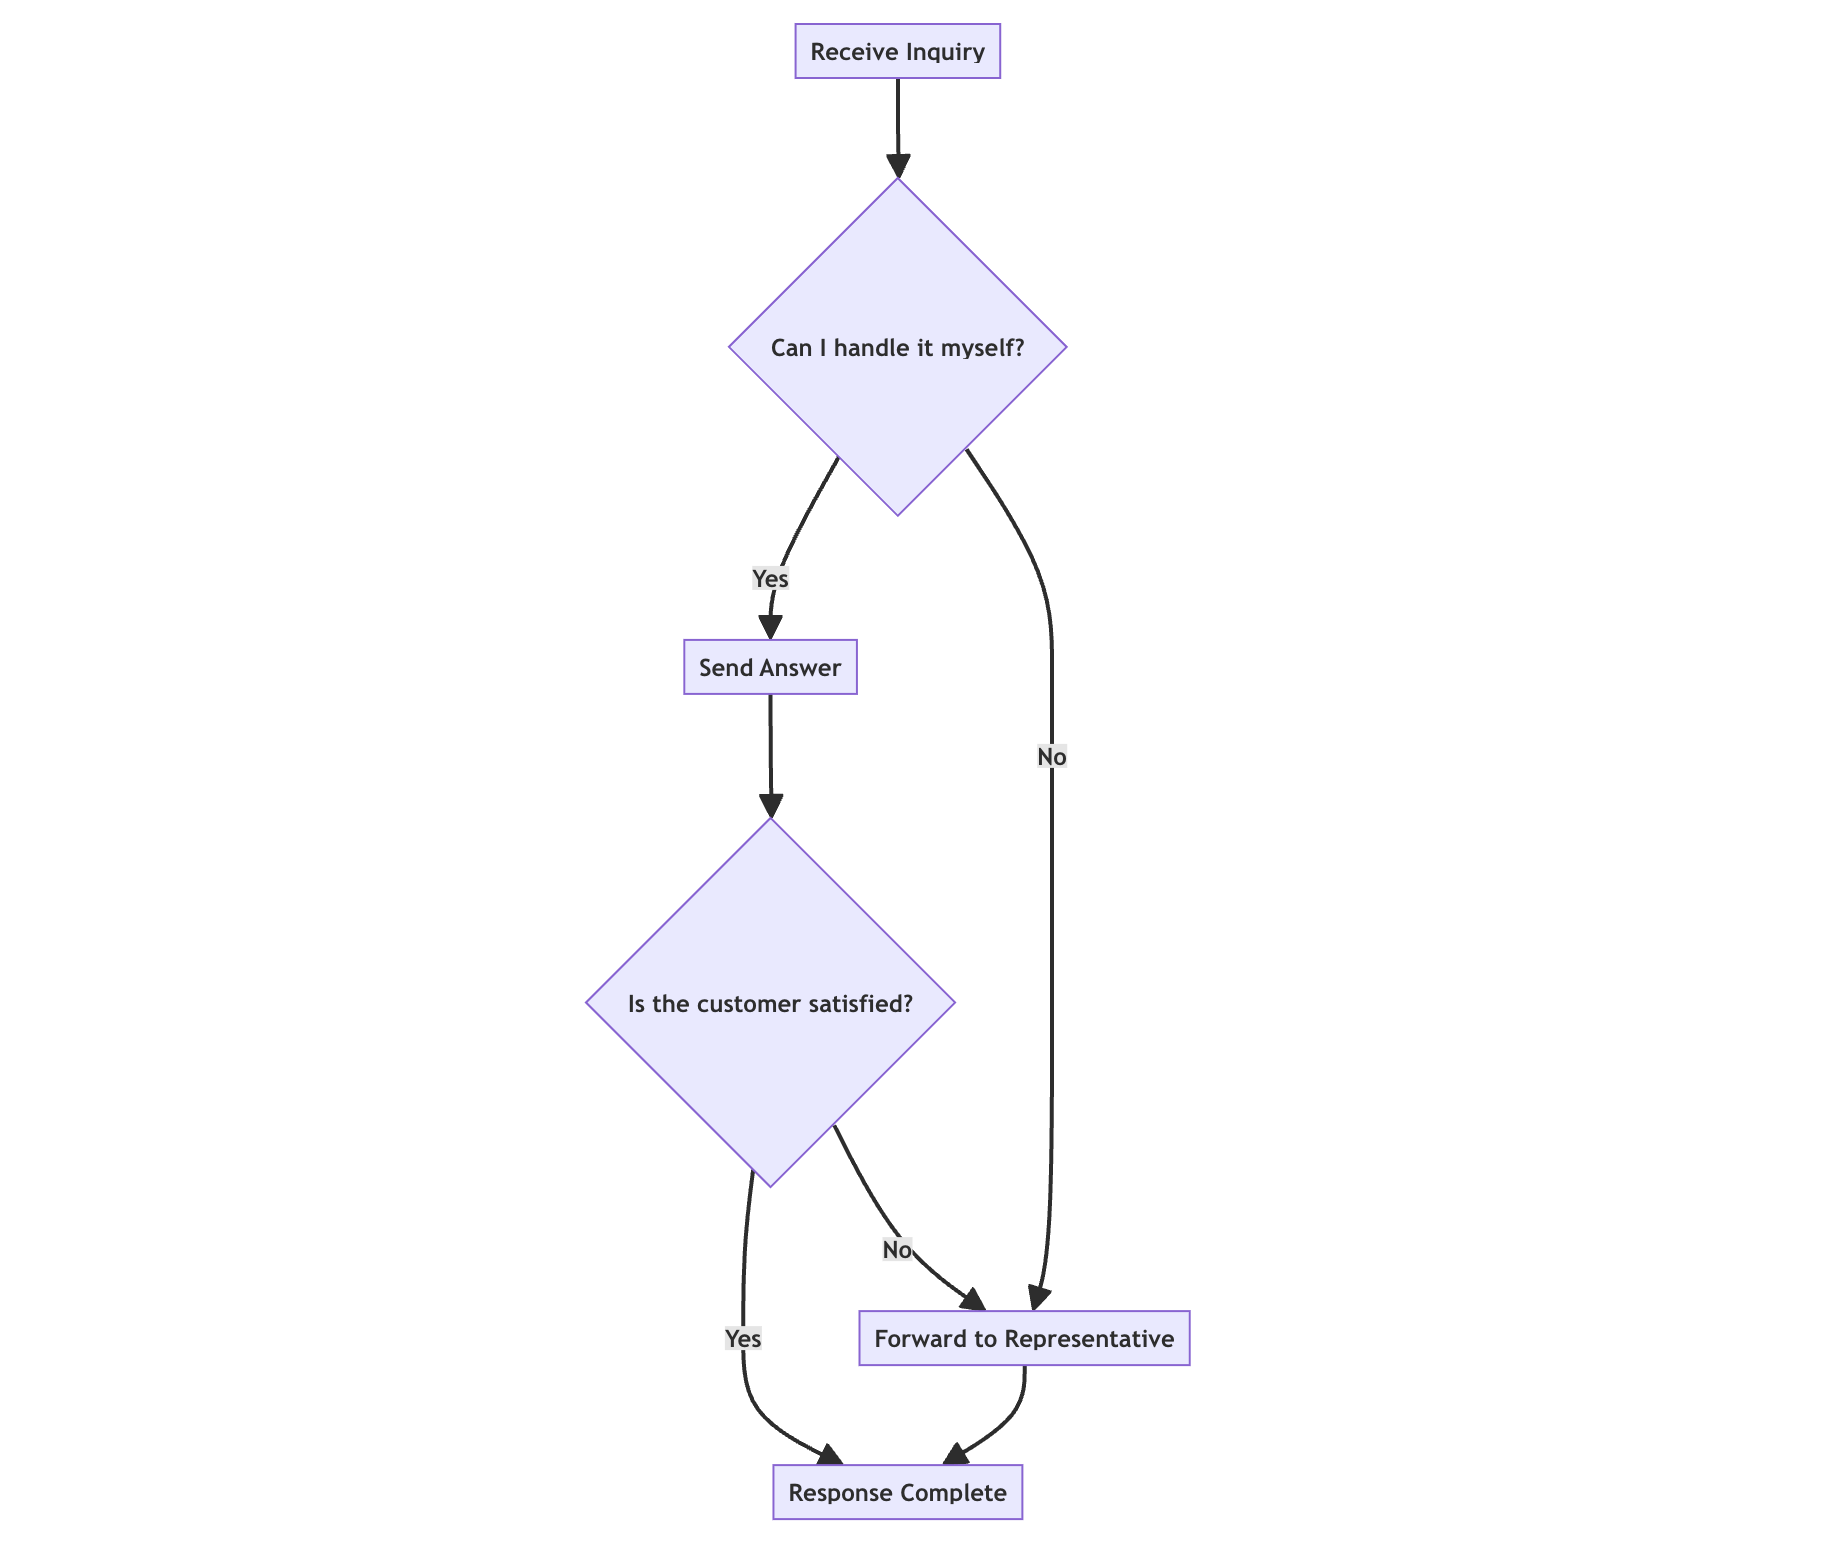
Below is an example of a simple Flow Diagram representing the flow from receiving an inquiry at a support desk to completing the response.
flowchart TD
    A[Receive Inquiry] --> B{Can I handle it myself?}
    B -->|Yes| C[Send Answer]
    B -->|No| D[Forward to Representative]
    C --> E{Is the customer satisfied?}
    E -->|Yes| F[Response Complete]
    E -->|No| D
    D --> F
When you run the script above, you get the following result.
Nodes enclosed in { } are rendered as diamonds,
representing decision points.
By adding labels to arrows in the format |Yes| or
|No|, you can show conditional branching, and by returning
an arrow to a previous node like E --> D, you can also
represent loops.
More Detailed Settings
Node Style Settings
Using style, you can individually set the background
color, border color, and text color of specific nodes. The format is as
follows:
style NodeID fill:#BackgroundColor,stroke:#BorderColor,color:#TextColorColors are specified using hexadecimal color codes (HEX color codes)
like #e3f2fd. This is the same standard as web-standard CSS
color specification, representing the intensity of Red, Green, and Blue
in hexadecimal from 00 to FF in the format #RRGGBB.
By using different colors depending on the type or role of the node, the overall readability of the diagram is greatly improved.
Example: Customer Support Flow with Styles Applied
Below is an example of a support flow that routes inquiries to the appropriate team based on the category, expressed with style settings.
flowchart TD
    A["Customer Inquiry"] --> B{"Classify Category"}
    B -->|Technical Issue| C["Technical Support Team"]
    B -->|Billing/Payment| D["Accounting Team"]
    B -->|General Question| E["Customer Success"]
    C --> F{"Resolved?"}
    D --> G["Process Complete"]
    E --> G
    F -->|Yes| G
    F -->|No| H["Escalation"]
    H --> I["Forward to Senior Support"]
    I --> G

    style A fill:#e3f2fd,stroke:#1976d2,color:#1a1a1a
    style B fill:#fff9c4,stroke:#f57f17,color:#1a1a1a
    style G fill:#e8f5e9,stroke:#2e7d32,color:#1a1a1a
    style H fill:#ffebee,stroke:#c62828,color:#1a1a1a
    style I fill:#ffebee,stroke:#c62828,color:#1a1a1a
When you run the script above, you get the following result.
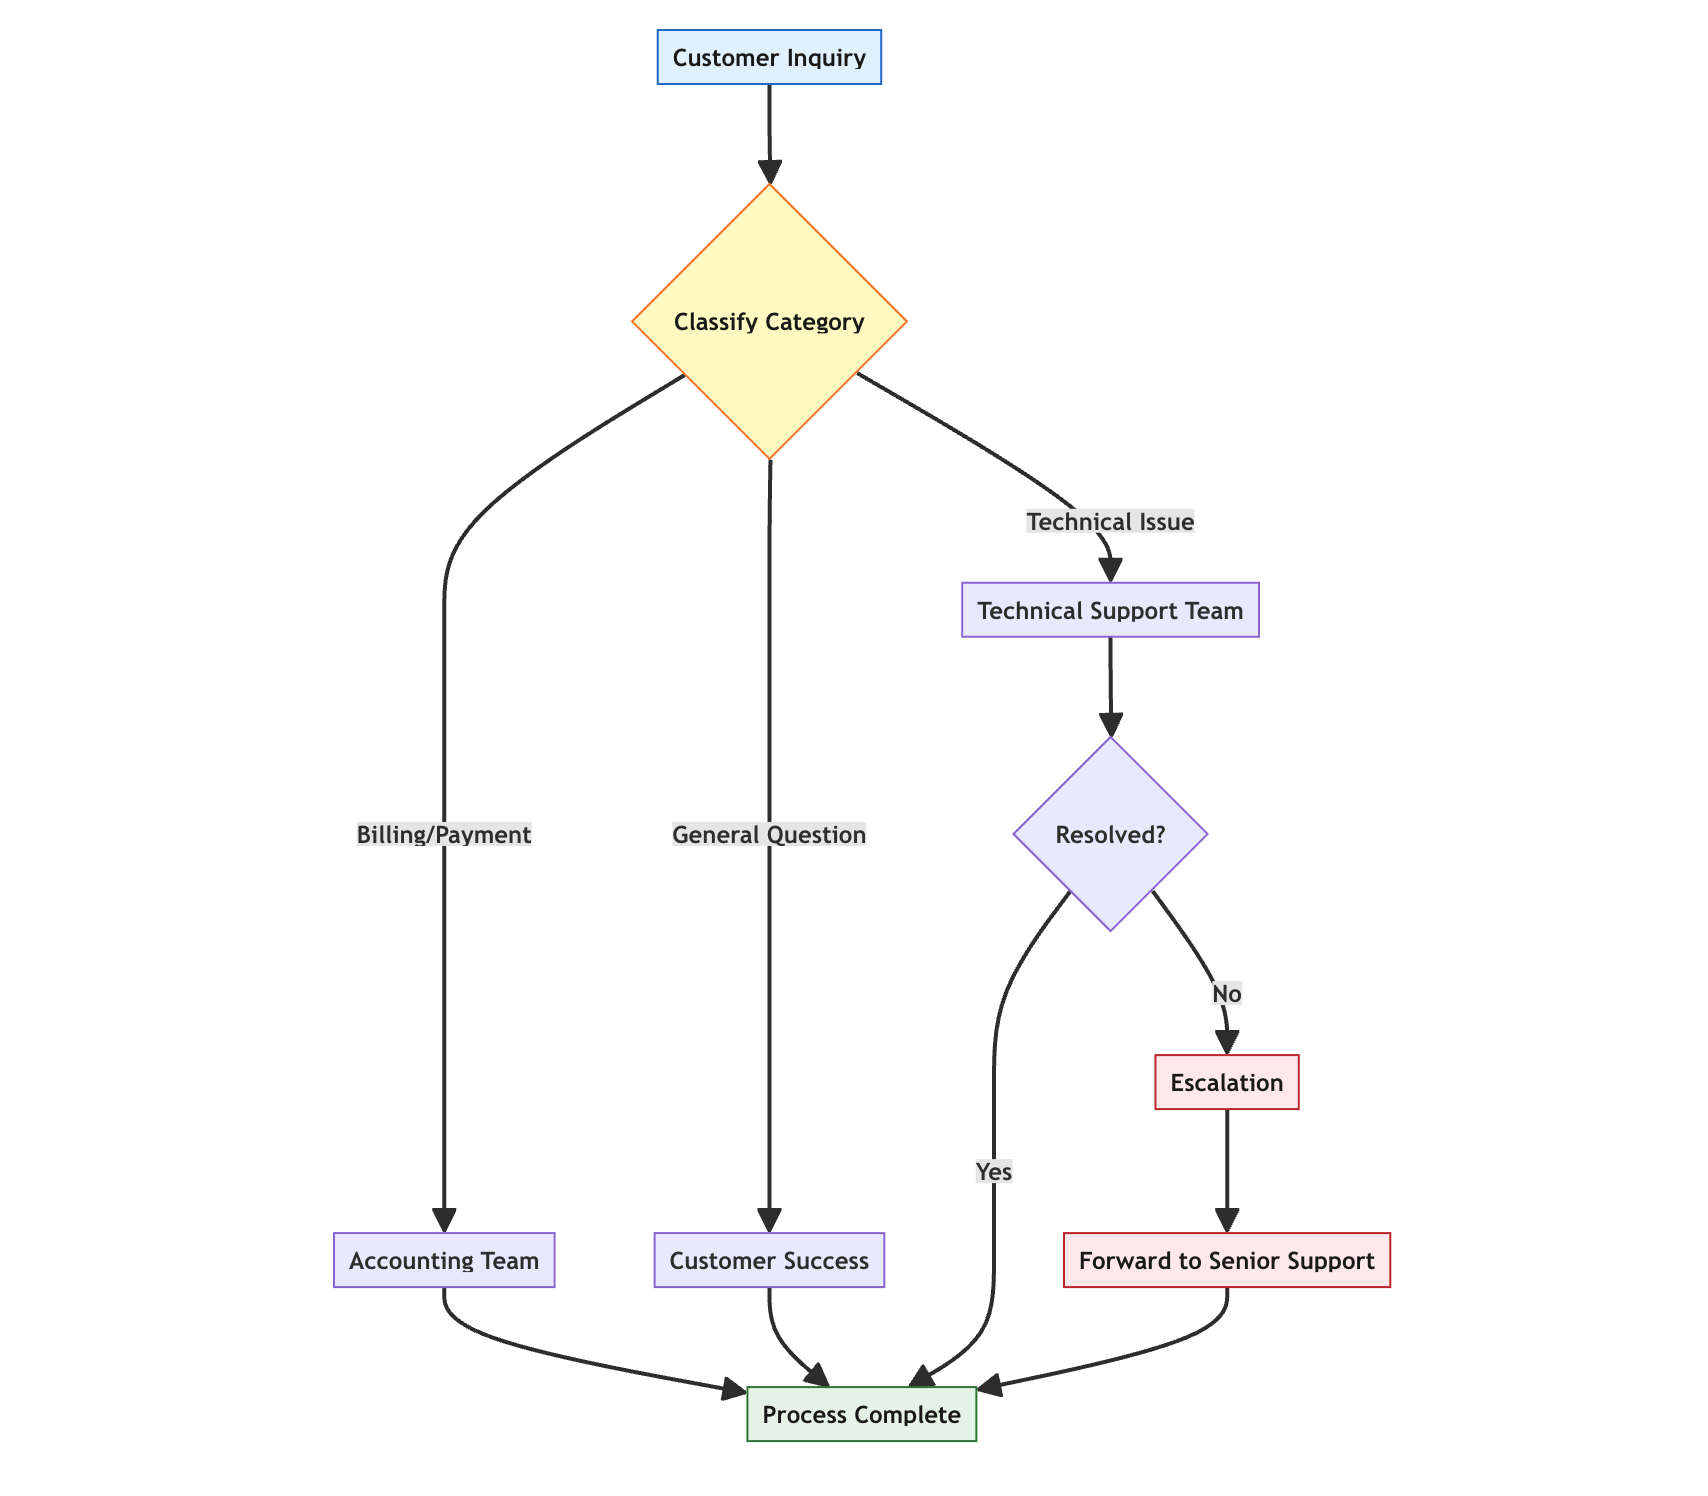
As shown in the example above, style can be written
collectively at the end of the code.
By assigning different colors to the starting node, decision nodes, completion nodes, and escalation nodes, the diagram becomes intuitively understandable.
Node Labels Using HTML
By writing HTML within node labels, you can display more detailed information, such as line breaks, inside the node.
Enclose the label in "..." and use HTML tags such as
<br/>.
flowchart TD
    A["Order Data"] -.-> B["1. Load Data<br/>Load order data from CSV file."]
    B -.-> C["2. Convert to Date Type<br/>Convert Order Date column to Date type."]
    C -.-> D["3. Join with Customer Data<br/>Perform Left Outer Join using Customer ID."]

    style A fill:#fdeee2,stroke:#f7c79d,color:#374151
    style B fill:#ffffff,stroke:#00ab6d,color:#374151
    style C fill:#ffffff,stroke:#00ab6d,color:#374151
    style D fill:#ffffff,stroke:#00ab6d,color:#374151
When you run the script above, you get the following result.
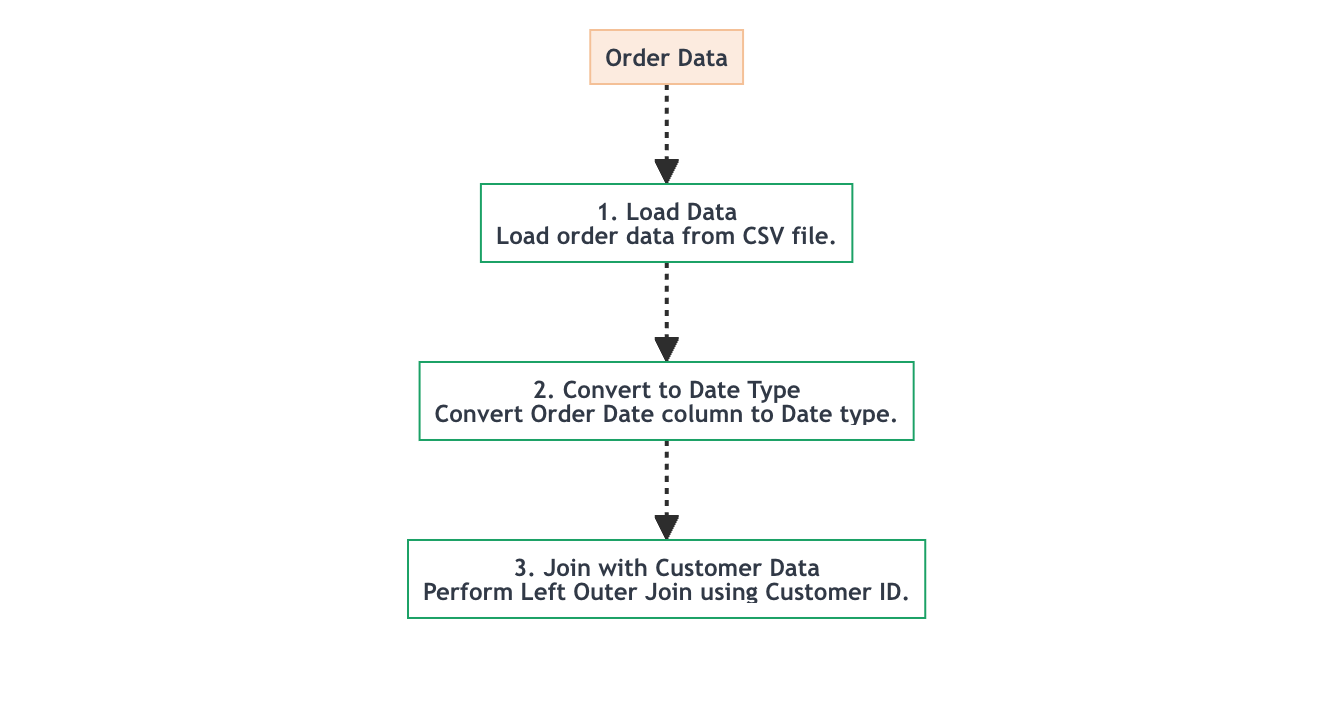
In this example, by using <br/> to break the line
and continue with an explanatory text under the step title, the title
and detailed explanation are combined into a single node.
Additionally, style is used to specify an orange-based
background for Node A and a white background with a green border for
Nodes B–D, distinguishing the data source node from the processing step
nodes by color. Dotted lines (-.->) are used for the
arrows.