Predicting Future Event with Survival Model
Survival analysis models, such as Cox Regression and Survival Forest, created in Analytics View, enable you to predict the risk of future events like employee attrition or customer cancellations.
This note will demonstrate how to predict future cancellation risks, assuming you have already built Cox Regression or Survival Forest models.
How to Predict Future Cancellations
To predict future events for customers who have not yet experienced the event, you need to prepare a separate dataset for prediction. Then, use the “Predict with Model (Analytics View)” feature to run the prediction.
Survival analysis models allow for two types of predictions. This note will cover both:
- Survival Rate After N Months
- Date That Meets Threshold
Data Used
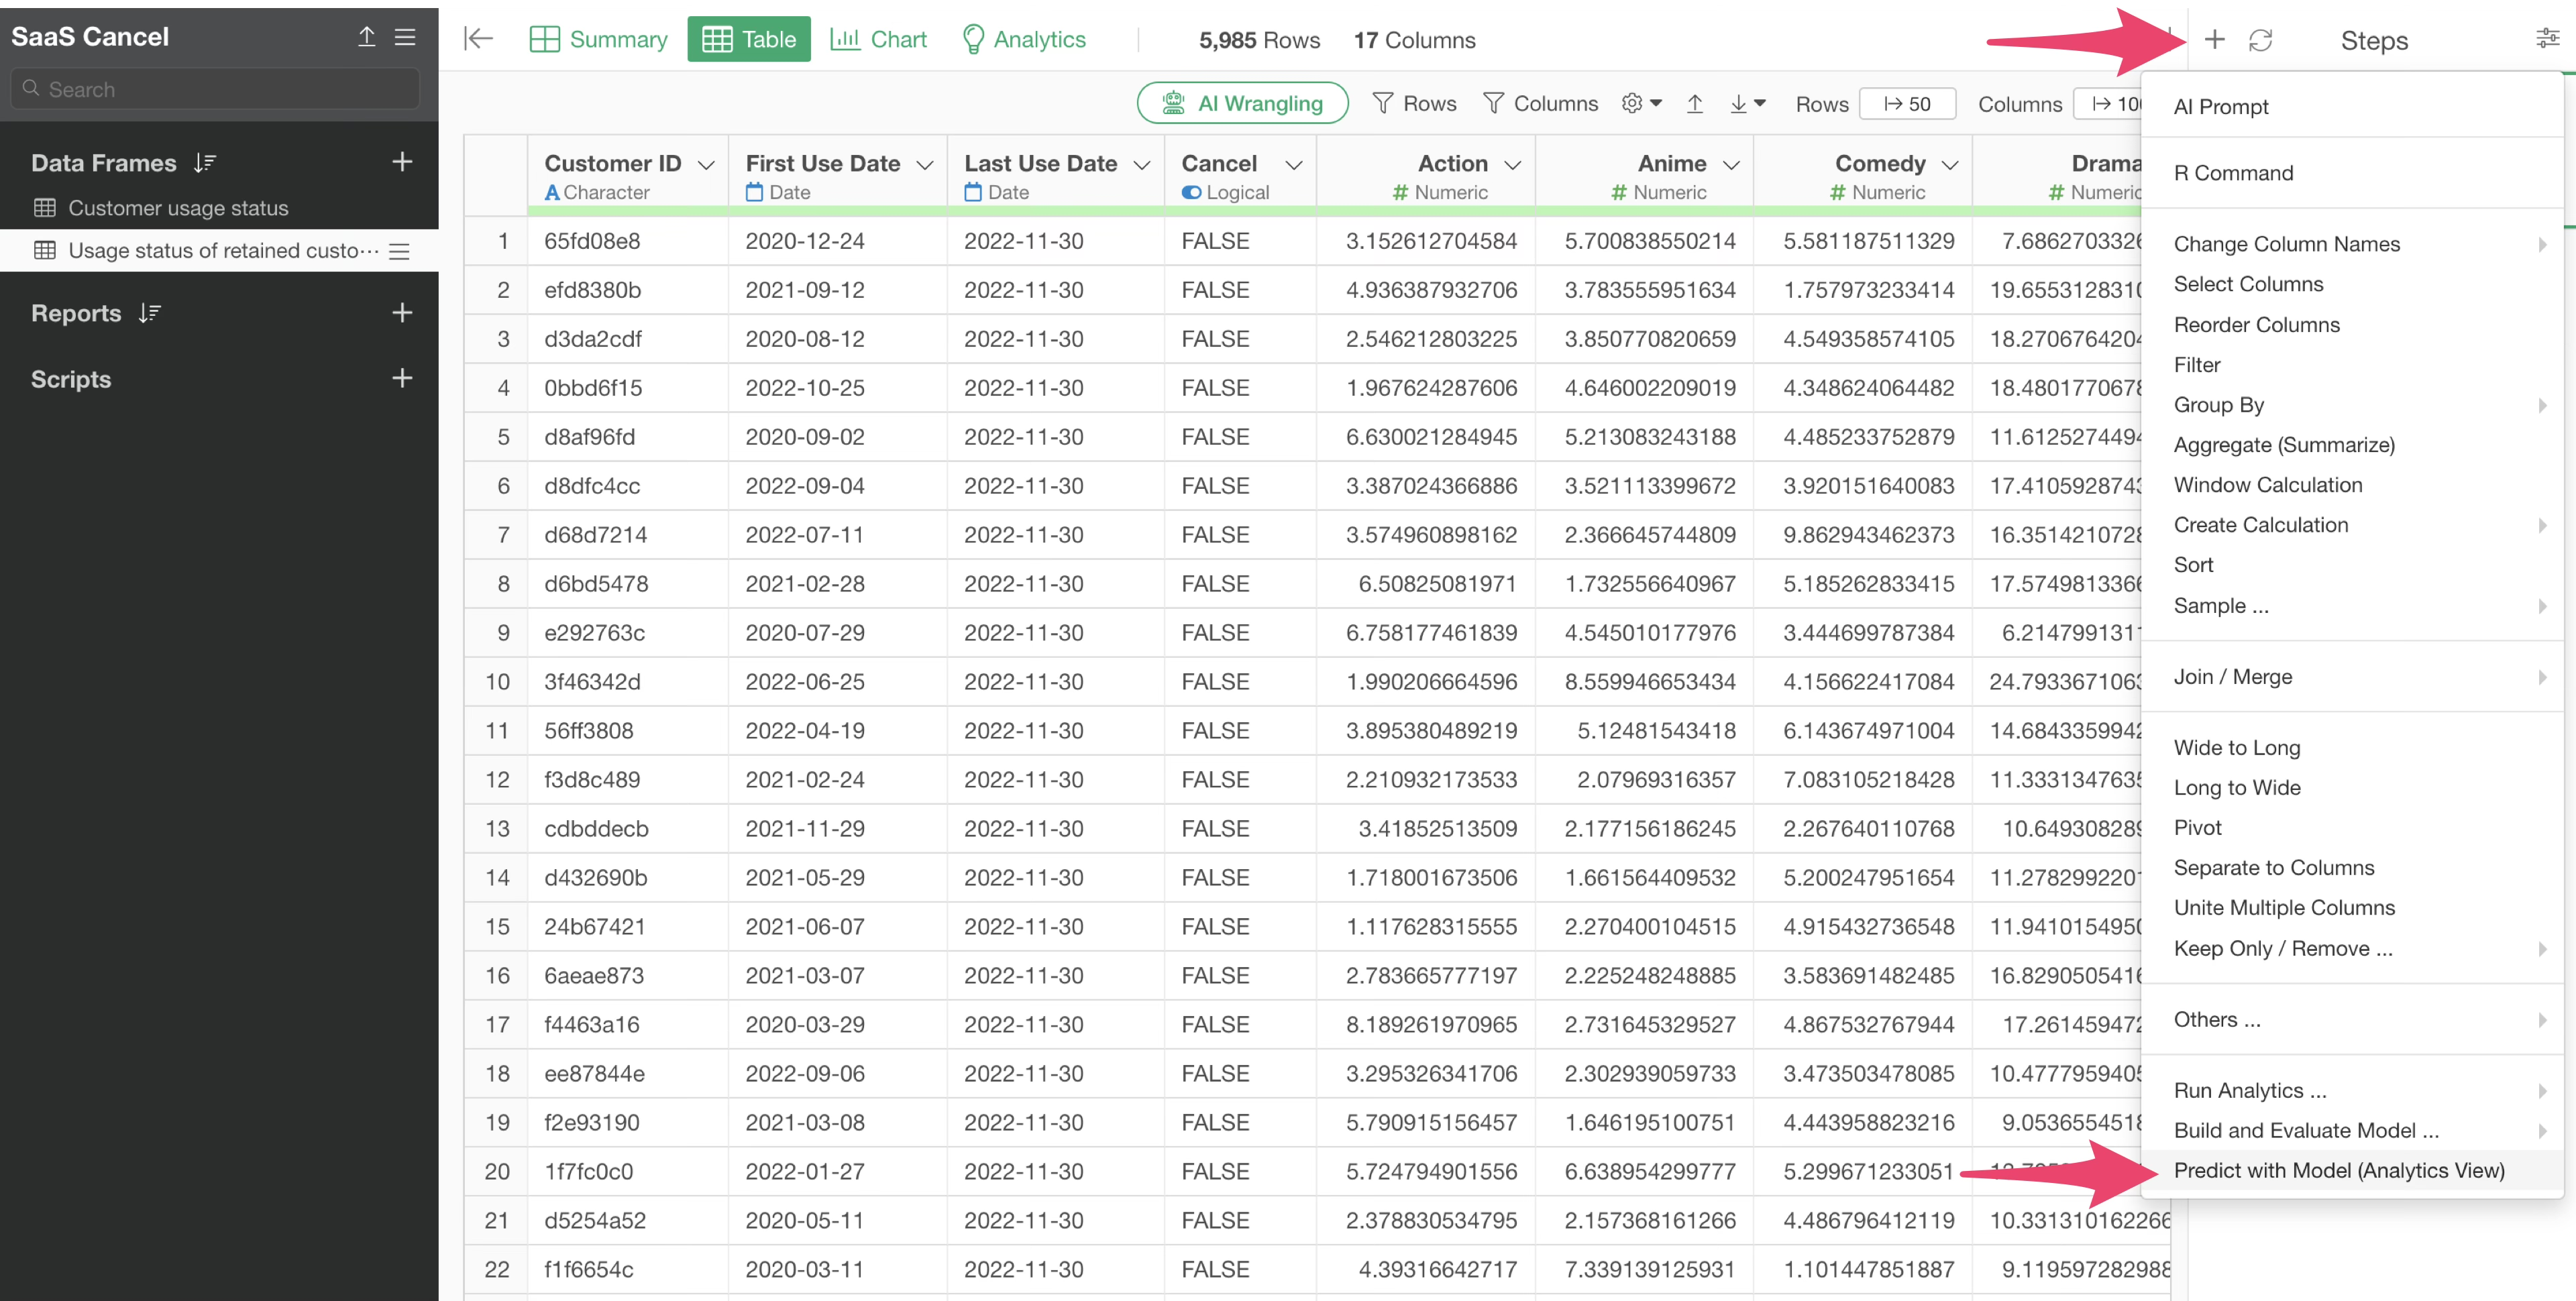
We will use data on the service usage of active Netflix subscribers who have not yet canceled.
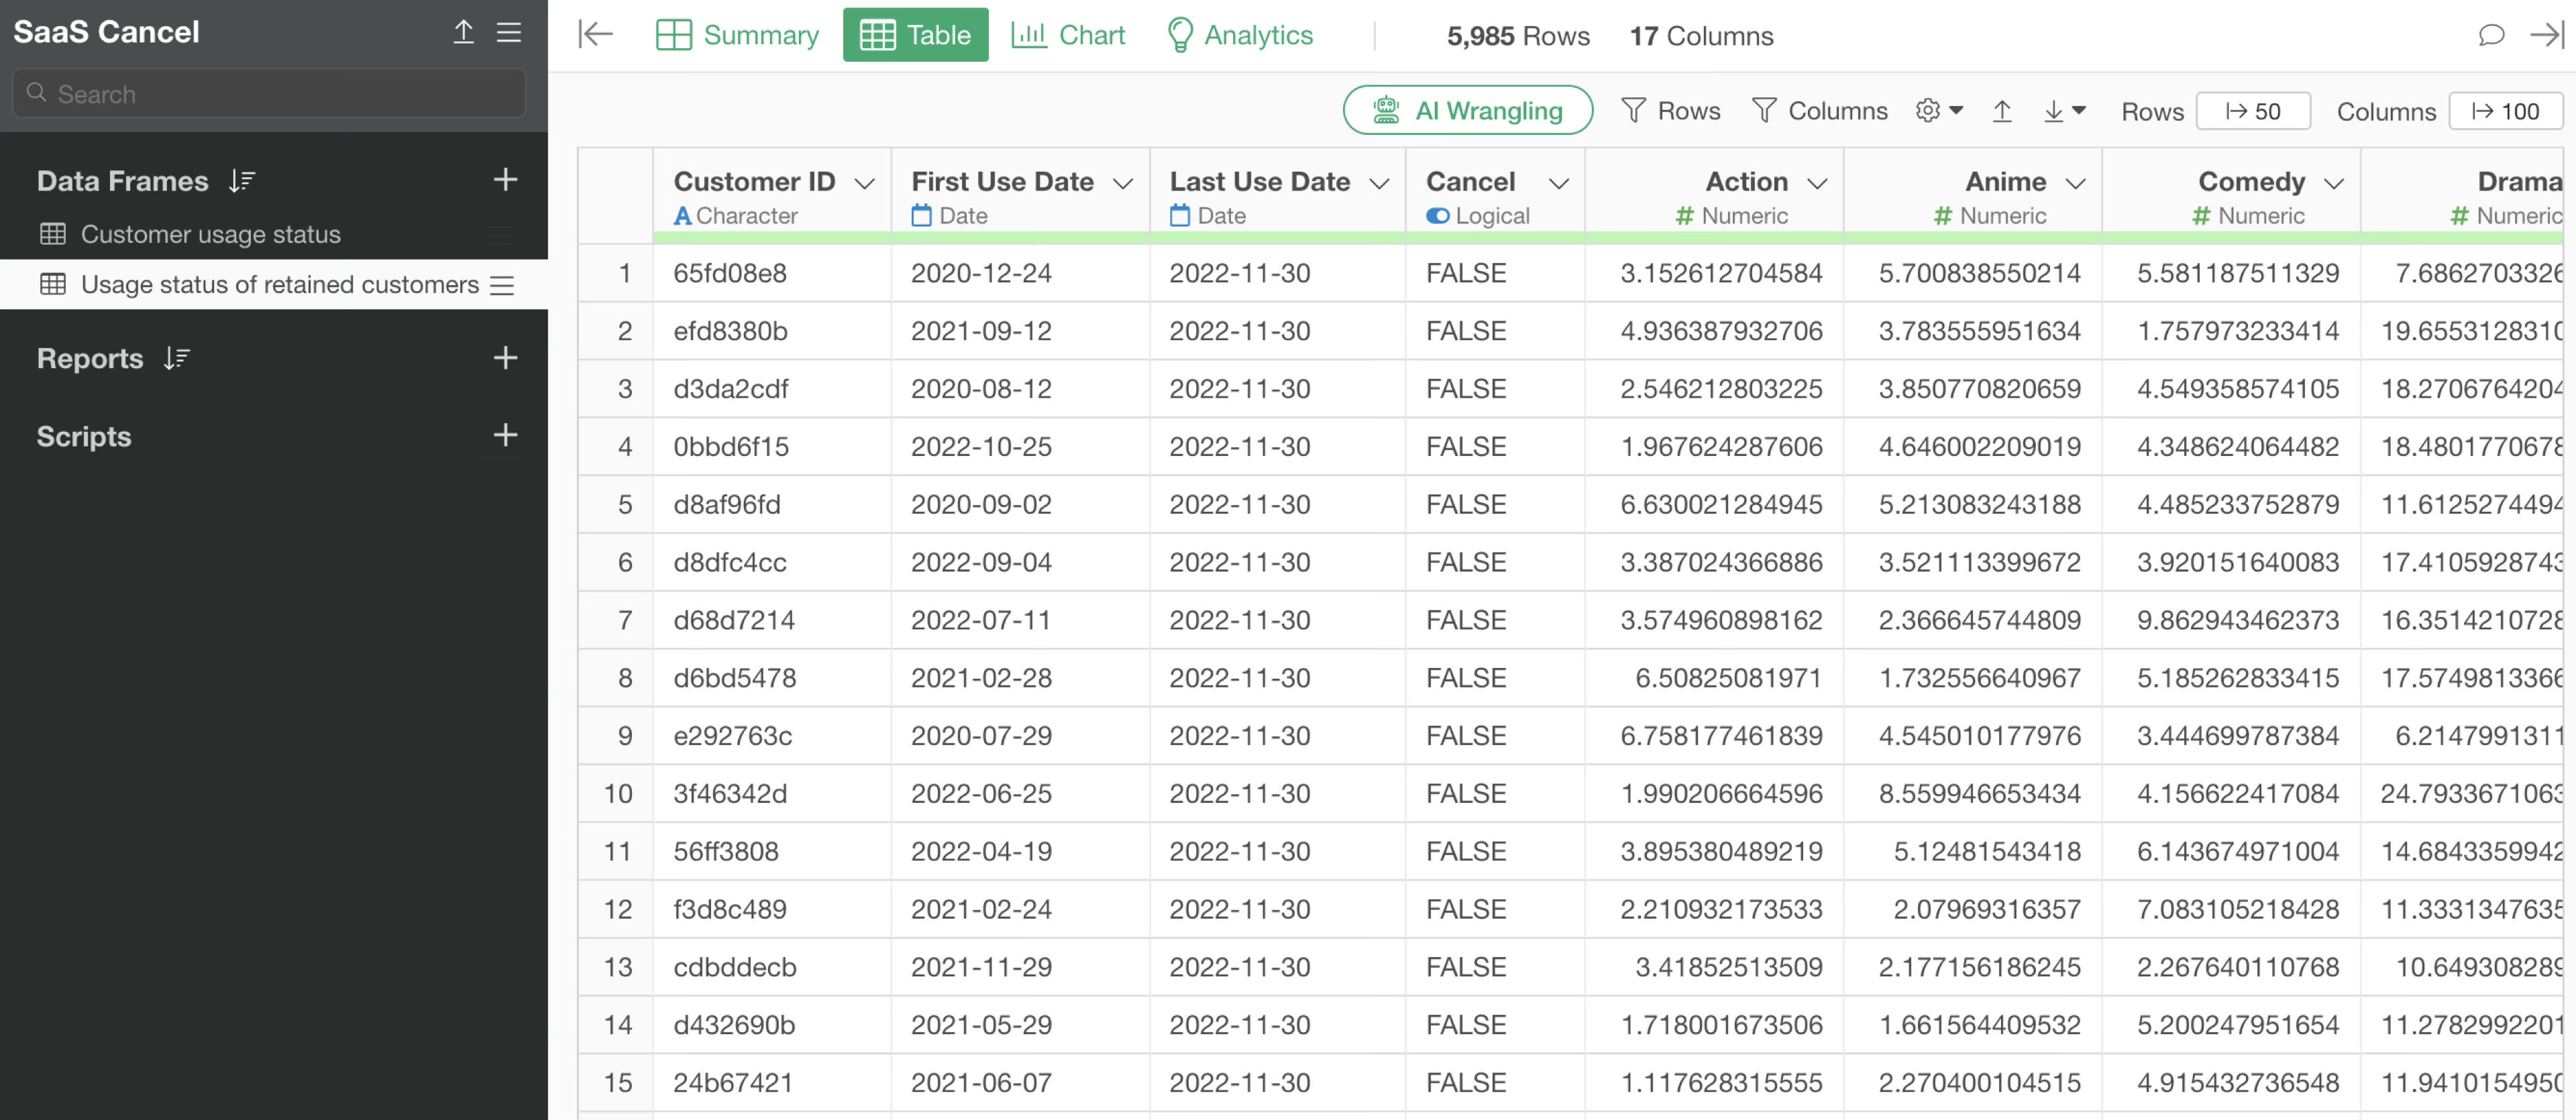
This dataset includes customer ID, First use date, Last use date, content viewing status, and customer cancelations. Since the data is for active subscribers, the Cancel flag is “FALSE” for all customers.
Running “Predict with Model (Analytics View)”
To predict future cancellation risks for active customers, we will use a survival analysis model previously created in a different data frame.
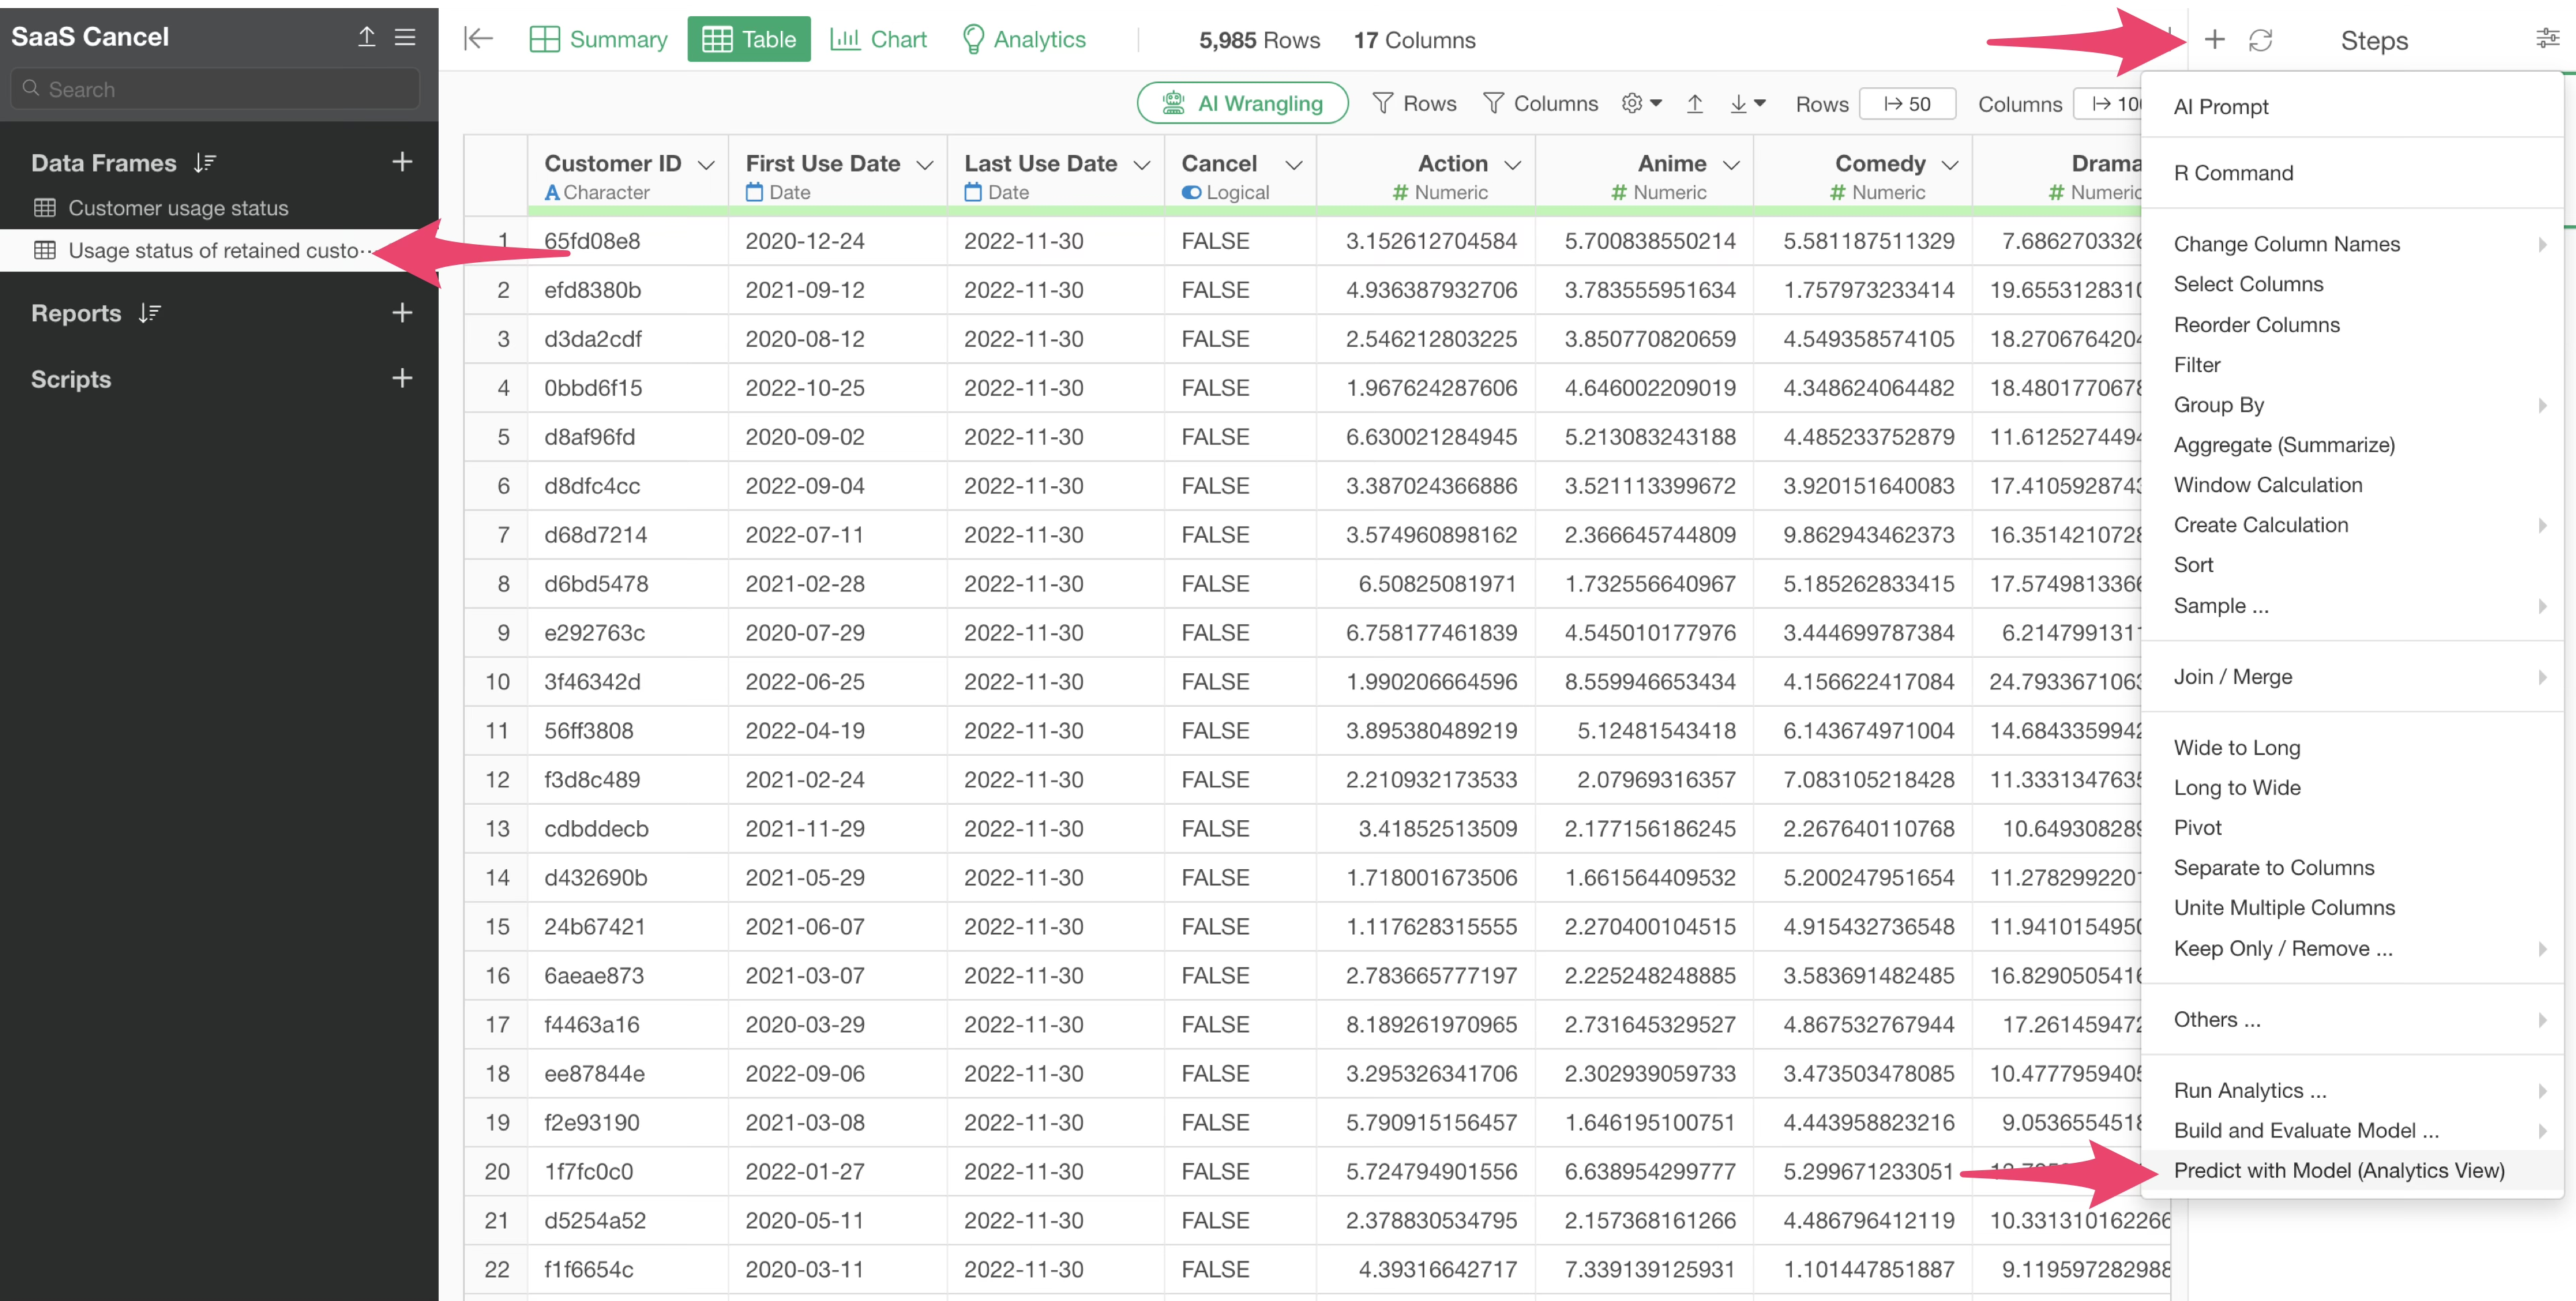
Click the step menu of your target data frame and select “Predict with Model (Analytics View).”
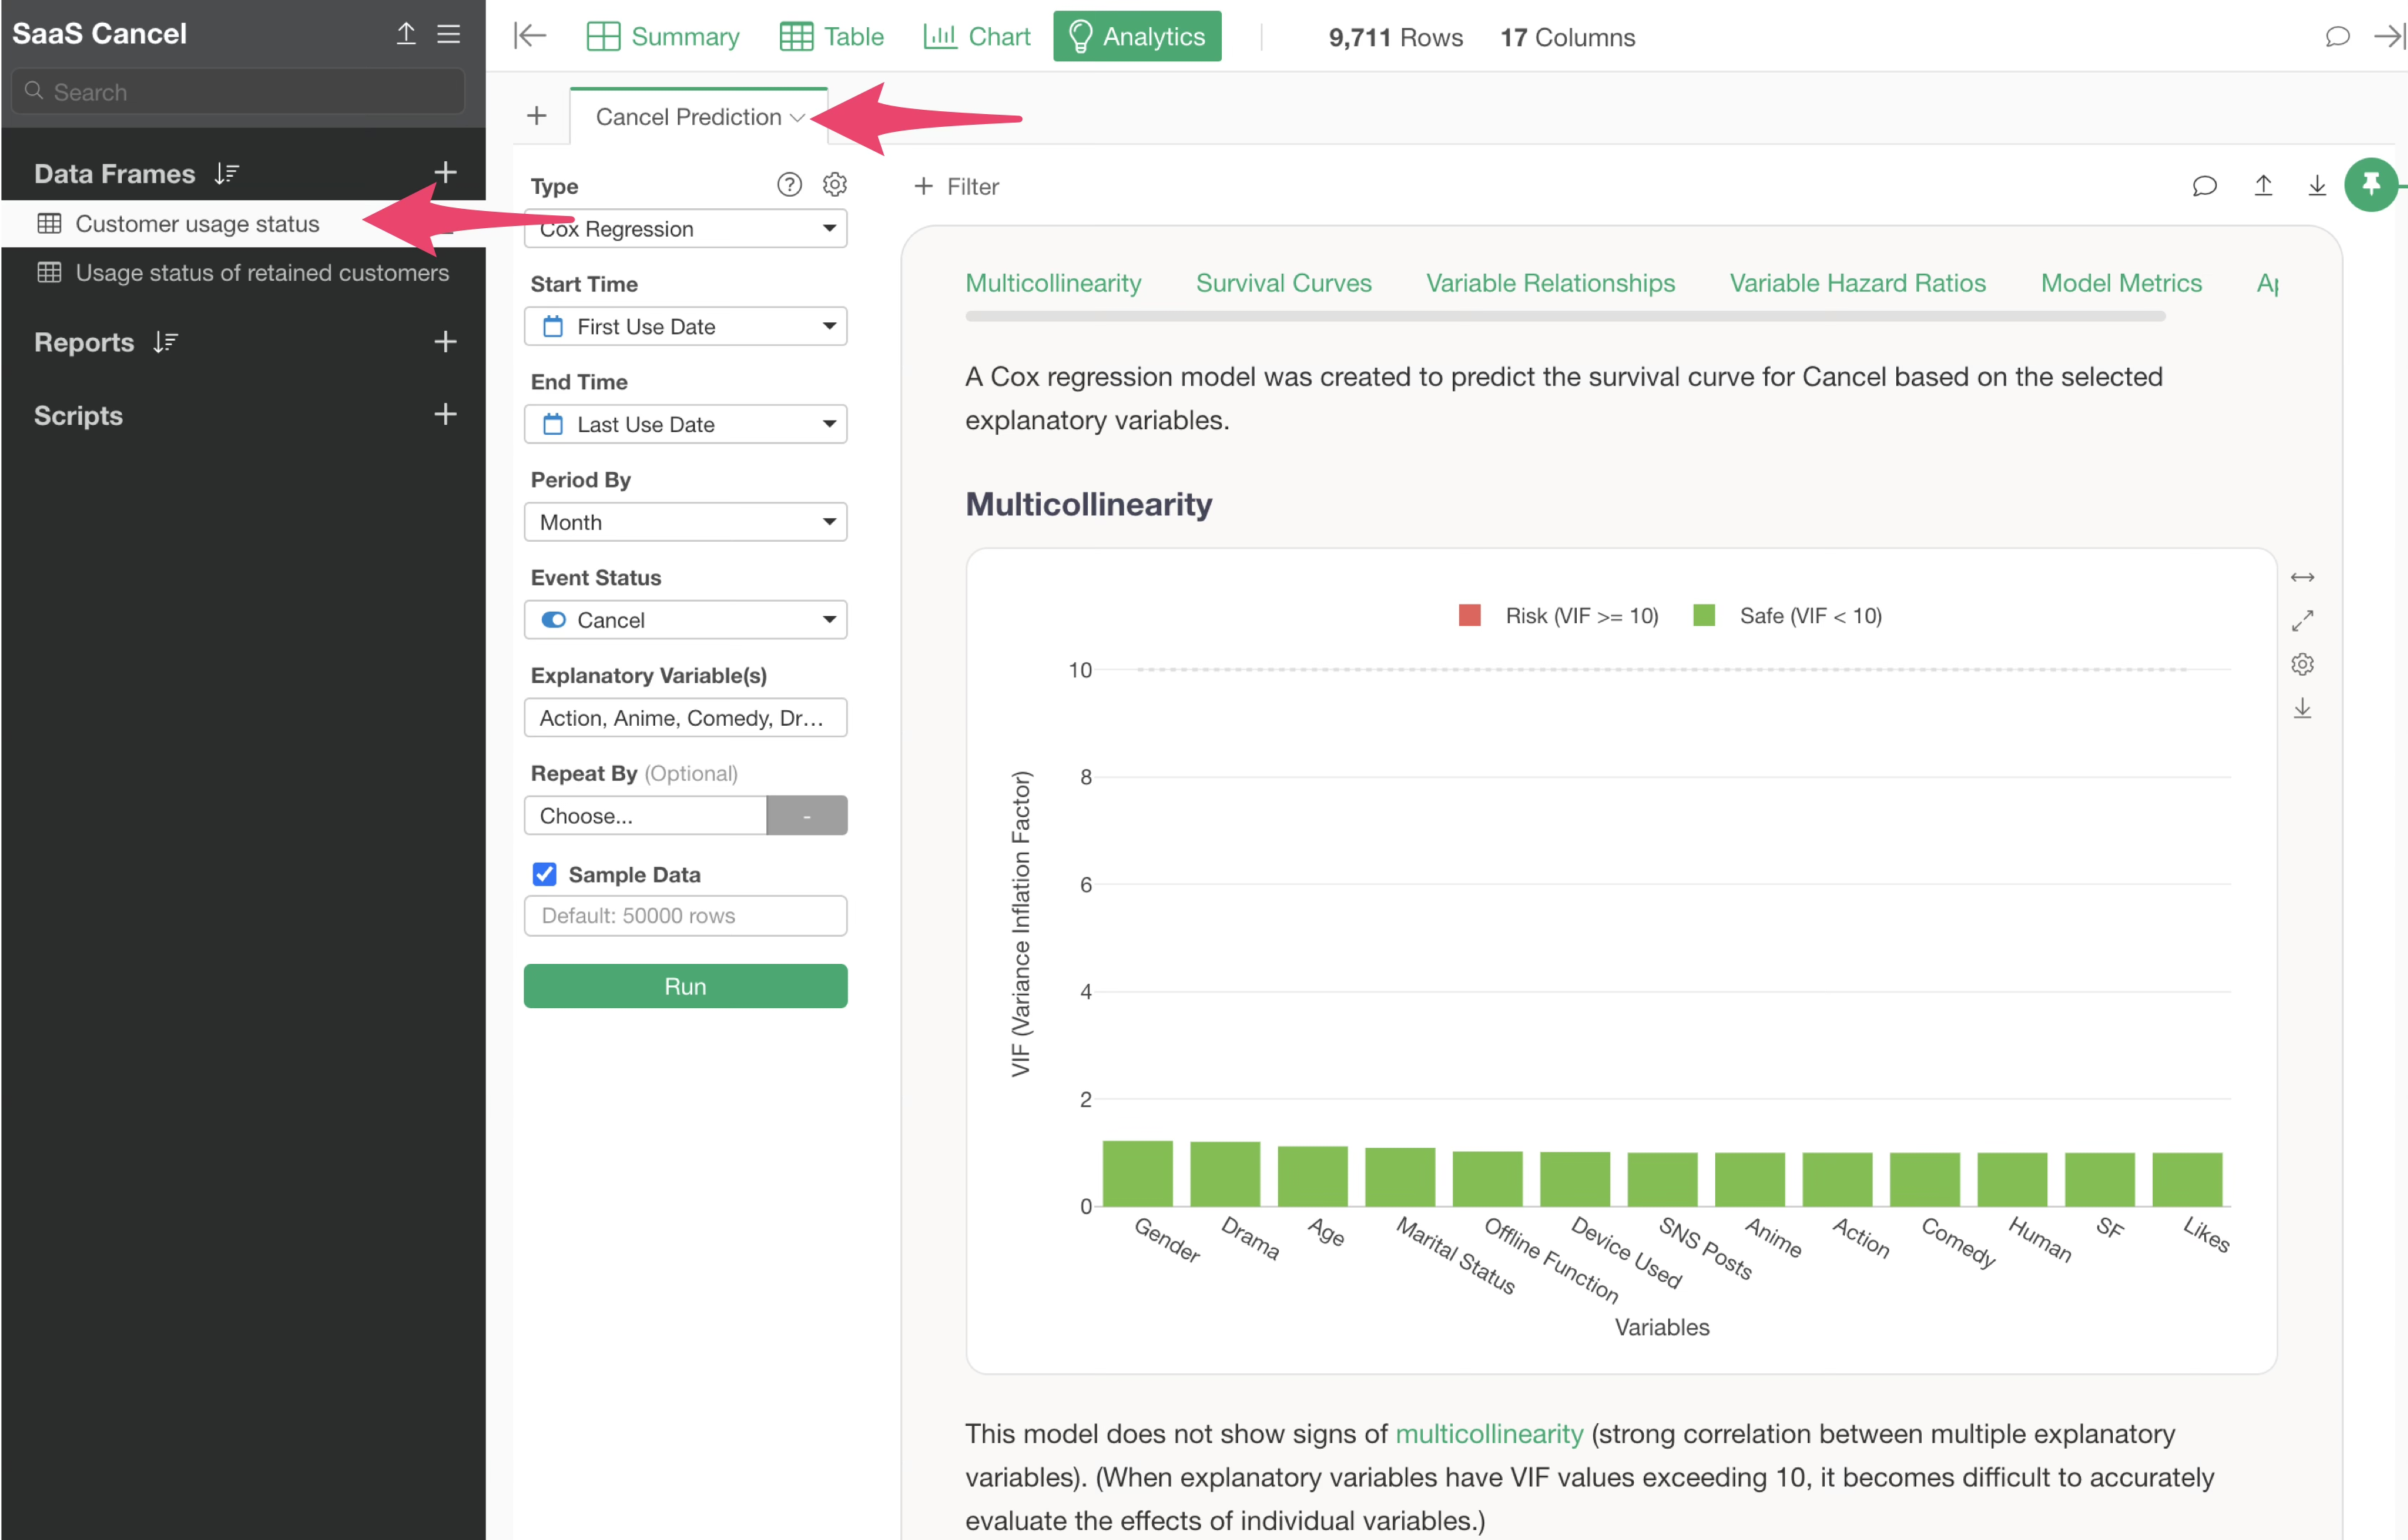
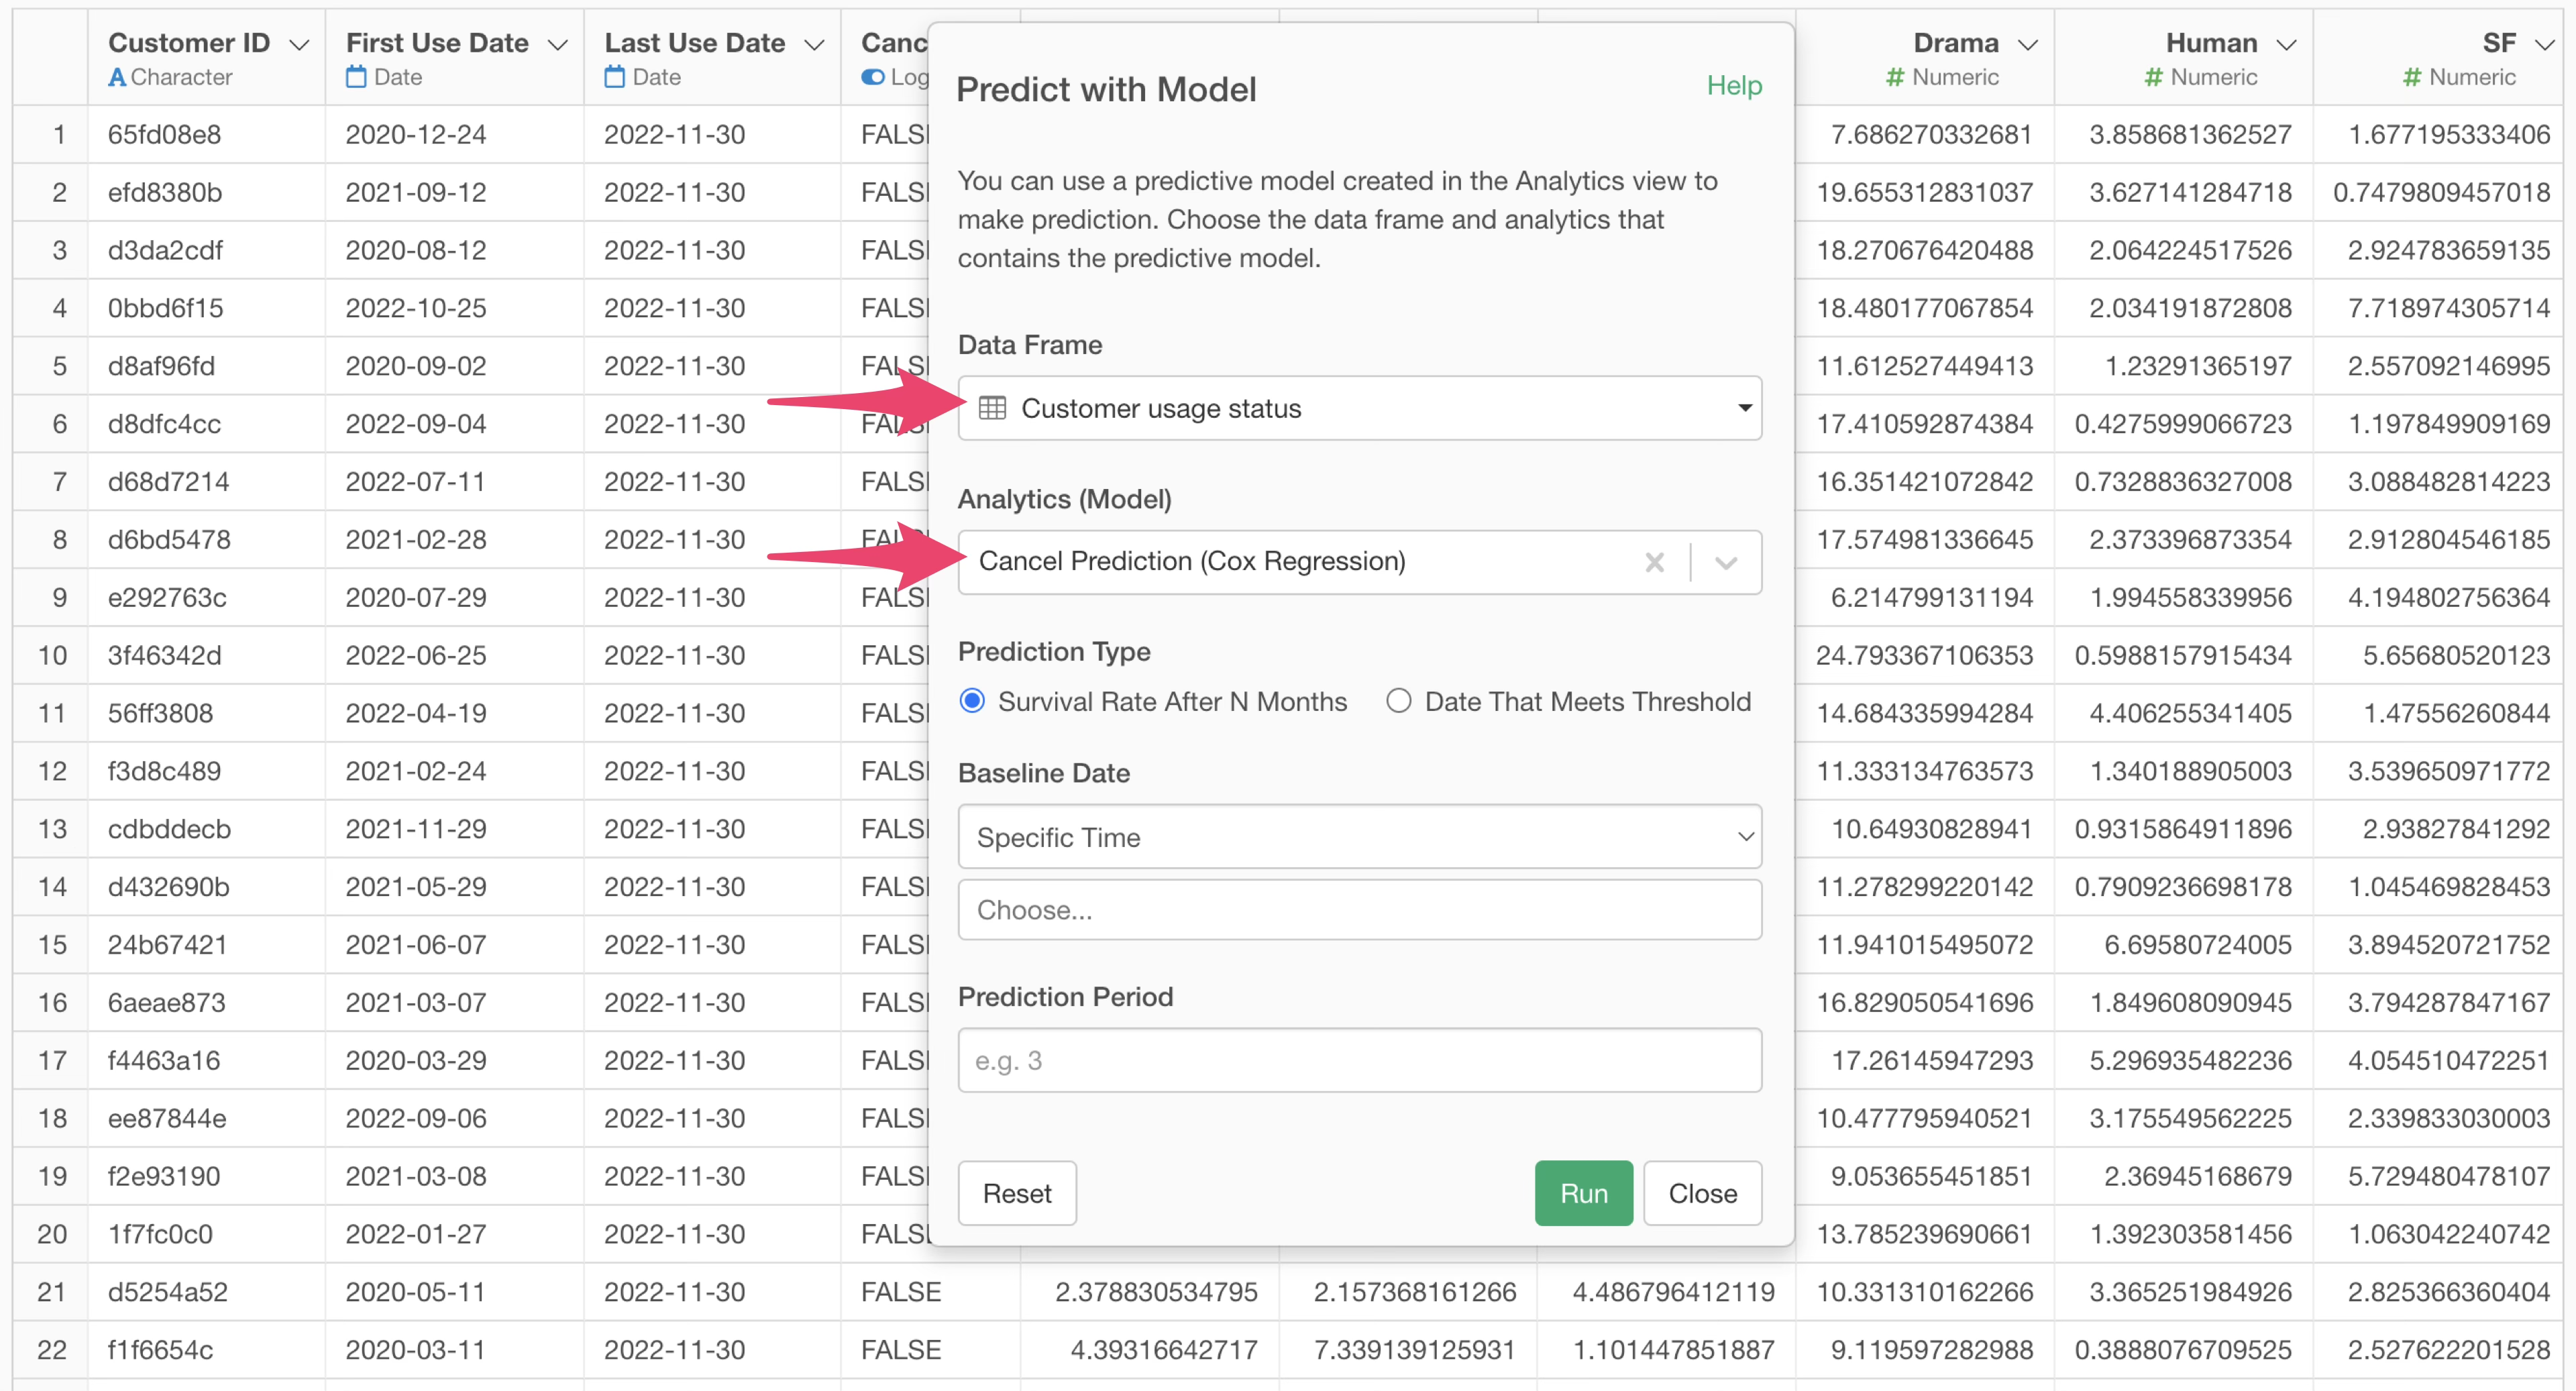
In the model selection dialog, specify the data frame where your model was created. Here, we select the “Customer usage status” data frame and then choose the pre-built survival analysis model from the Analytics Model list.
Setting Up N-Month Survival Rate Prediction
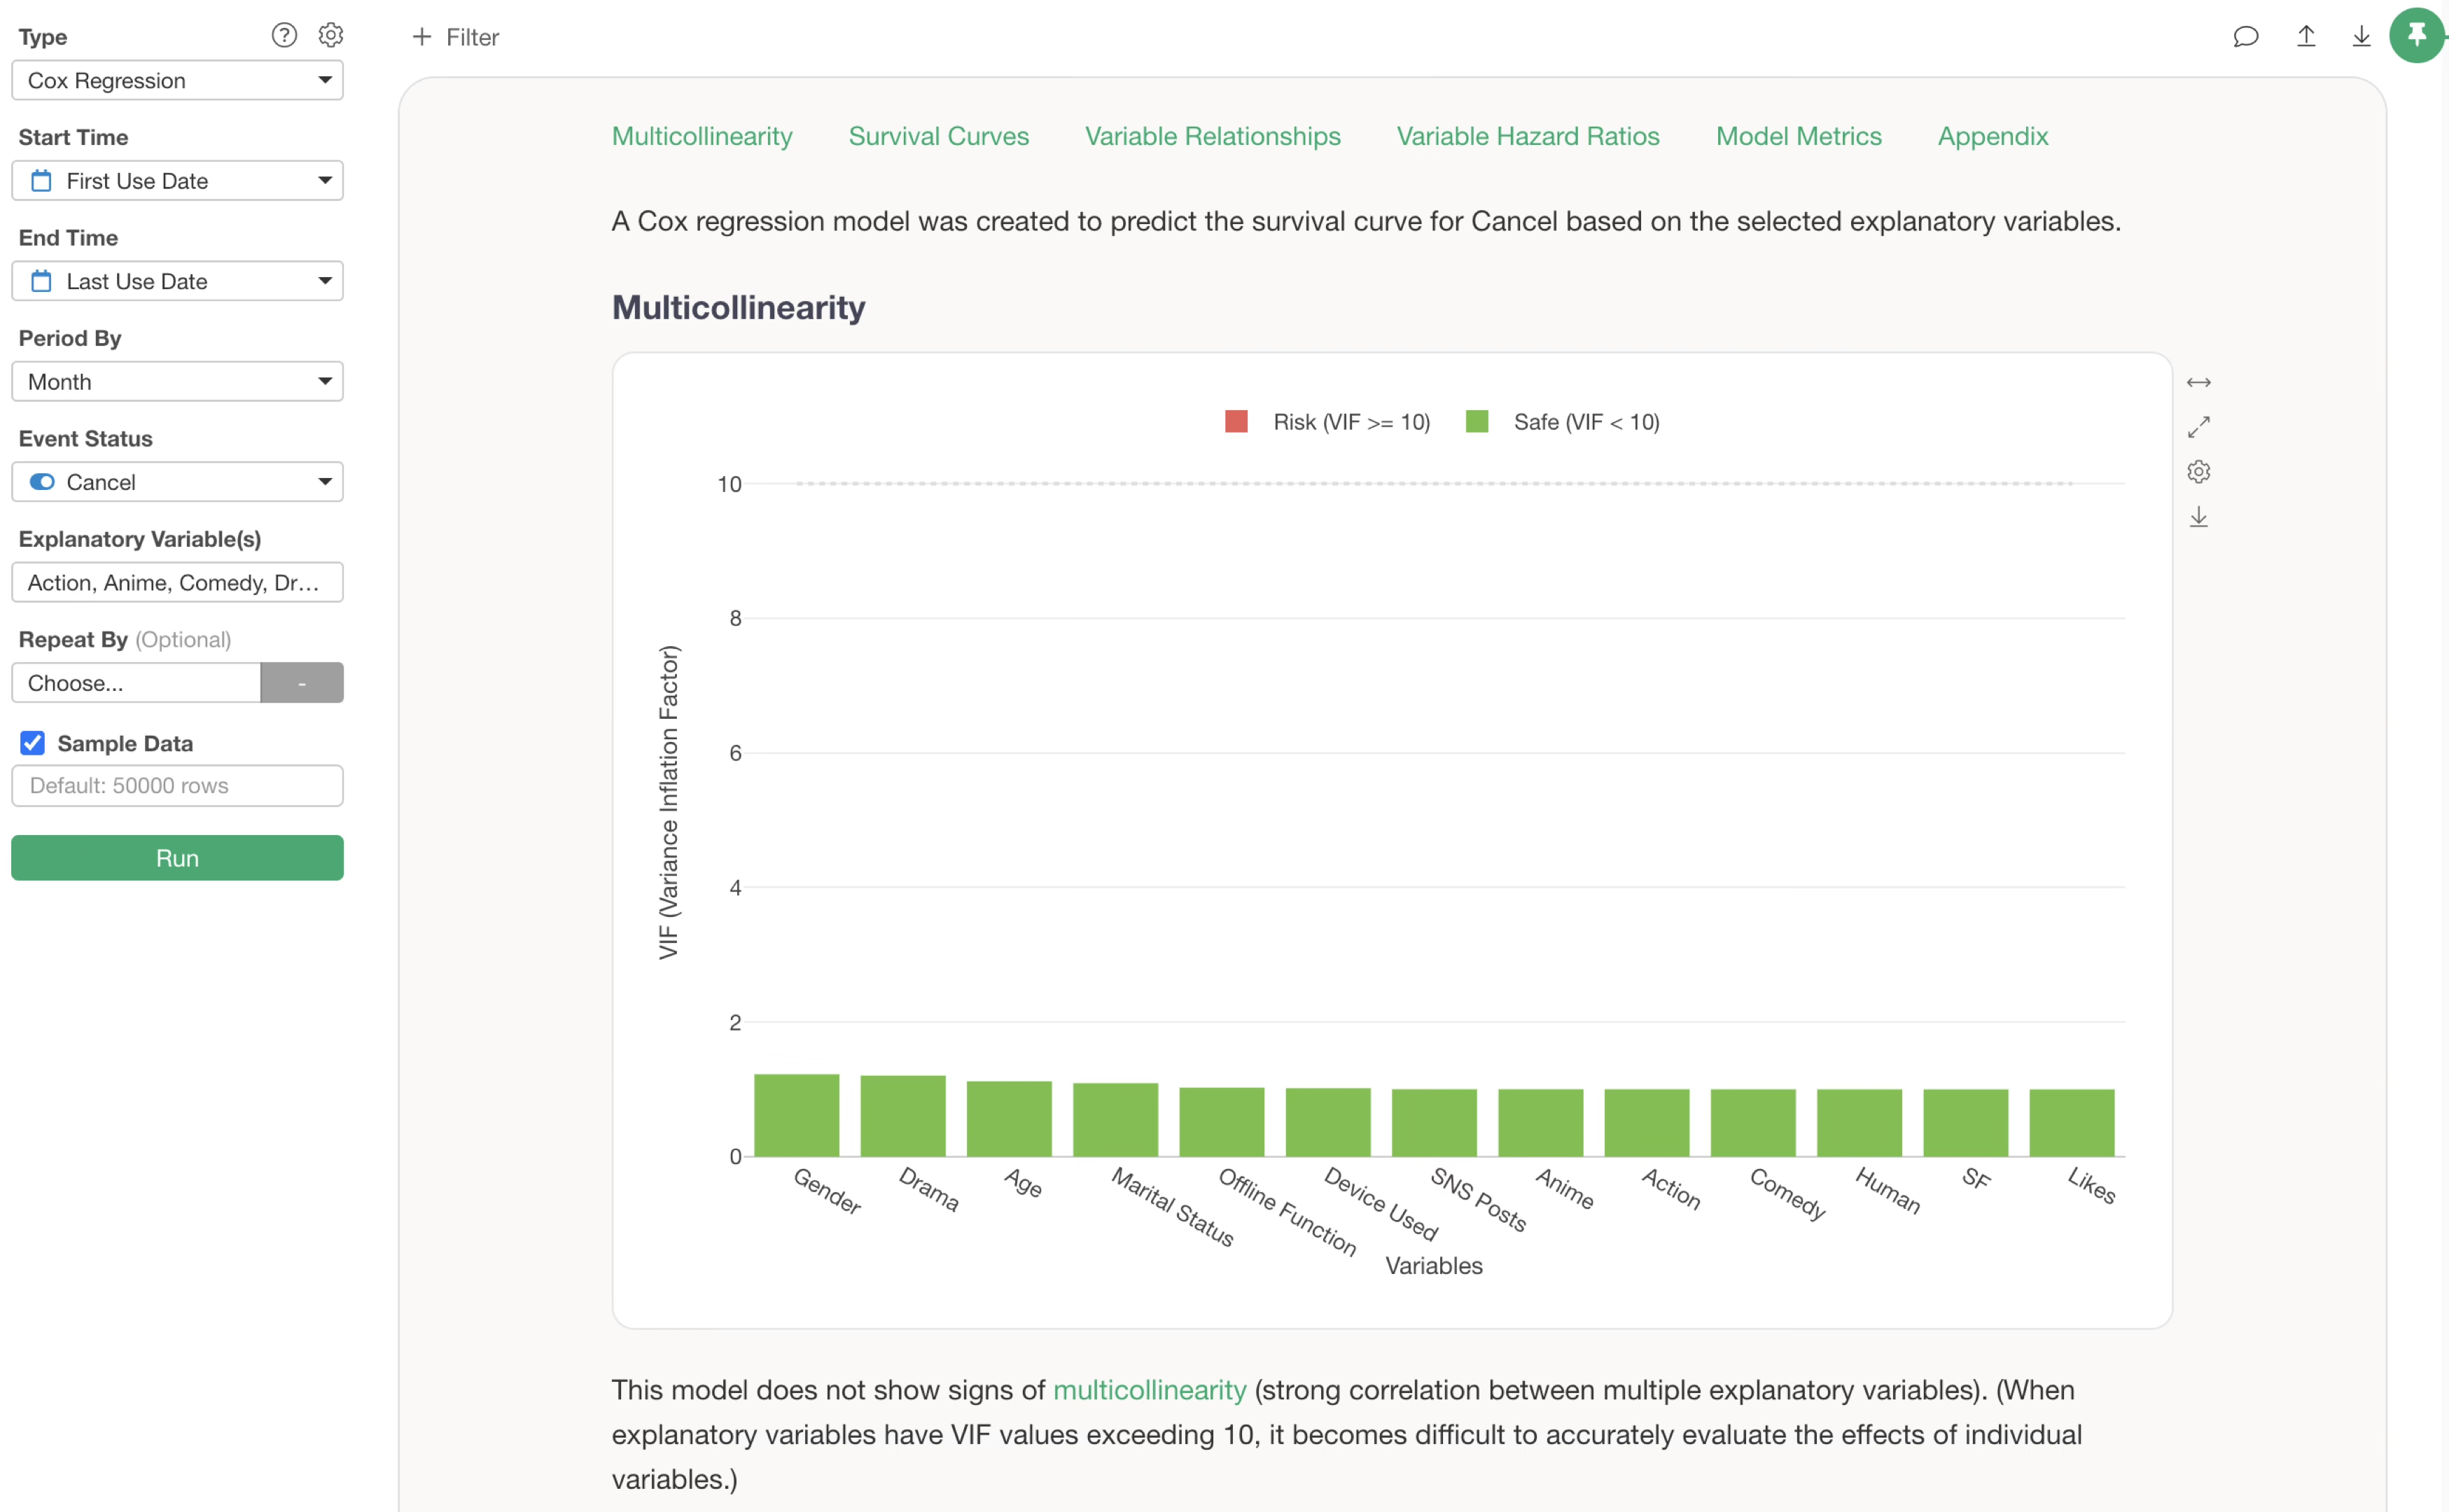
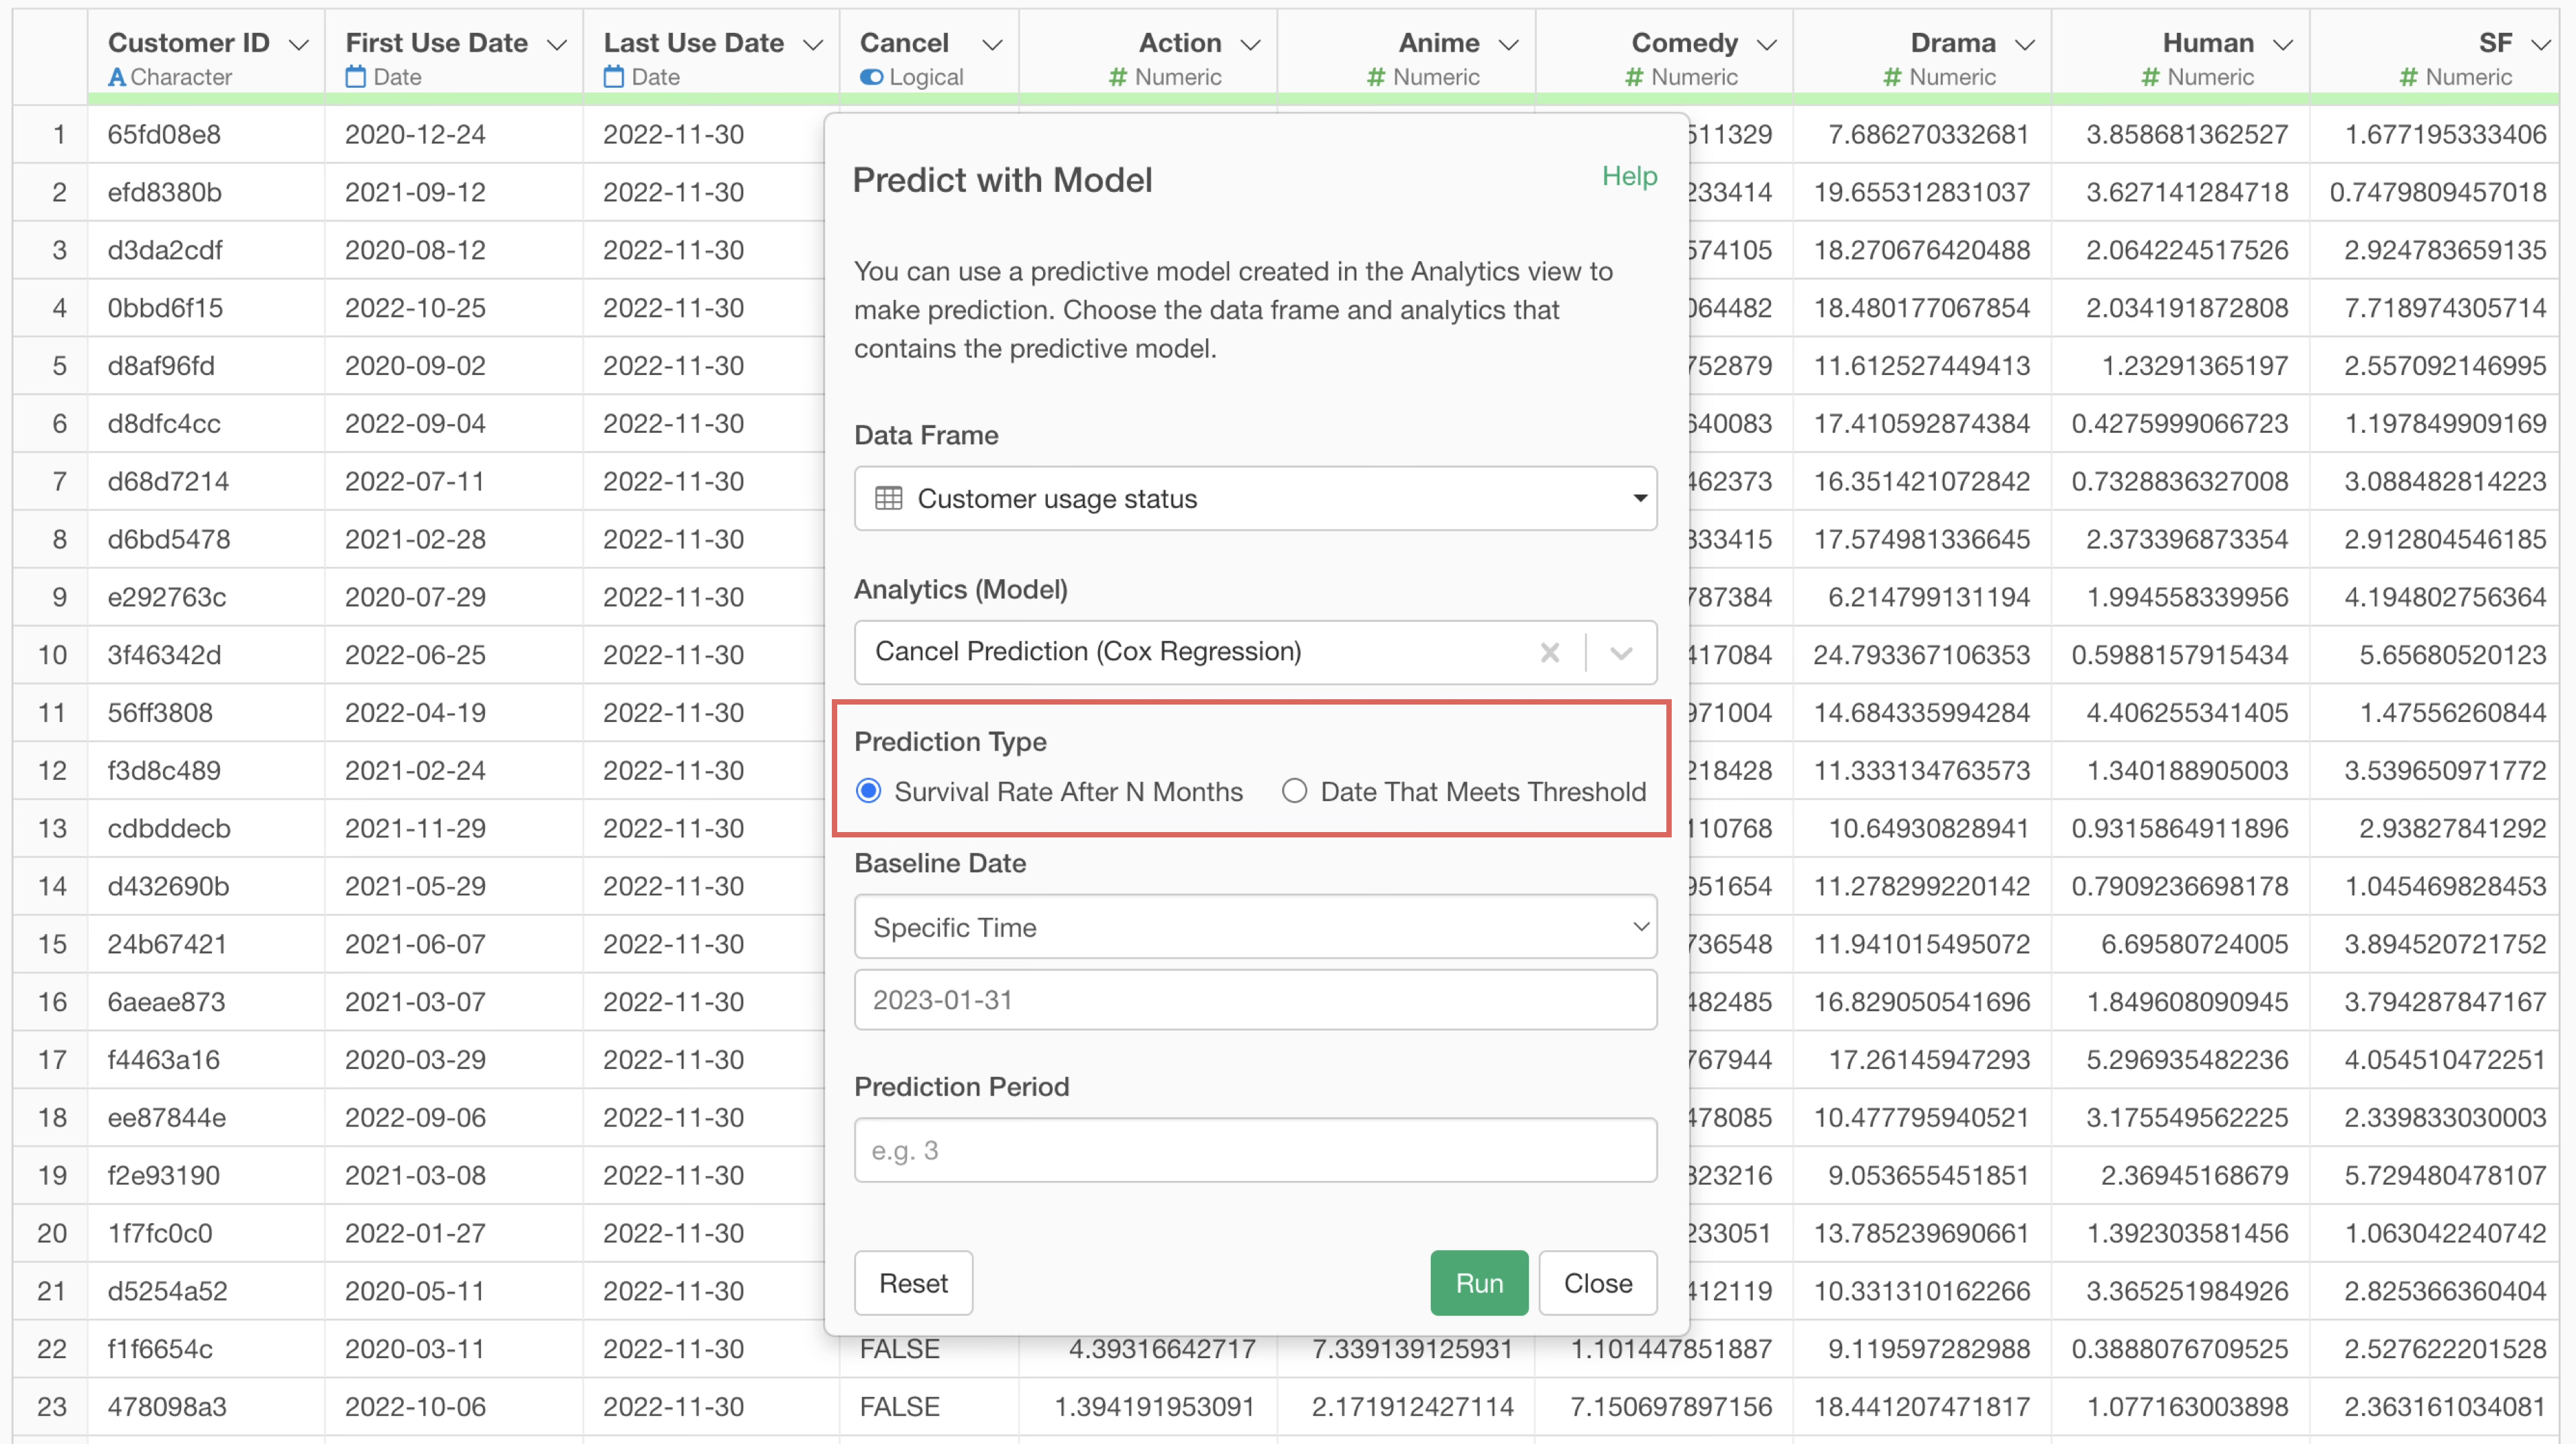
When you select a survival analysis model in “Analytics (Model),” two prediction type options appear.
Survival Rate After N Months
First, let’s look at “Survival Rate after N months,” which predicts the survival rate after a specified period.
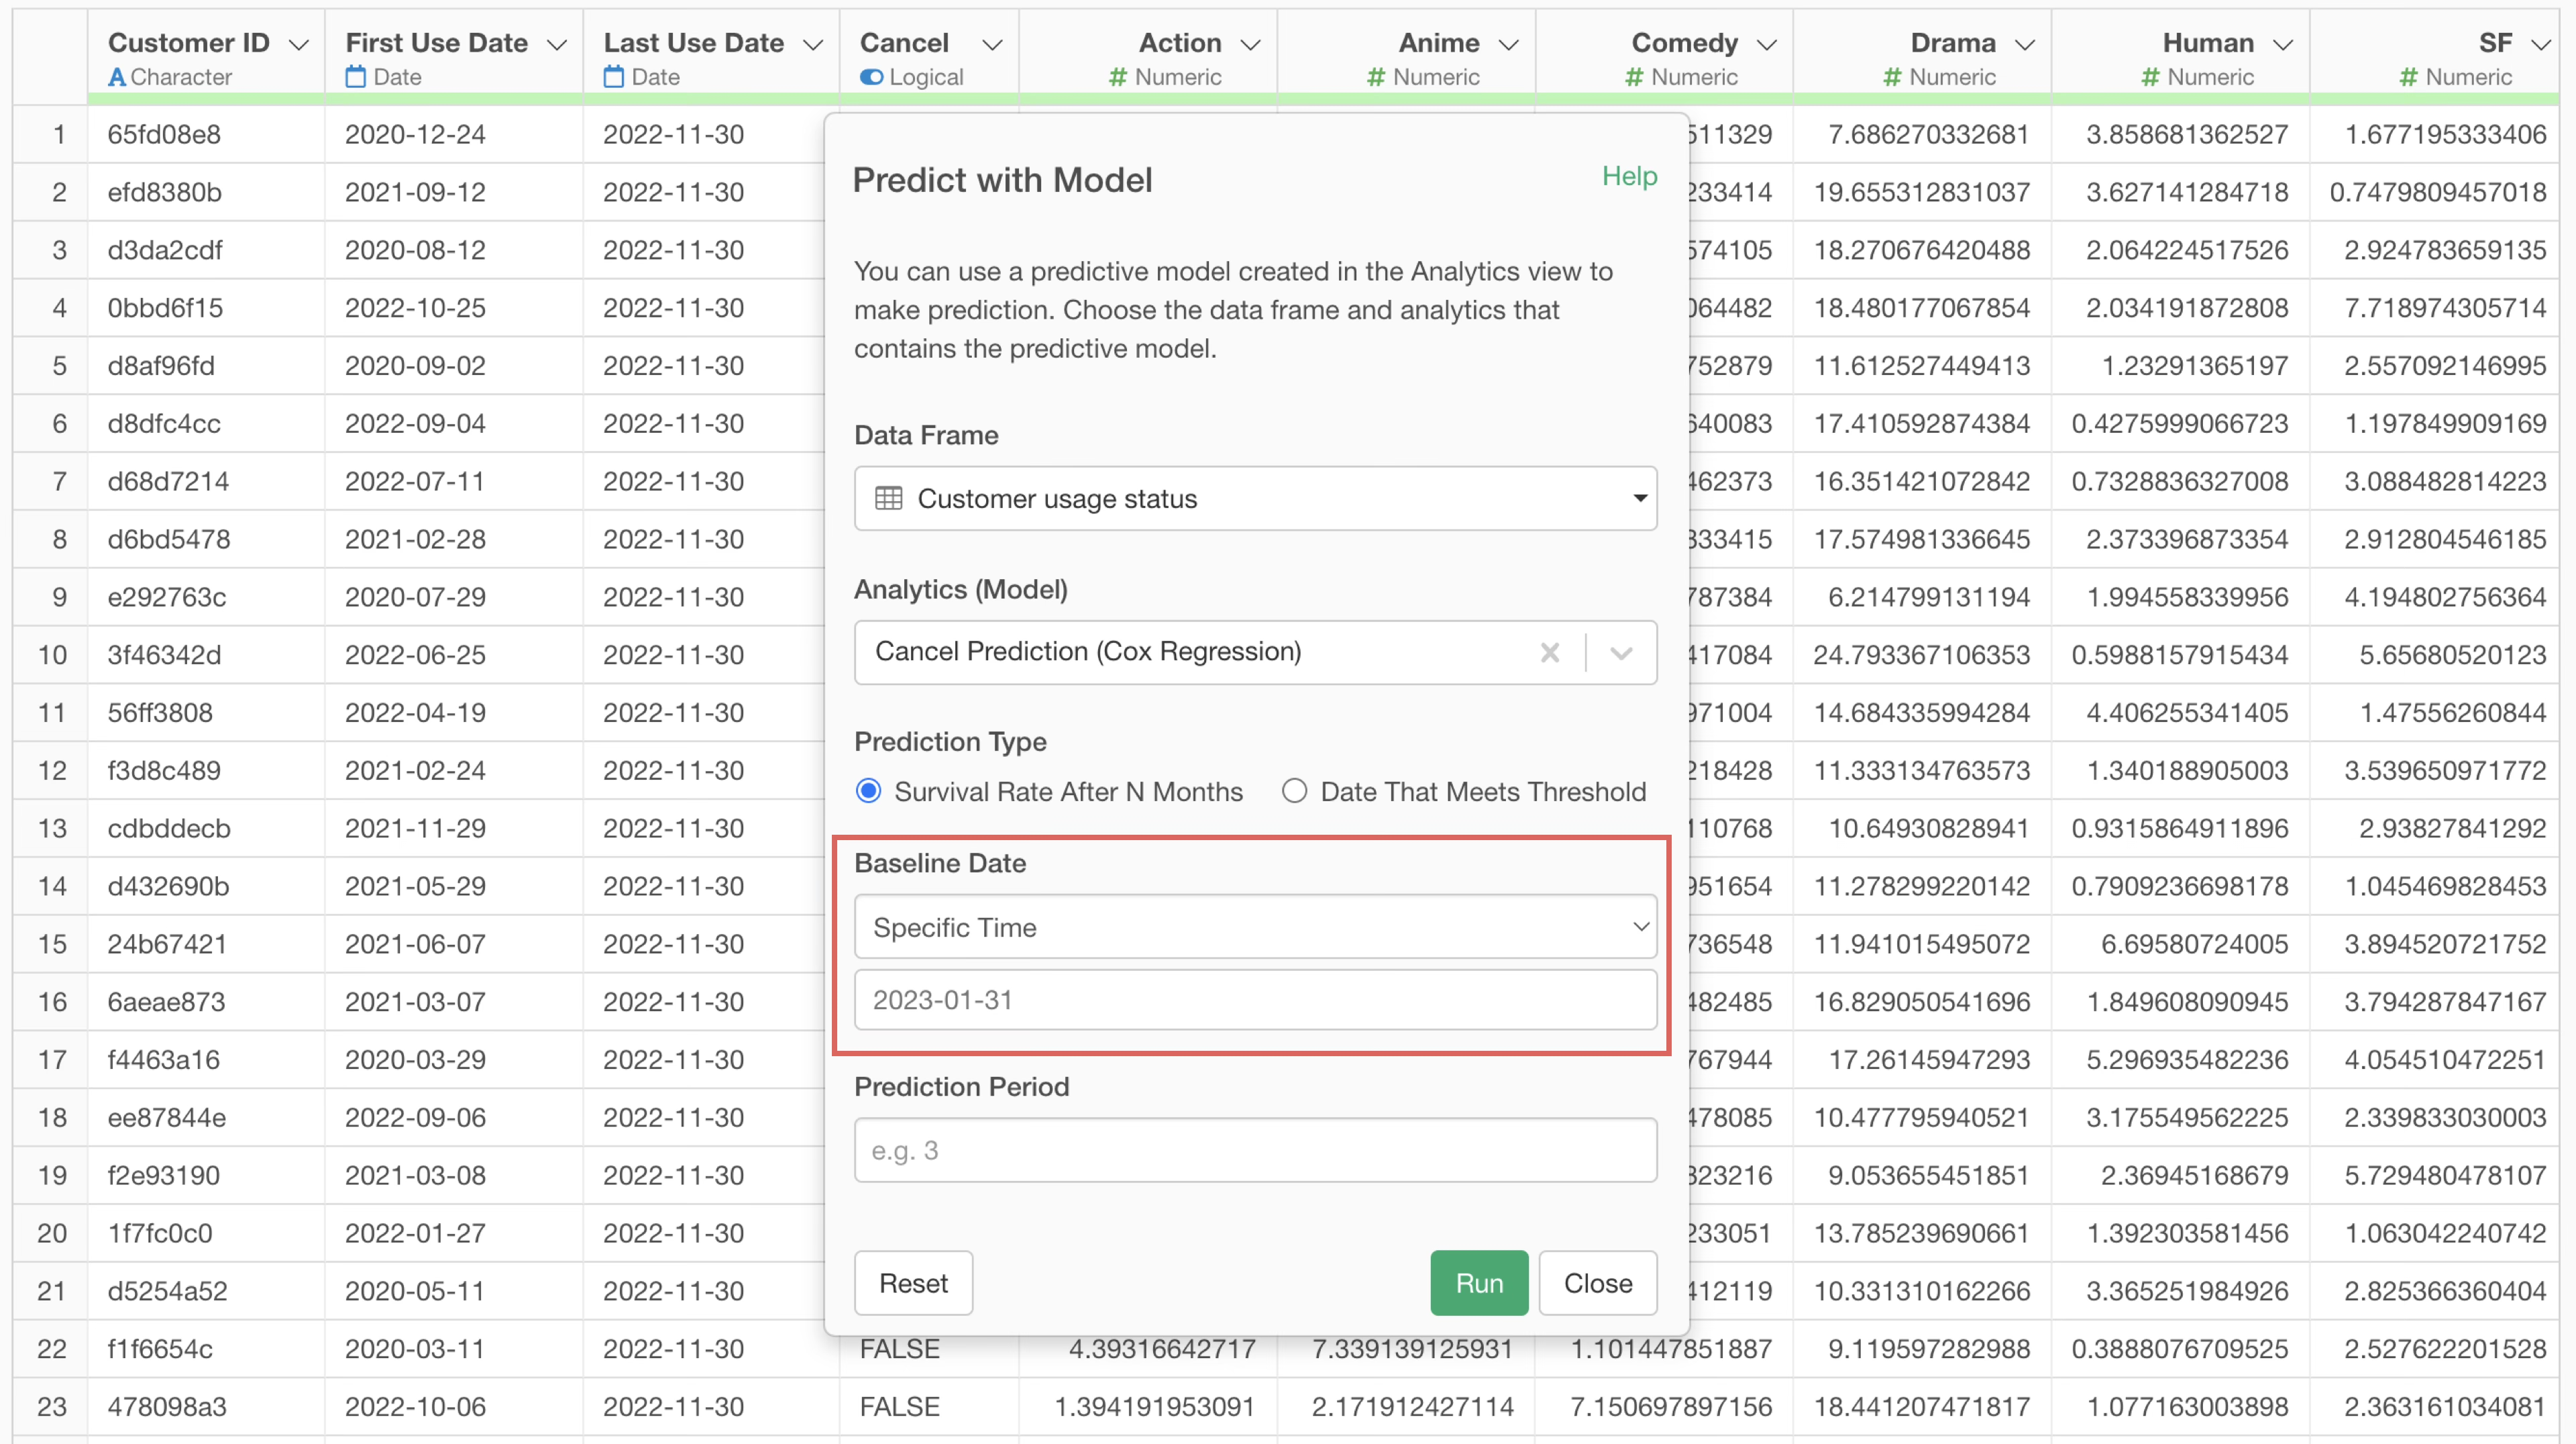
Check the “Survival Rate after N months” option under prediction type.
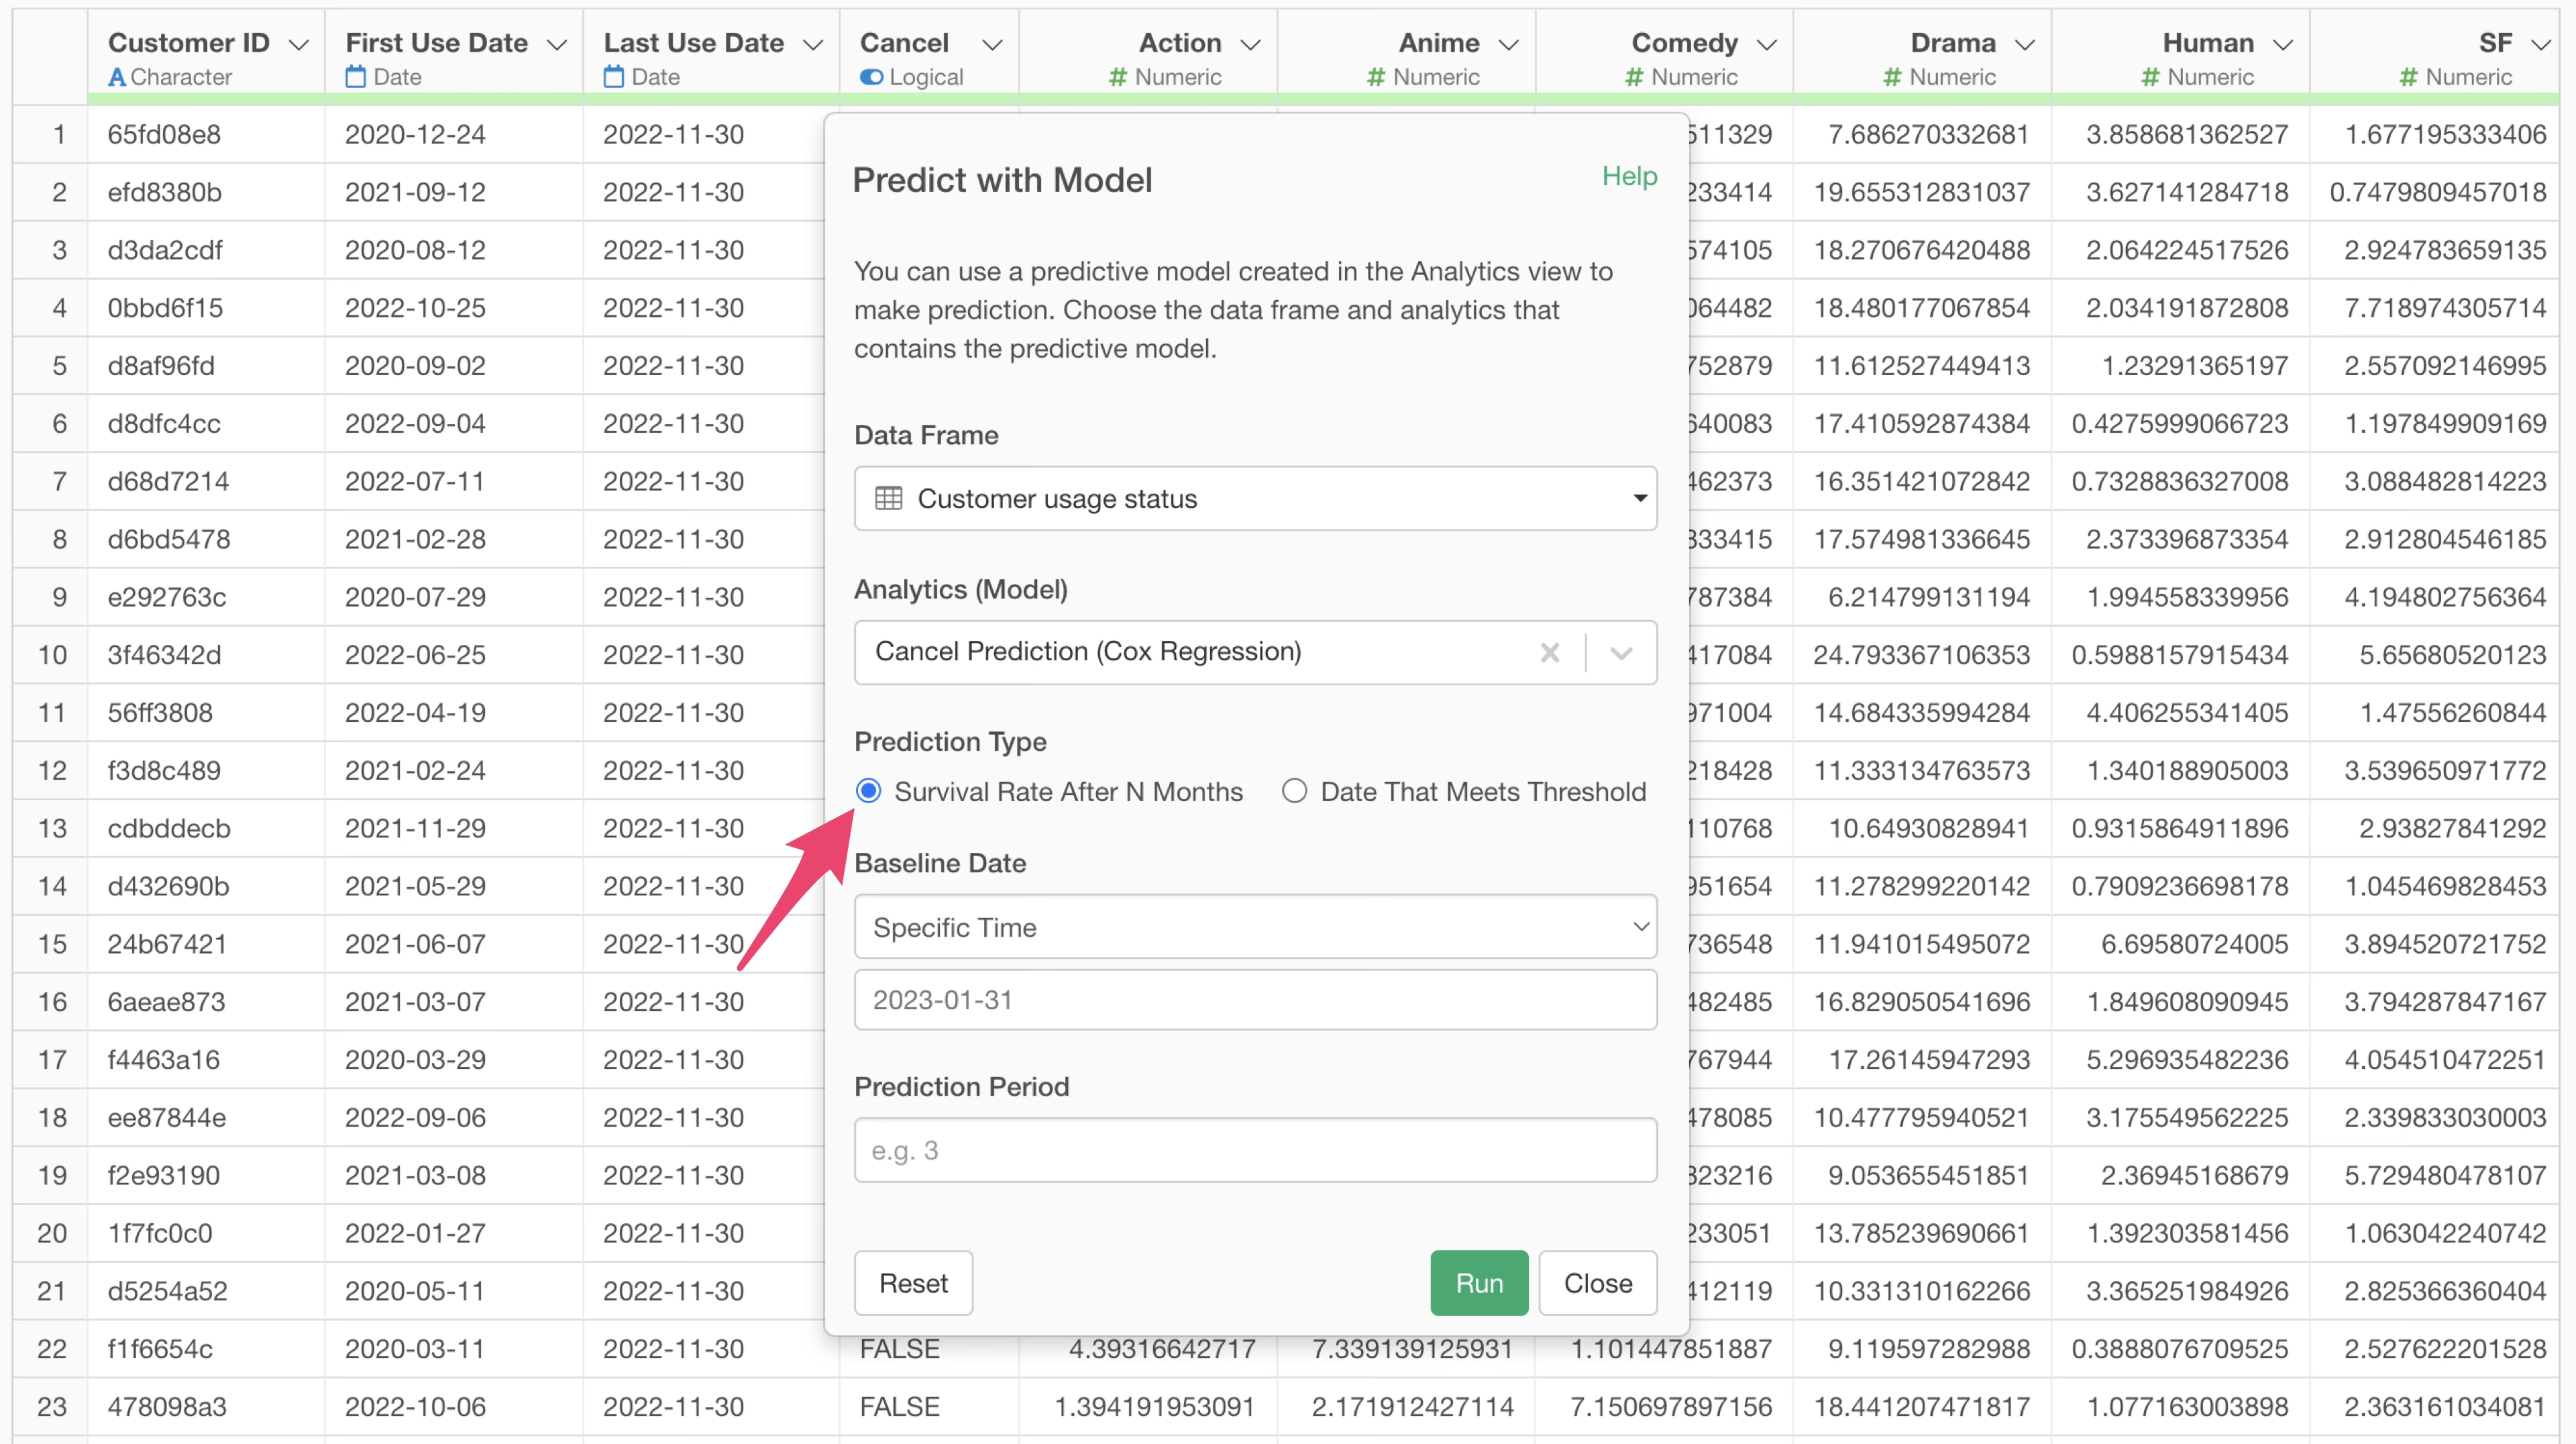
Next, set the baseline date. Select “Specific Time” and choose the baseline date from the calendar picker. In this case, we’ll use January 31, 2023, which is the data acquisition date or the last date in the dataset.
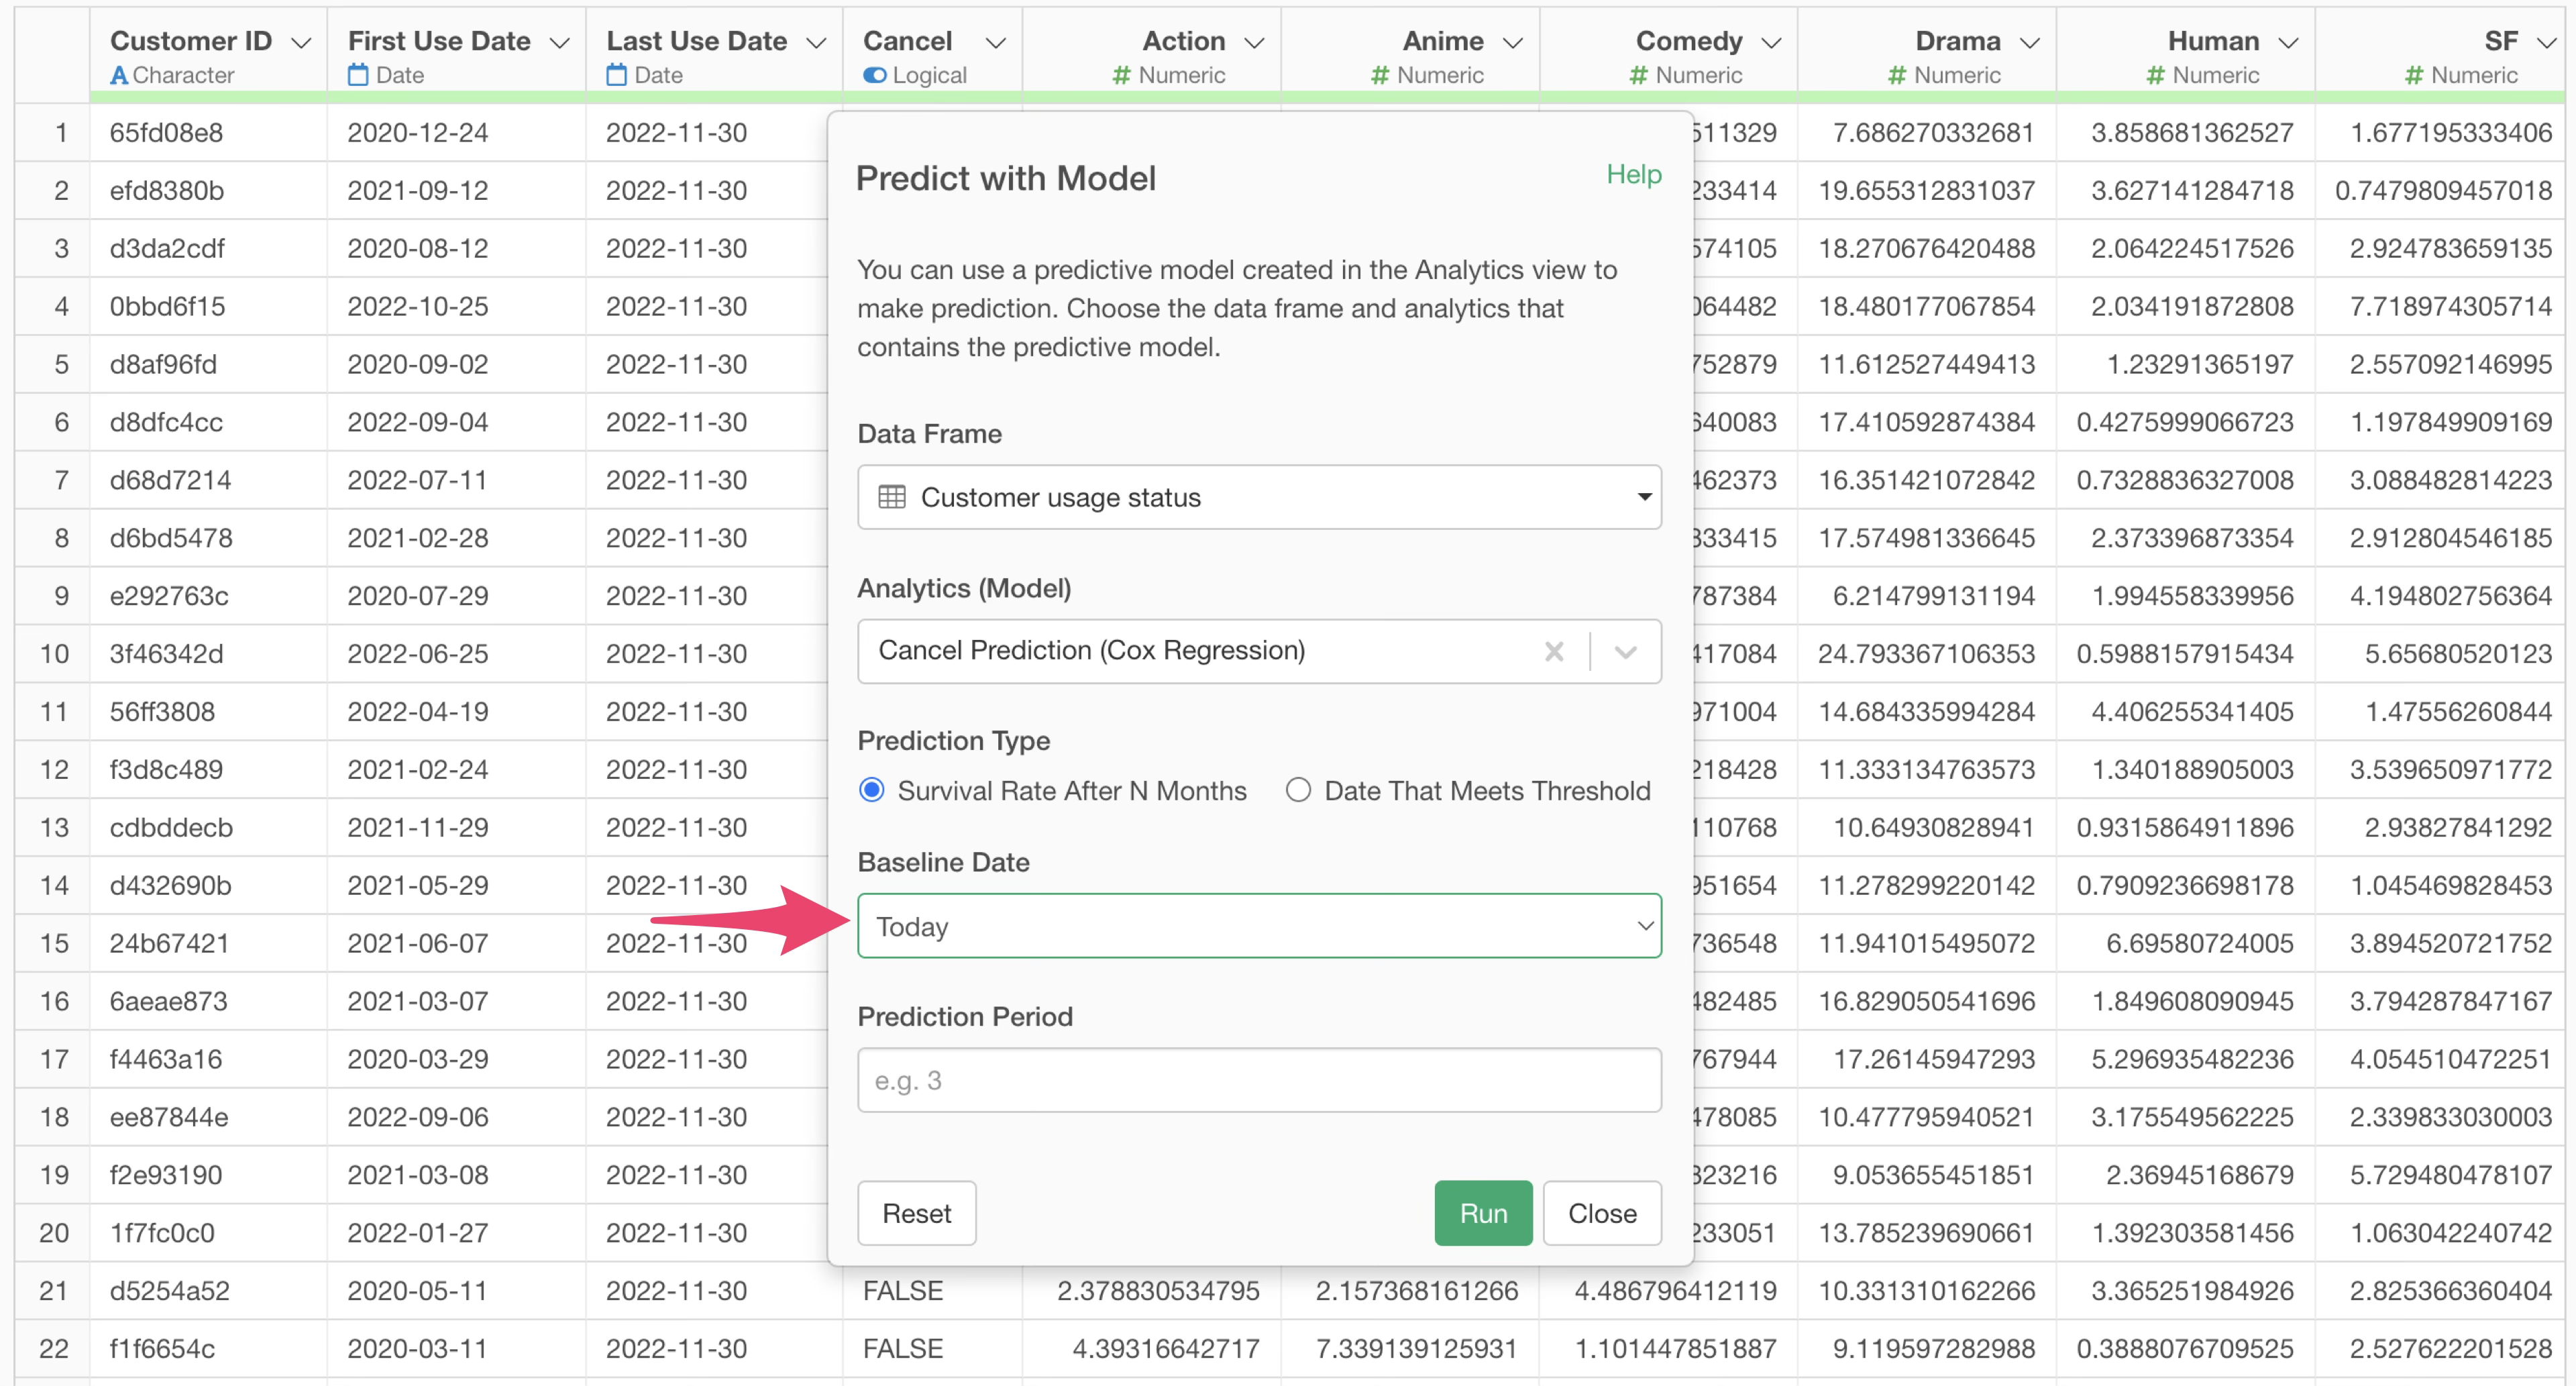
You can also select “Today” as the baseline date.
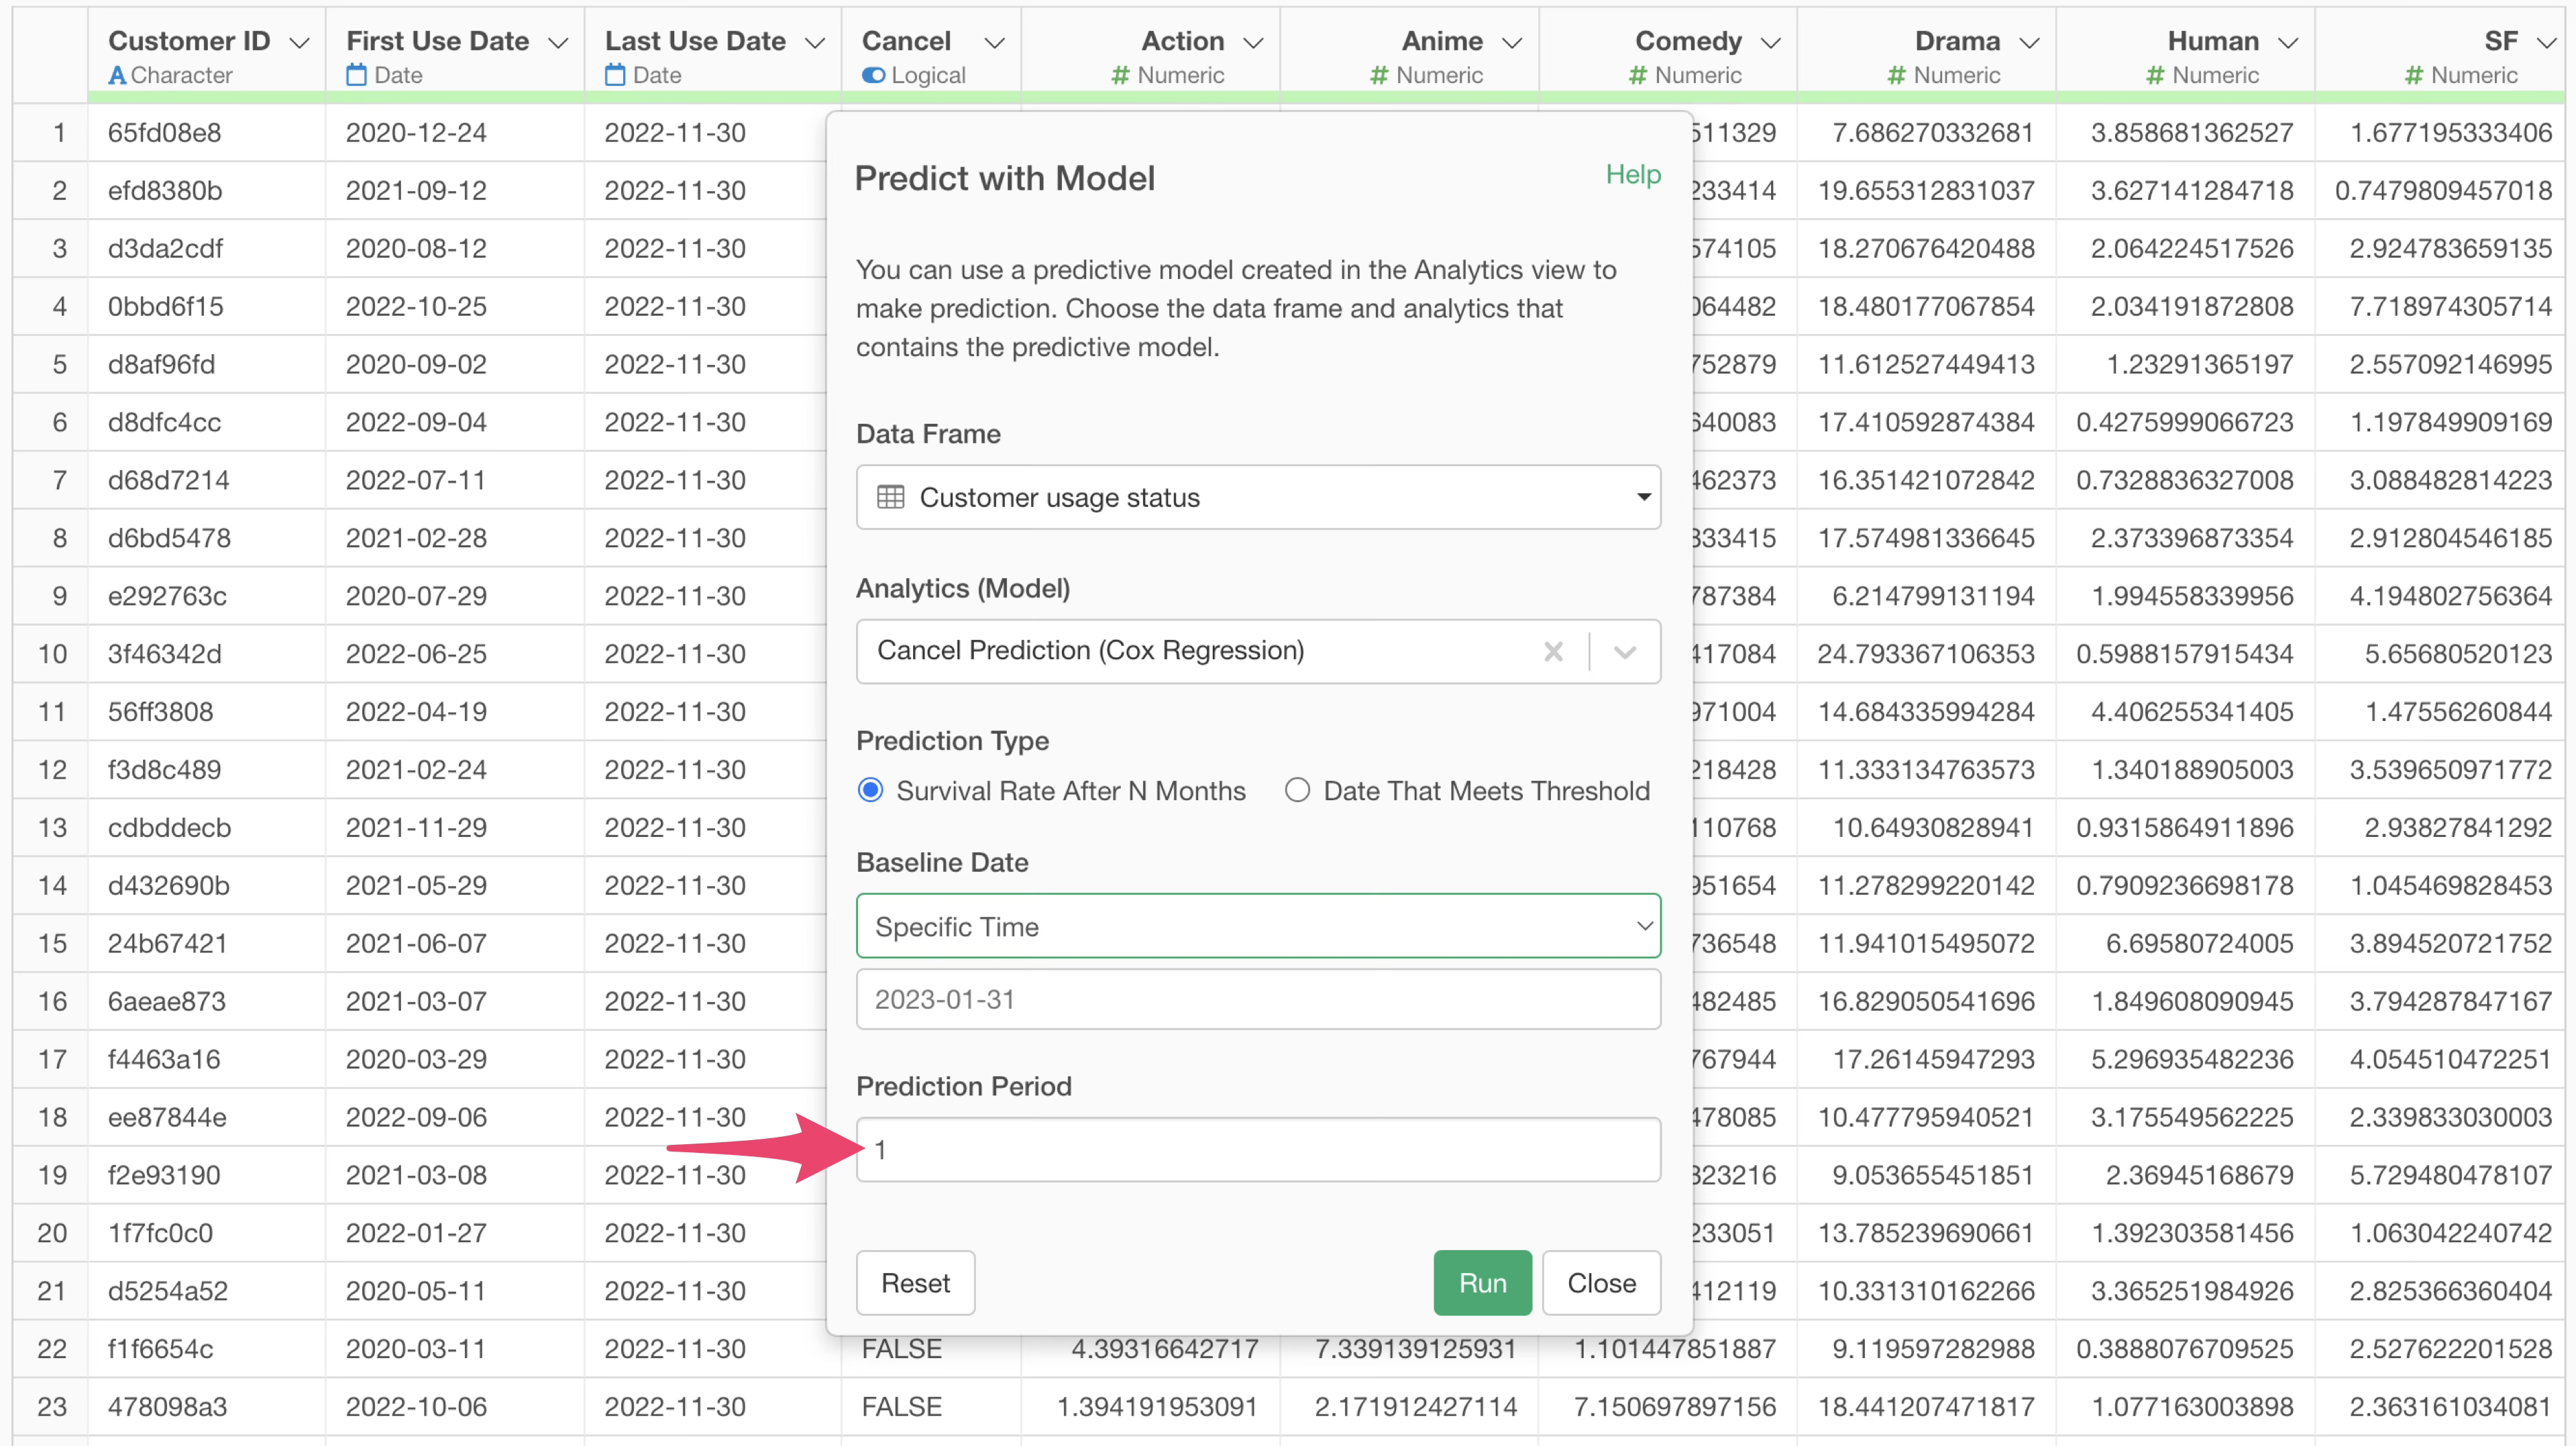
Since we want to calculate the survival probability one month from the baseline date, enter “1” in the prediction period and click the “Run” button.
Reviewing and Interpreting Prediction Results
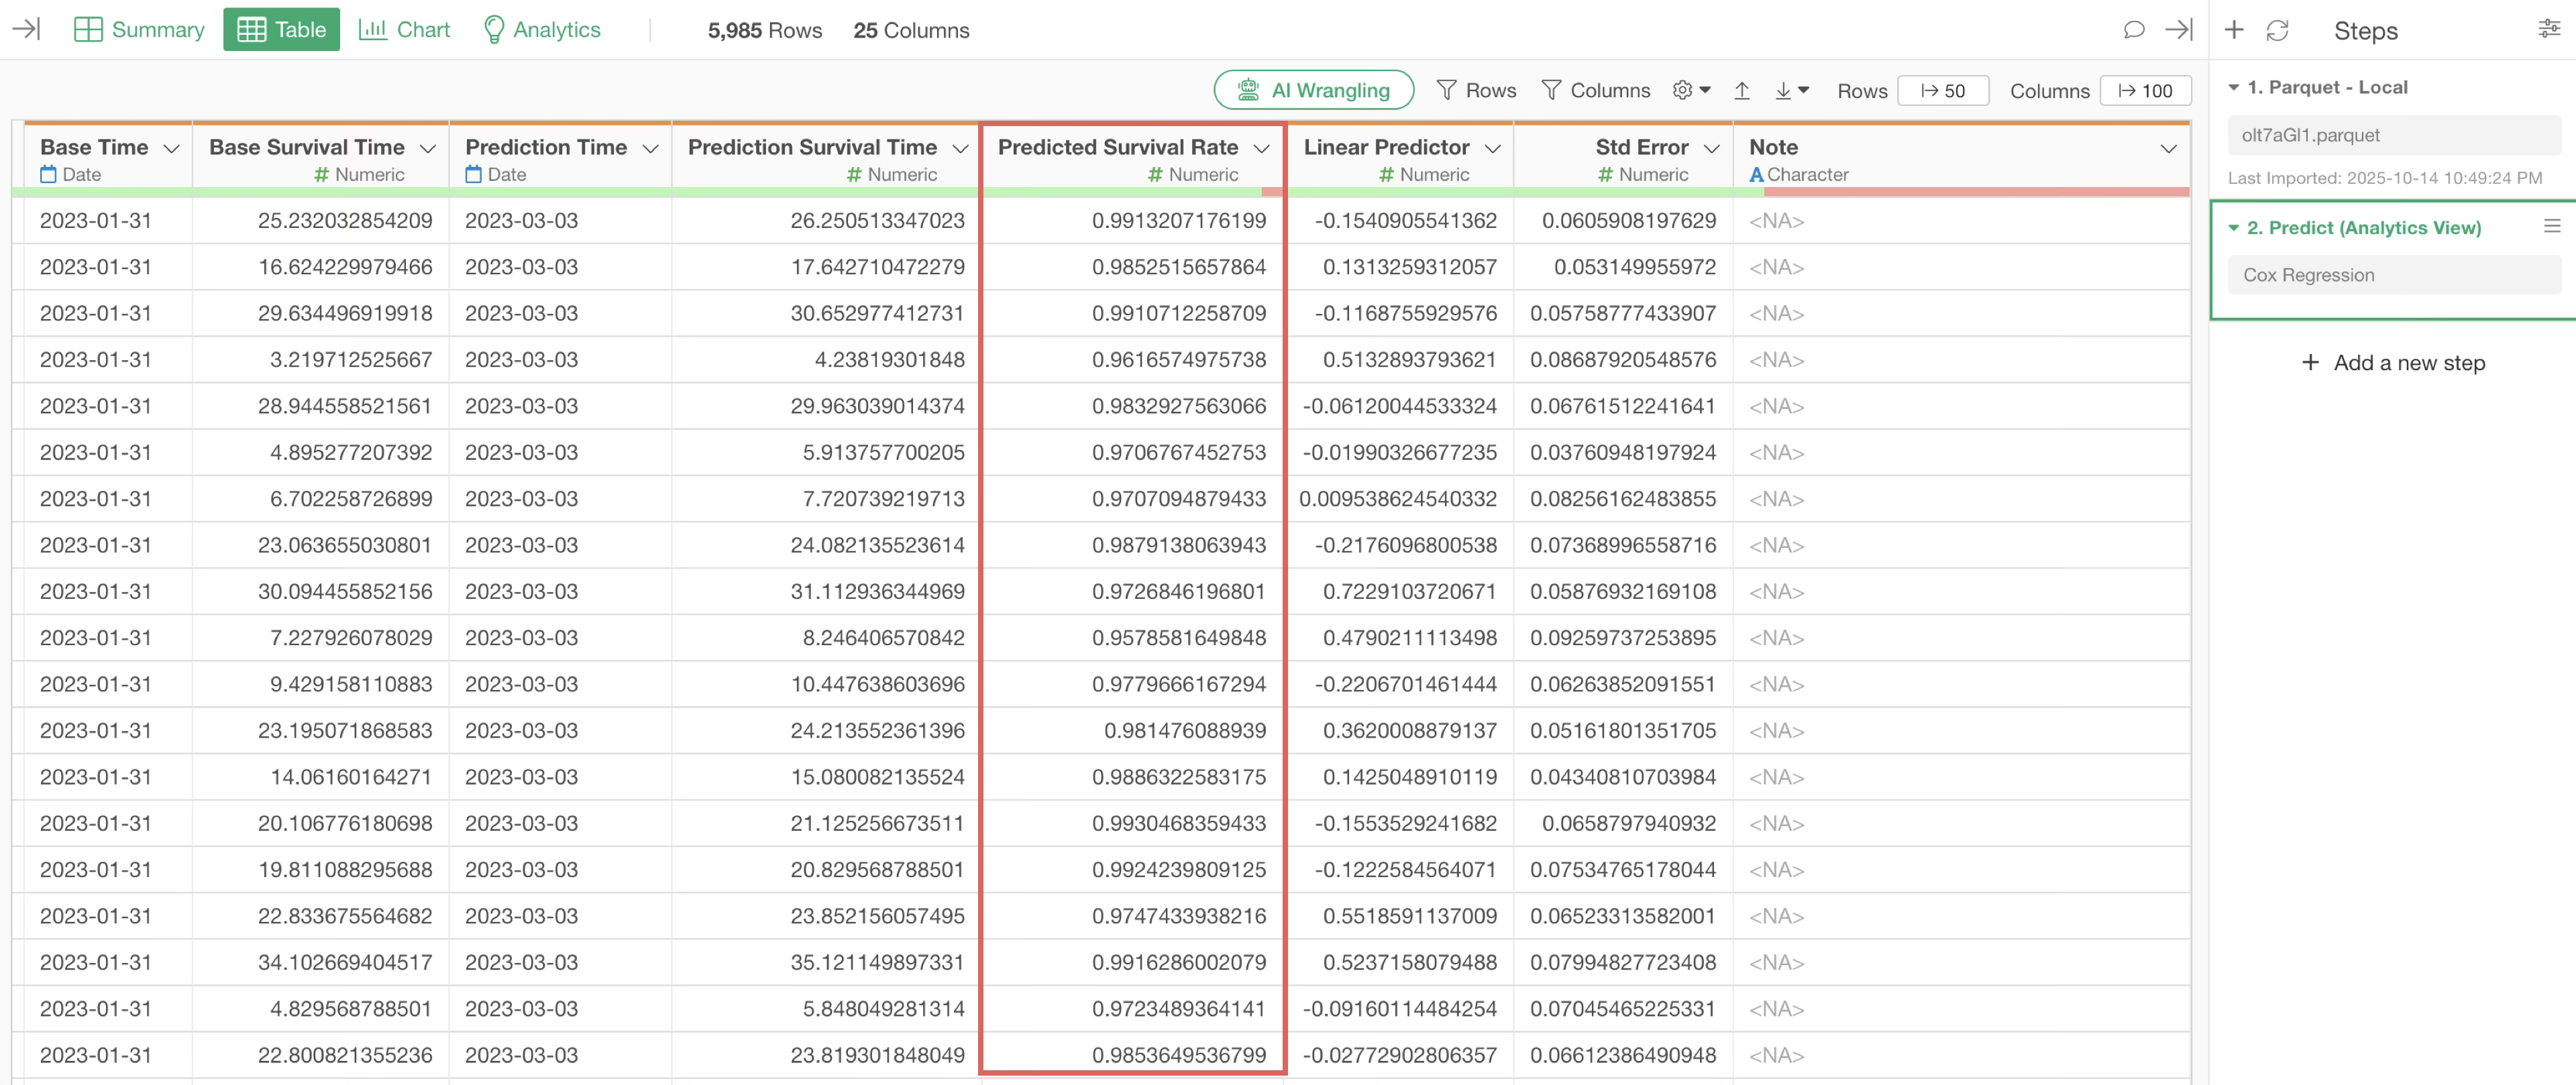
After the prediction is complete, a new prediction step is added, along with several orange-highlighted columns.
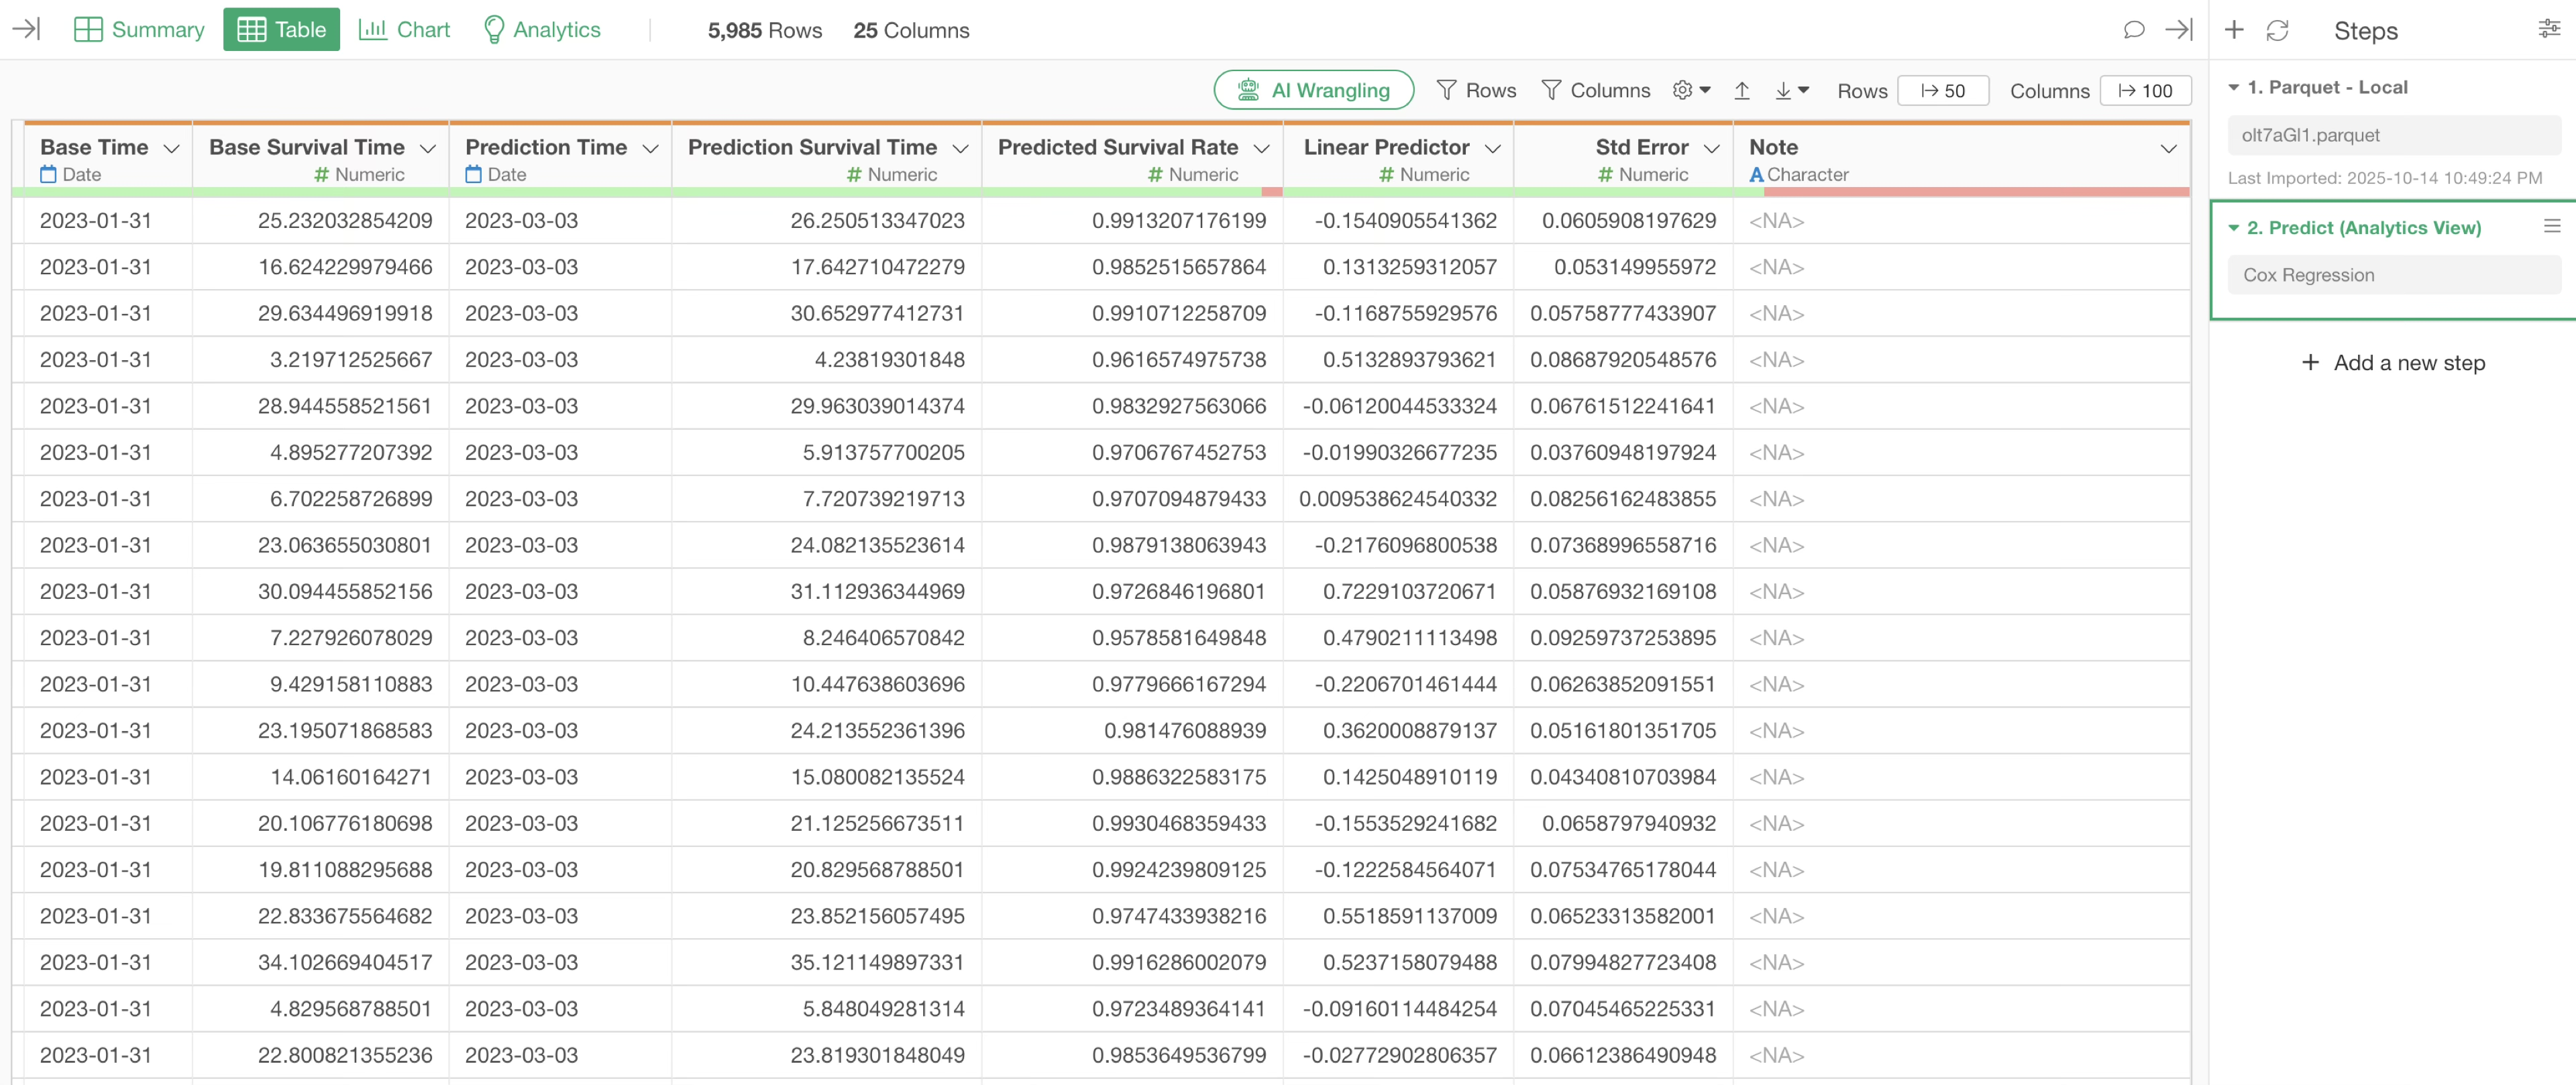
The added columns include:
- Base Time: The specified baseline date.
- Base Survival Time: Survival period up to the baseline date.
- Prediction Time: The target prediction date.
- Prediction Survival Time: Survival period at the prediction point.
- Predicted Survival Rate: The predicted survival rate.
- Linear Predictor: A risk score. Higher values indicate a higher relative event rate and a lower survival rate.
- Std Error: The standard error of the Linear Predictor.
Interpreting the Predicted Survival Rate
It’s important to note that the Predicted Survival Rate represents a conditional survival rate from the baseline date, not an absolute survival rate.
The prediction here is the survival rate from the baseline date, not the survival rate “until the specified date.”
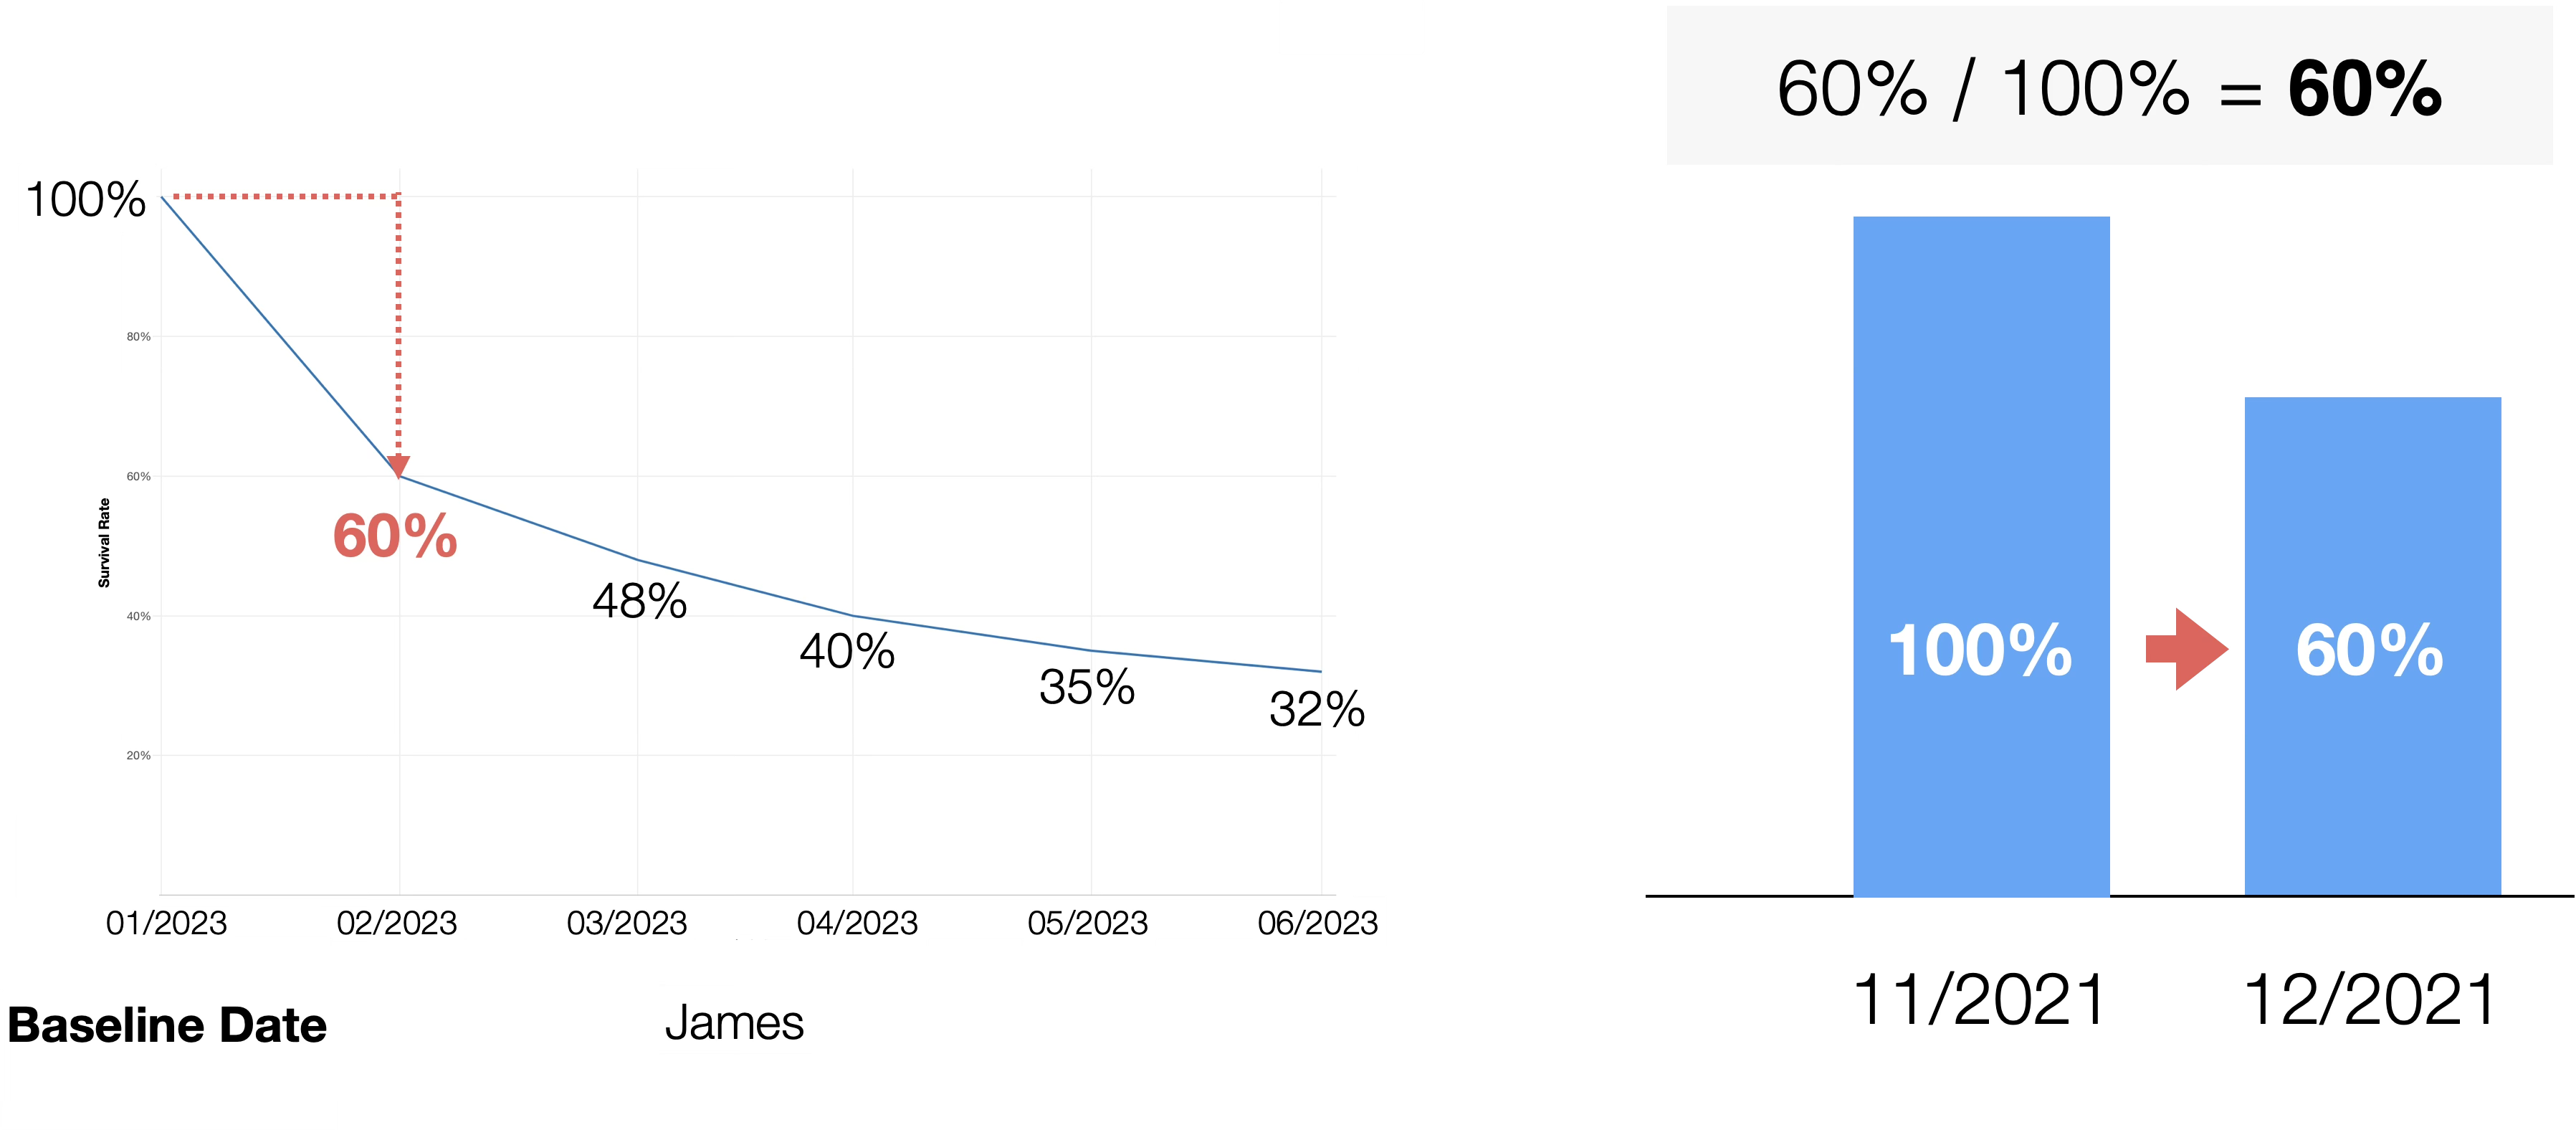
For example, if James started using the service in January 2023, and his survival rate one month after the baseline date (January 31, 2023) is predicted to be 60%, this means an absolute survival rate of 60% one month after service start (a change from 100% to 60%).
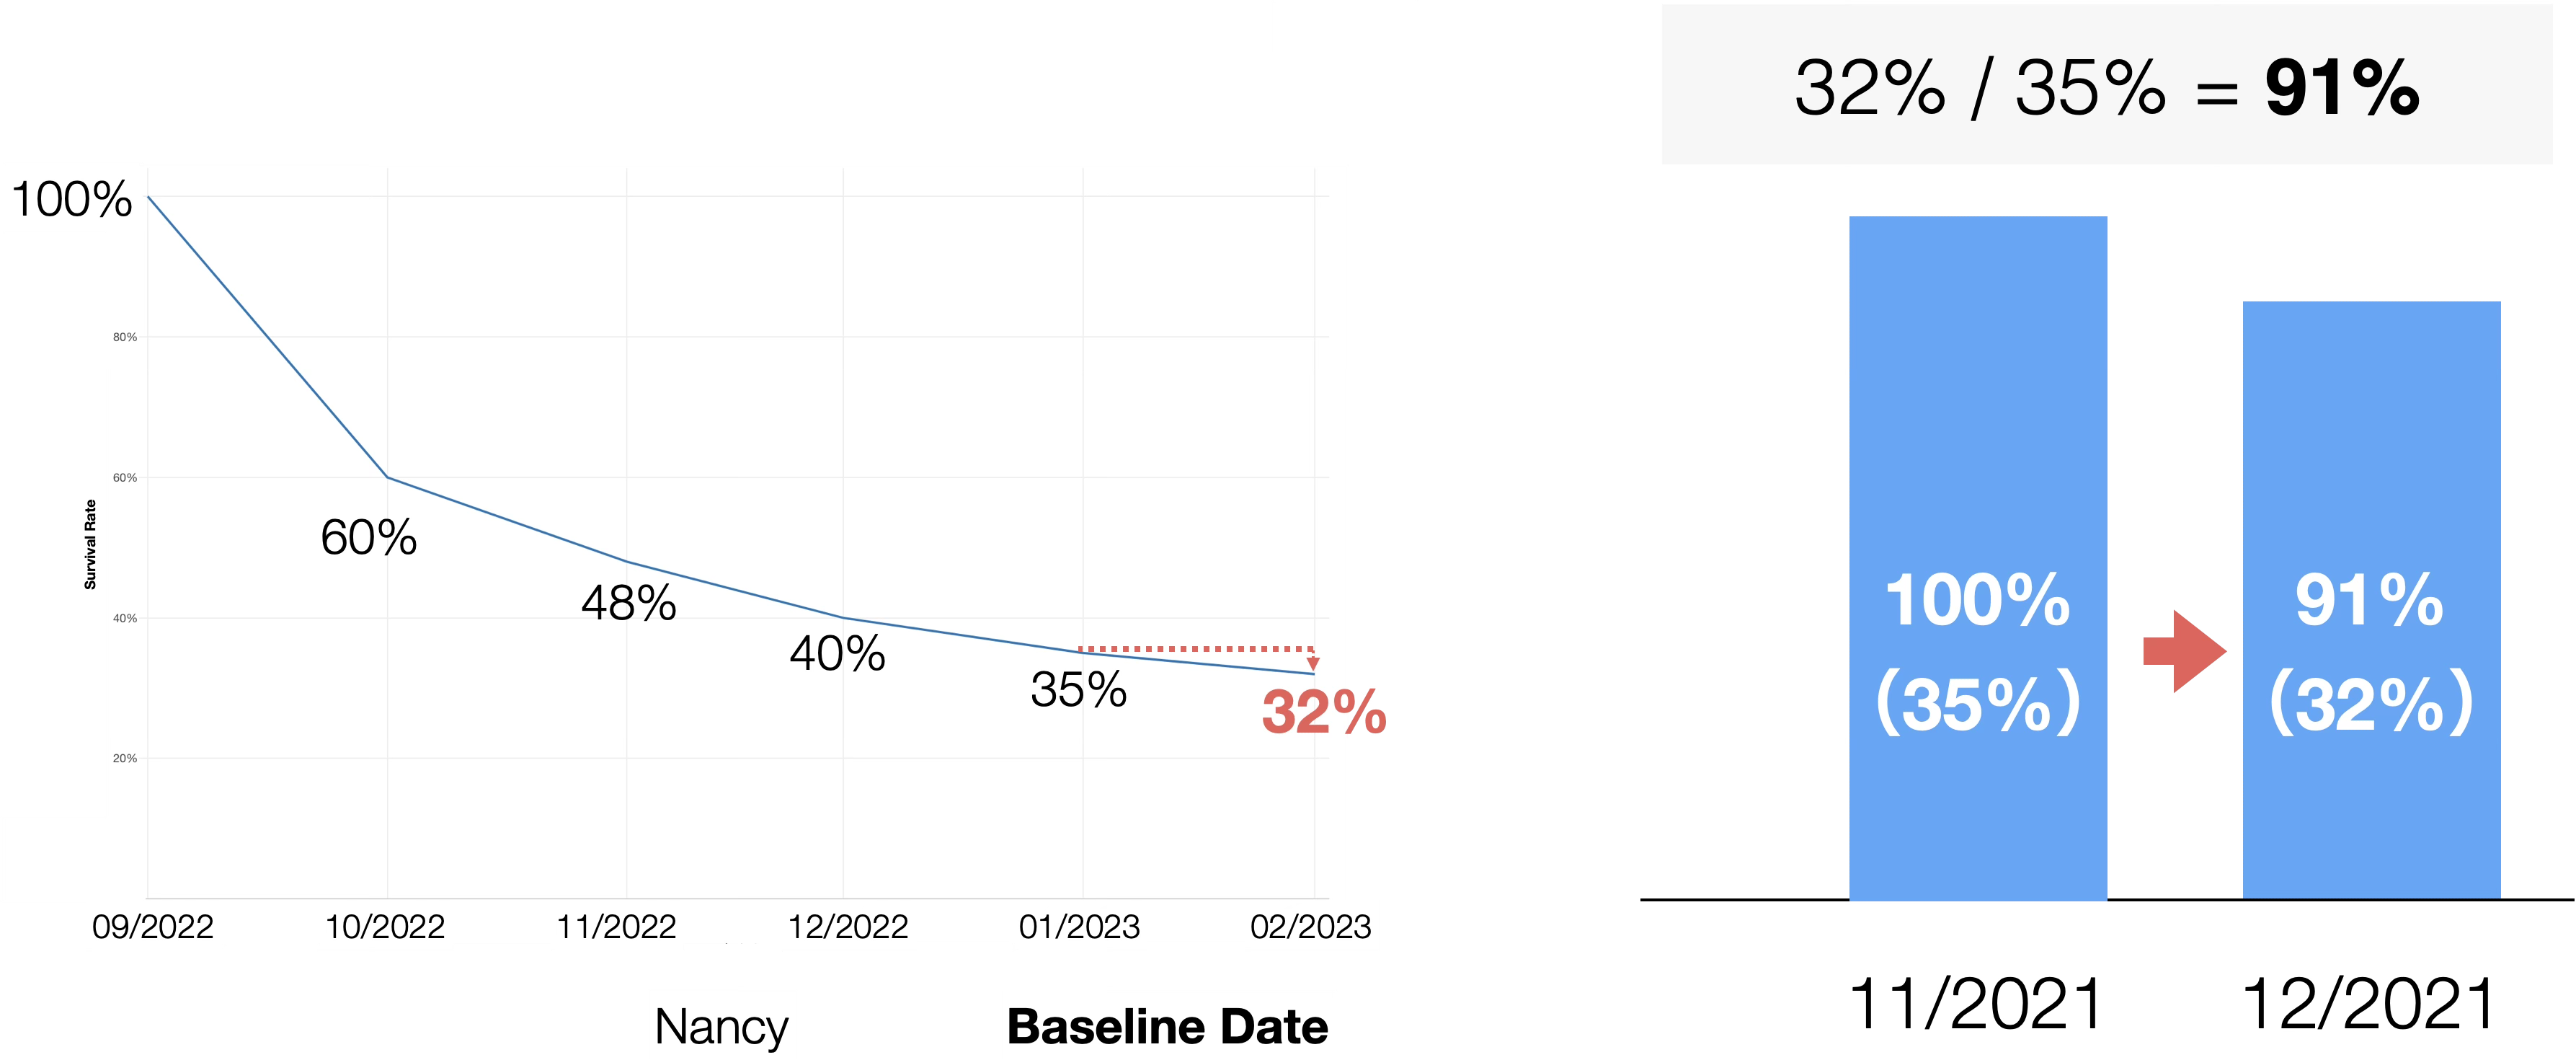
On the other hand, if Nancy started in September 2022 and has already been a customer for four months by the baseline date, his survival rate one month later is predicted to be 91%, assuming 100% survival at the baseline. This represents a change from 35% to 32% on the survival curve (32% / 35% = 91%).
Based on this interpretation, James’s first month survival rate is 40%, while Nancy’s is 91%, indicating James is at higher risk.
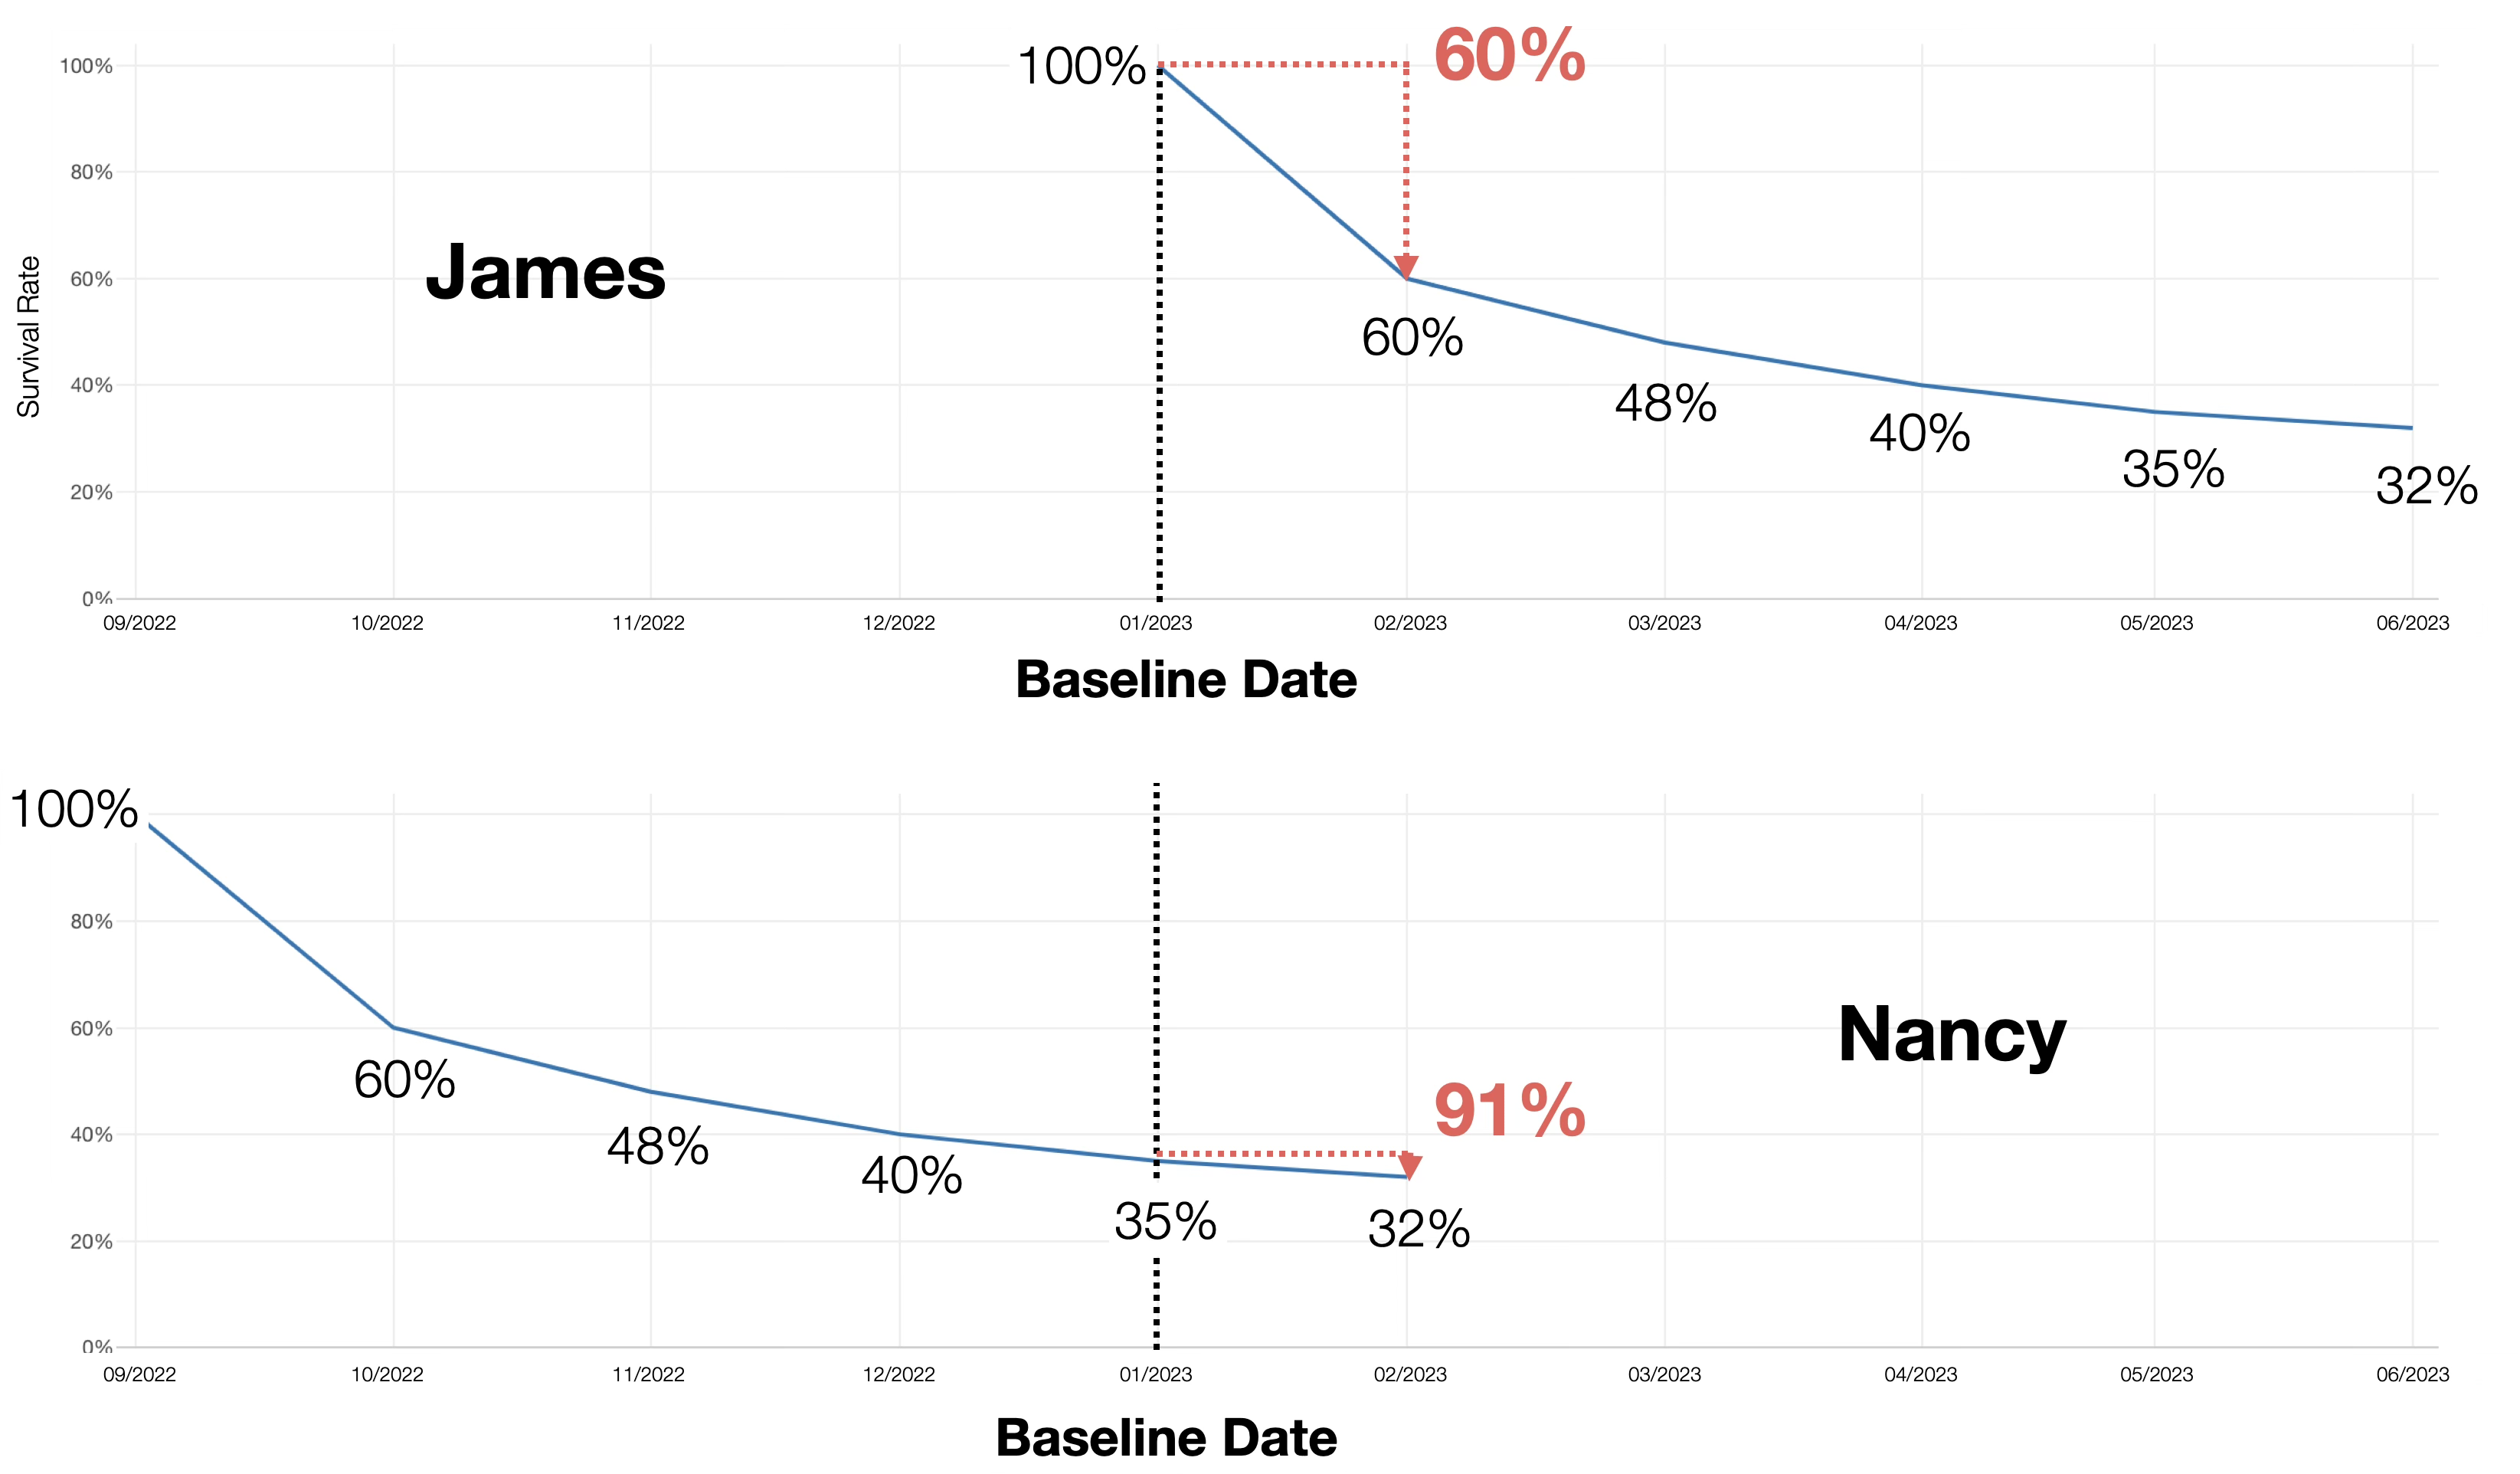
Thus, it’s crucial to understand that “Predicted Survival Rate” refers to the “survival rate from the baseline date.”
Predicting the Date for a Specific Survival Rate
Next, we will set up how to predict the date when a customer reaches a specific survival rate.
This is useful for setting action rules, such as “start follow-up when the survival rate drops below 60%.”
Reopen the prediction step, check “Date for Specific Survival Rate” as the prediction type, and enter “0.6” (60%) as the survival rate threshold.
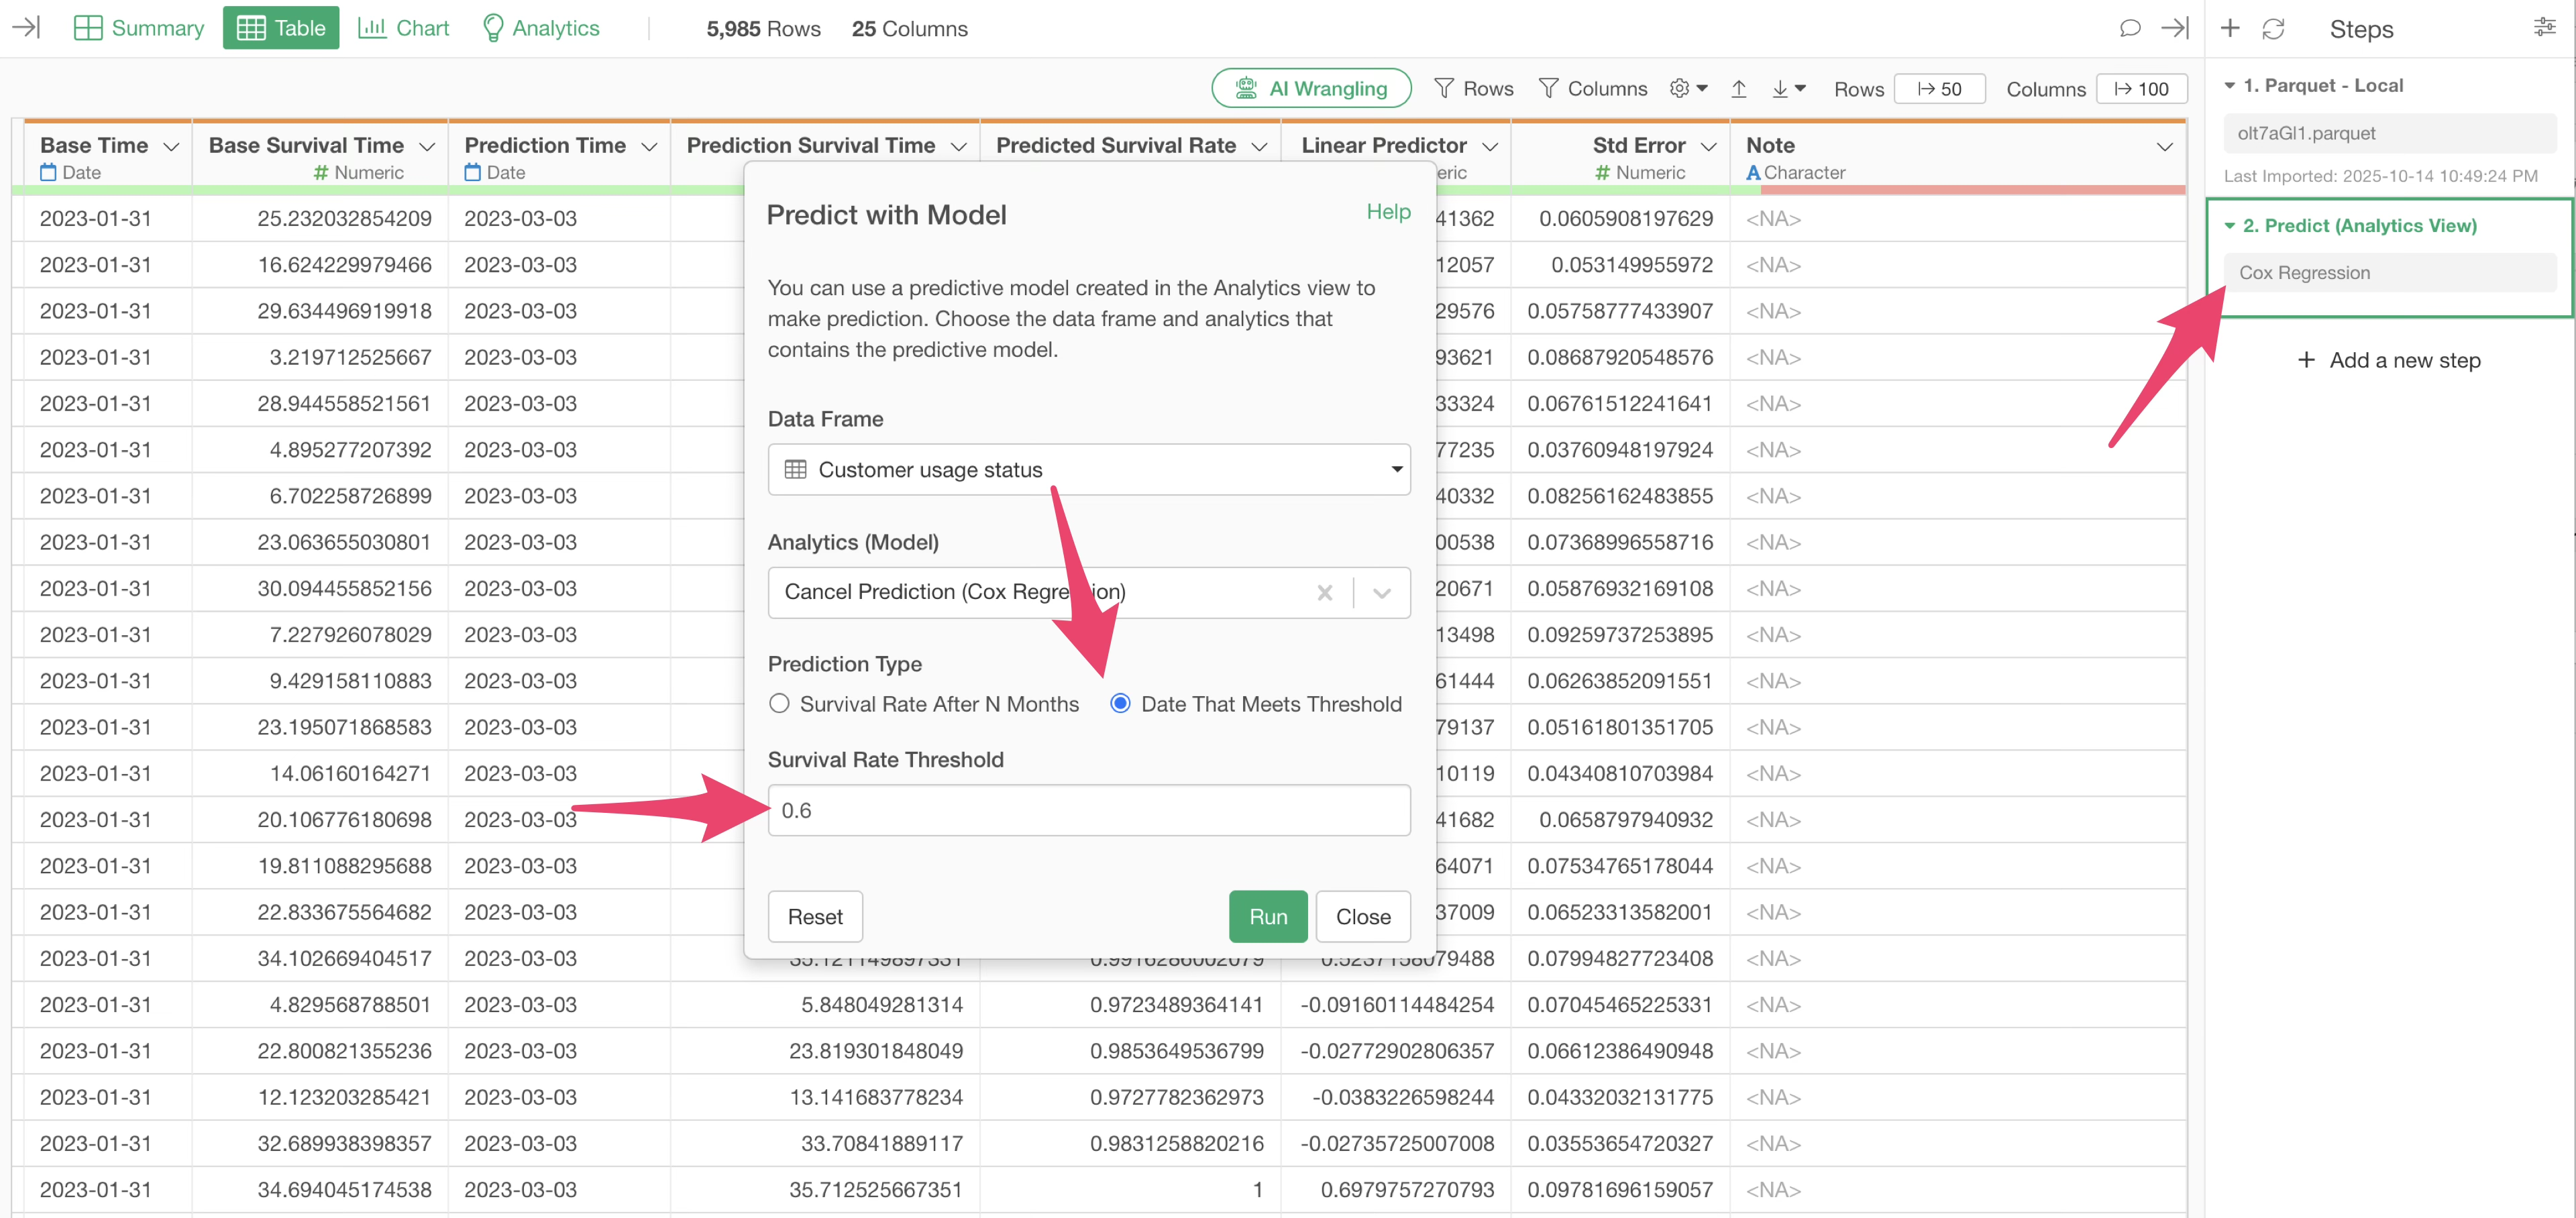
Click the “Run” button, and new columns will be added.
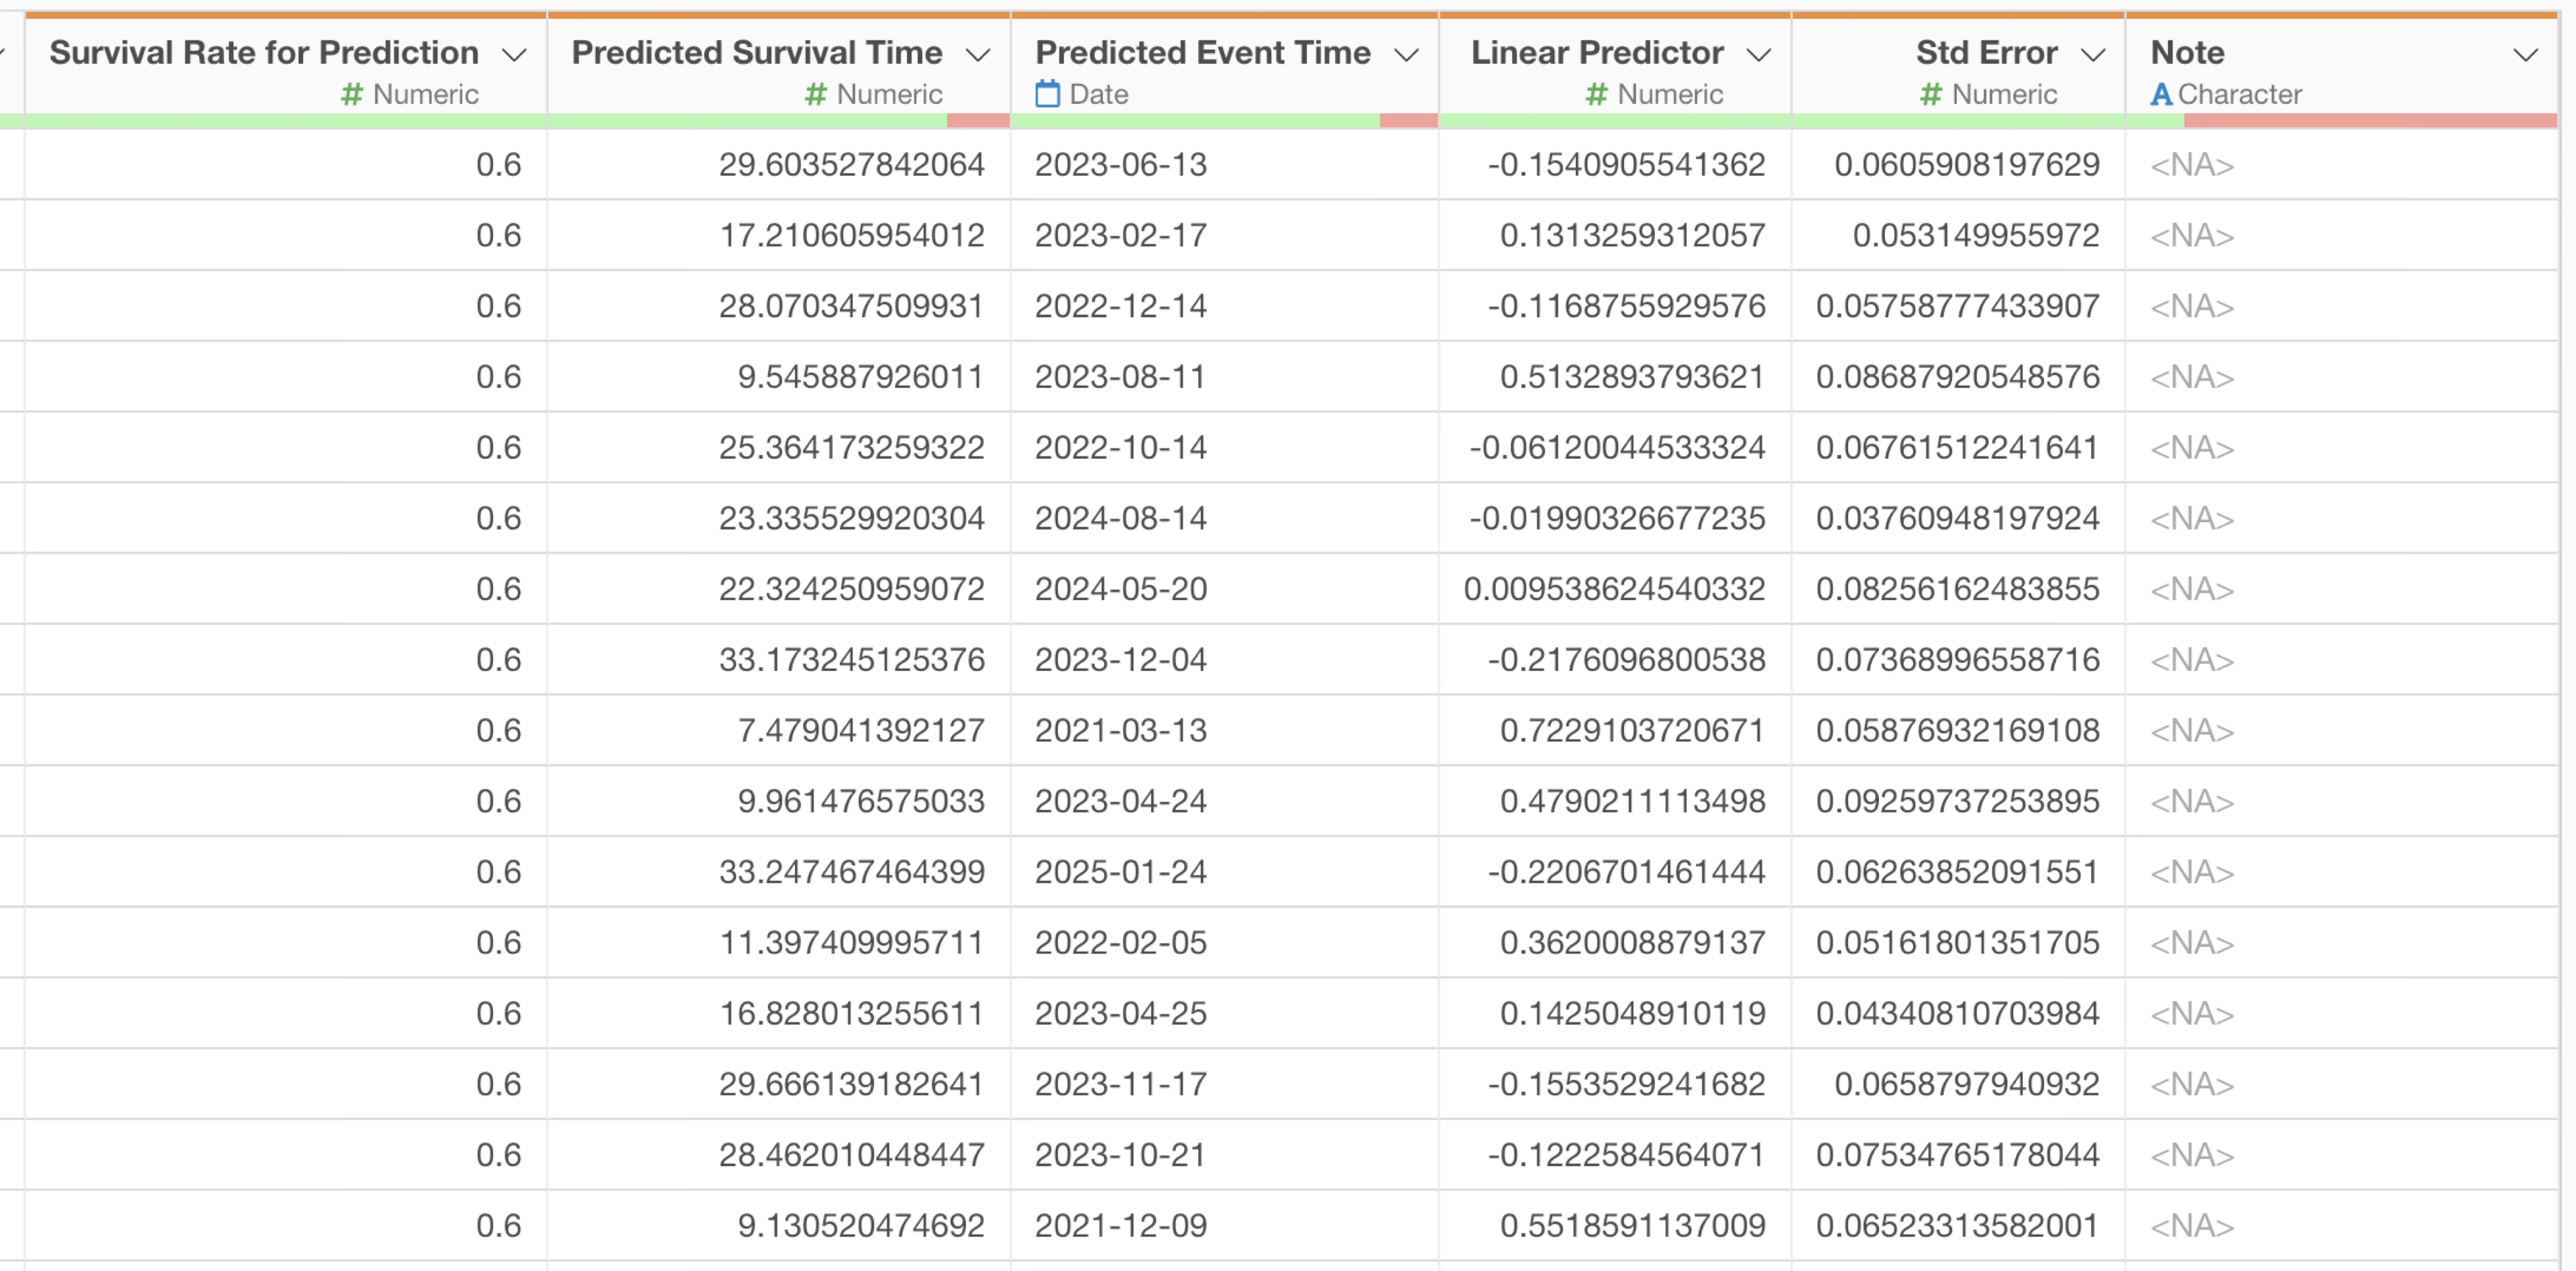
The added columns include:
- Survival Rate for Prediction: The specified survival rate (60%).
- Predicted Survival Time: The survival period until the specified survival rate is reached.
- Predicted Event Time: The date when the specified survival rate is reached.
- Linear Predictor: A risk score. Higher values indicate a higher relative event rate and a lower survival rate.
- Stdard Error: The standard error of the Linear Predictor.
This prediction allows you to identify individual follow-up timings, considering each customer’s unique survival curve shape and service start date.
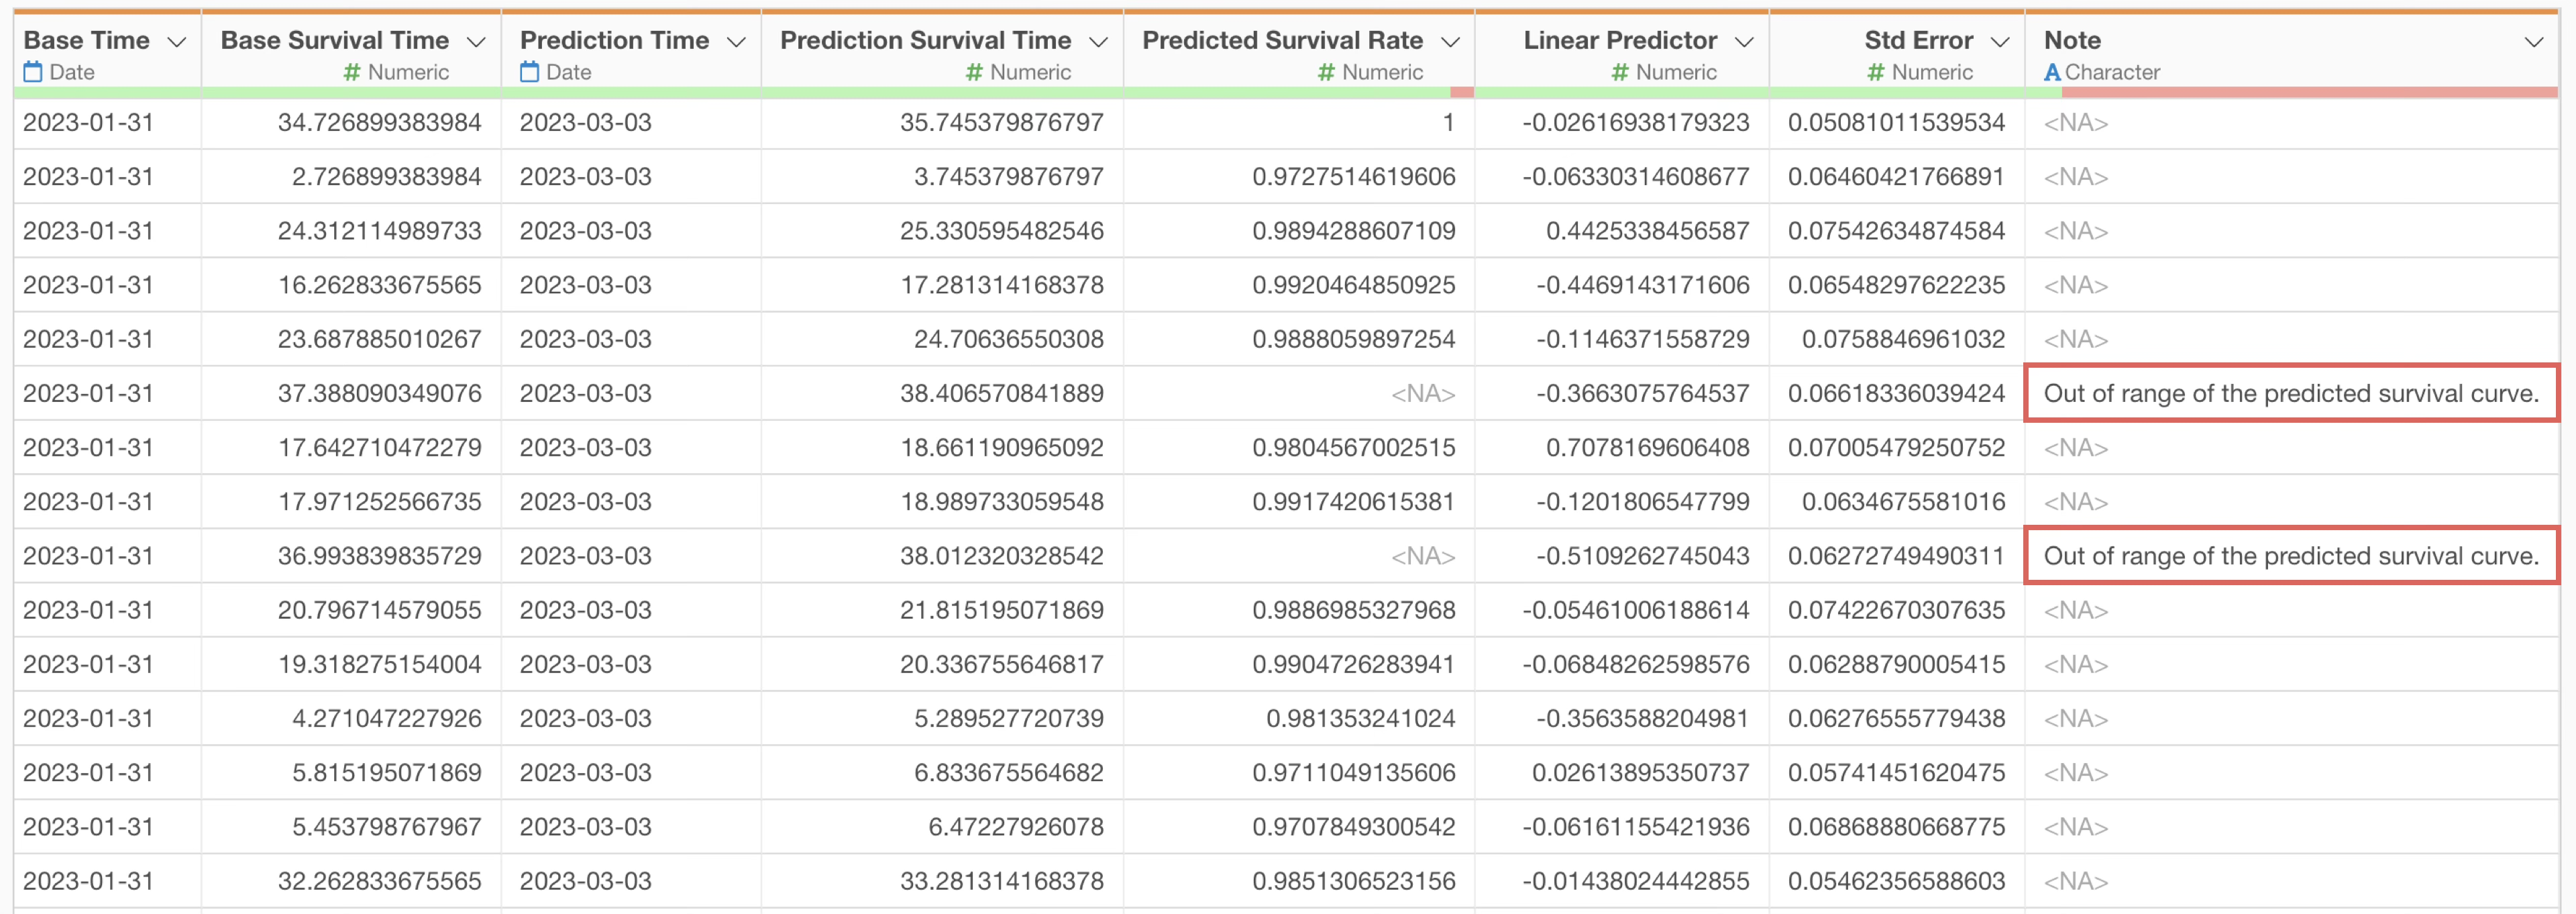
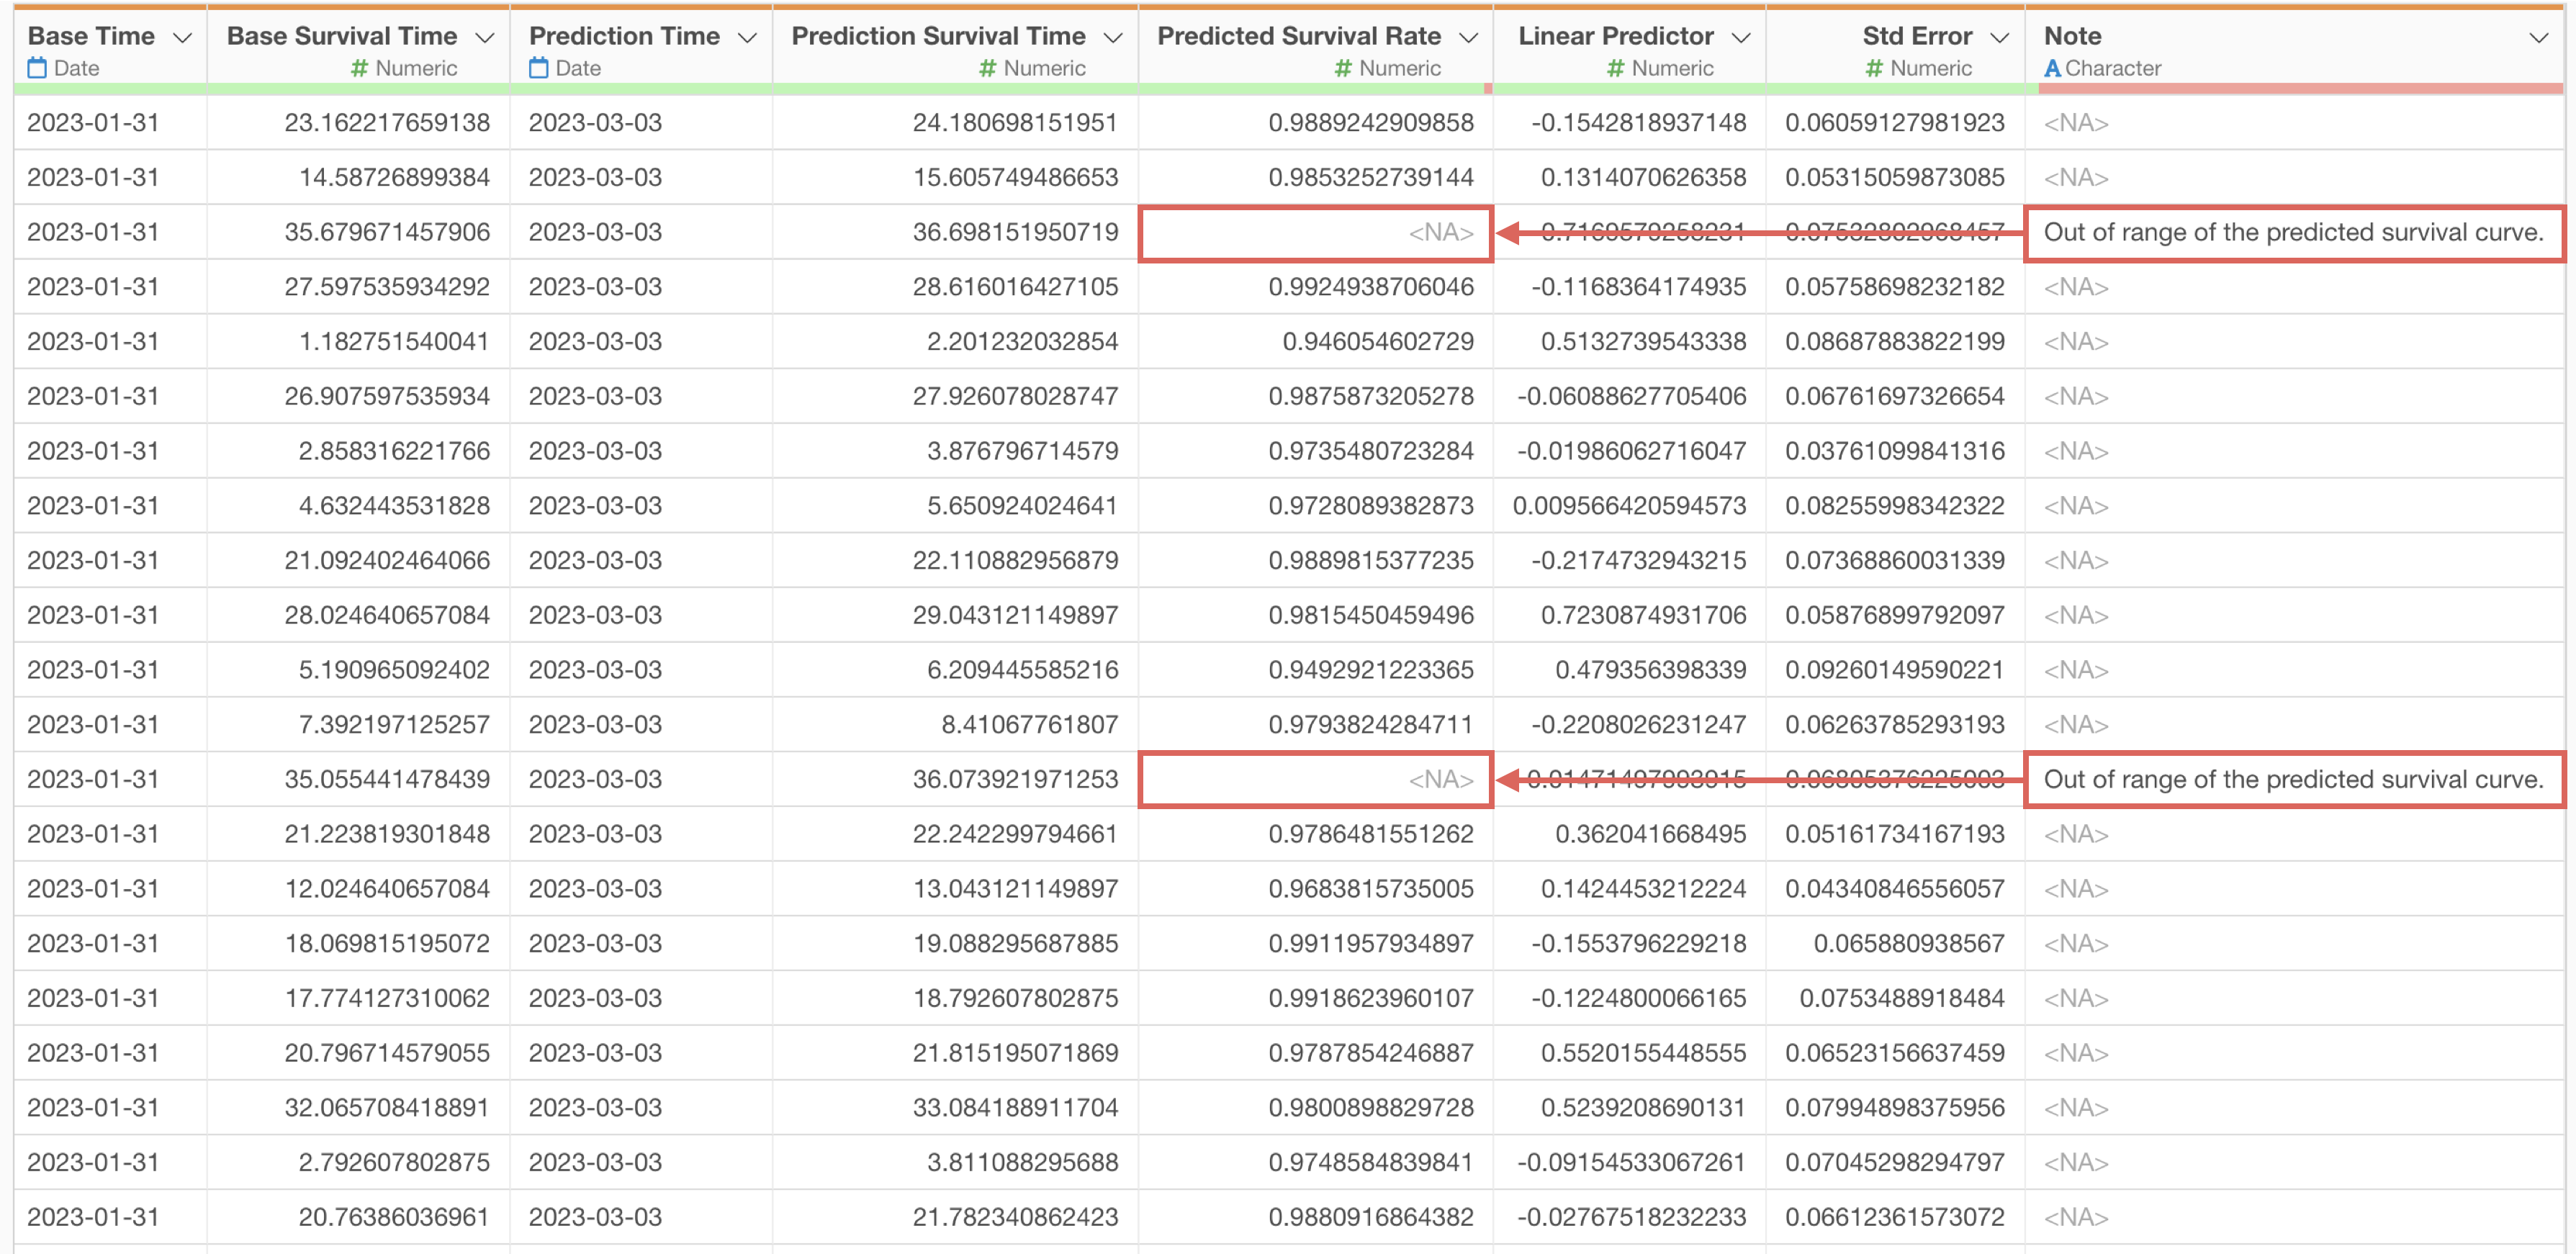
Prediction Limitations
When reviewing prediction results, you might see specific messages in the note column.

N-Month Survival Rate
“Out of range…” is a message that may appear when predicting the N-month survival rate.
This occurs when the customer’s usage period exceeds the maximum period of the model’s training data (in this case, 35 months).
 For
example, for customers who have been using the service for 36 months or
more, the prediction period is exceeded, so the survival rate cannot be
predicted, and the corresponding
For
example, for customers who have been using the service for 36 months or
more, the prediction period is exceeded, so the survival rate cannot be
predicted, and the corresponding Predicted Survival Rate
value will be NA.
Date for Specific Survival Rate
“Don’t meet the threshold” is a message that may appear when predicting the date for a specific survival rate.
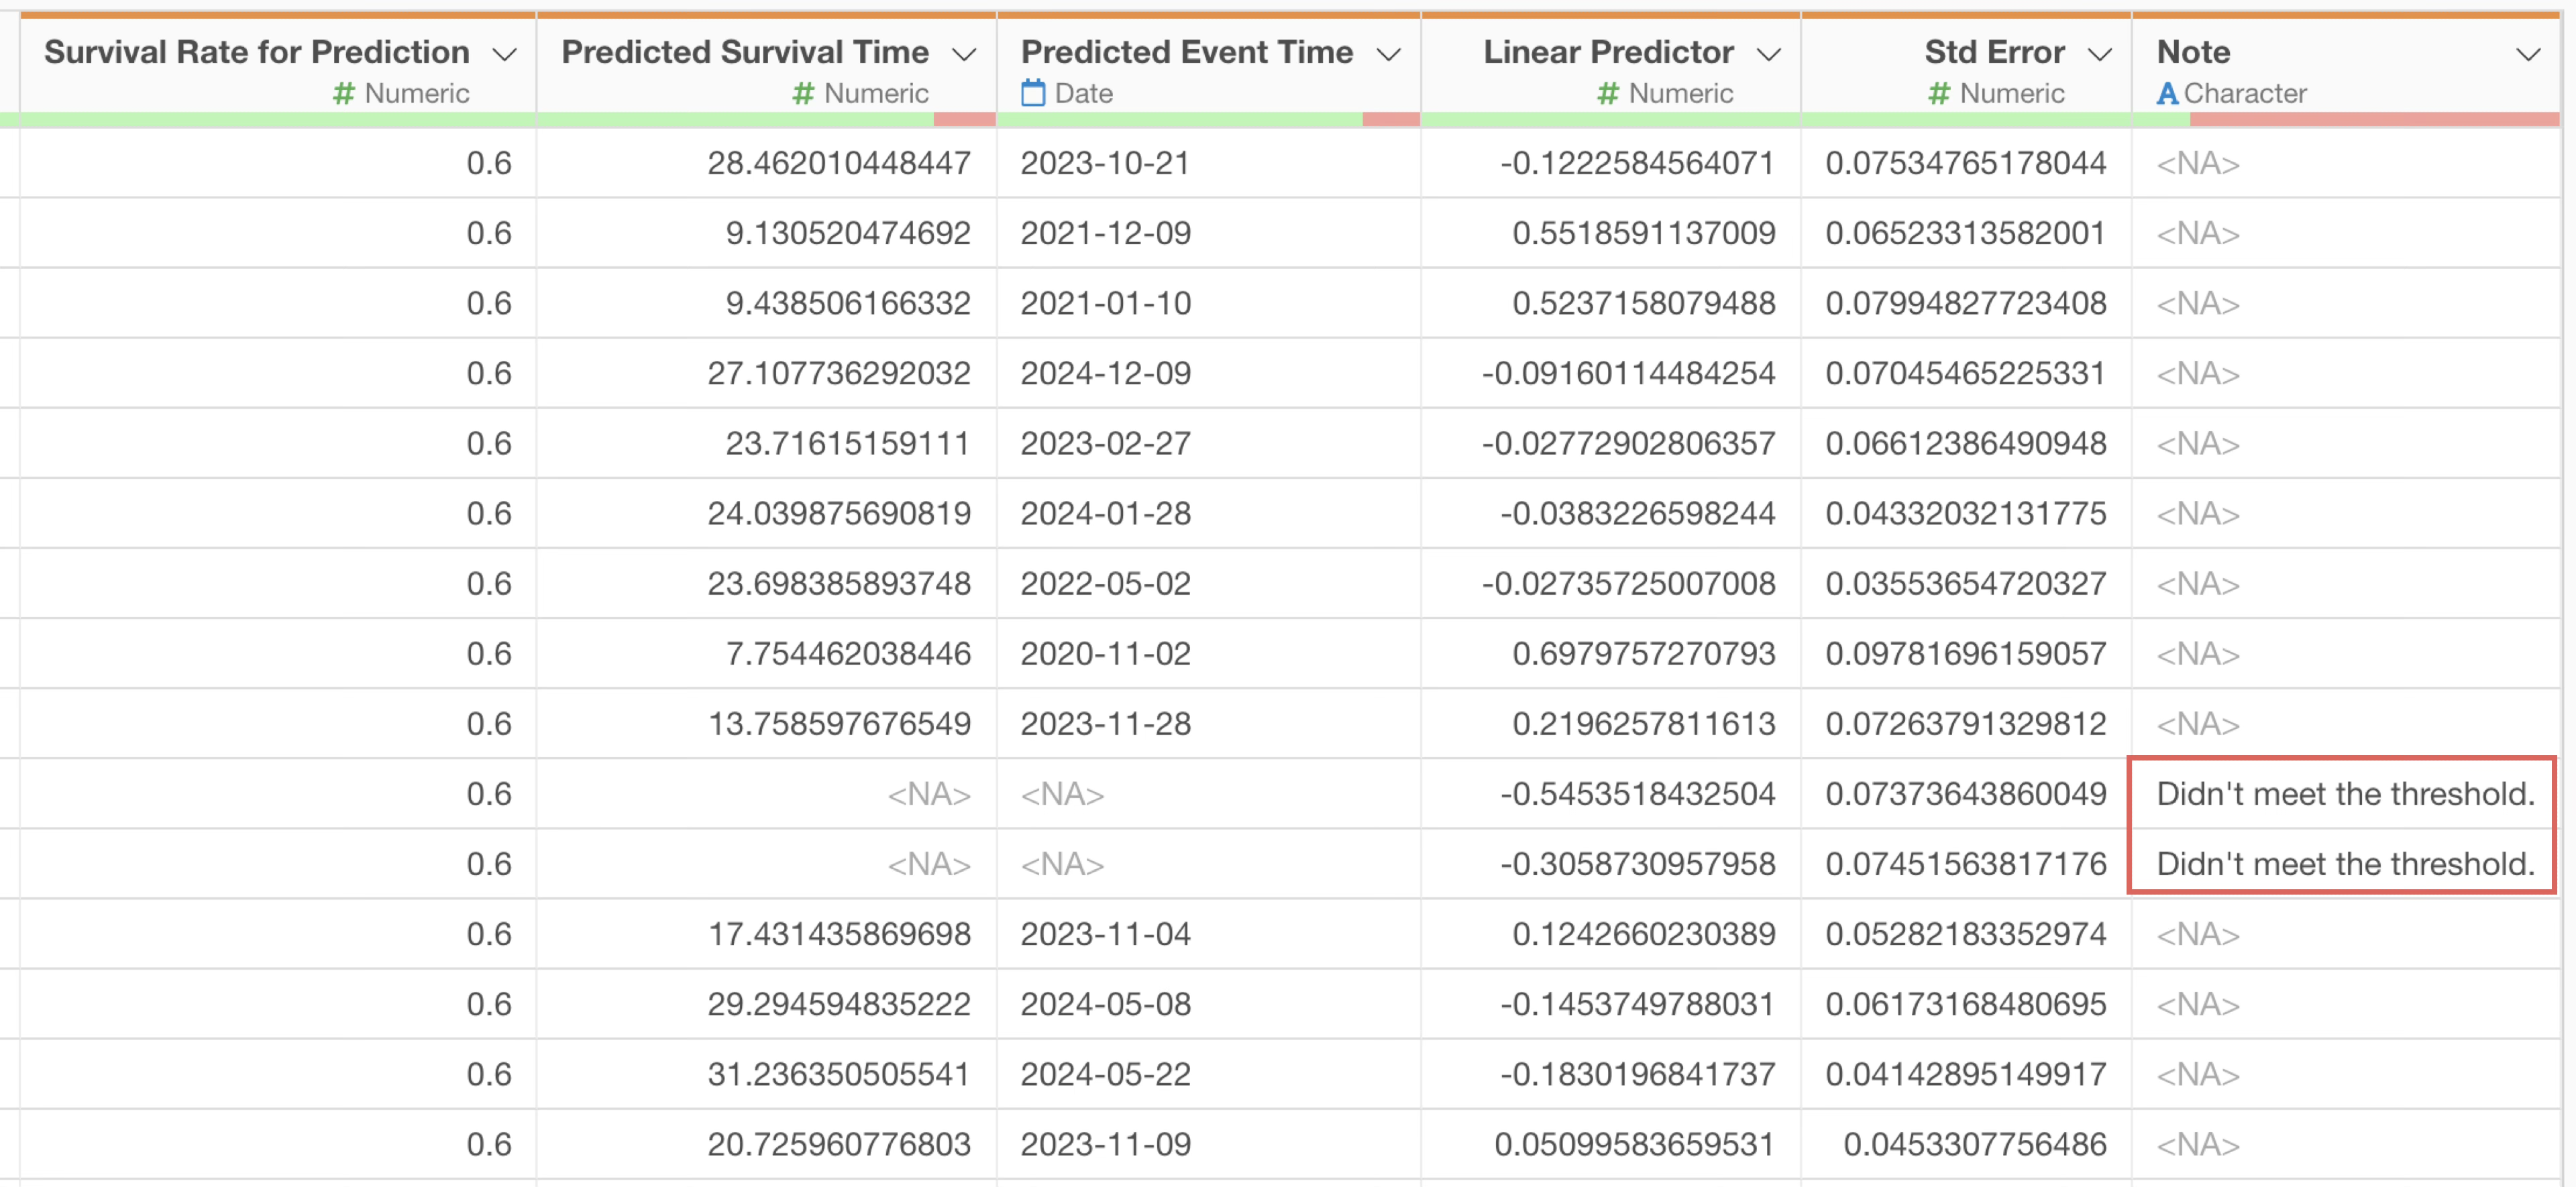
This message appears if the specified survival rate threshold is not reached within the predictable period.
By understanding these limitations and setting appropriate prediction periods and thresholds, you can effectively predict future cancellation risks for active customers and plan timely follow-up actions.
References
- Online Seminar #45 - Cohort Analysis Part 4 - Analyzing What Makes Churn with Prediction Models - Link