SaaS KPI Series - Churn Rate/Retention Rate
In SaaS businesses, churn and retention are critical metrics that indicate the continuity of customer usage. Churn refers to existing customers canceling and stopping their service usage, while retention represents the opposite - customers continuing to use the service.
Since retaining existing customers is just as essential as acquiring new ones for sustainable growth in SaaS businesses, these metrics are particularly important for business leaders, product managers, and customer success teams, requiring regular monitoring.
Churn Rate
For SaaS business growth, it’s important not only to increase new customer conversions but also to reduce the number of churning customers or churn MRR.
To monitor this efficiency, we calculate the percentage of customers who have churned. This metric is called the churn (cancellation) rate.
Churn rate is calculated by dividing the number of customers who churned (canceled) during a specific period by the total number of customers in that period.
Retention Rate
While churn rate focuses on customer “cancellations”, we can also focus on customer “continuity”.
The continuation of service by customers is called retention, and the metric calculated by focusing on the number of customers is sometimes called the customer retention rate.
The only difference between retention rate and churn rate is whether you focus on customers who canceled or customers who continued the service, so they can be calculated in a similar way.
How to Calculate Churn Rate and Retention Rate
Here, I’ll introduce how to calculate churn rate and retention rate using actual data.
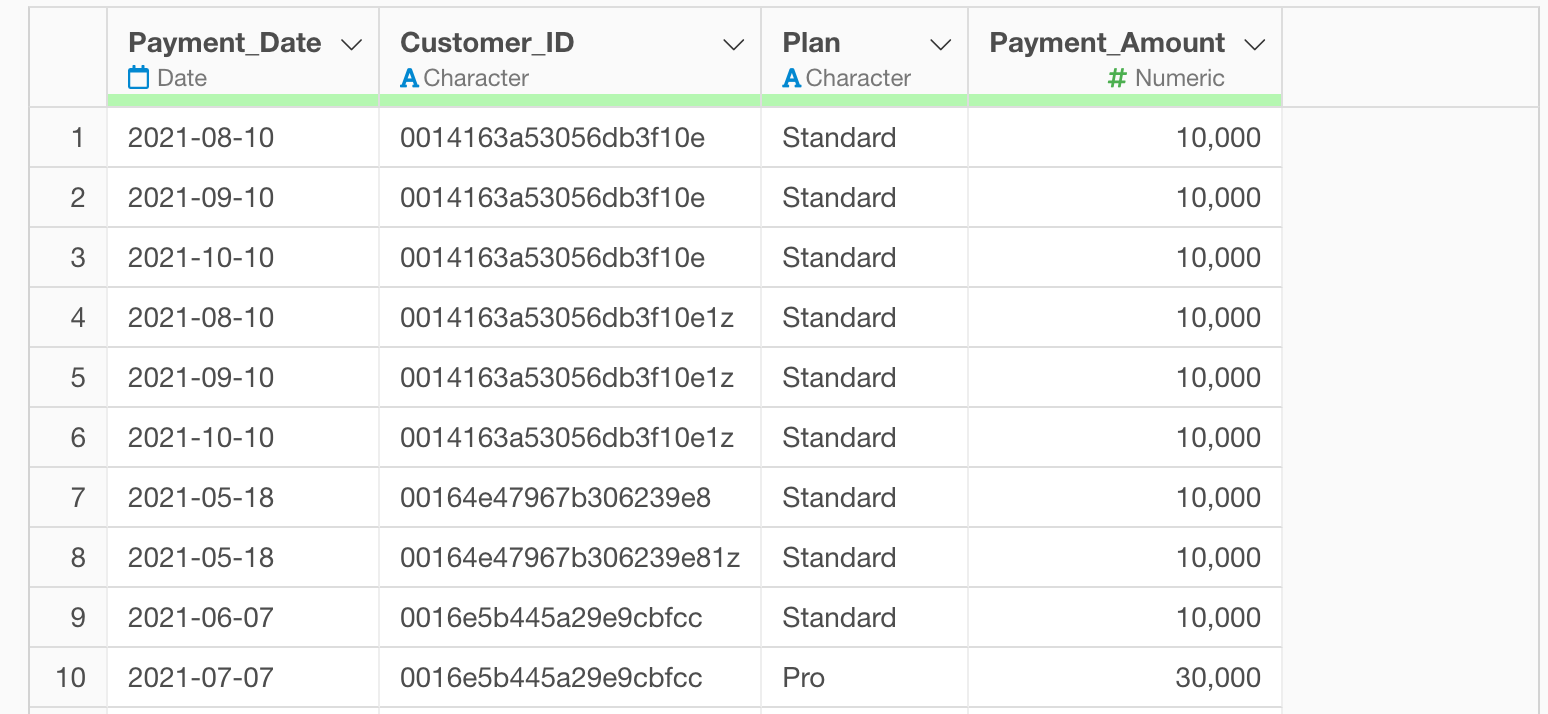
In this example, we’ll use payment data from a subscription business where each row represents one payment transaction, including Customer_ID, Payment_Date, Payment _Amount, and other information. (You can download the data from this page)
In Exploratory, there are two methods for creating metrics:
- AI Prompt: Creating metrics using natural language processing
- UI Menu: Creating metrics by processing data through menus accessible from the UI
This note will introduce both methods.
“AI Prompt” is only available for users with paid licenses such as Business Plan or Personal Plan, or users who are currently trialing these plans.
Also, AI Prompt is only available when your device is connected to the internet.
If you are not using the above plans or are using a device not connected to the internet, please proceed to the “Calculate Churn Rate and Retention Rate with UI” section.
Calculate Churn Rate and Retention Rate with AI Prompt
In this section, you’ll learn how to create metrics using the AI Prompt feature. (For more details about AI Prompt, see this guide.)
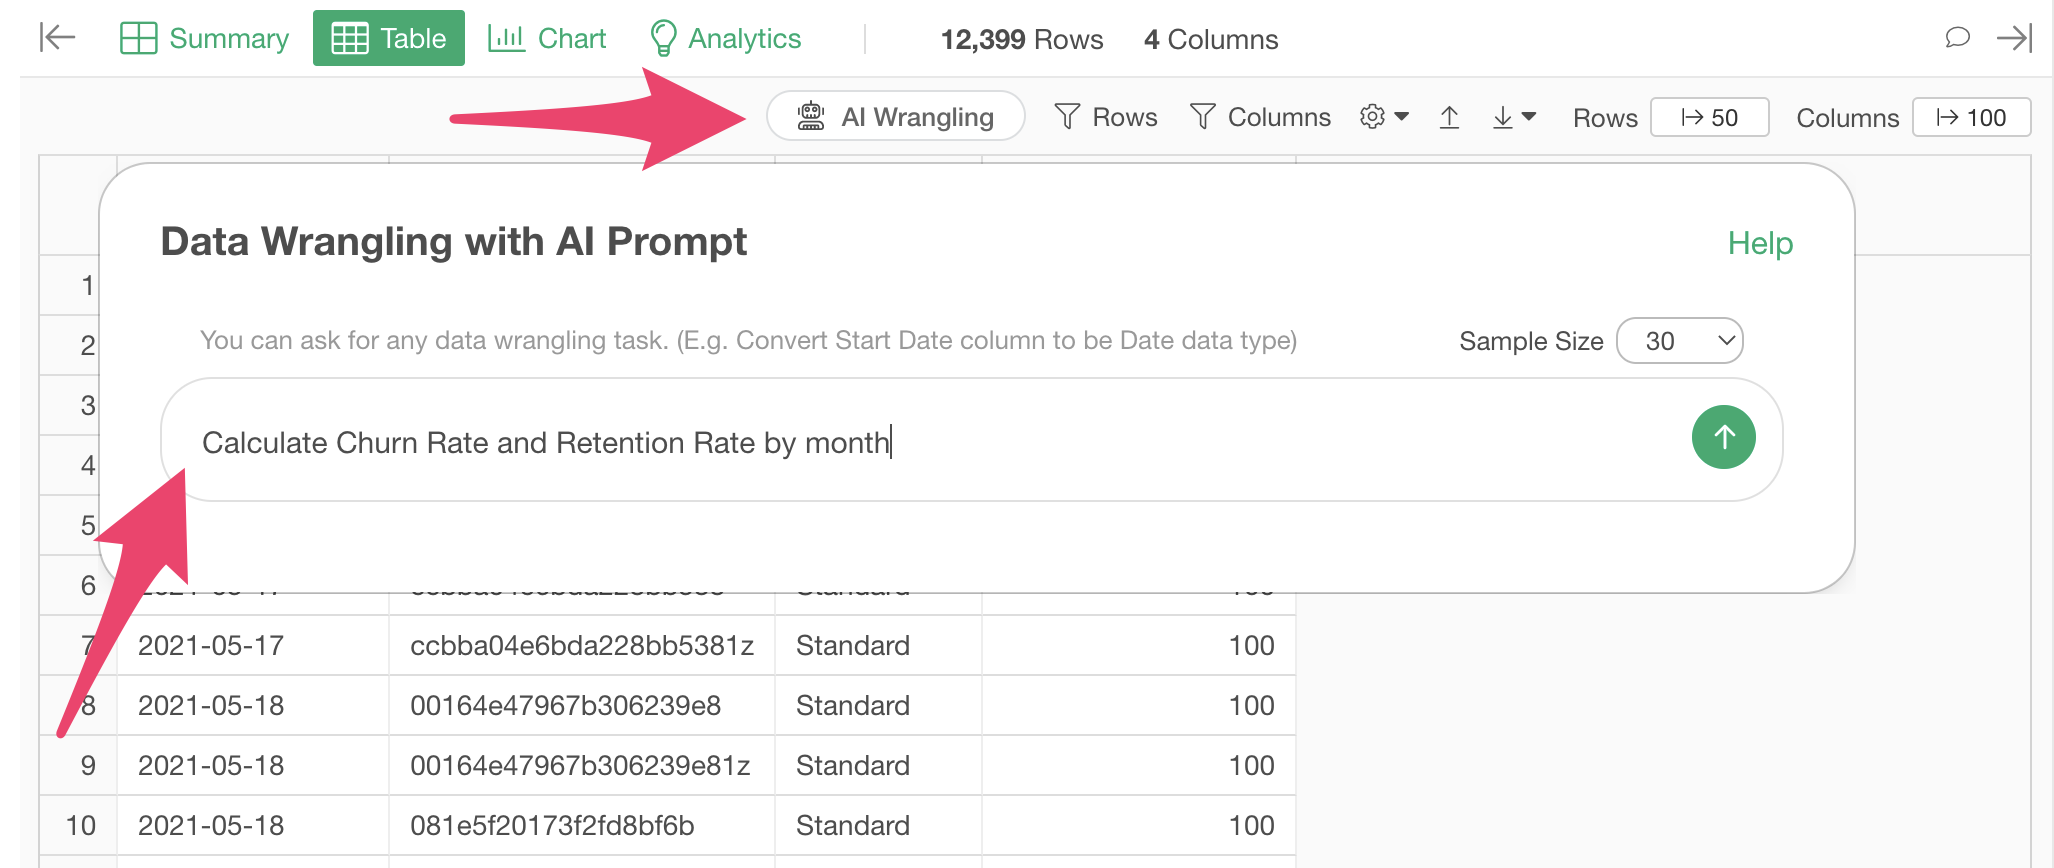
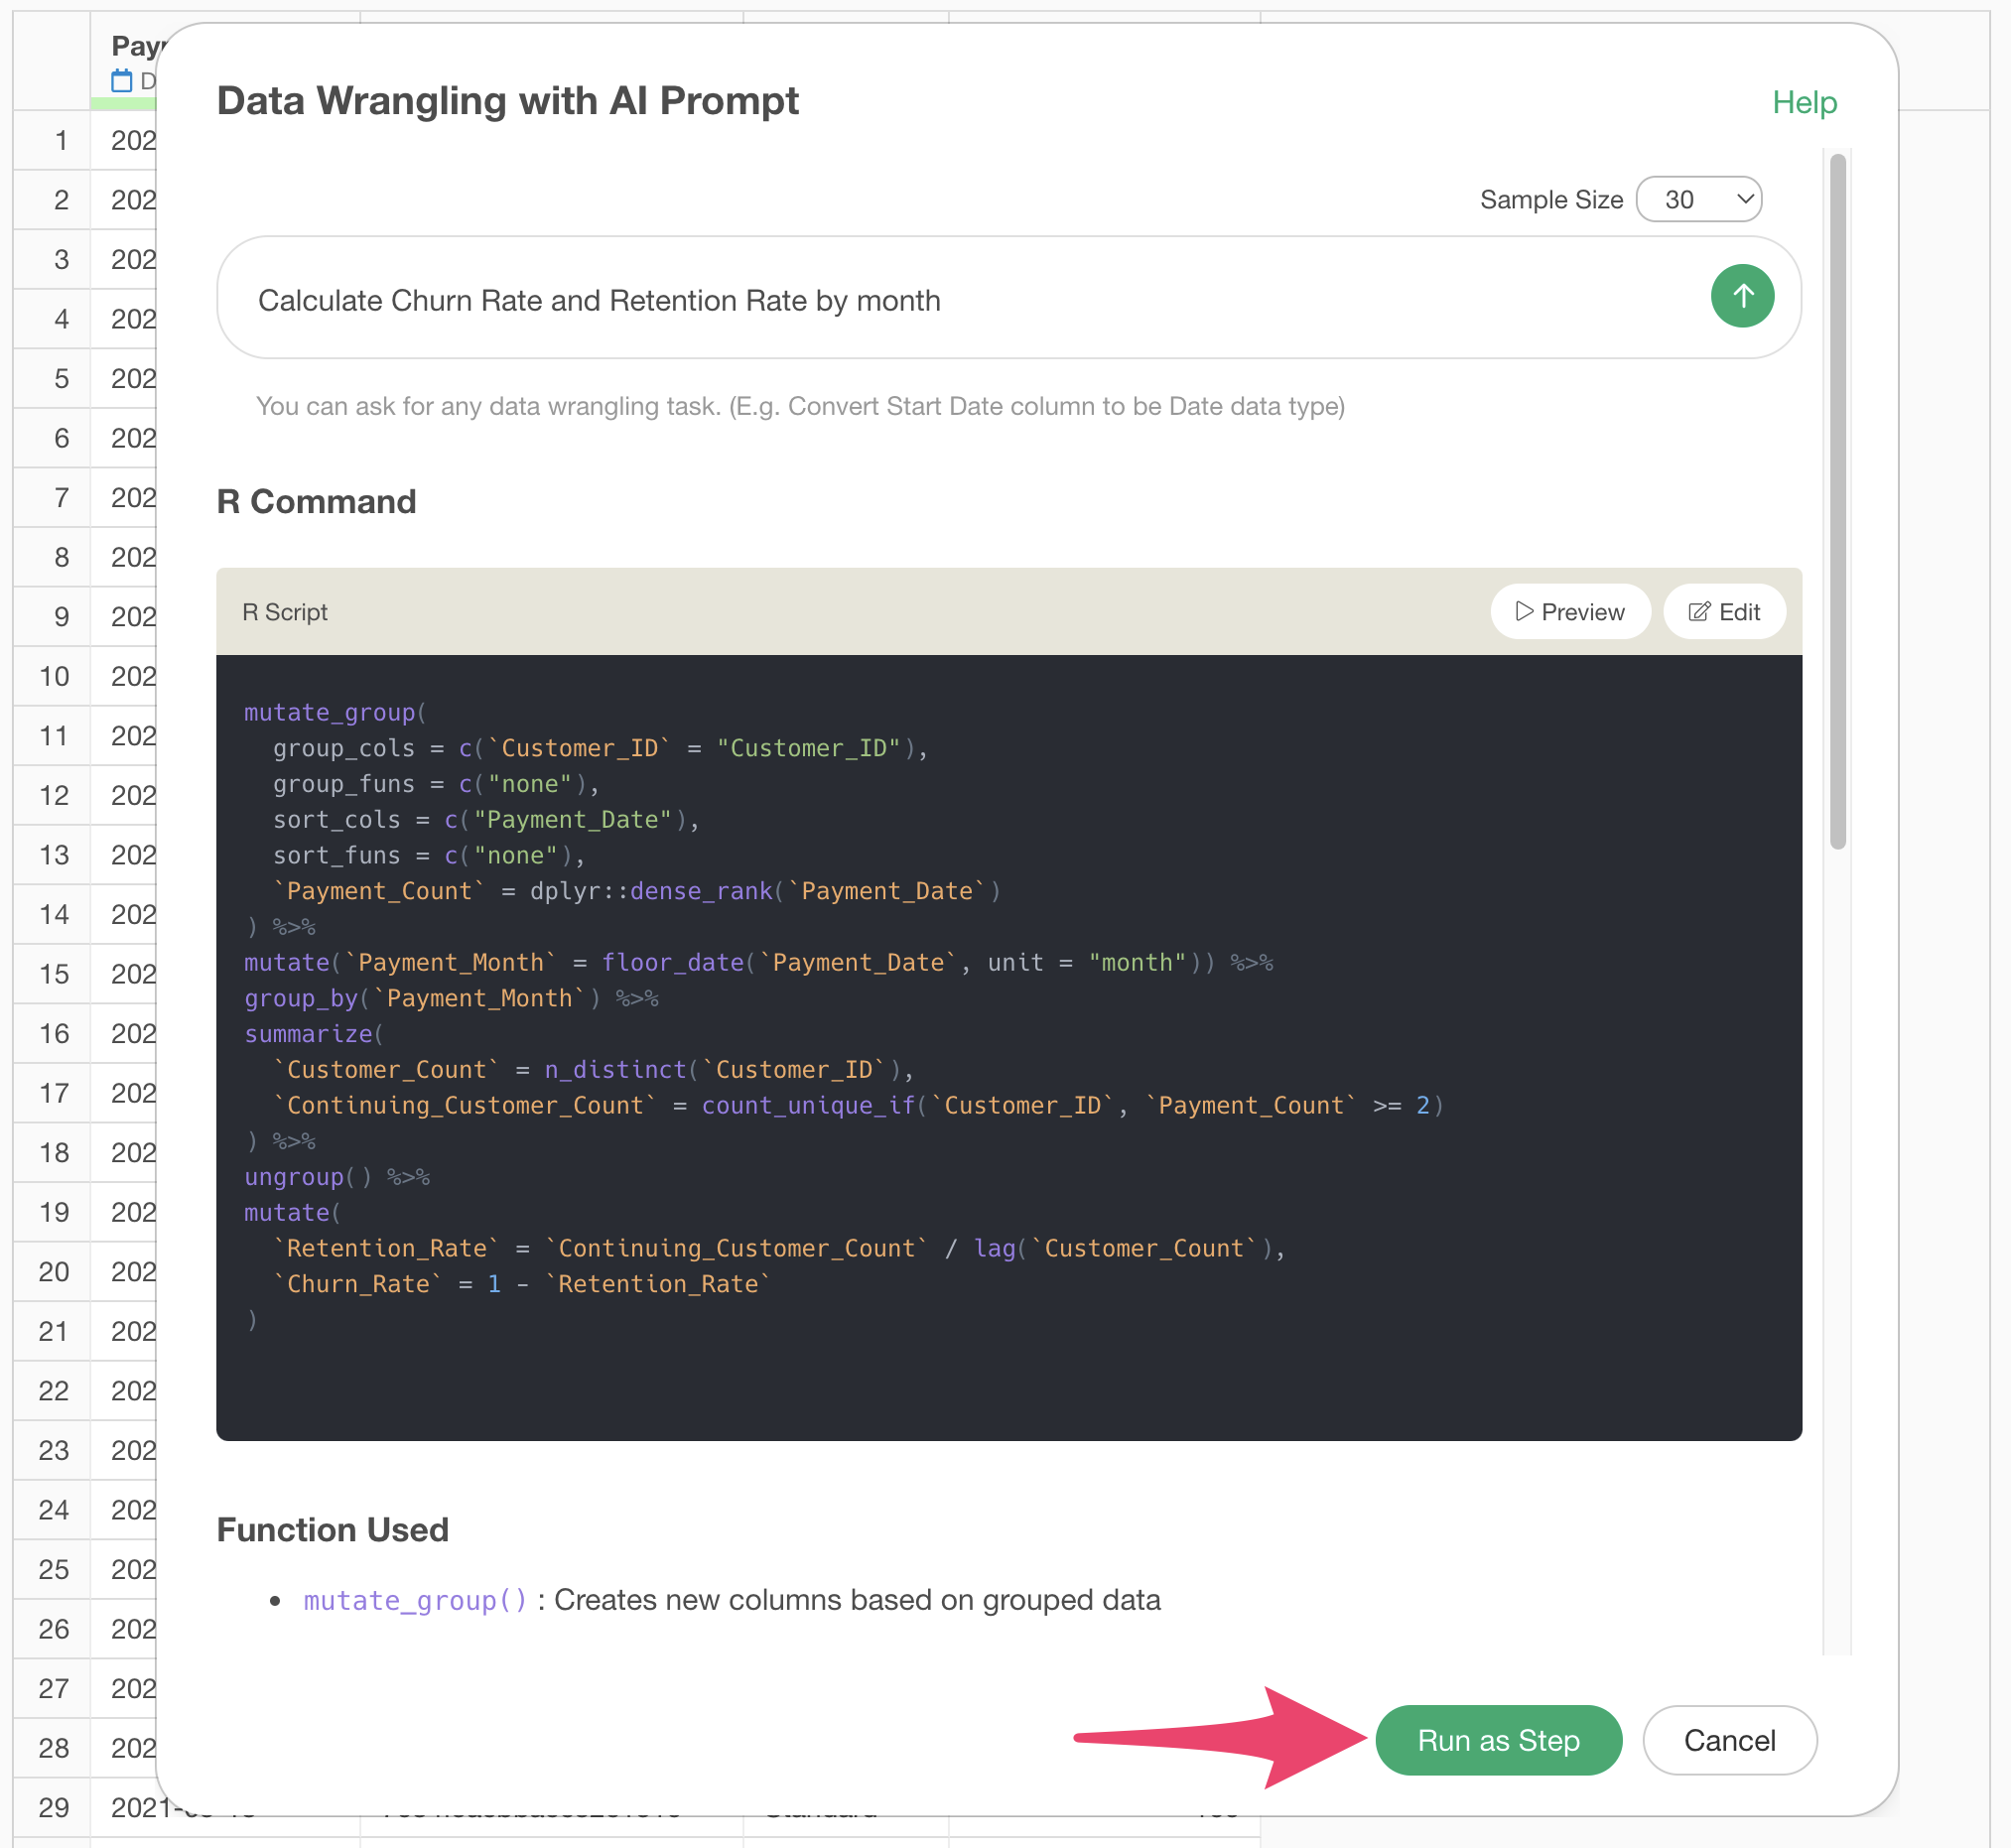
Click the “AI Wrangling” button. When the AI Prompt dialog appears, enter a prompt like the one below and run it:
Calculate Churn Rate and Retention Rate by month
Code to calculate churn rate and retention rate will be generated. Check the results and click the “Run as Step” button.
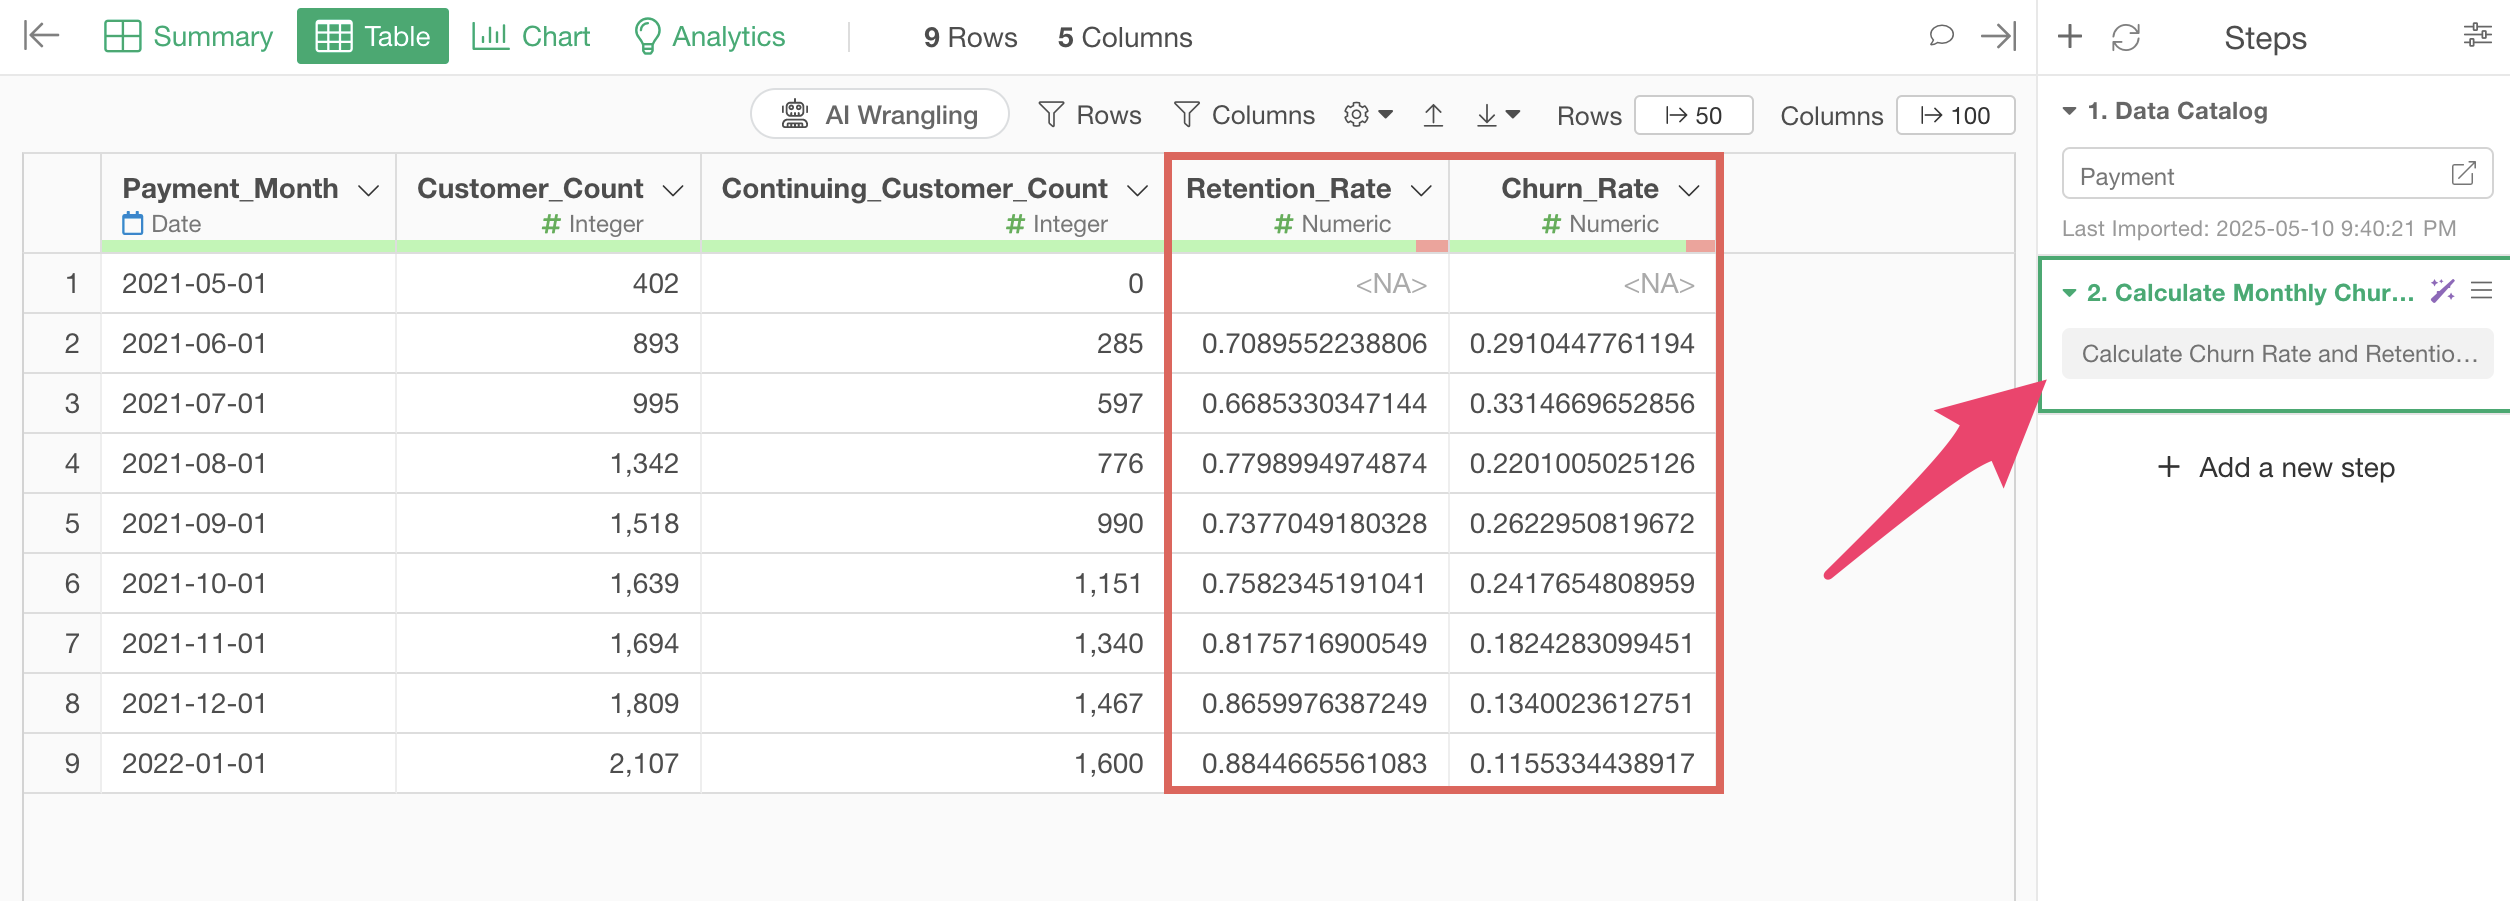
The step is added, and churn rate and retention rate are calculated.
Calculate Churn Rate and Retention Rate with UI
Here’s how to calculate churn rate and retention rate using the UI.
When using payment data like this, you can calculate with the following steps:
- Calculate the number of payments per customer
- Aggregate the number of customers and continuing(retained) customers by month
- Calculate retention rate
- Calculate churn rate
1. Calculate the number of payments per customer
To calculate the retention rate, you need to prepare aggregated data of “number of customers” and “number of continuing customers” each month.
Calculating the “number of customers” each month is easy, but calculating the “number of continuing customers” requires a bit of technique.
Specifically, you need to calculate the number of payments for each customer in advance.
This is because if you know the “number of payments” for each customer, you can calculate the “number of continuing customers” by counting customers who have made their second or subsequent payments each month.
To do this, first calculate the number of payments for each customer.
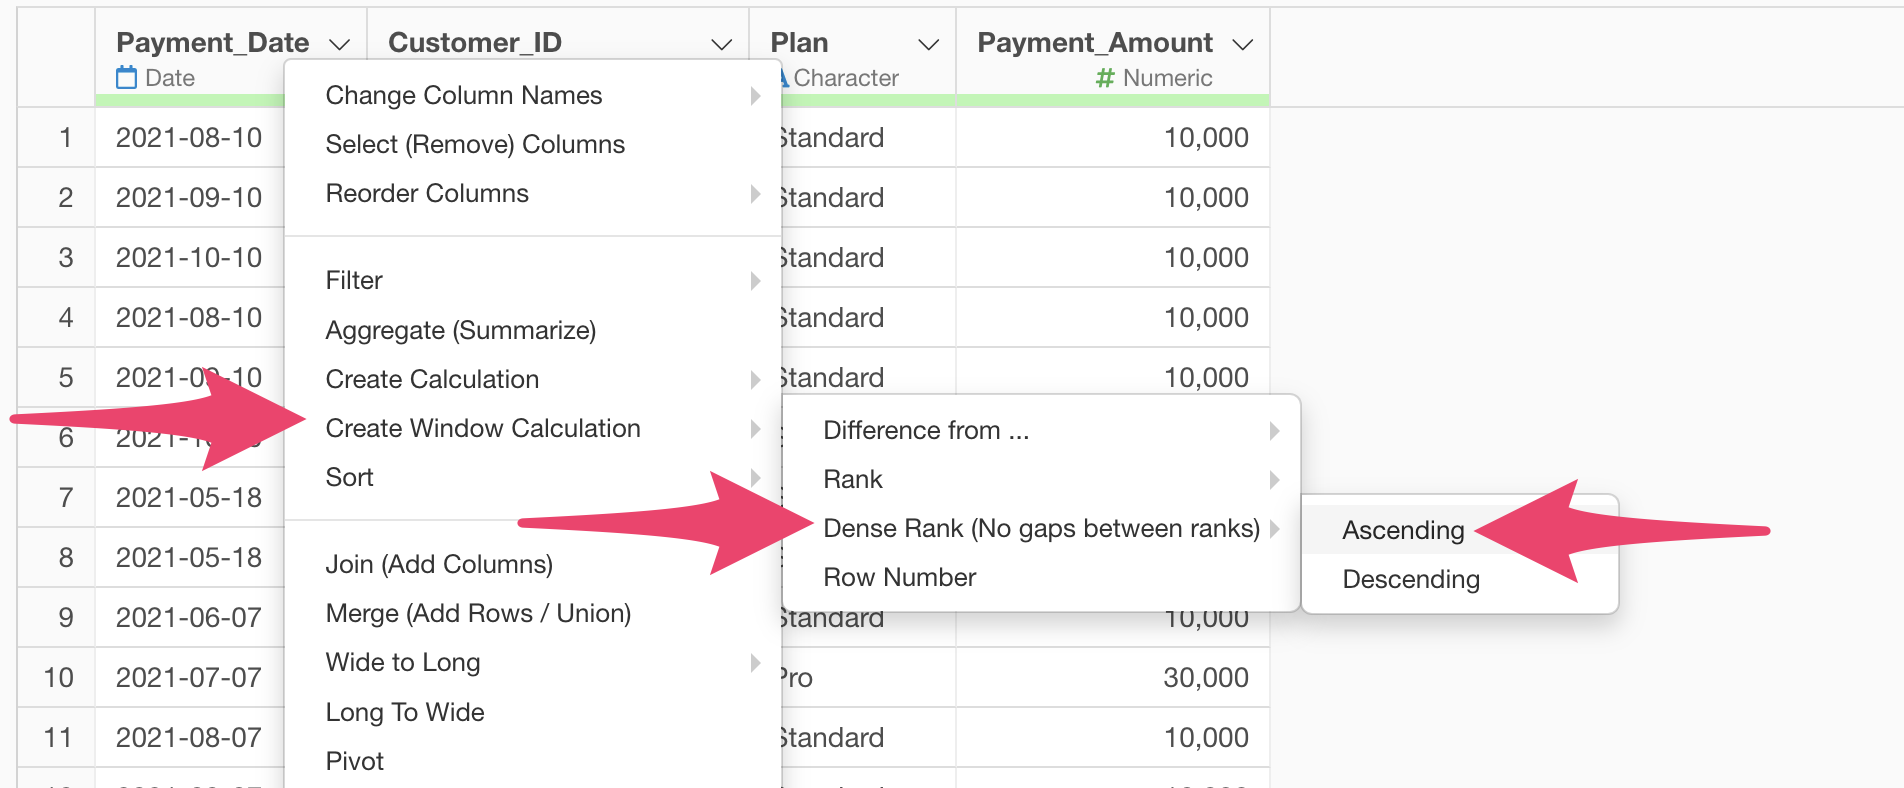
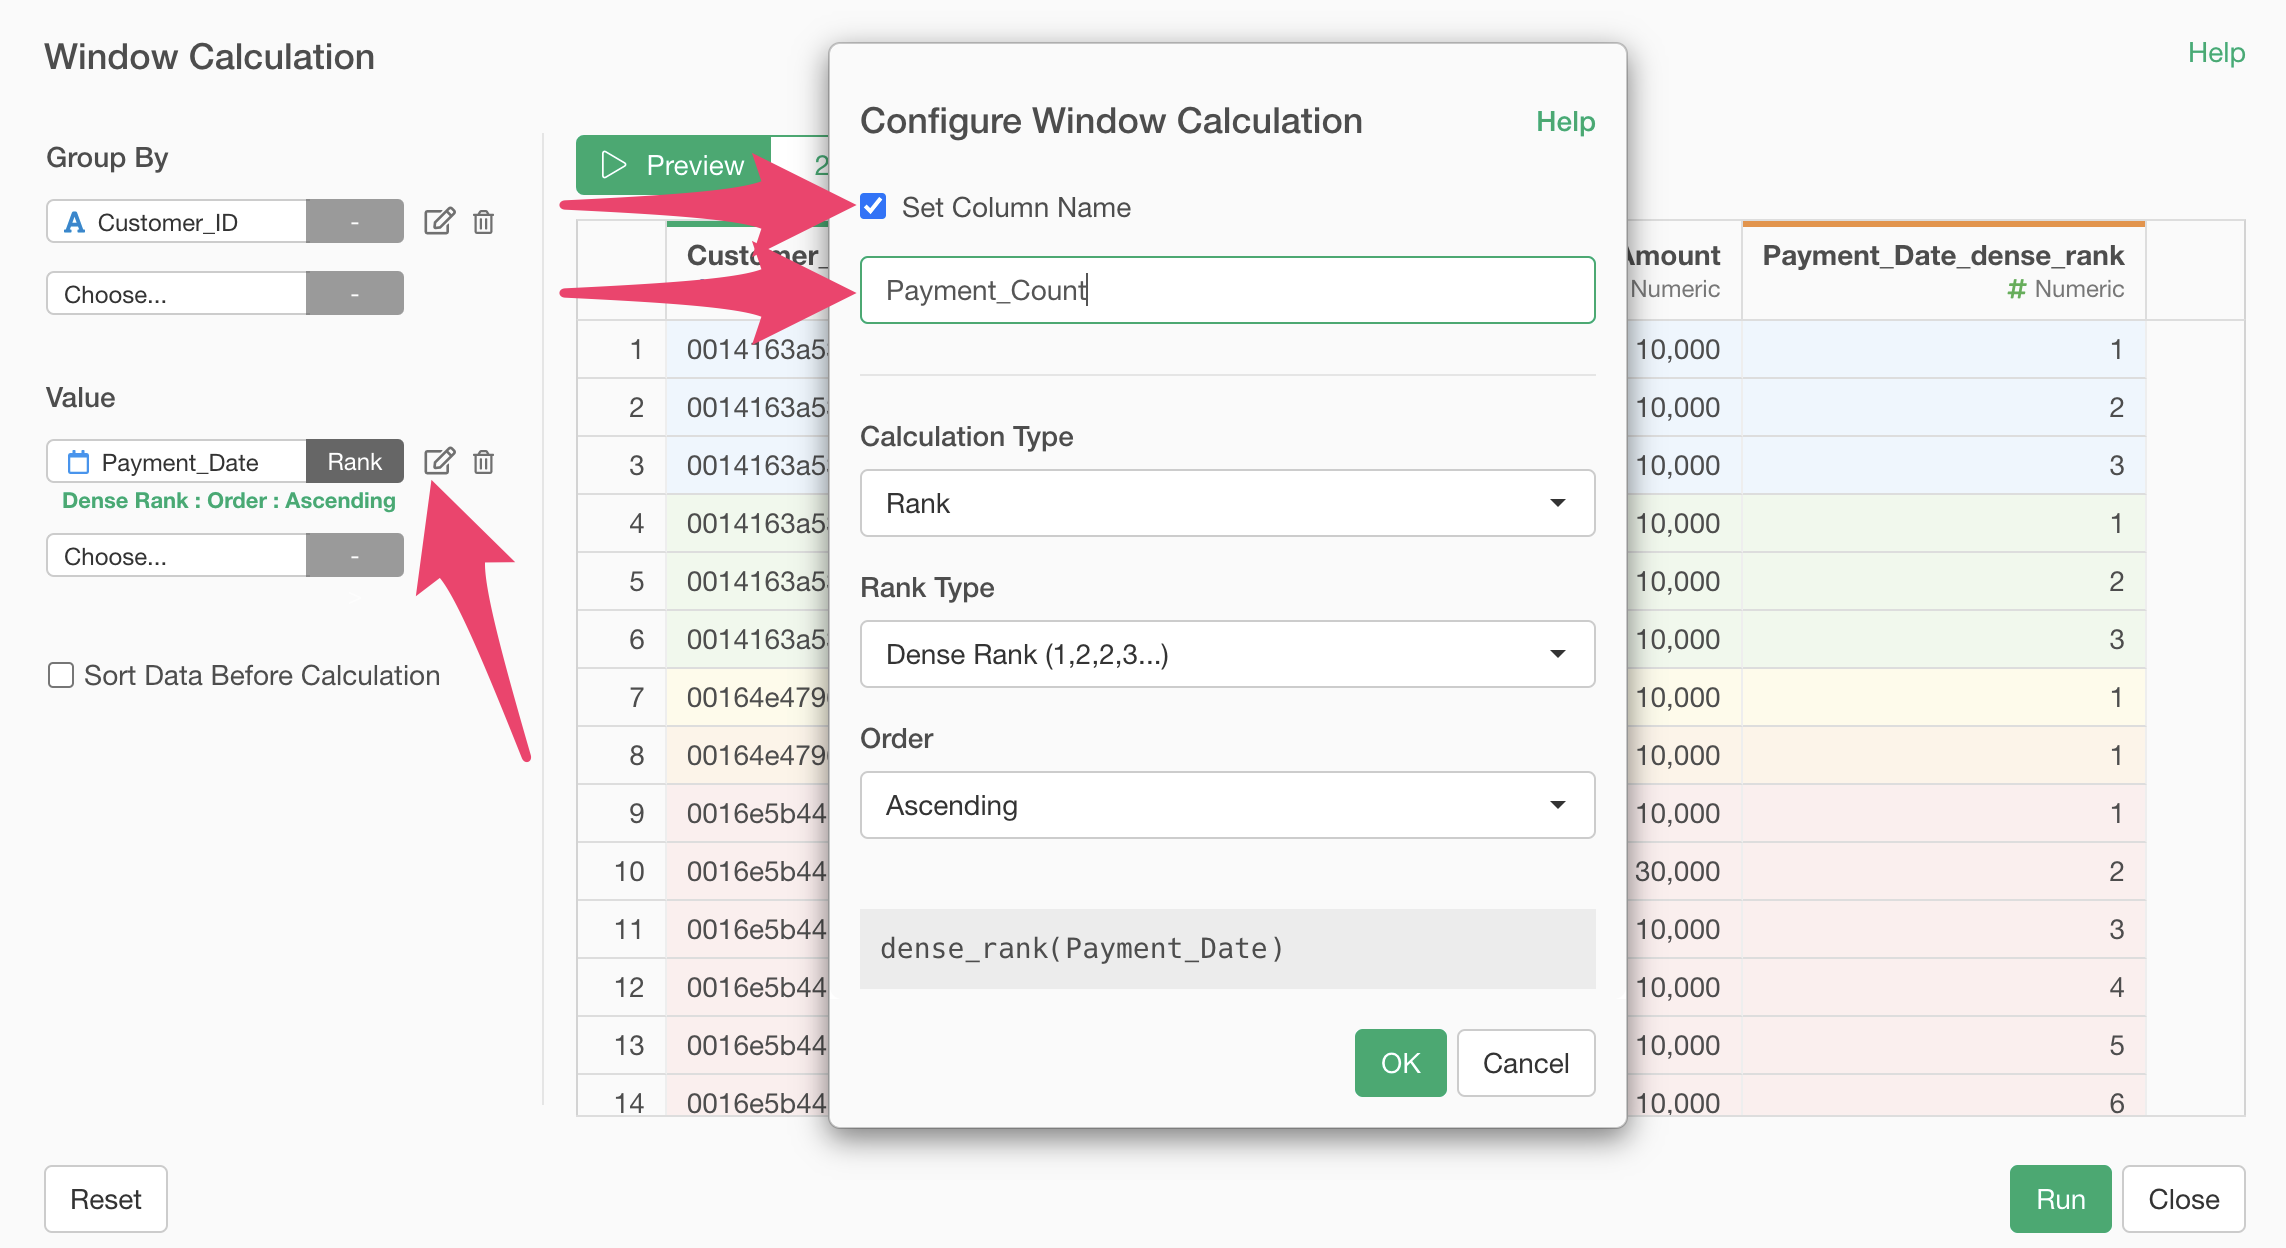
To calculate the number of payments per customer, select “Create Window Calculation”, “Dense Rank”, “Ascending” from the “Payment_Date” column header menu.
When the table calculation dialog opens, since we want to calculate the ranking for each customer, select “Customer_ID” for the group and click the preview button.
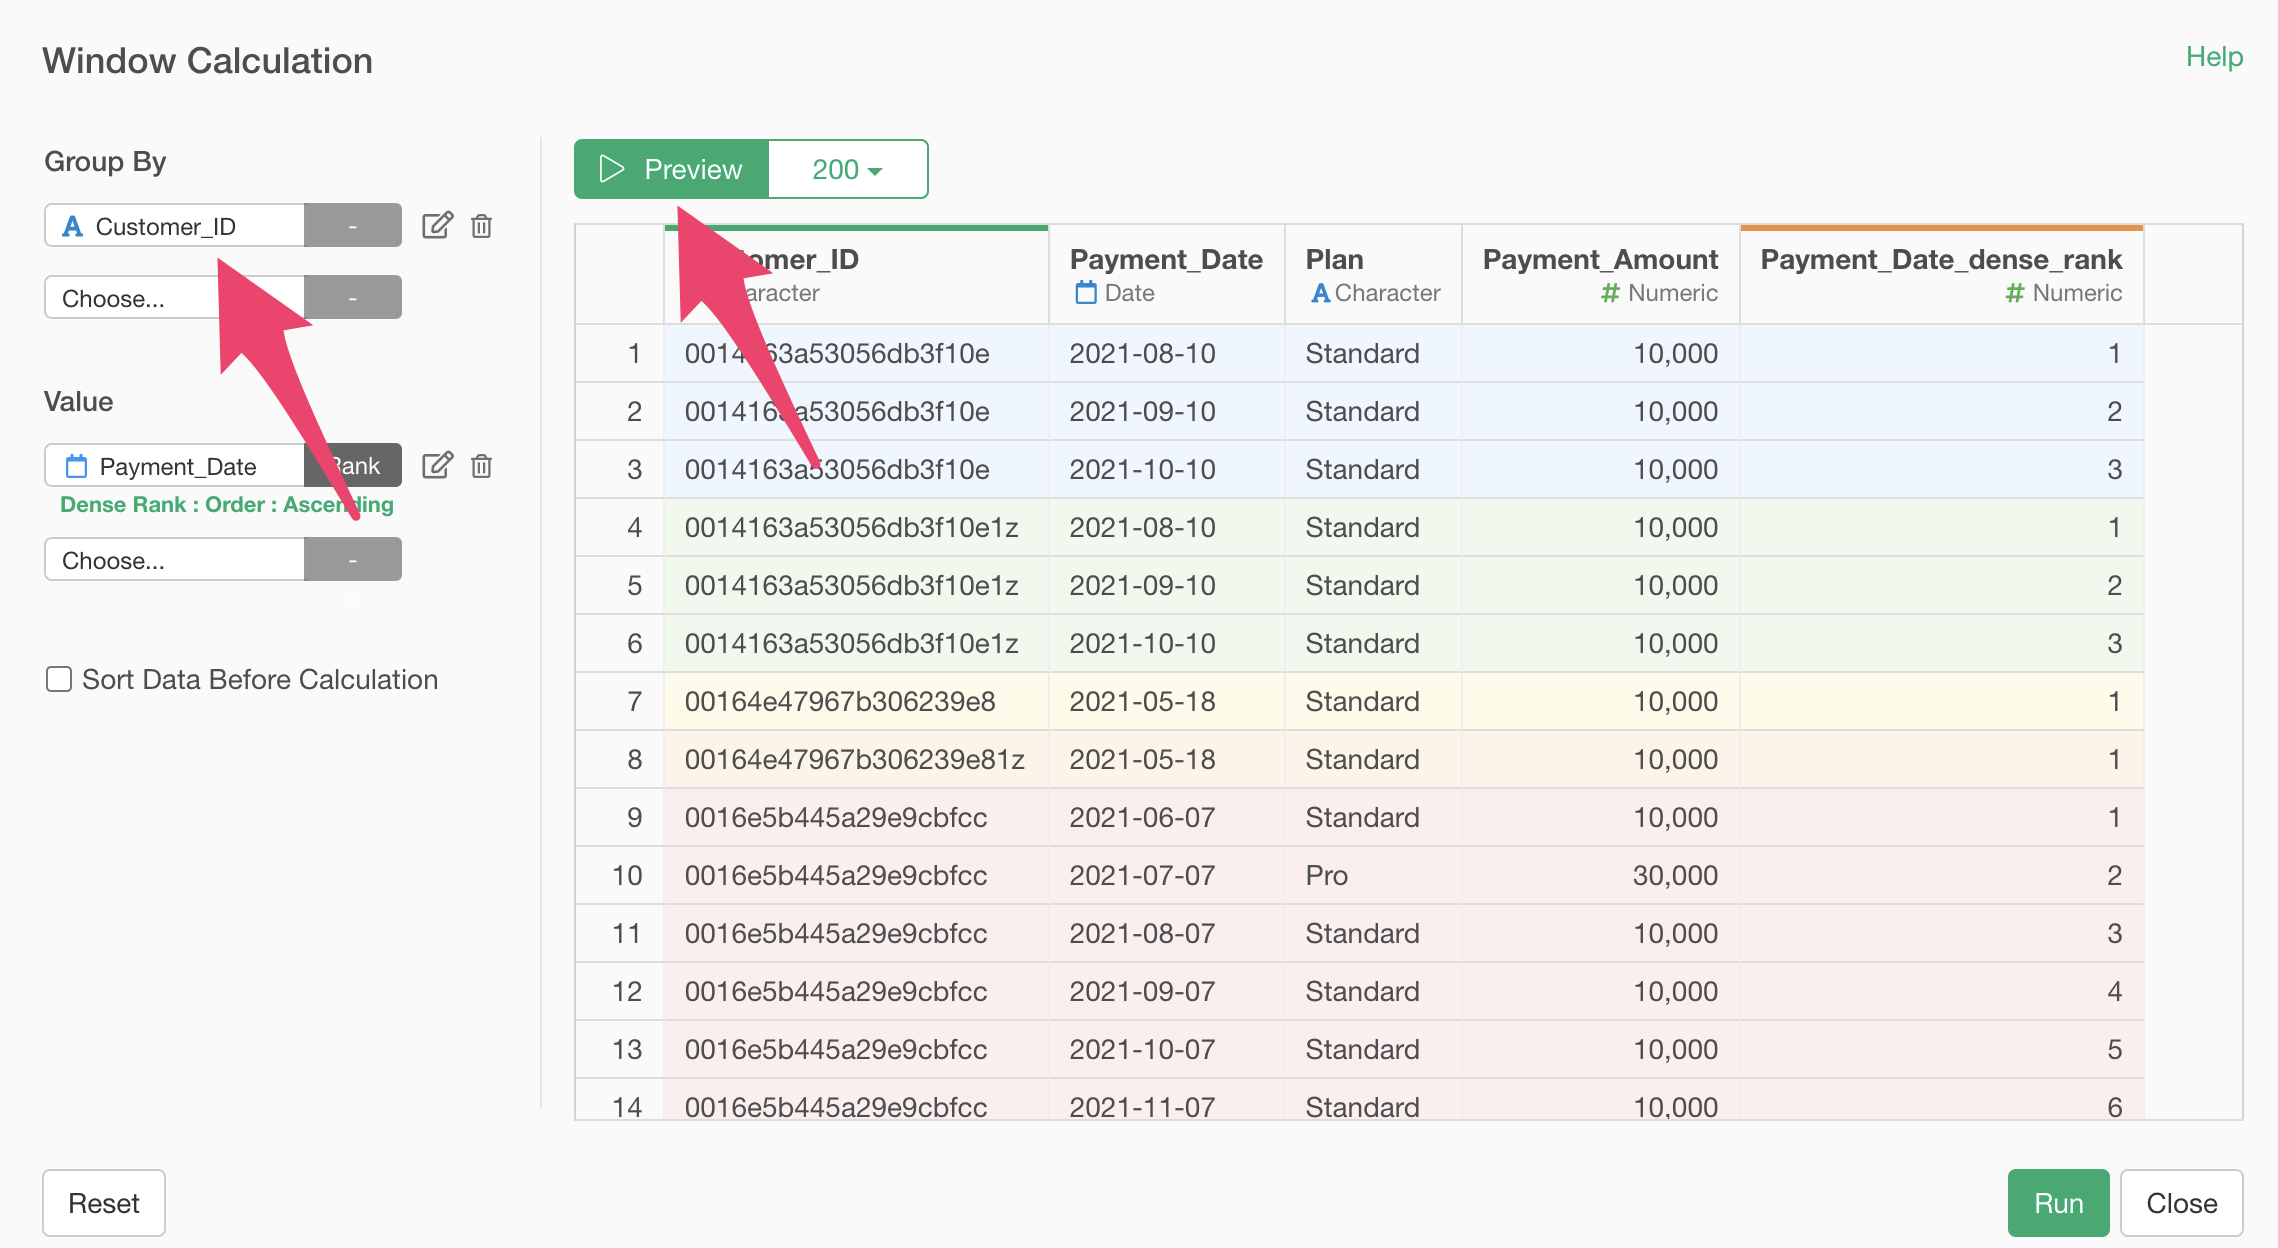
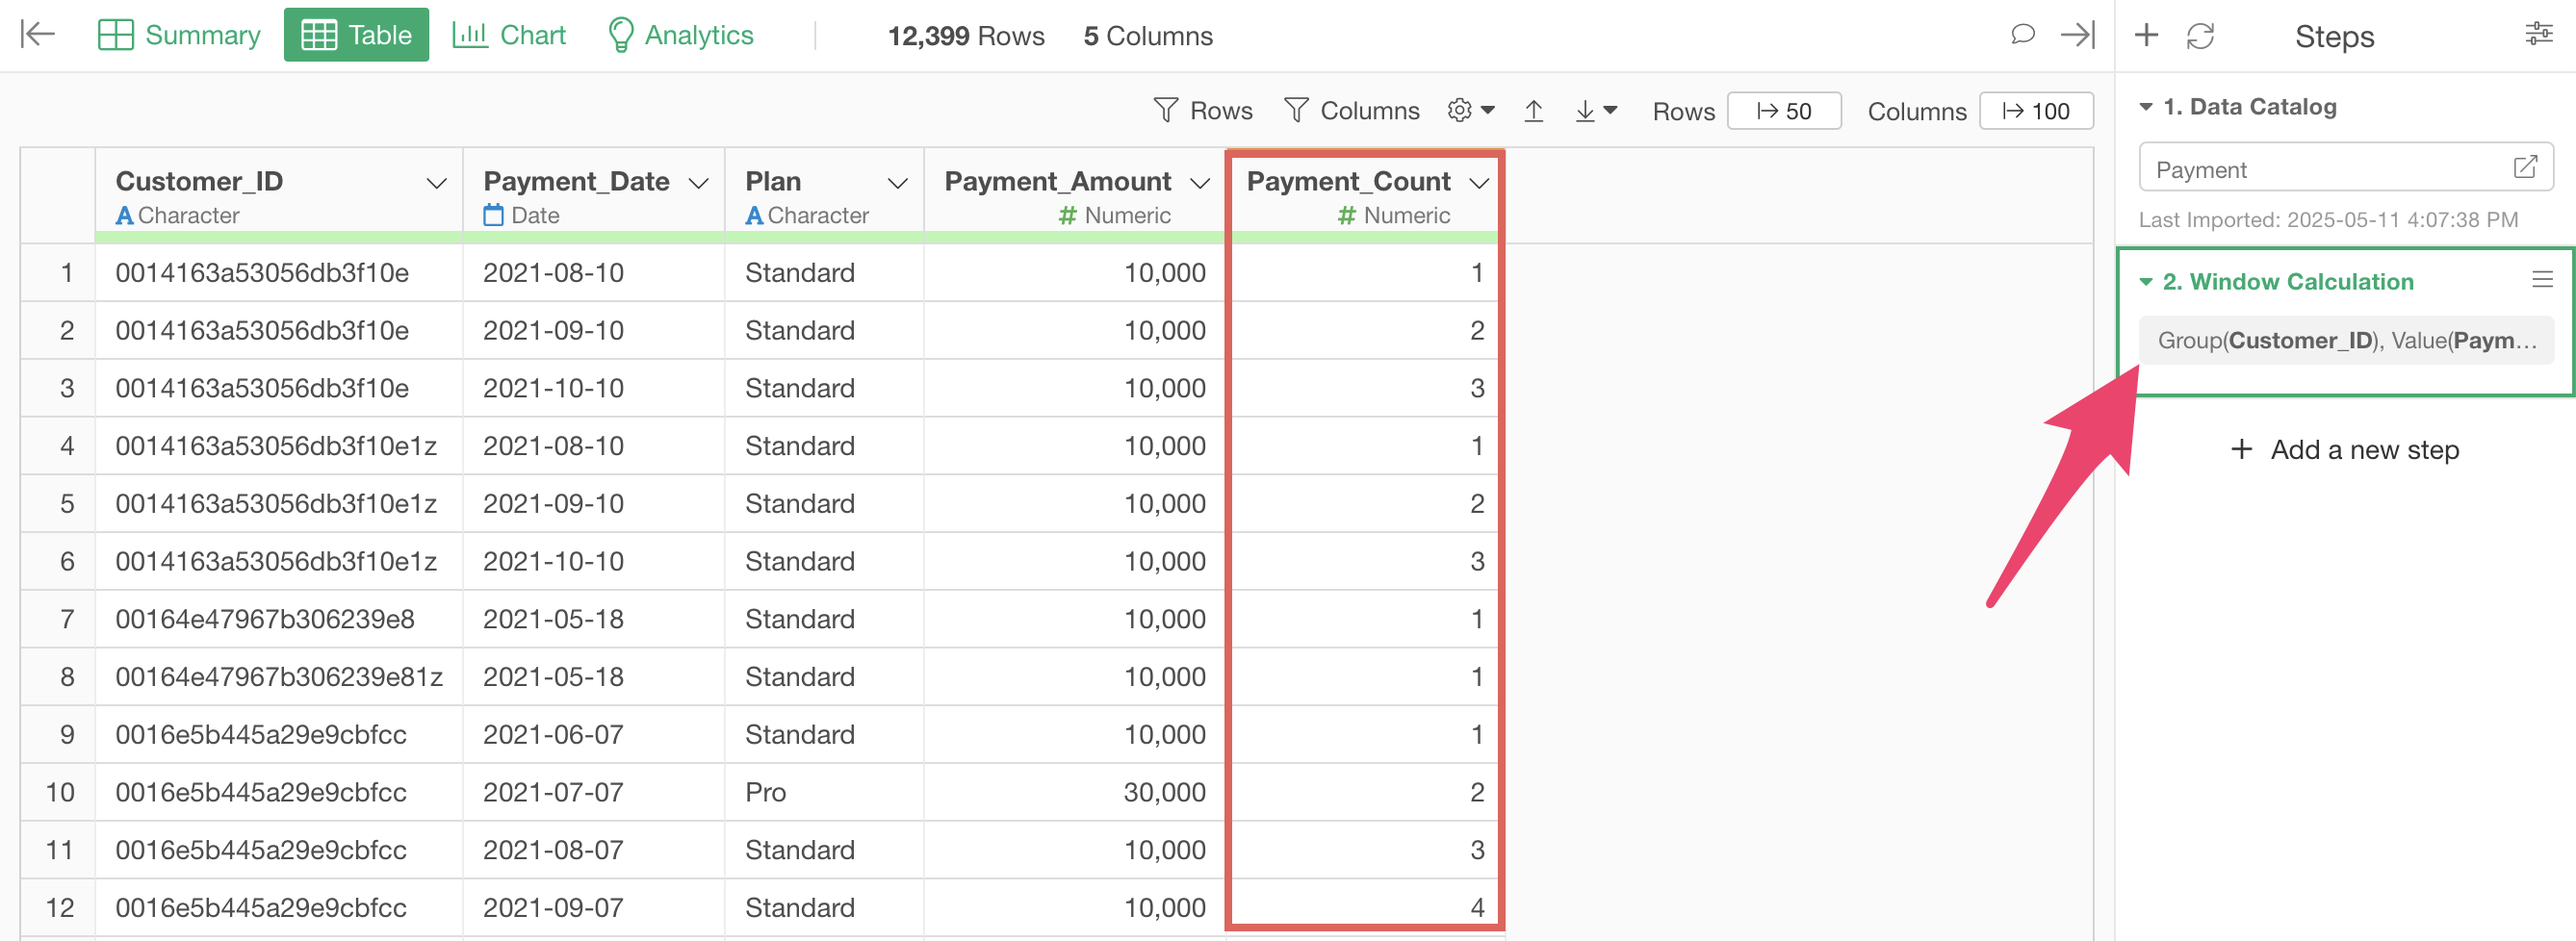
Finally, change the column name to “Payment_Count” and press the “Run” button.
Now you can see which payment number each transaction represents.
2. Aggregate the number of customers and continuing customers by month
To aggregate the number of customers by month, follow these steps:
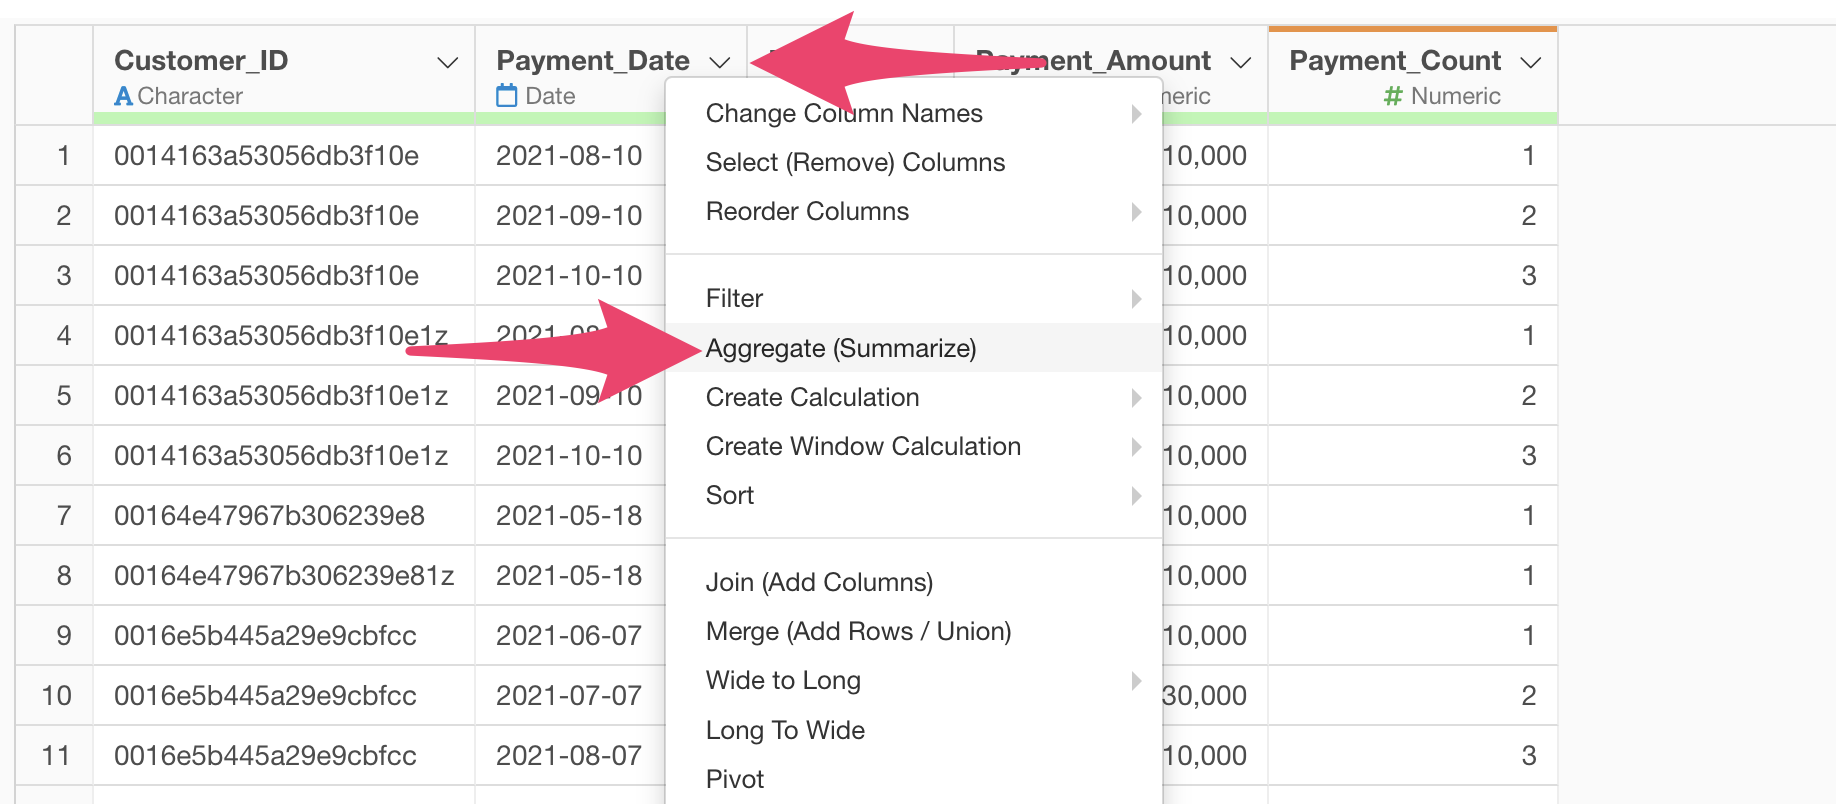
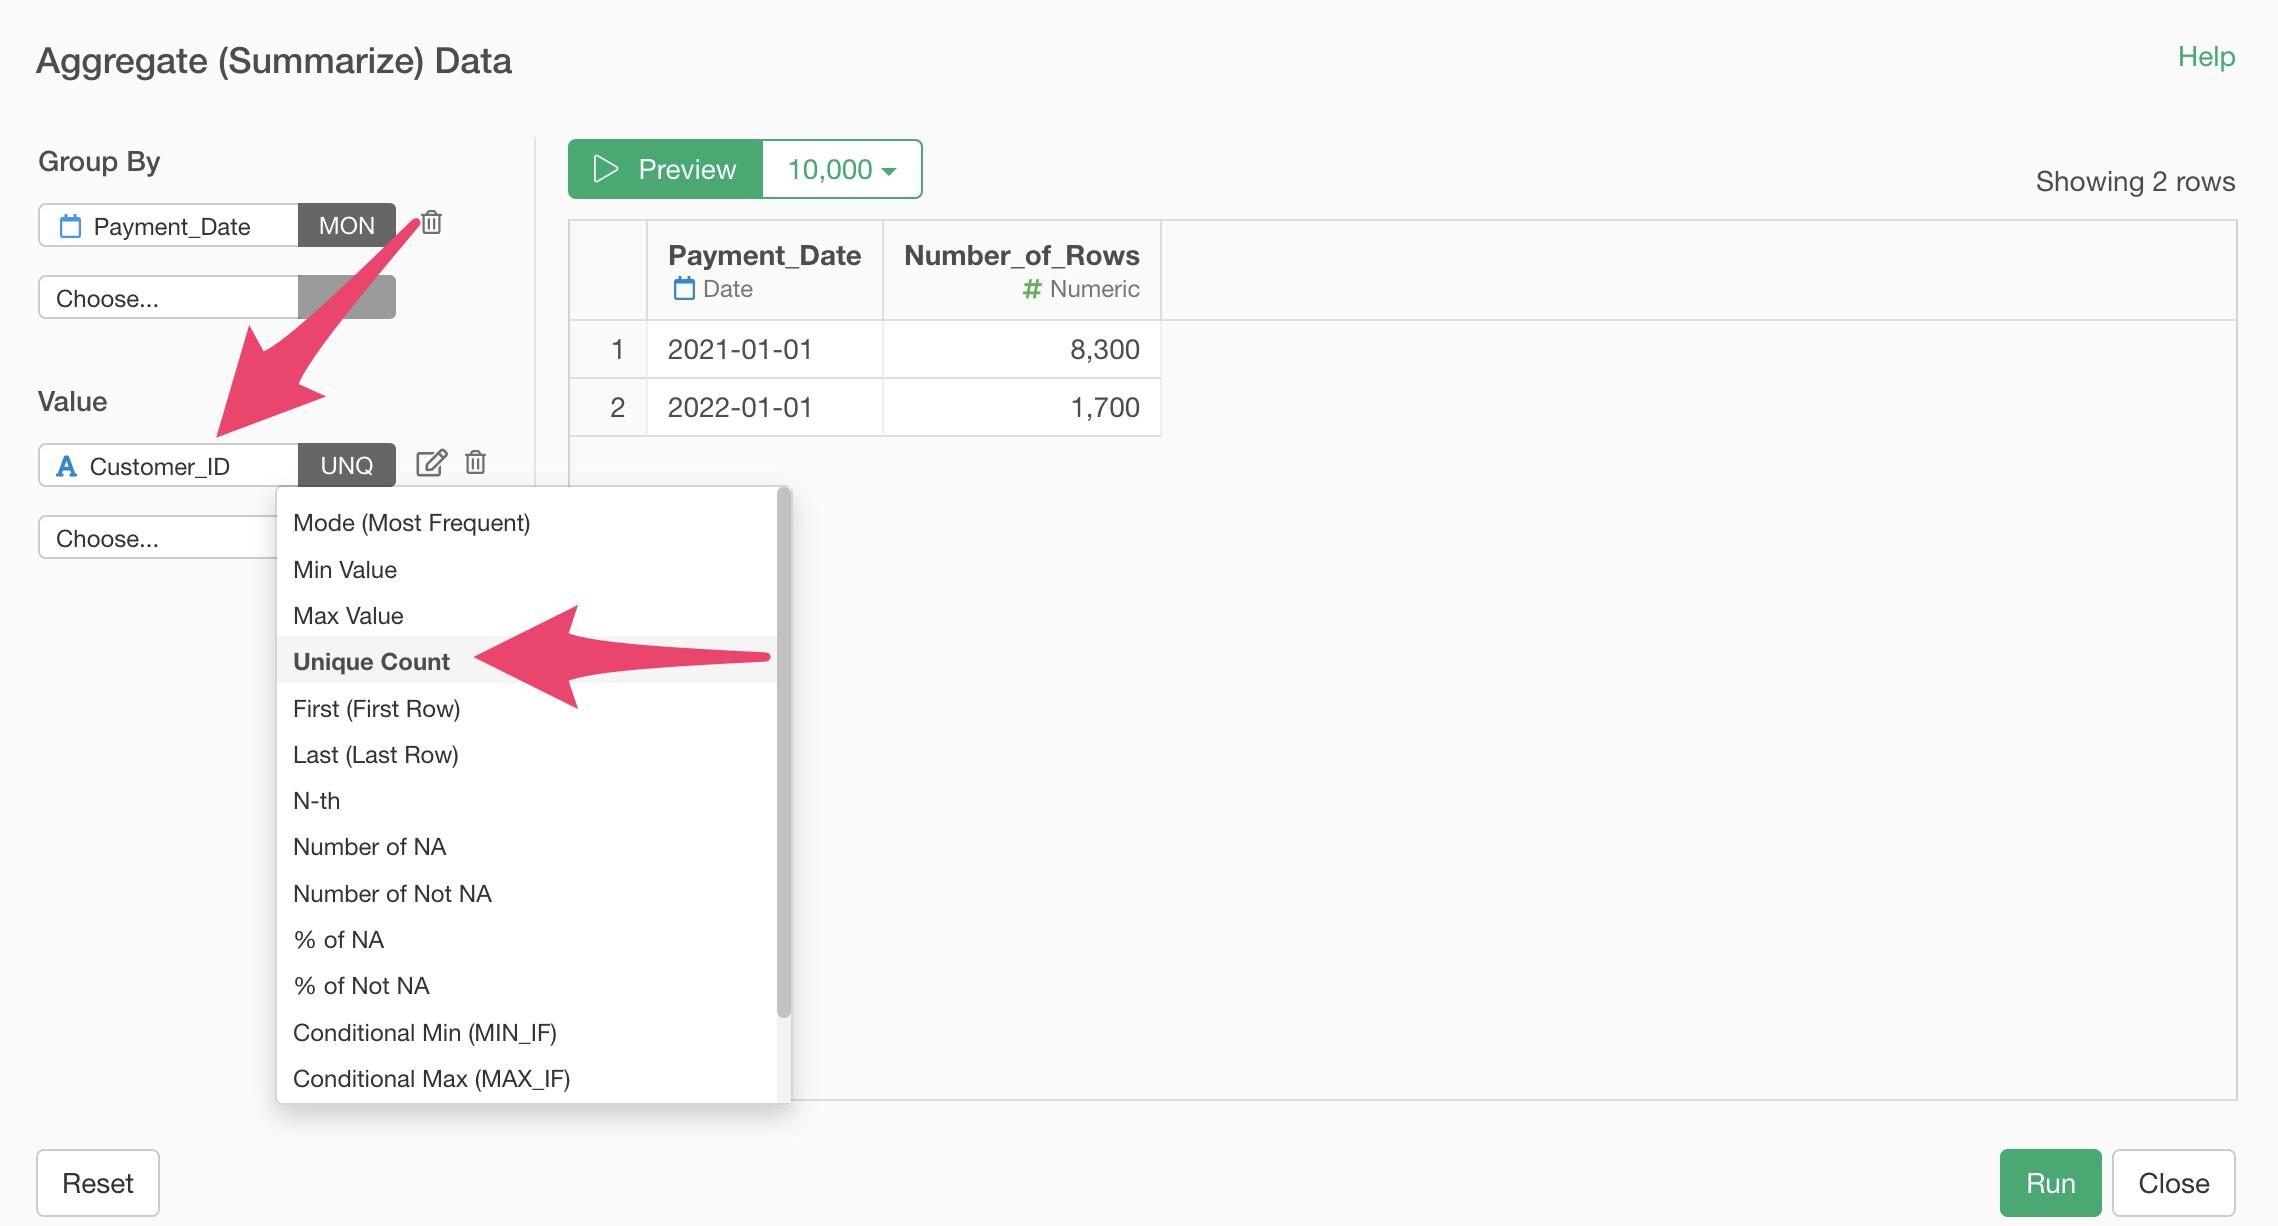
Select “Aggregate (Summarize)” from the “Payment_Date” column header menu.
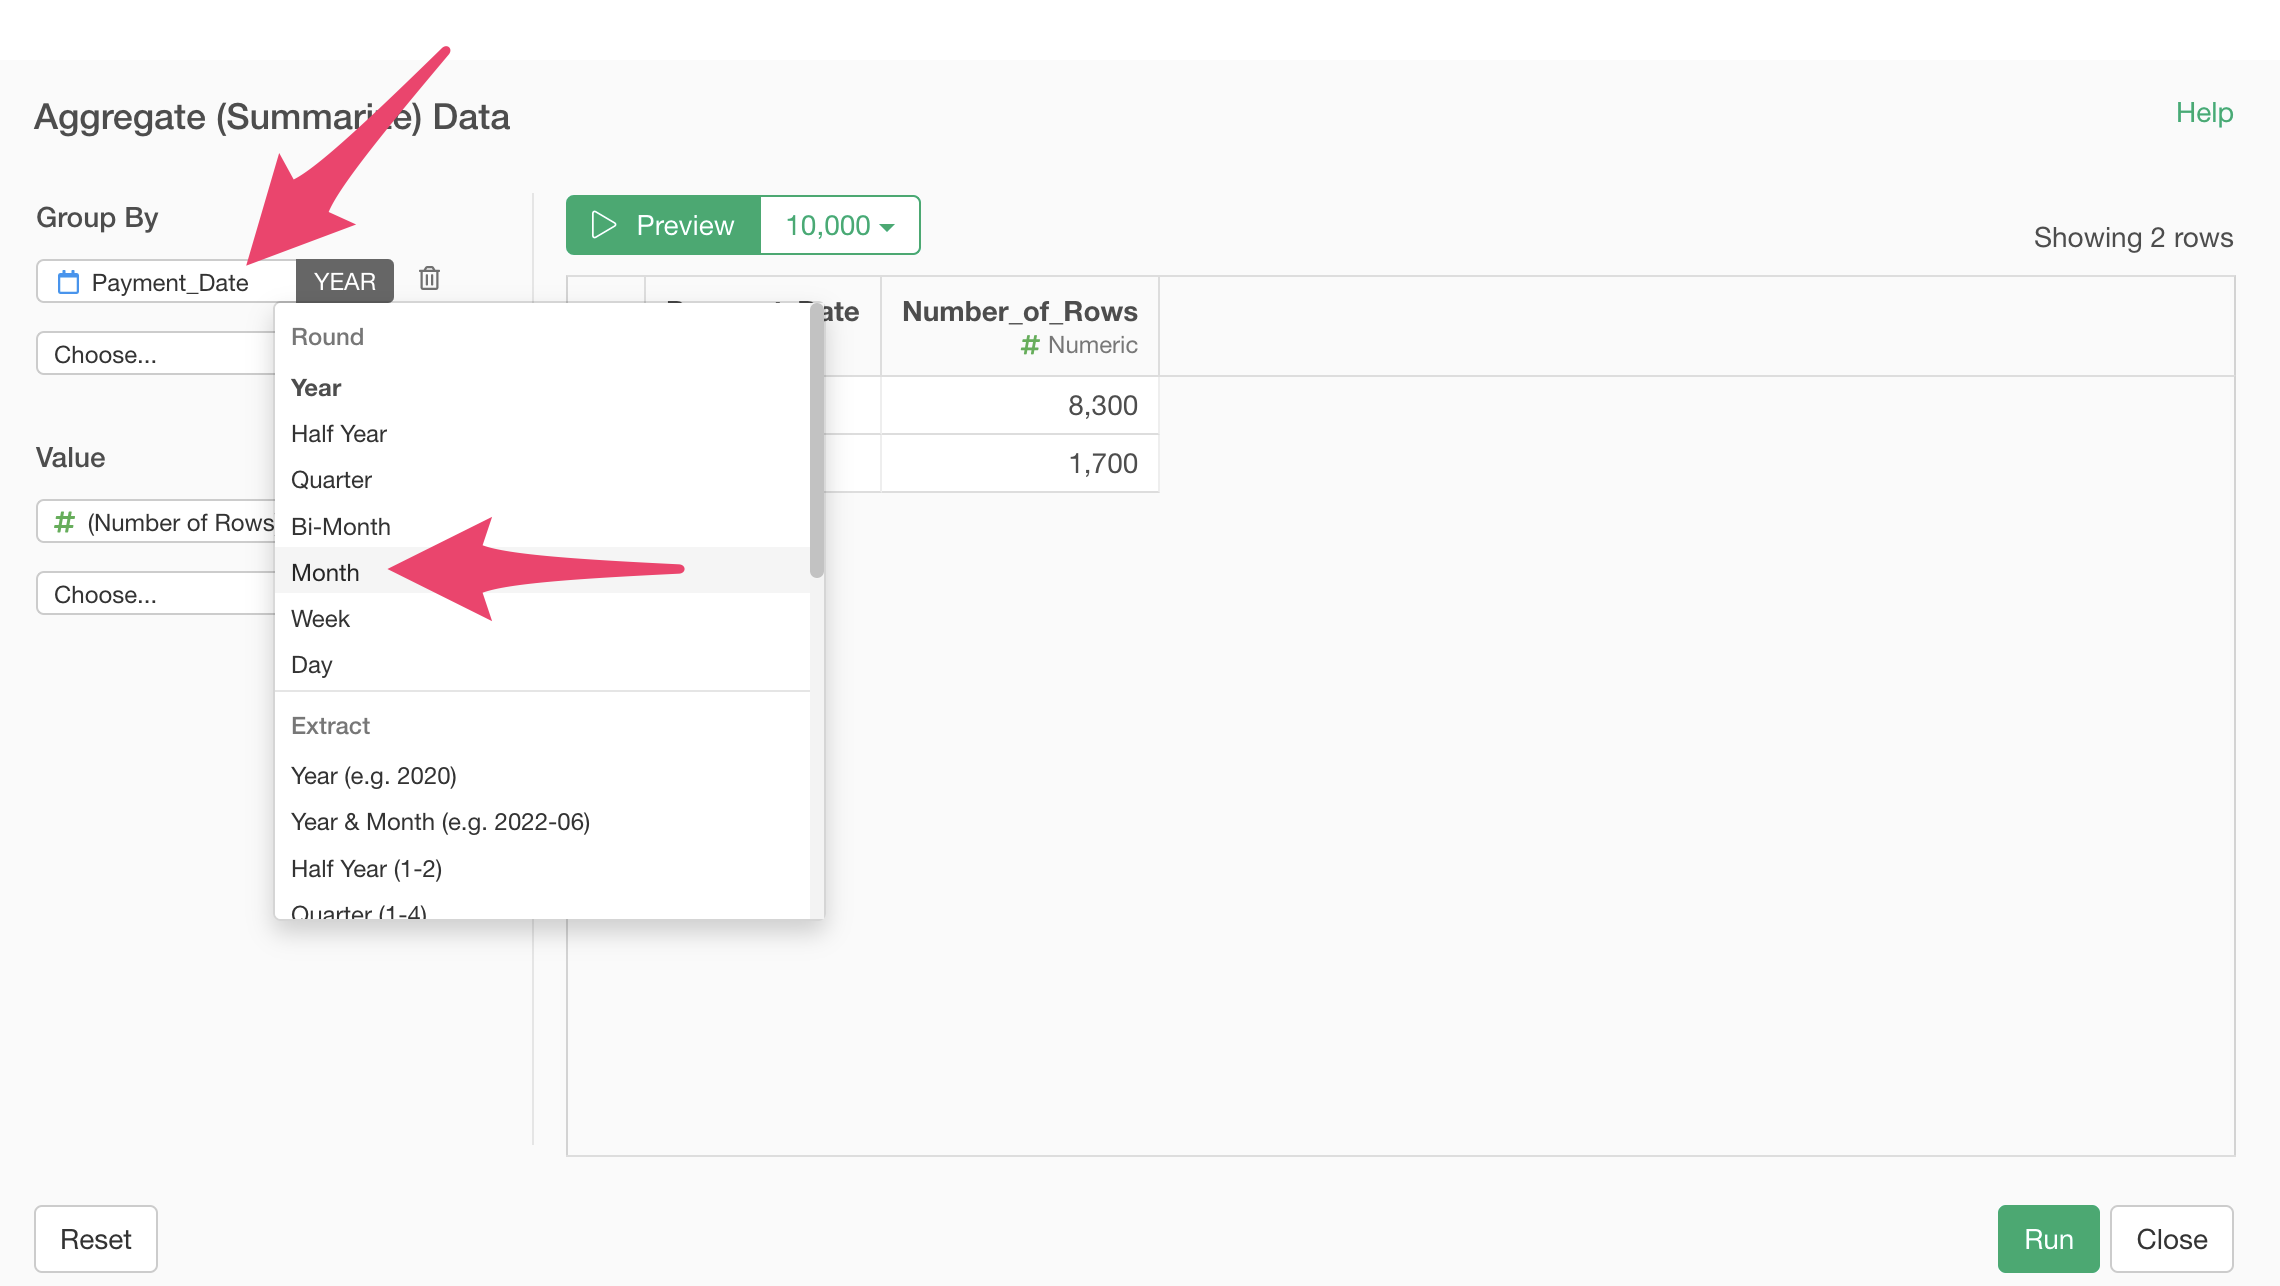
When the summarize dialog opens, round the payment date unit to “Month”.
Select “Customer_ID” for the value and set the aggregation method to “Unique Count”.
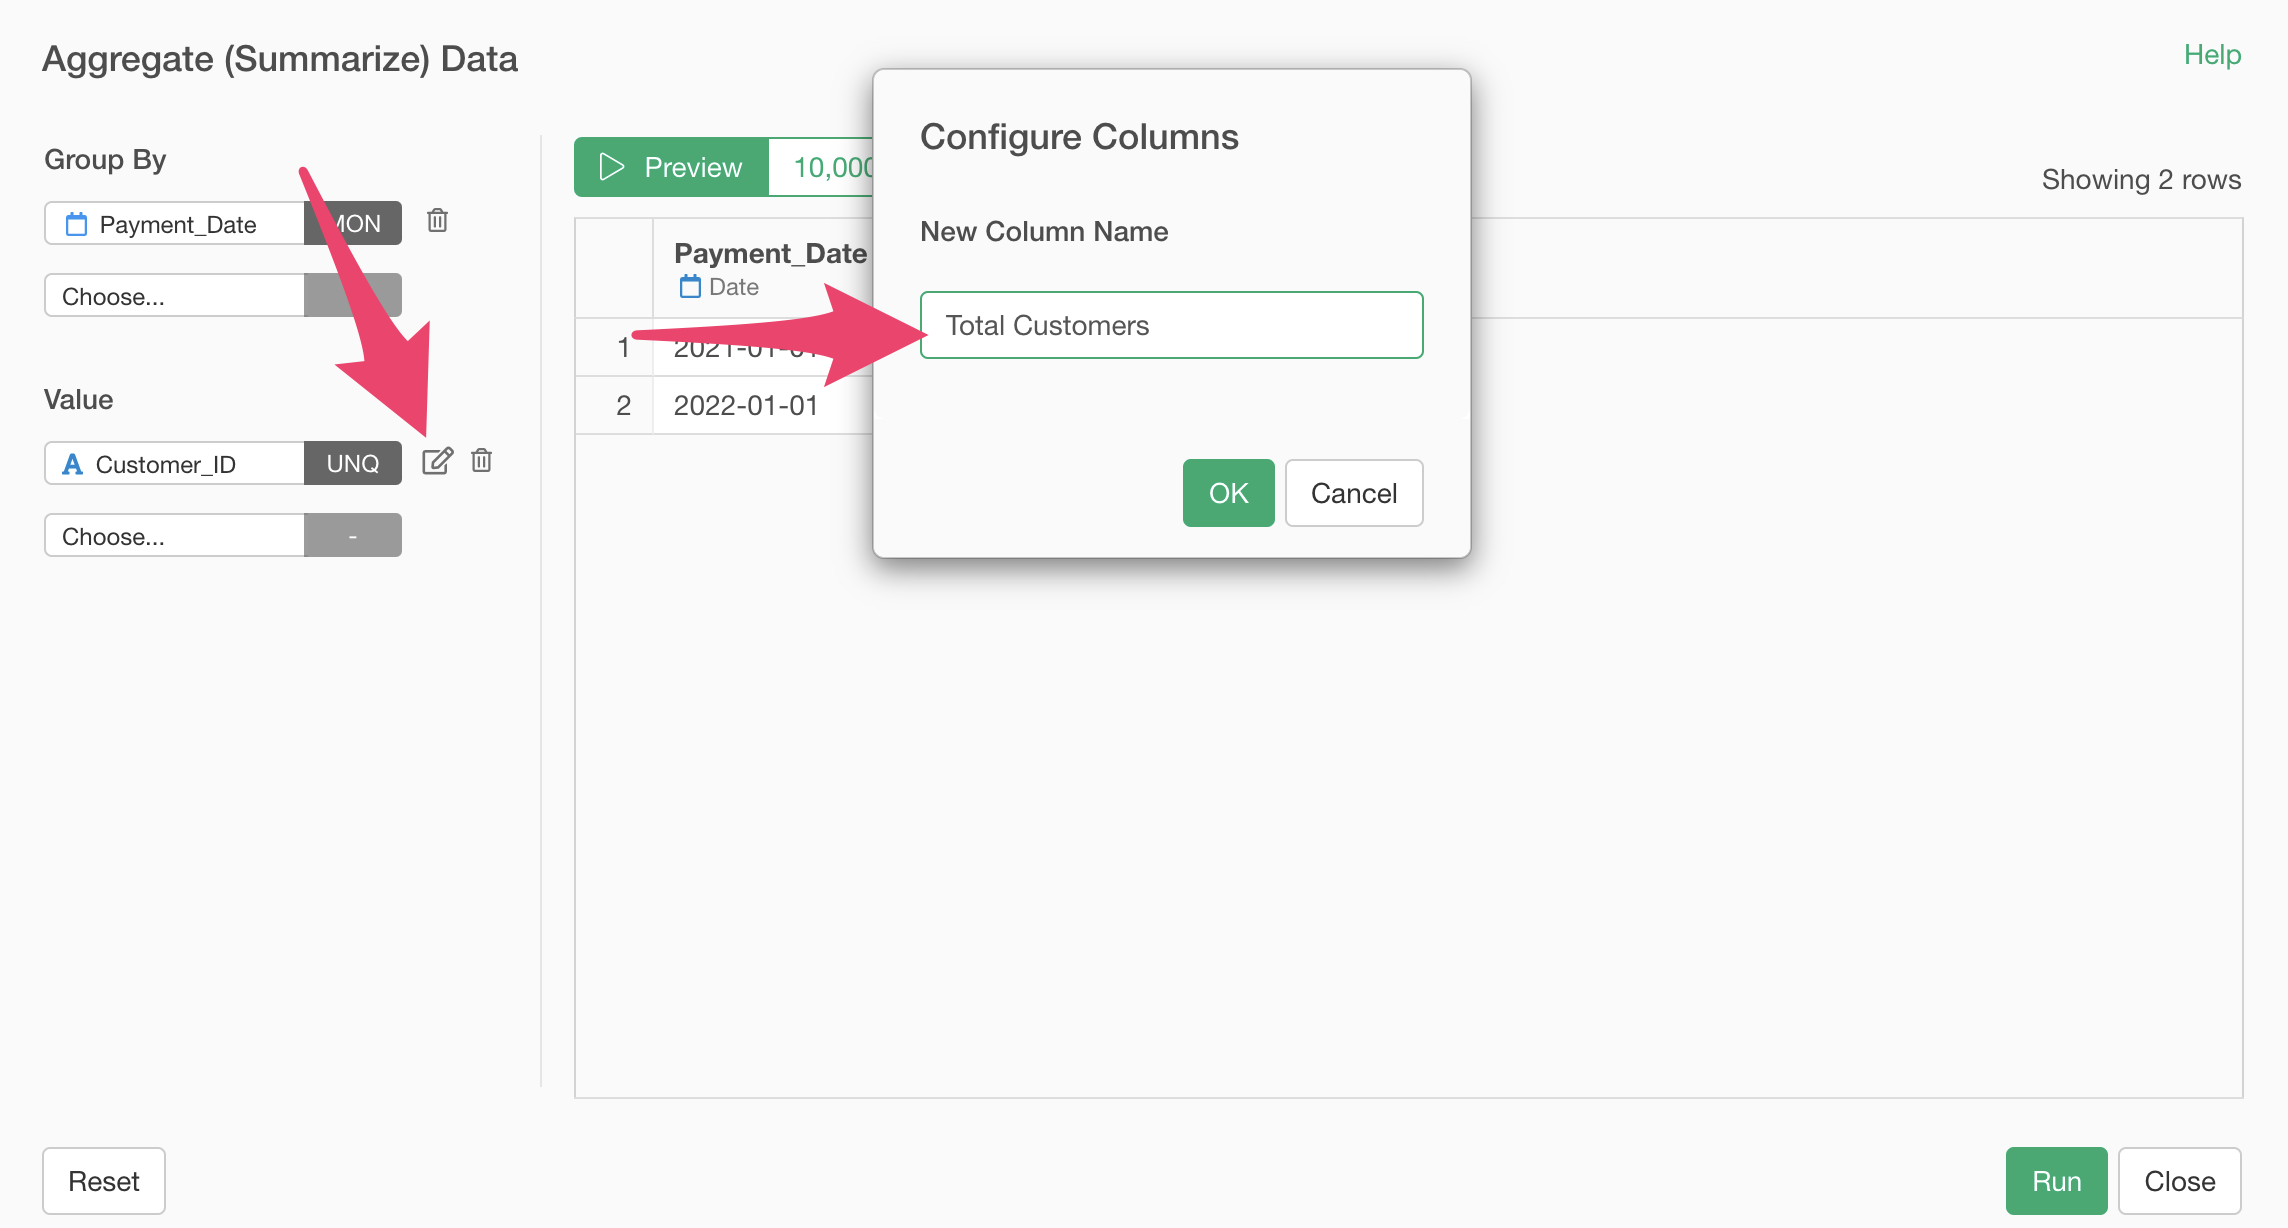
Change the column name to “Total Customers”.
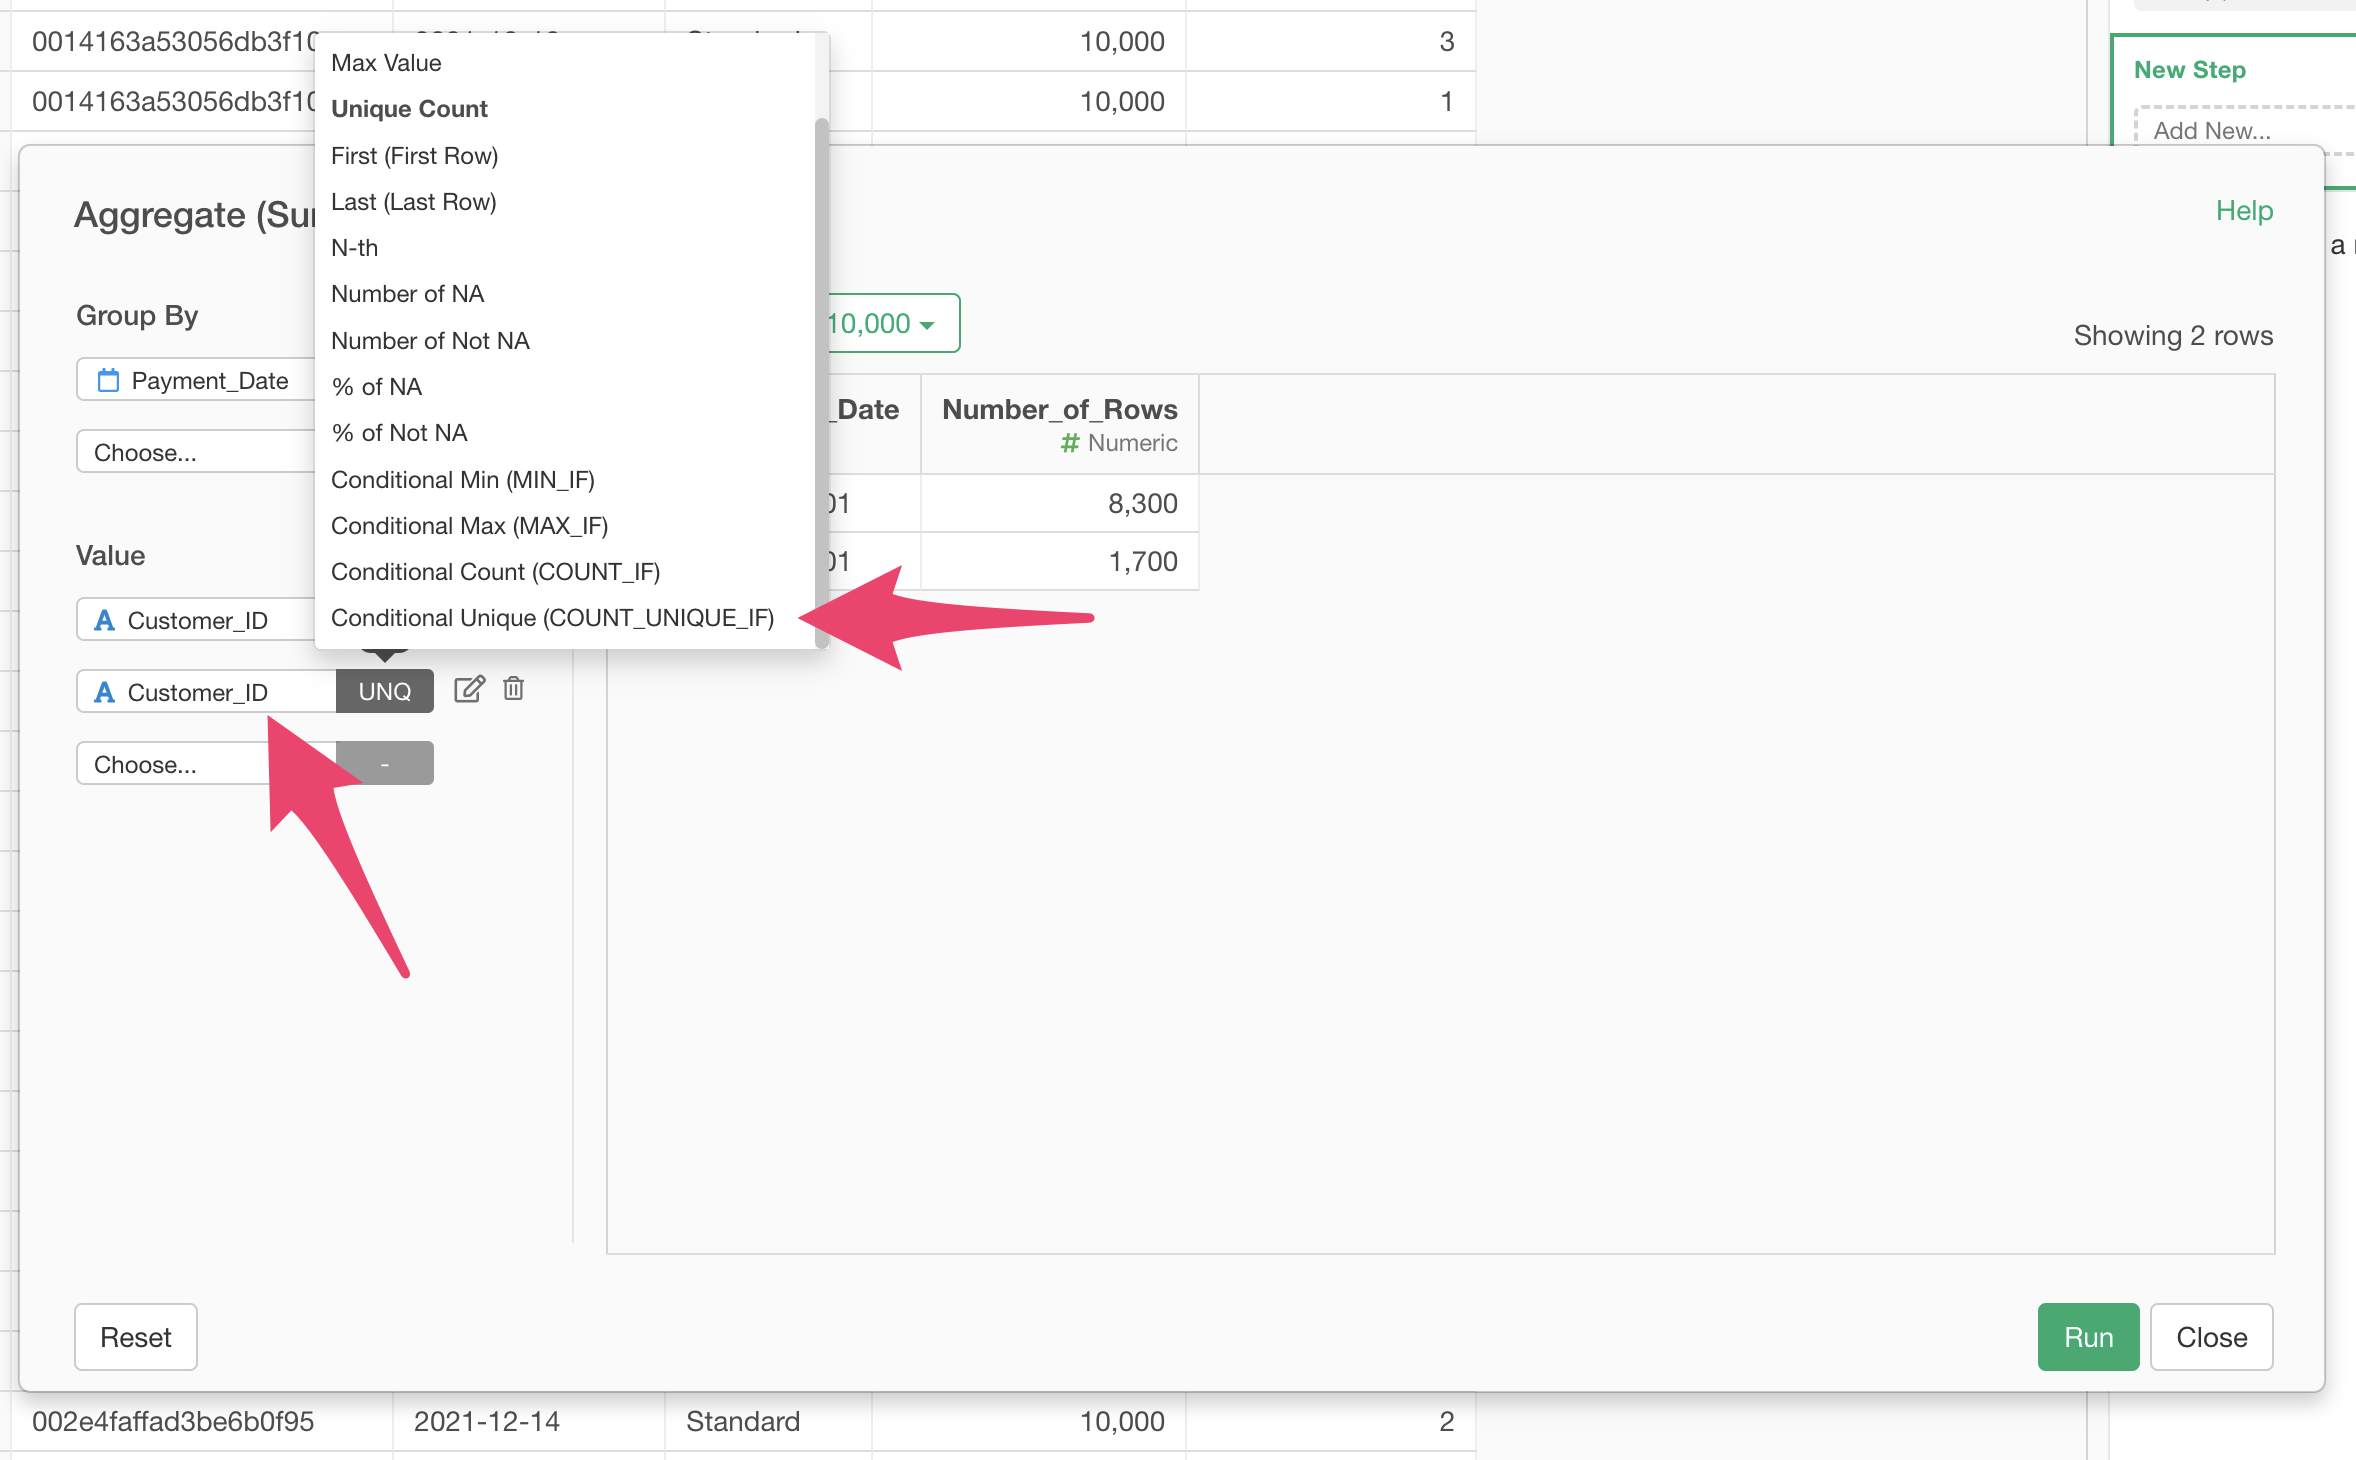
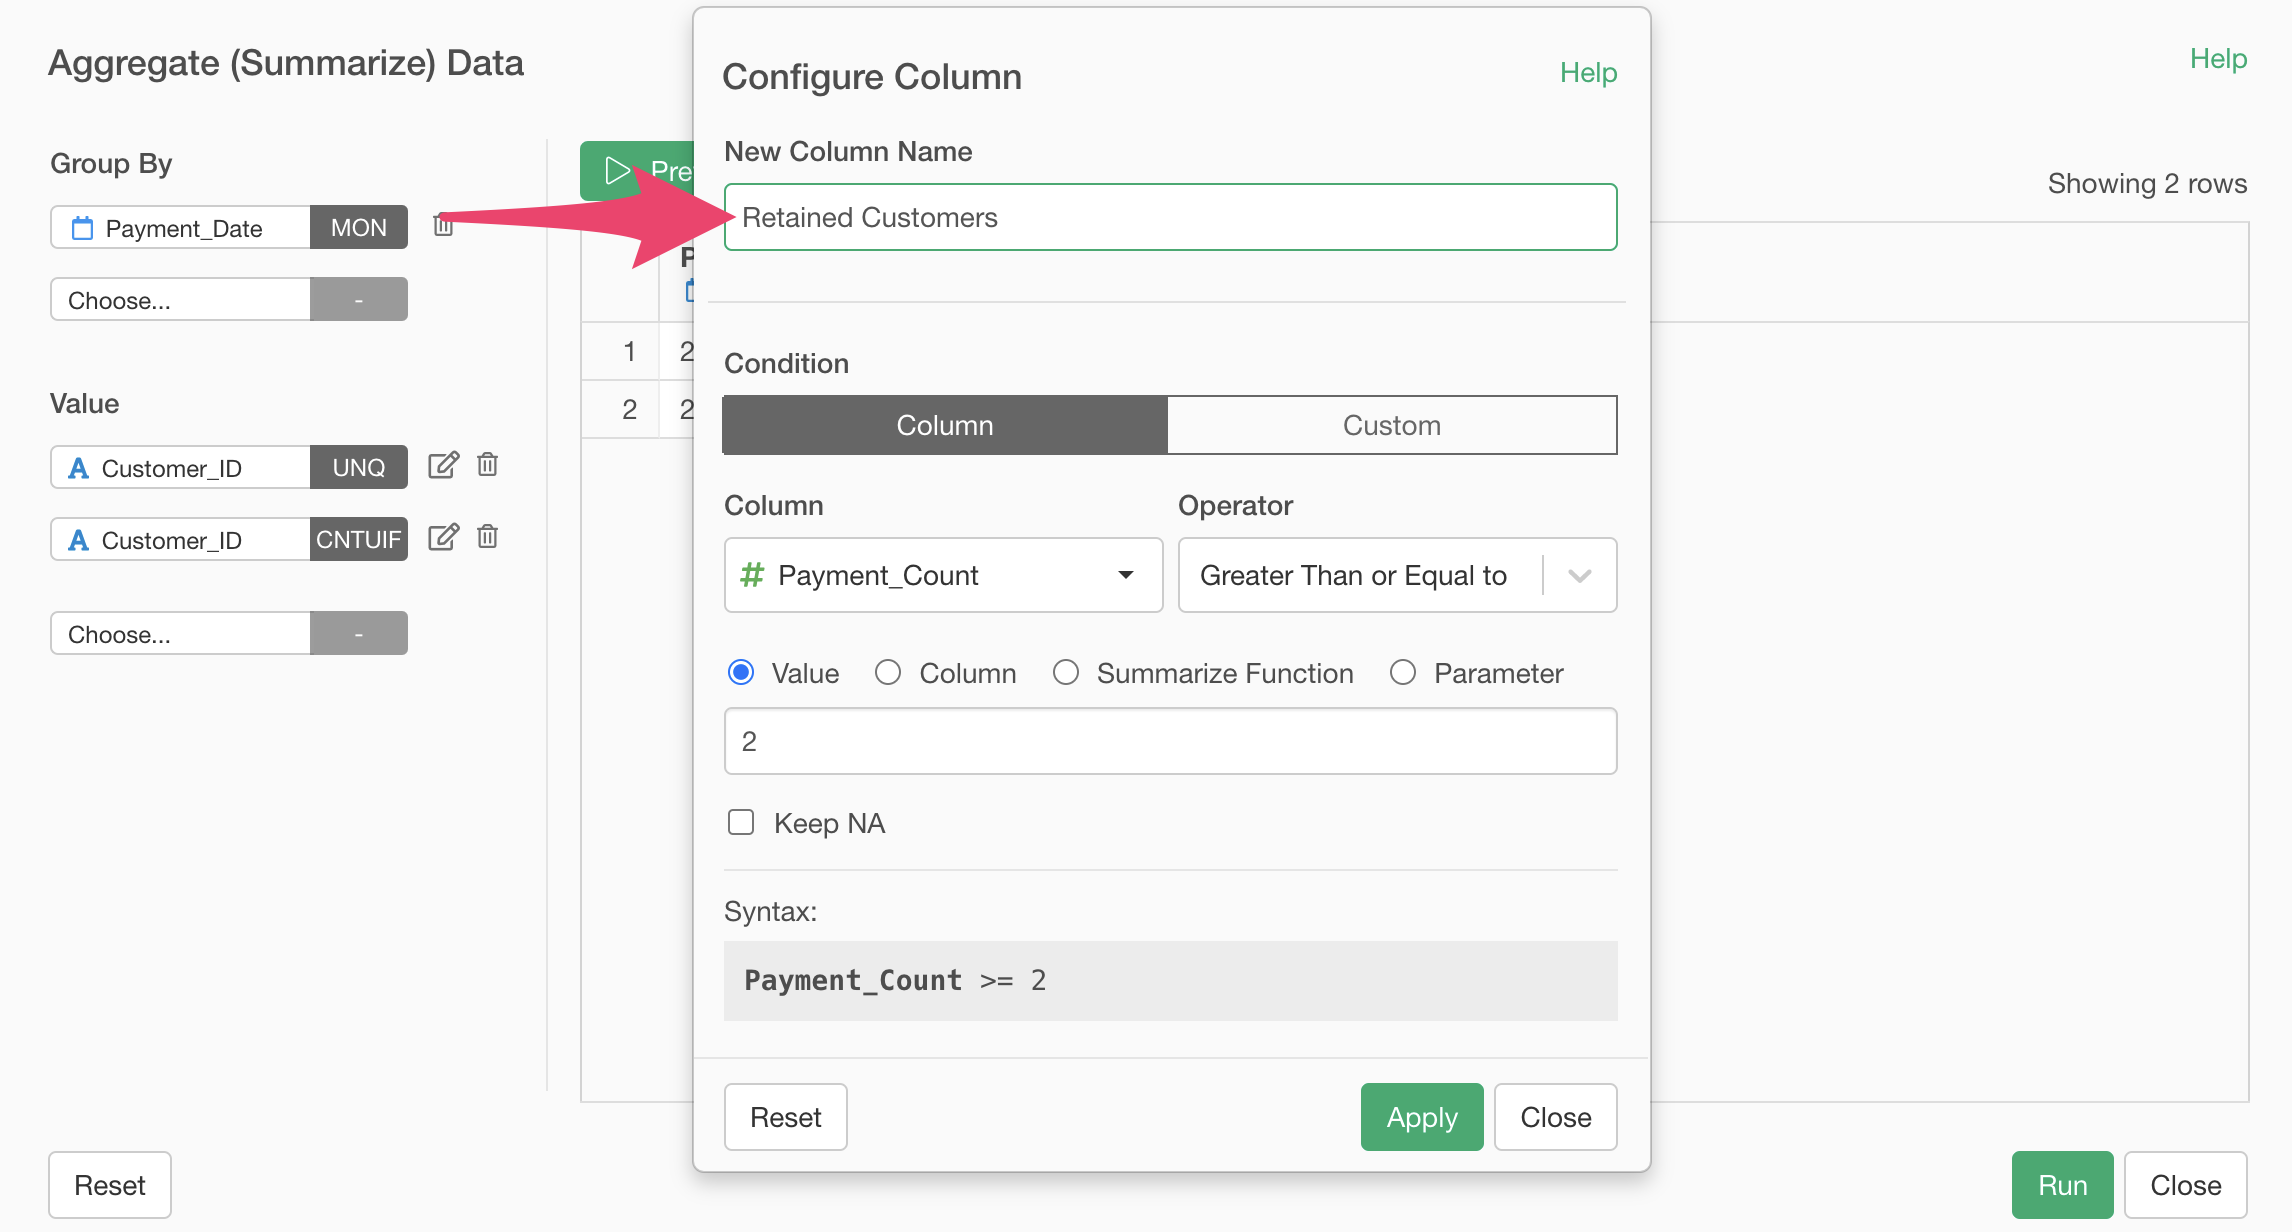
Next, to calculate the number of continuing customers, add “Customer_ID” to the value and select “Conditional Unique (COUNT_UNIQUE_IF)”as the aggregation function.
When the condition setting dialog opens, set the column to “Payment_Count”, the operator to “Greater than or equal to”, and the value to “2”.
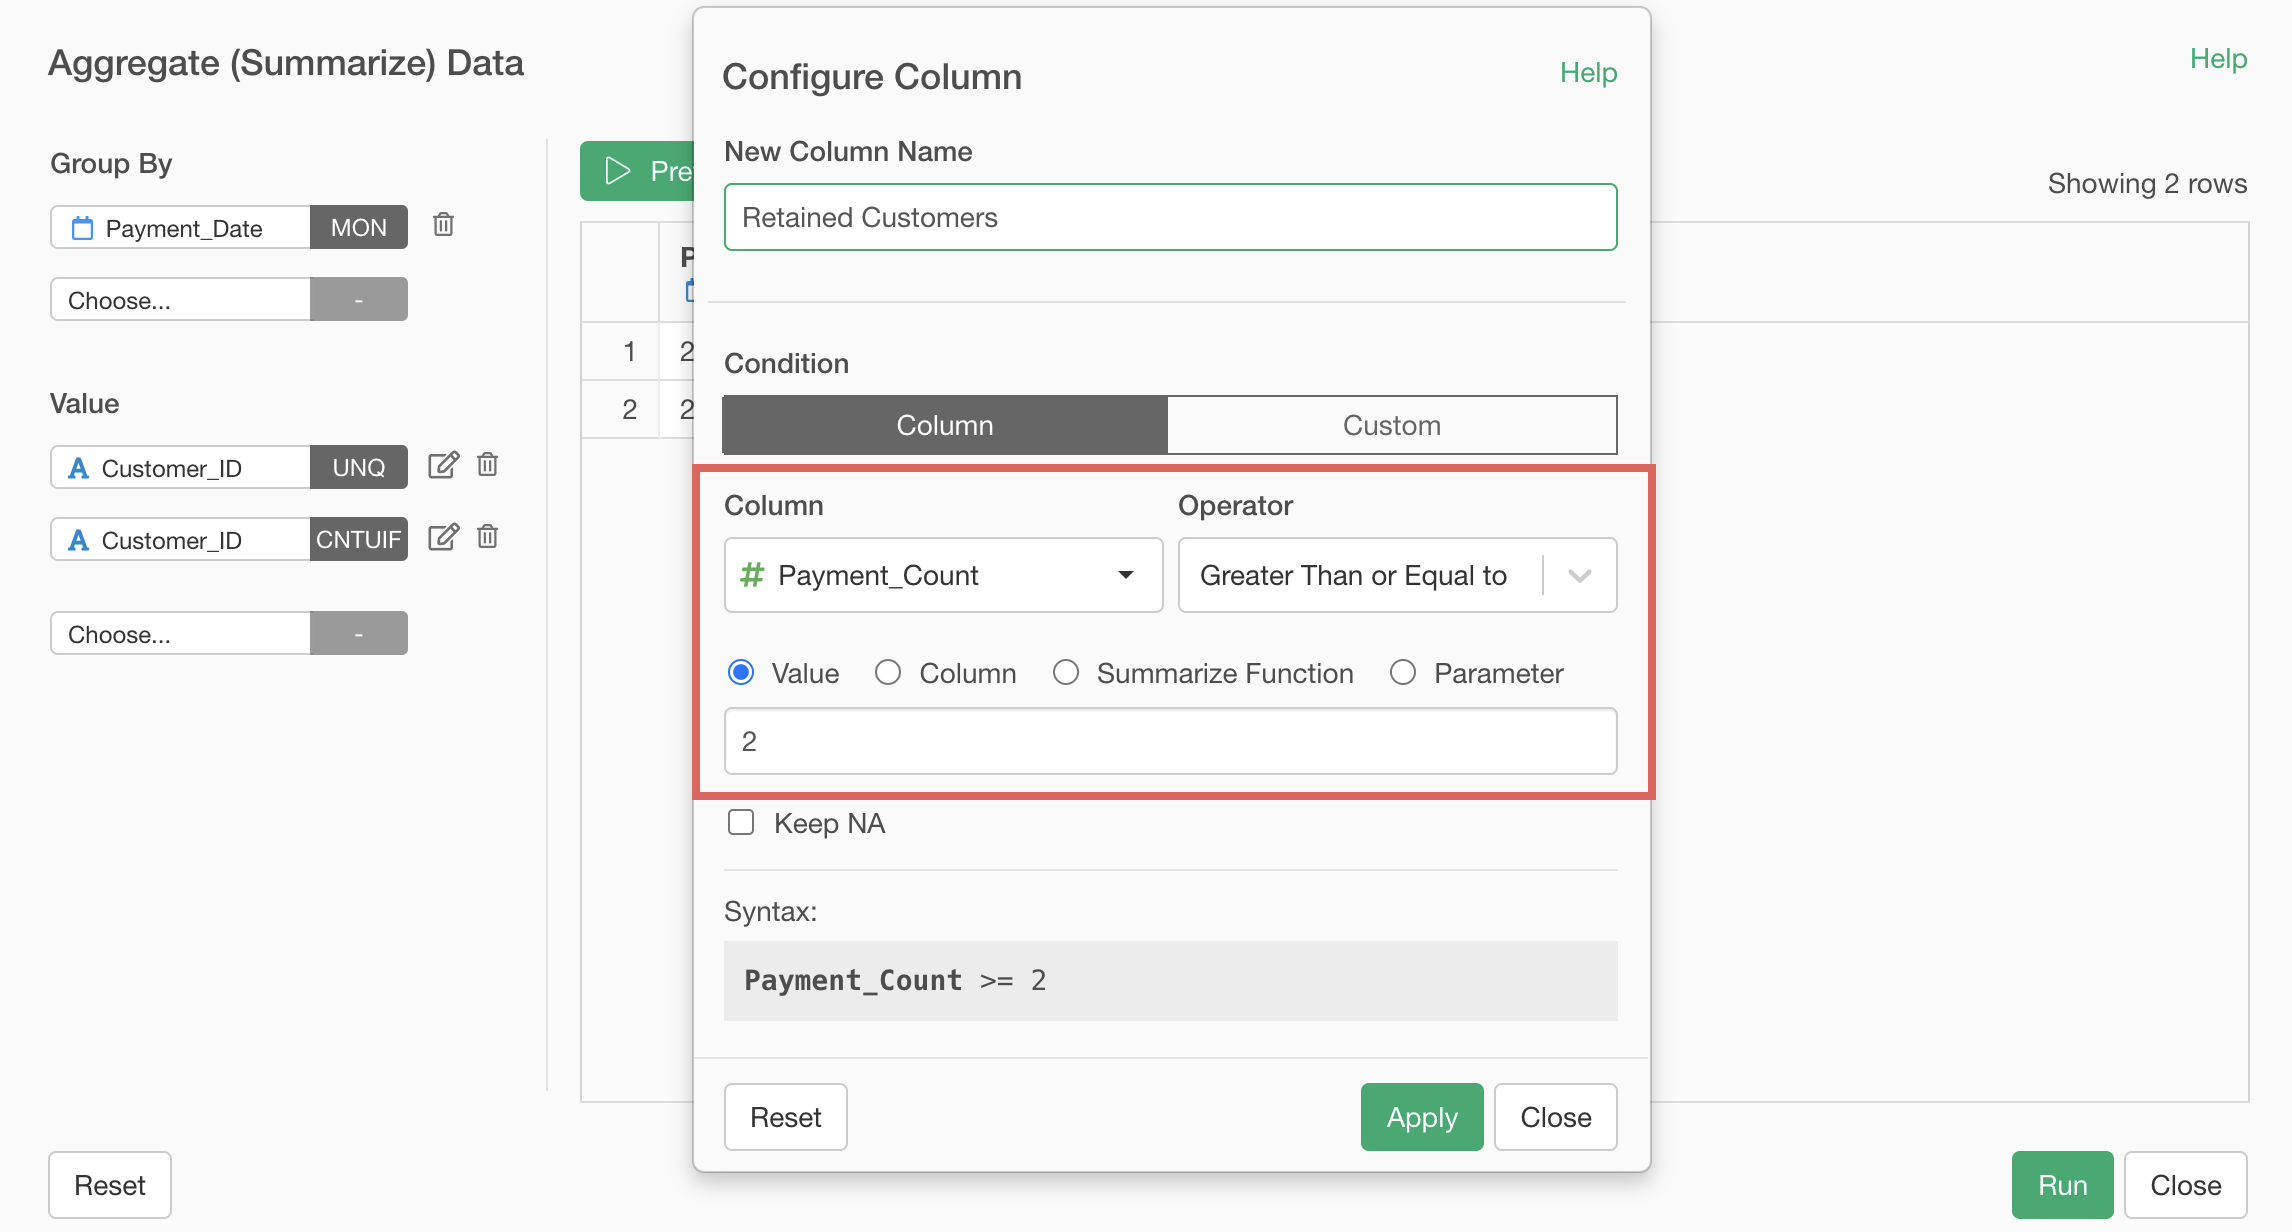
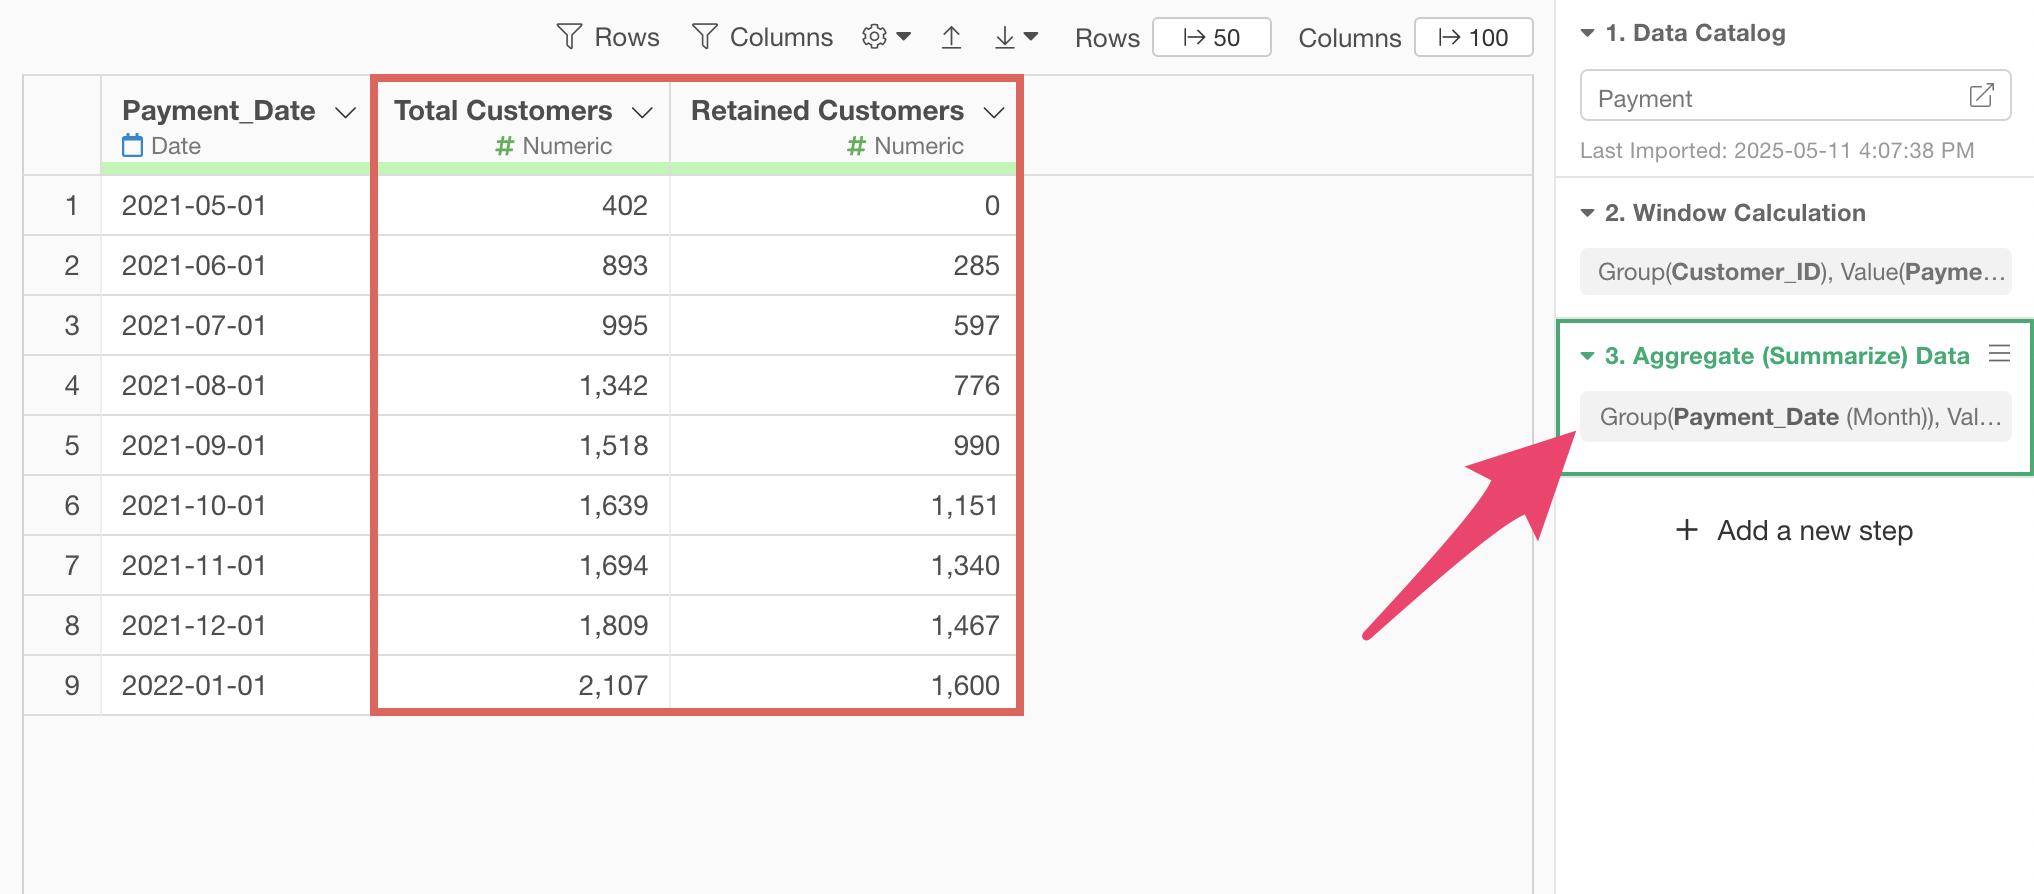
Change the column name to “Retained Customers” and press the “Run” button.
You have now aggregated the total number of customers and continuing customers by month.
3. Calculate Retention Rate
Finally, calculate the retention rate.
The challenge here is how to calculate the “number of customers” from
the “previous month”, but you can use the lag function to
get the value from the previous row.
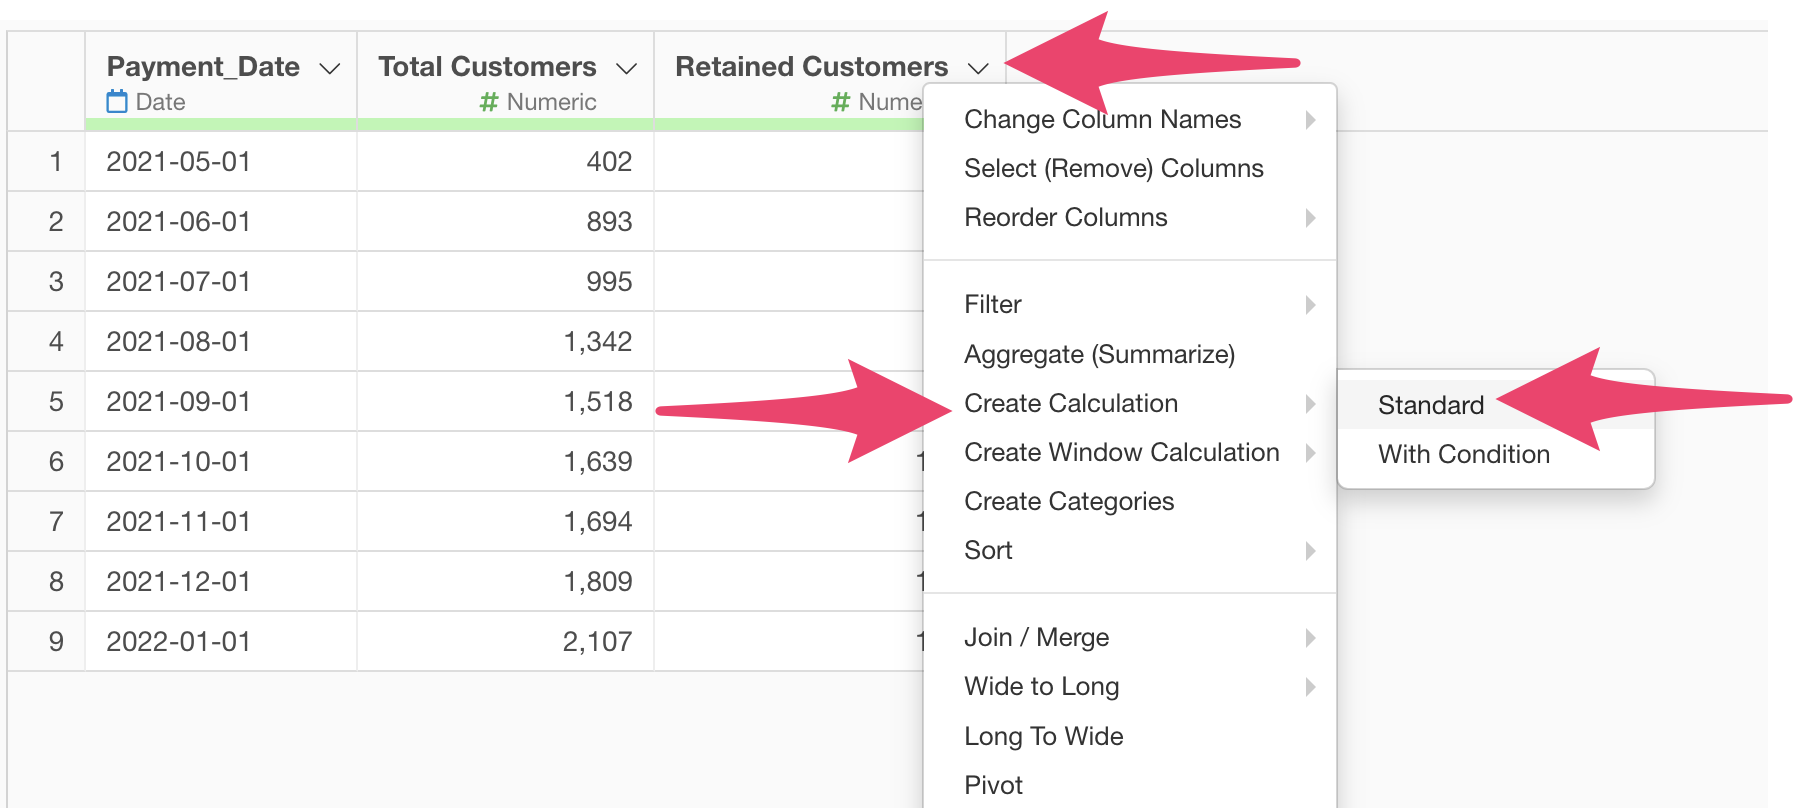
Select “Create Calculation” then “Standard” from the “Retained Customers” column header menu.
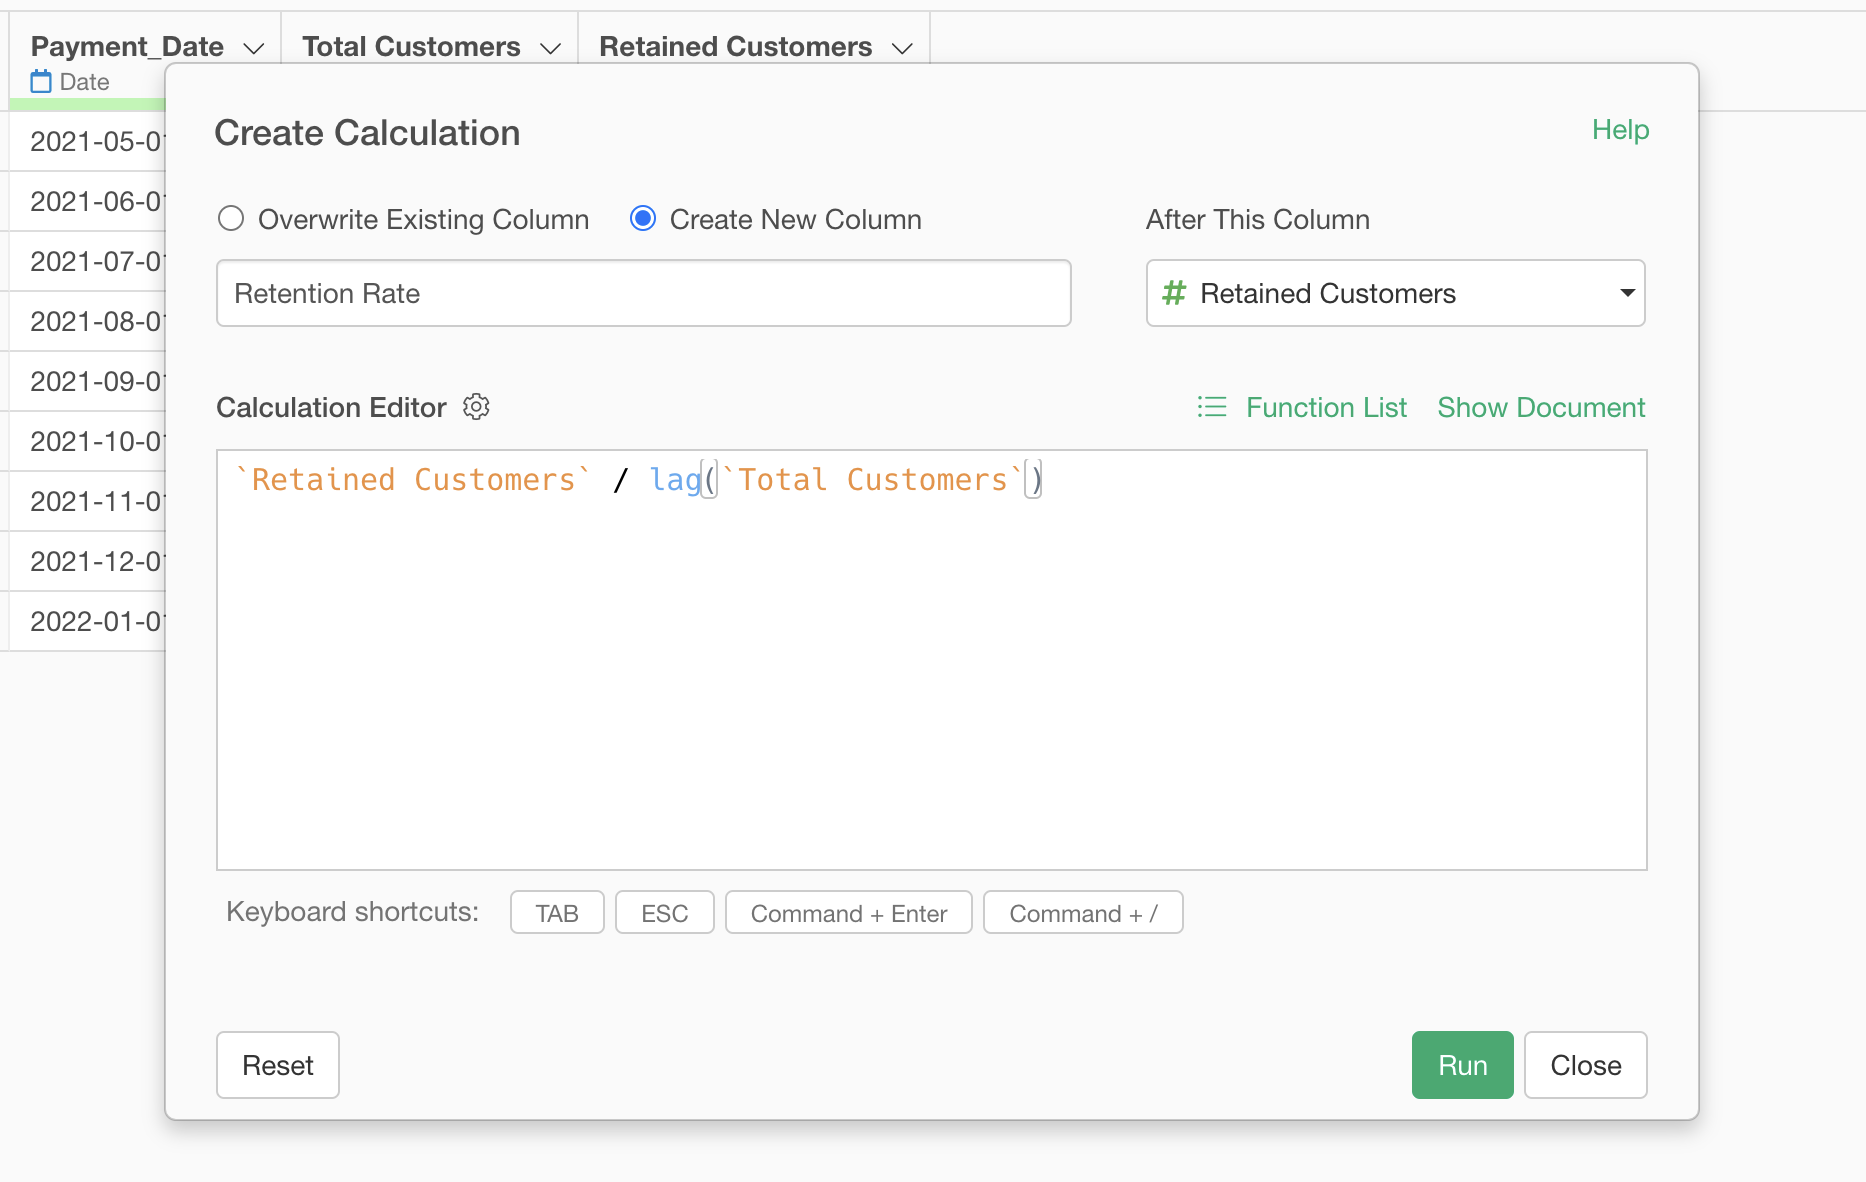
Enter `Retained Customers` / lag(`Total Customers`) in
the formula field and set the column name to “Retention Rate”.
Now you have calculated the retention rate.
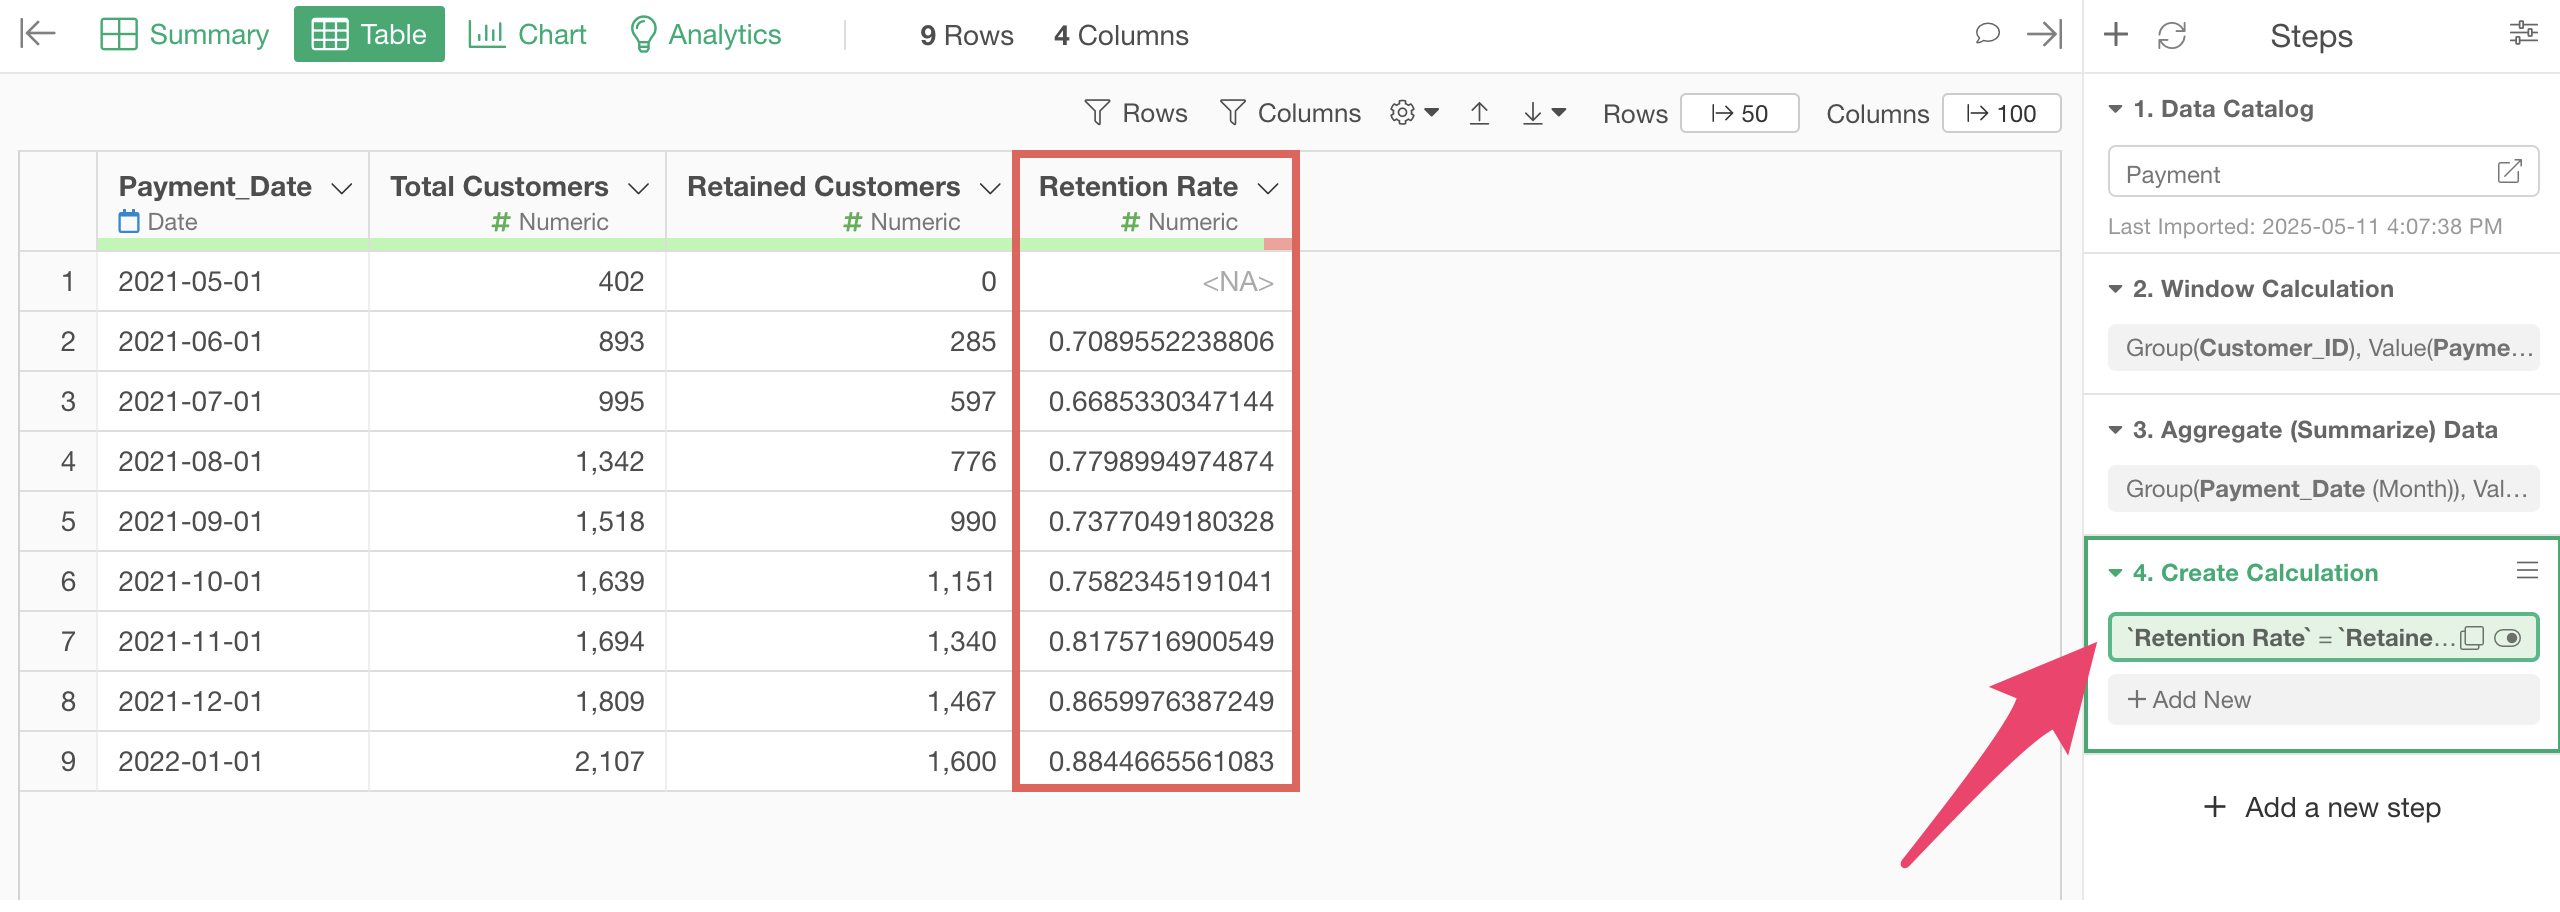
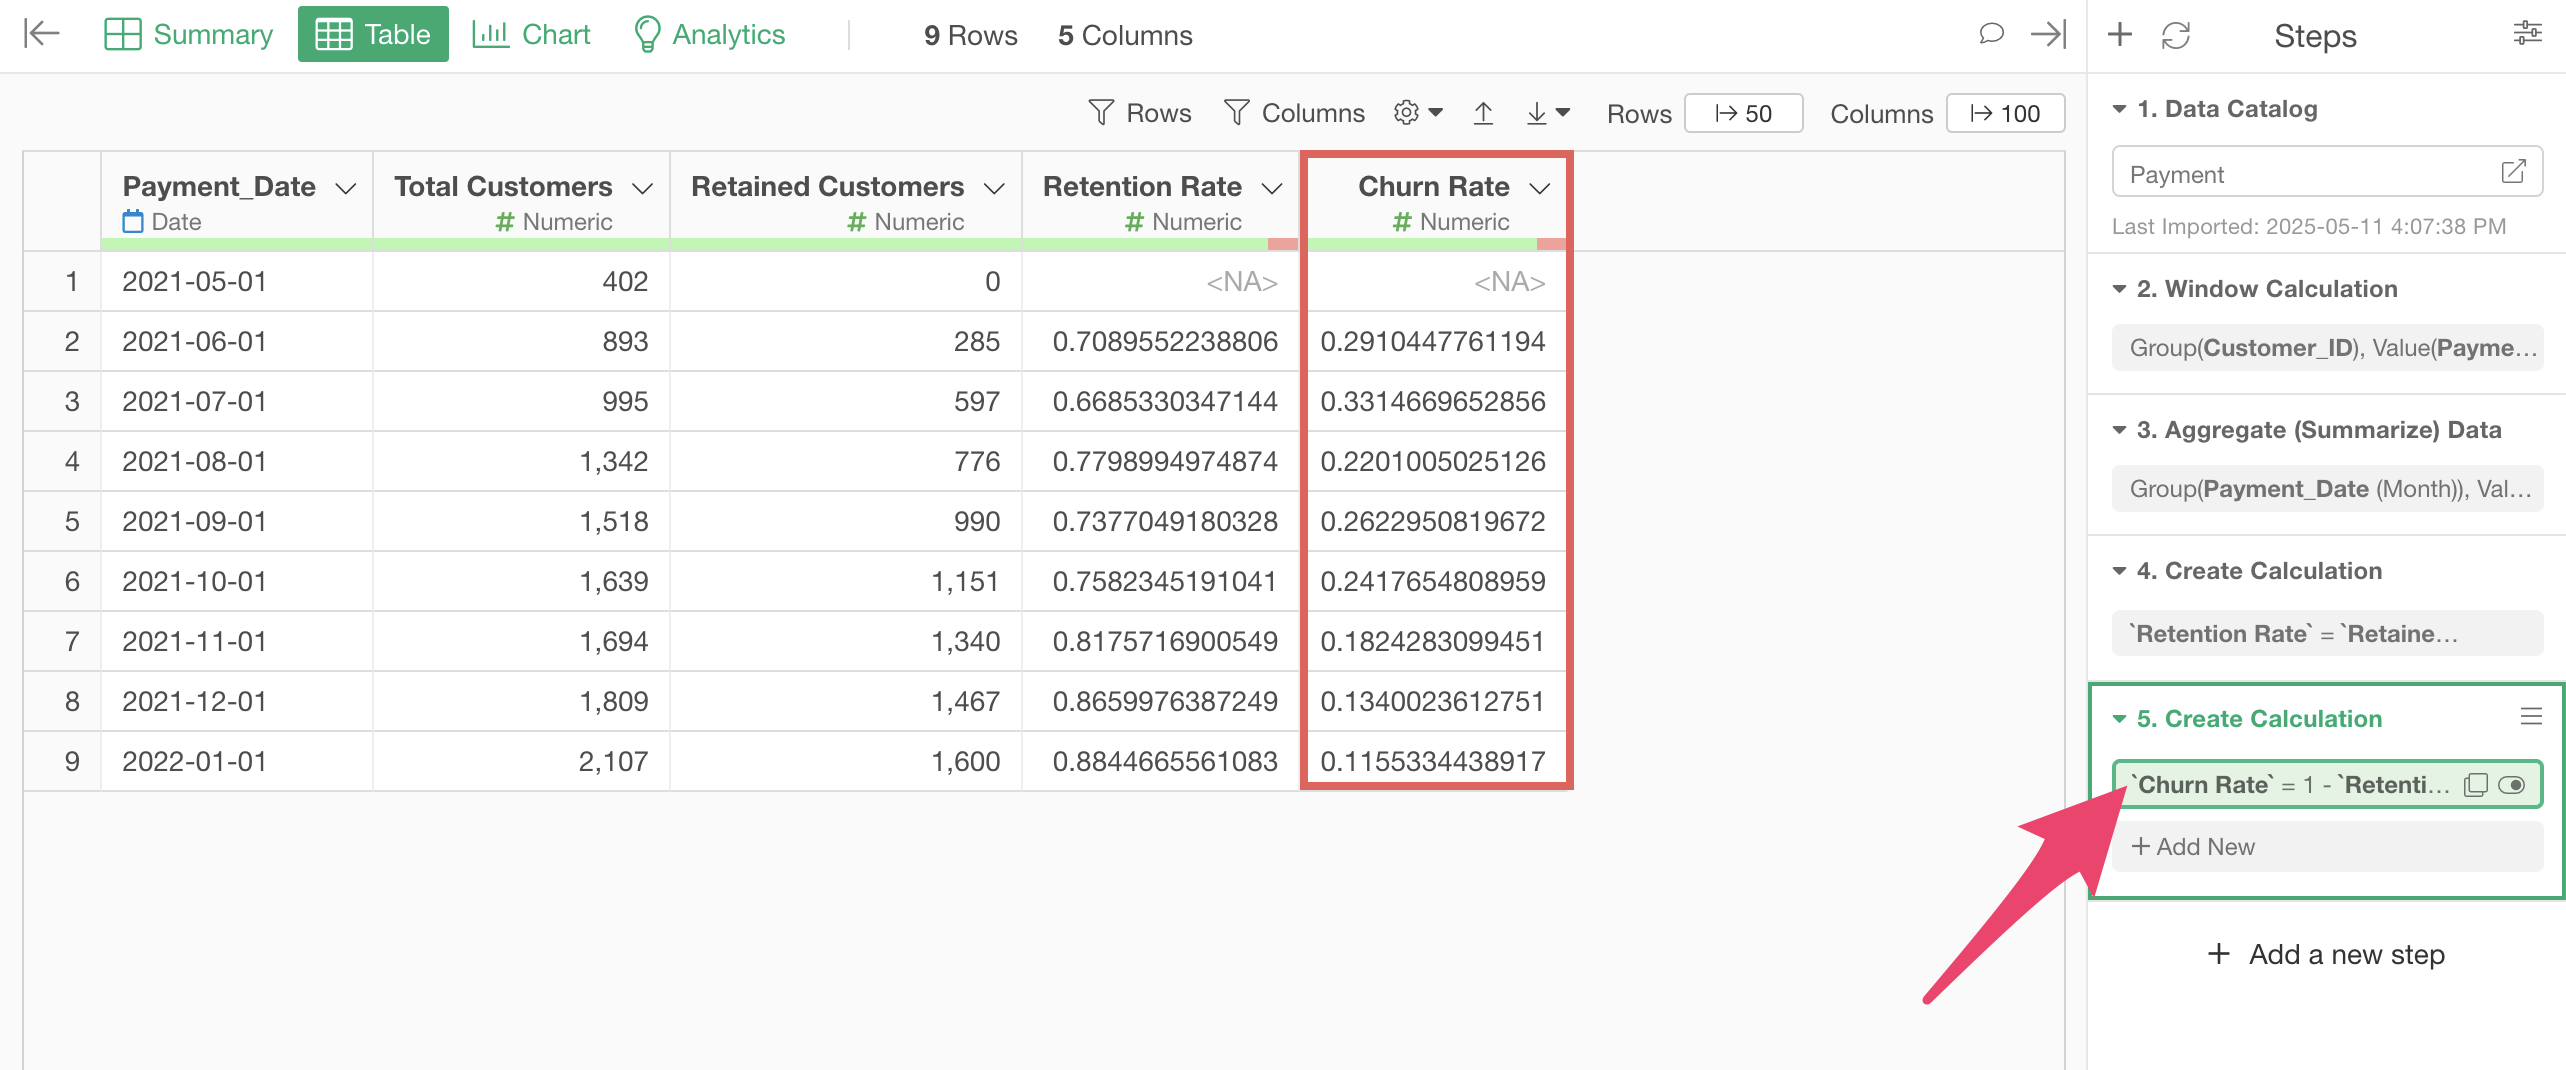
4. Calculate Churn Rate
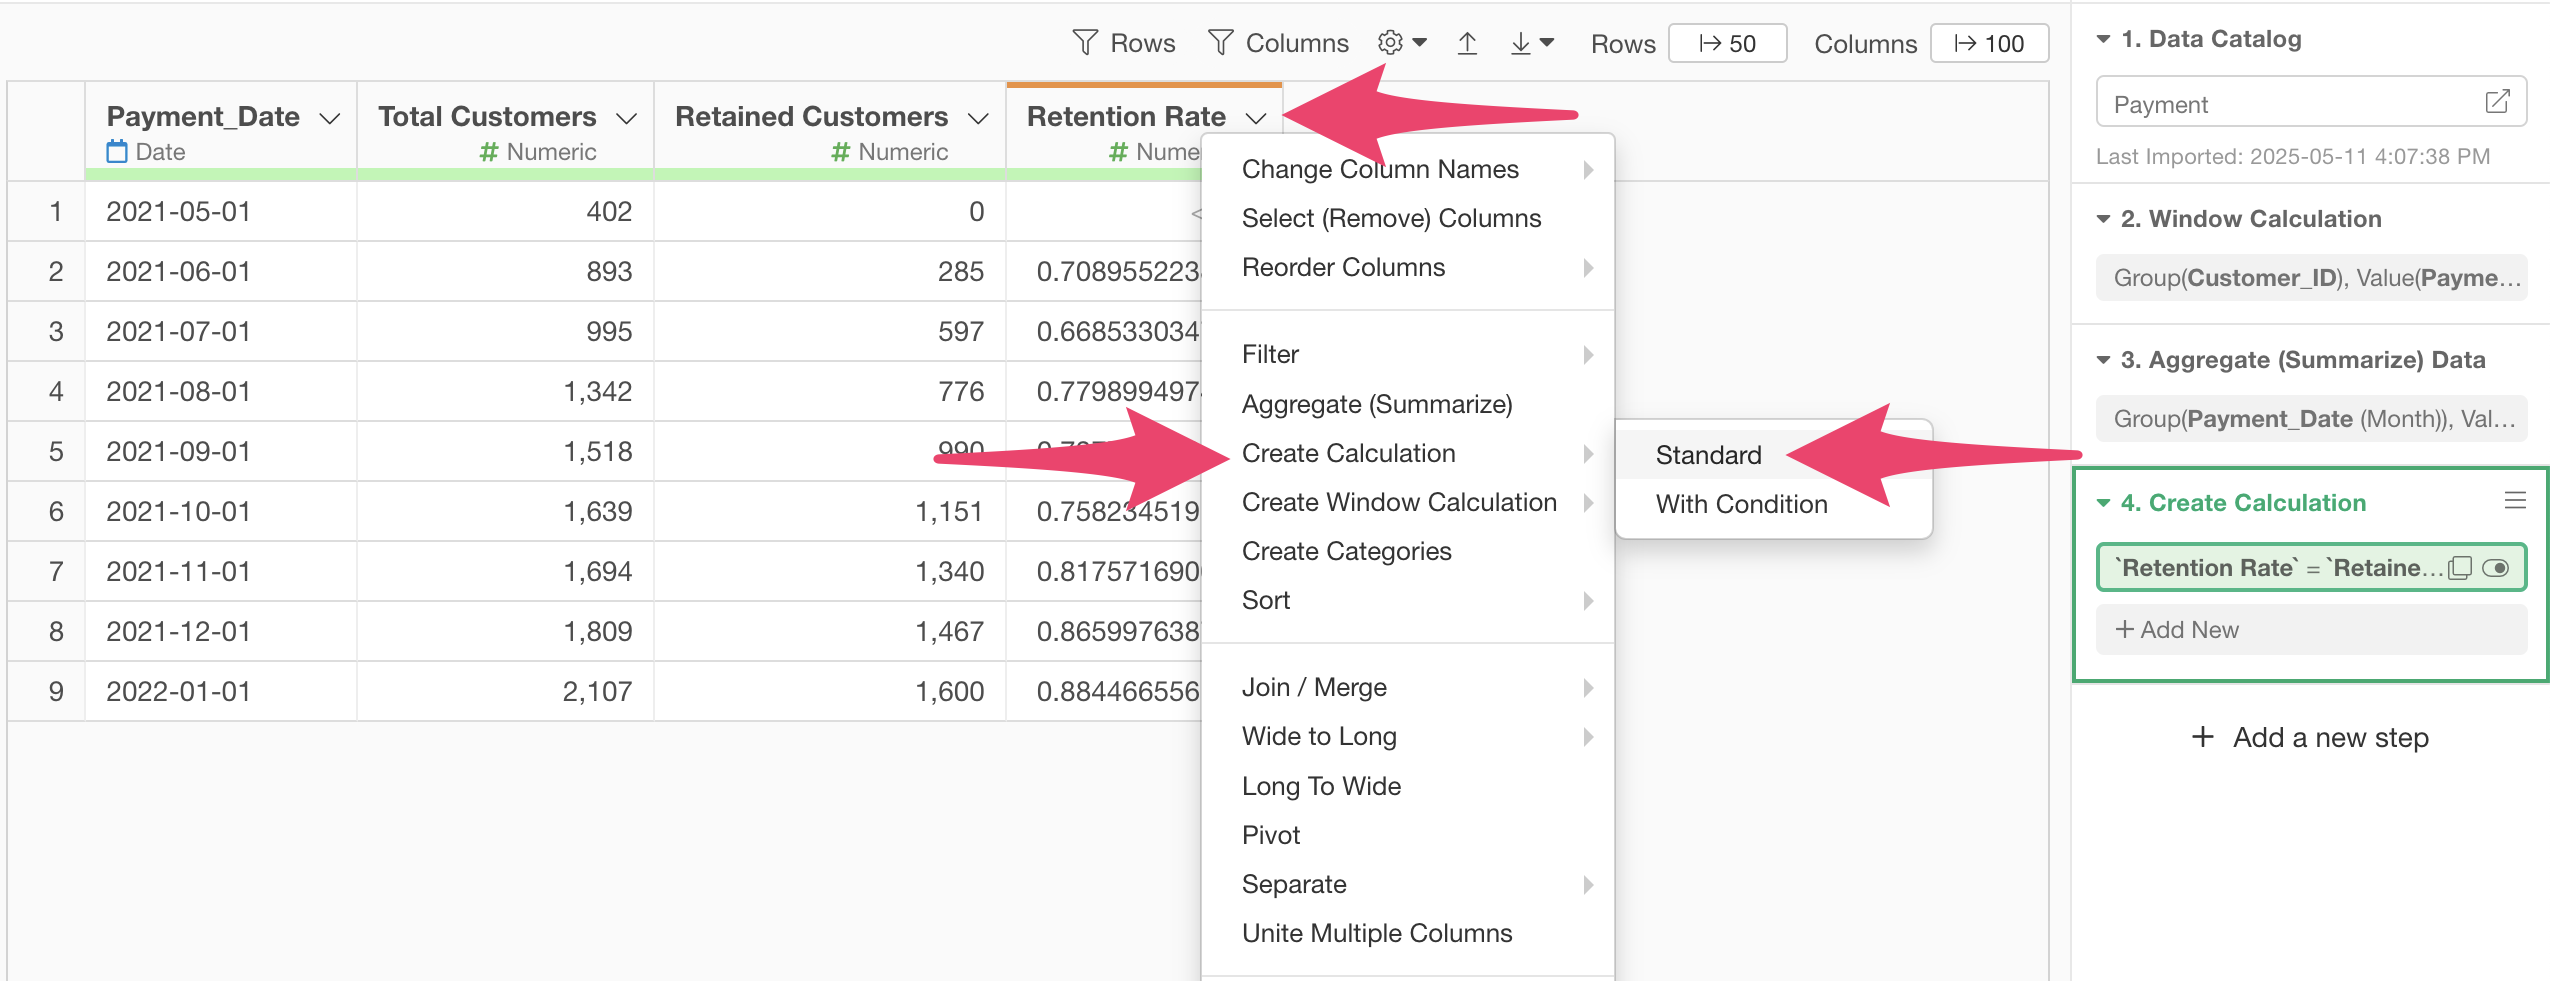
To calculate the churn rate (cancellation rate), select “Create Calculation” then “Standard” from the “Retention Rate” column header menu.
Enter 1- `Retention Rate` in the formula field.
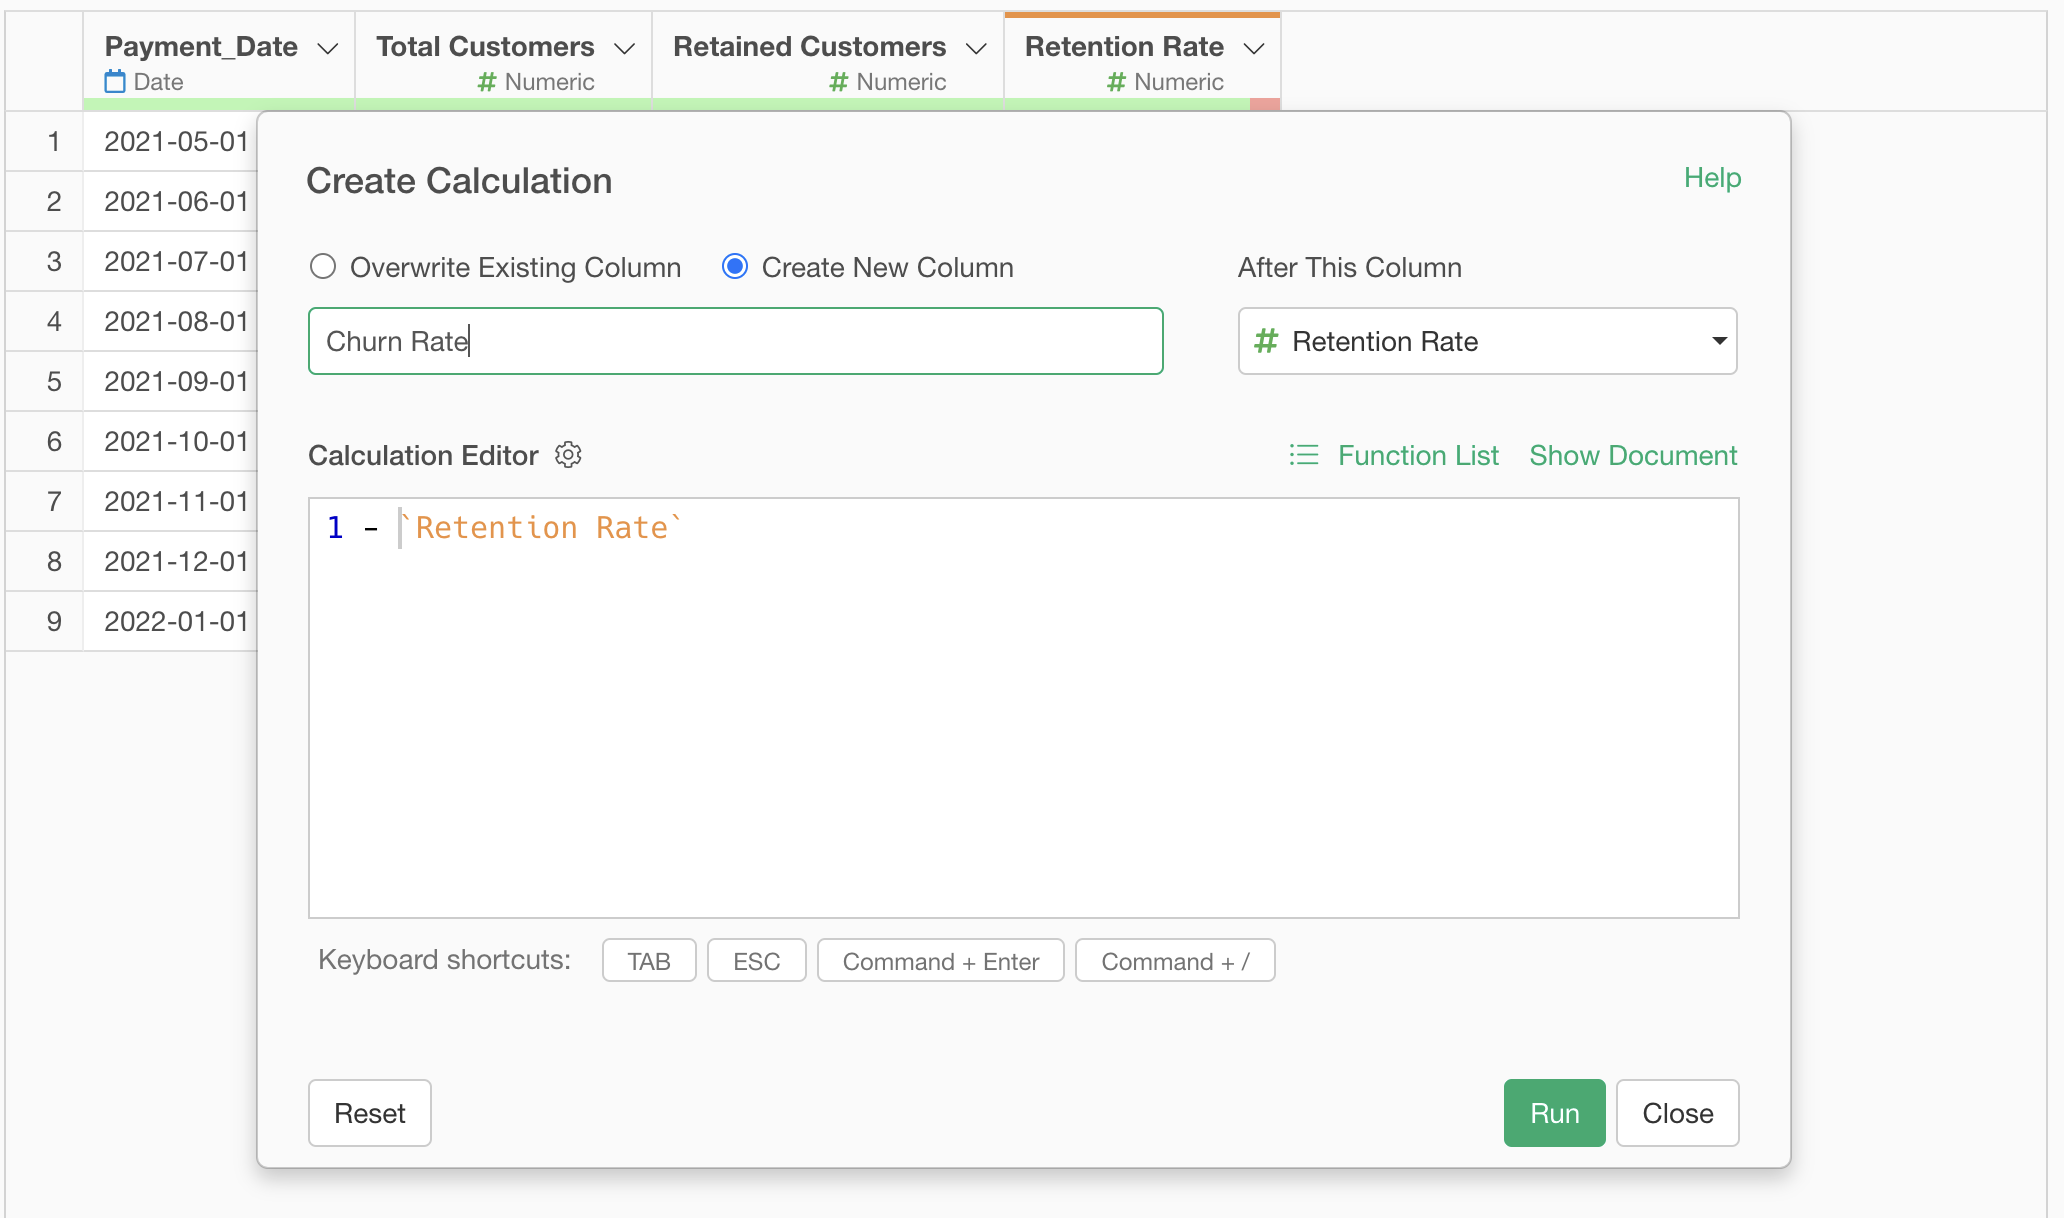 Make
sure “Create New column” is checked, change the column name to “Churn
Rate” or “Cancellation Rate”, and press the “Run” button.
Make
sure “Create New column” is checked, change the column name to “Churn
Rate” or “Cancellation Rate”, and press the “Run” button.
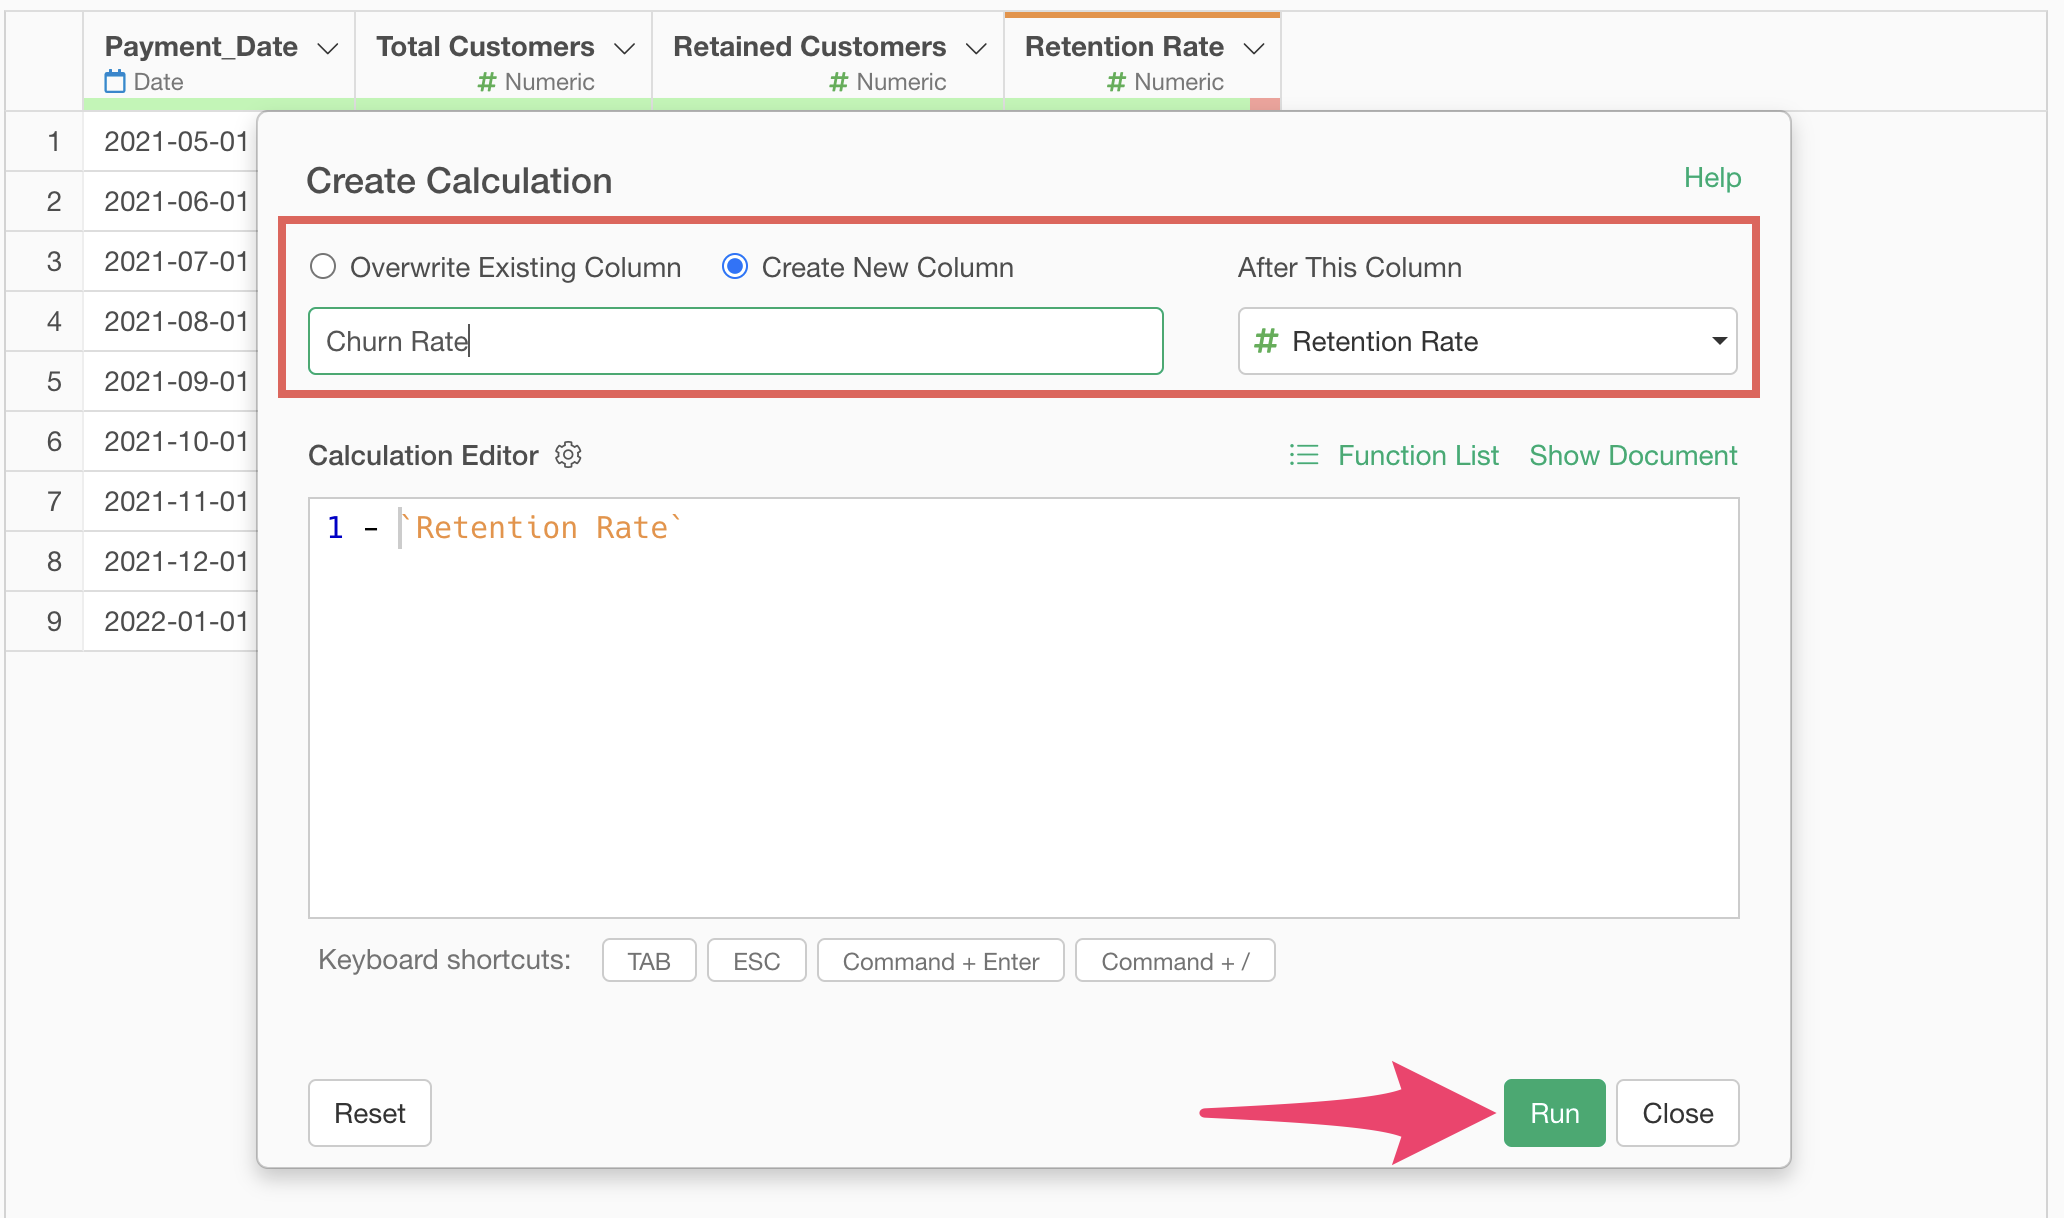
You have now completed the calculation of the churn rate (cancellation rate).