SaaS KPI Series - Conversion
Conversion marks the key moment when a prospect becomes a paying customer. It directly reflects the effectiveness of marketing and sales efforts, making it a vital metric for sales, marketing, and executive teams.
Conversion Rate
When we think about it, it’s obvious that customers don’t suddenly become customers one day. In many cases, they go through stages as prospects, often called trials or leads, before starting a service subscription. This process of a prospect becoming a paid customer is called conversion.
Conversion efficiency can be measured by calculating the percentage of prospects who become new customers. This metric is called the conversion rate.
For example, if 3 out of 12 prospects convert, the conversion rate is 25%.
How to Increase Conversions
There are two main approaches to increasing the number of conversions:
One approach is to attract prospects who are more likely to perceive the value of your service, or to improve your service and product to enhance the conversion rate.
Another approach is to increase the number of prospects through advertising and other promotional activities. While this involves costs, maintaining a steady conversion rate means conversions will naturally grow as the prospect pool expands.
Conversion Rate Improvement VS. Lead Increase
So which is more important: improving the conversion rate or increasing leads?
There’s no definitive answer as it depends on the business stage and situation.
However, in many cases, increasing leads costs money. If acquisition efficiency is poor, spending money to increase leads becomes wasteful, so many businesses start by focusing on improving the conversion rate first.
How to Calculate Conversion Rate
Now let’s look at how to calculate the conversion rate using actual data.
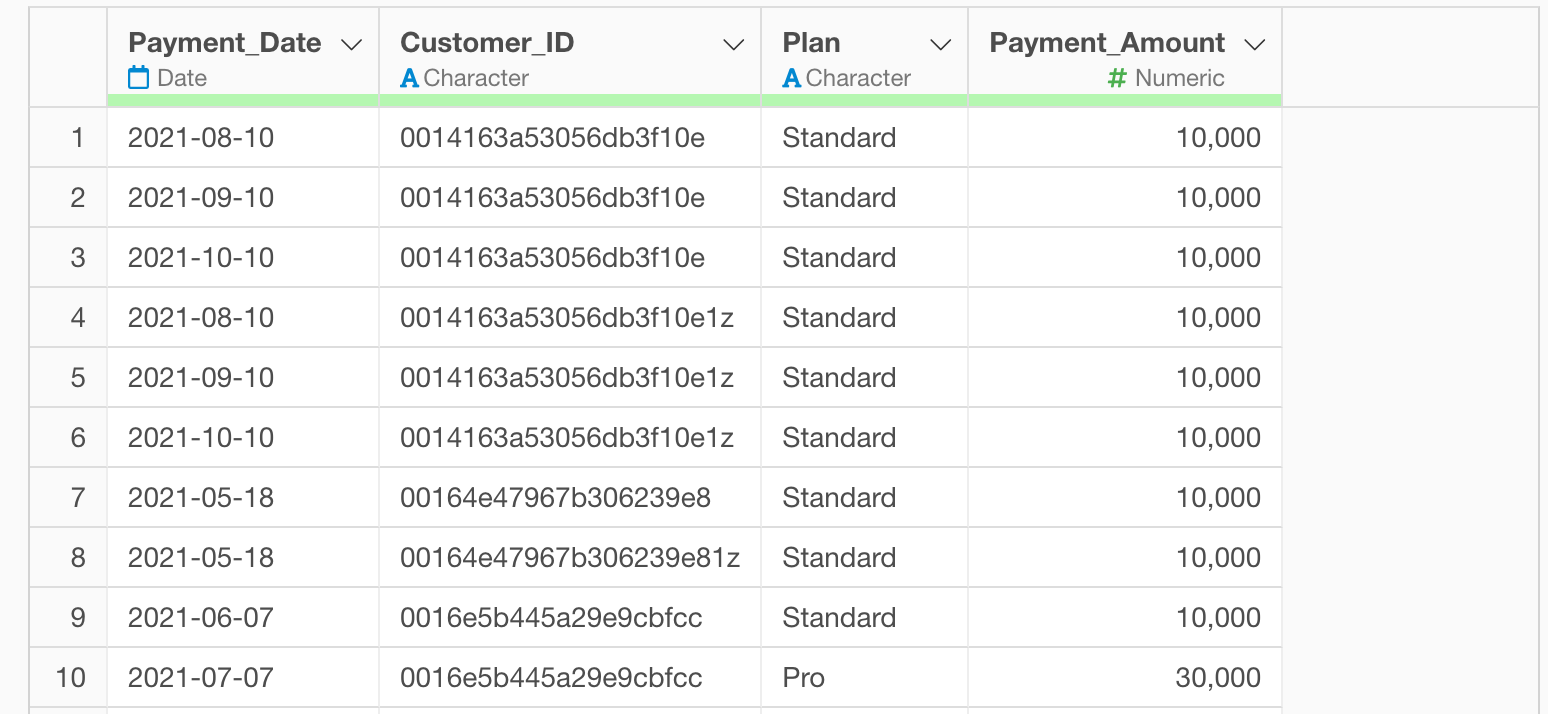
In this example, we’ll use payment data from a subscription business where each row represents one payment transaction, including Customer_ID, Payment_Date, Payment _Amount, and other information. (You can download the data from this page)
In Exploratory, there are two methods for creating metrics:
- AI Prompt: Creating metrics using natural language processing
- UI Menu: Processing data through UI-accessible menus to create metrics
This note will introduce both methods.
“AI Prompt” is only available for users with paid licenses such as Business Plan or Personal Plan, or users who are currently trialing those plans.
Also, AI Prompt is only available when your device is connected to the internet.
If you are not using the above plans or your device is not connected to the internet, please proceed to the “Calculate Conversion Rate with UI” section.
Calculate Conversion Rate with AI Prompt
In this section, you’ll learn how to create metrics using the AI Prompt feature. (For more details about AI Prompt, see this guide.)
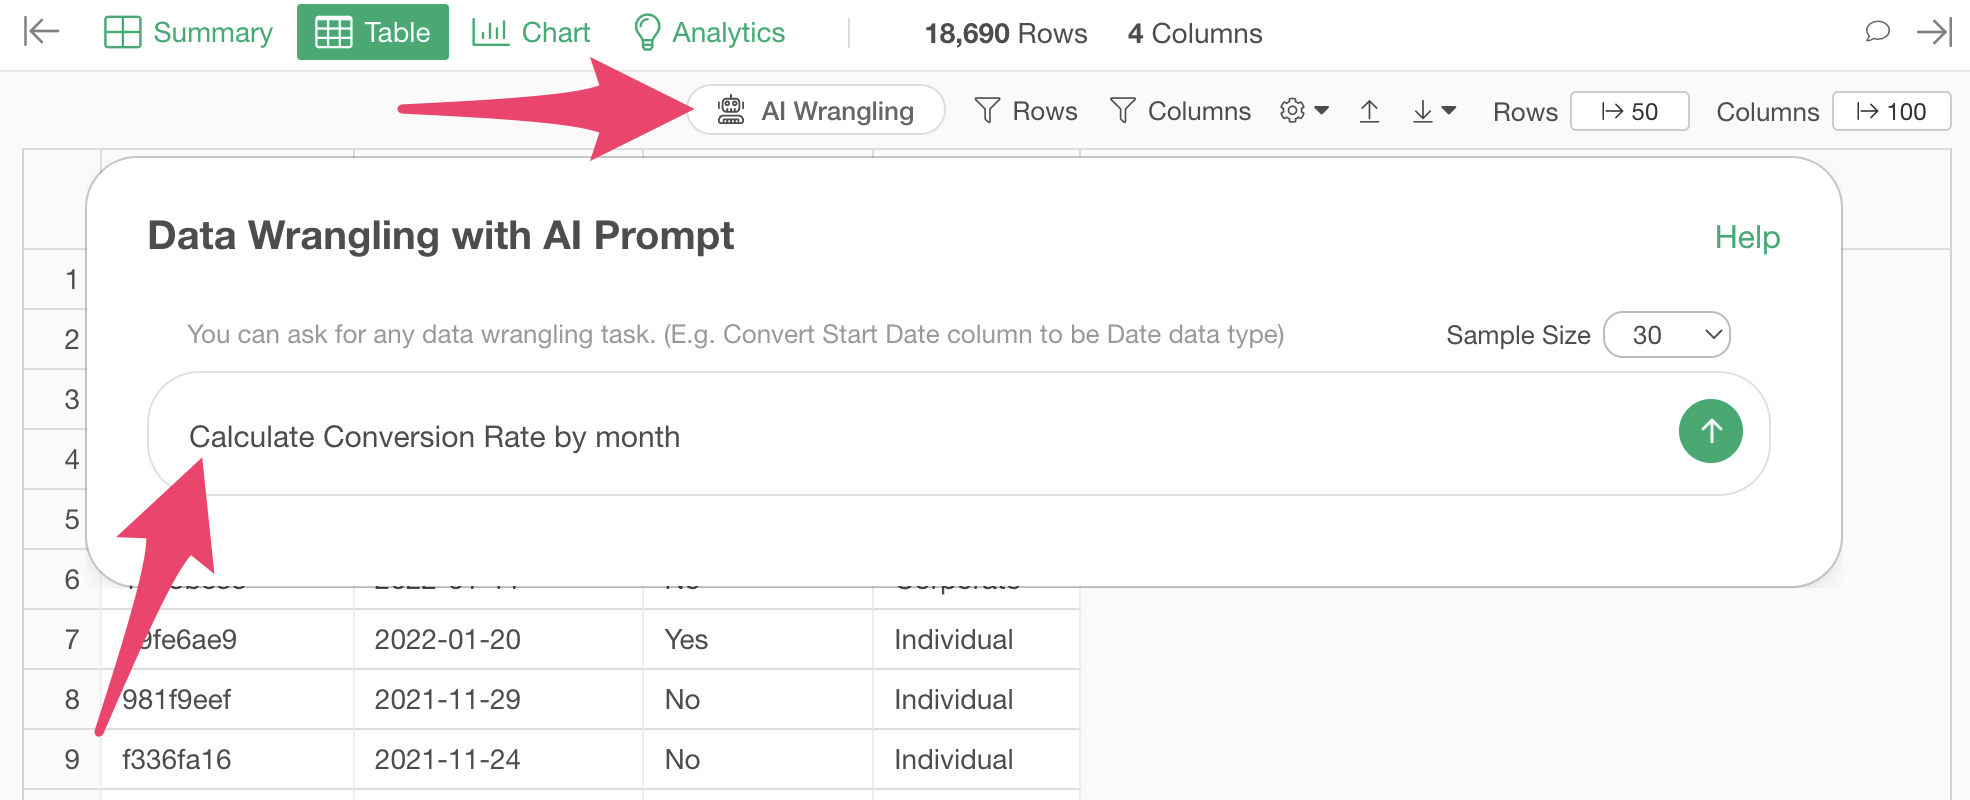
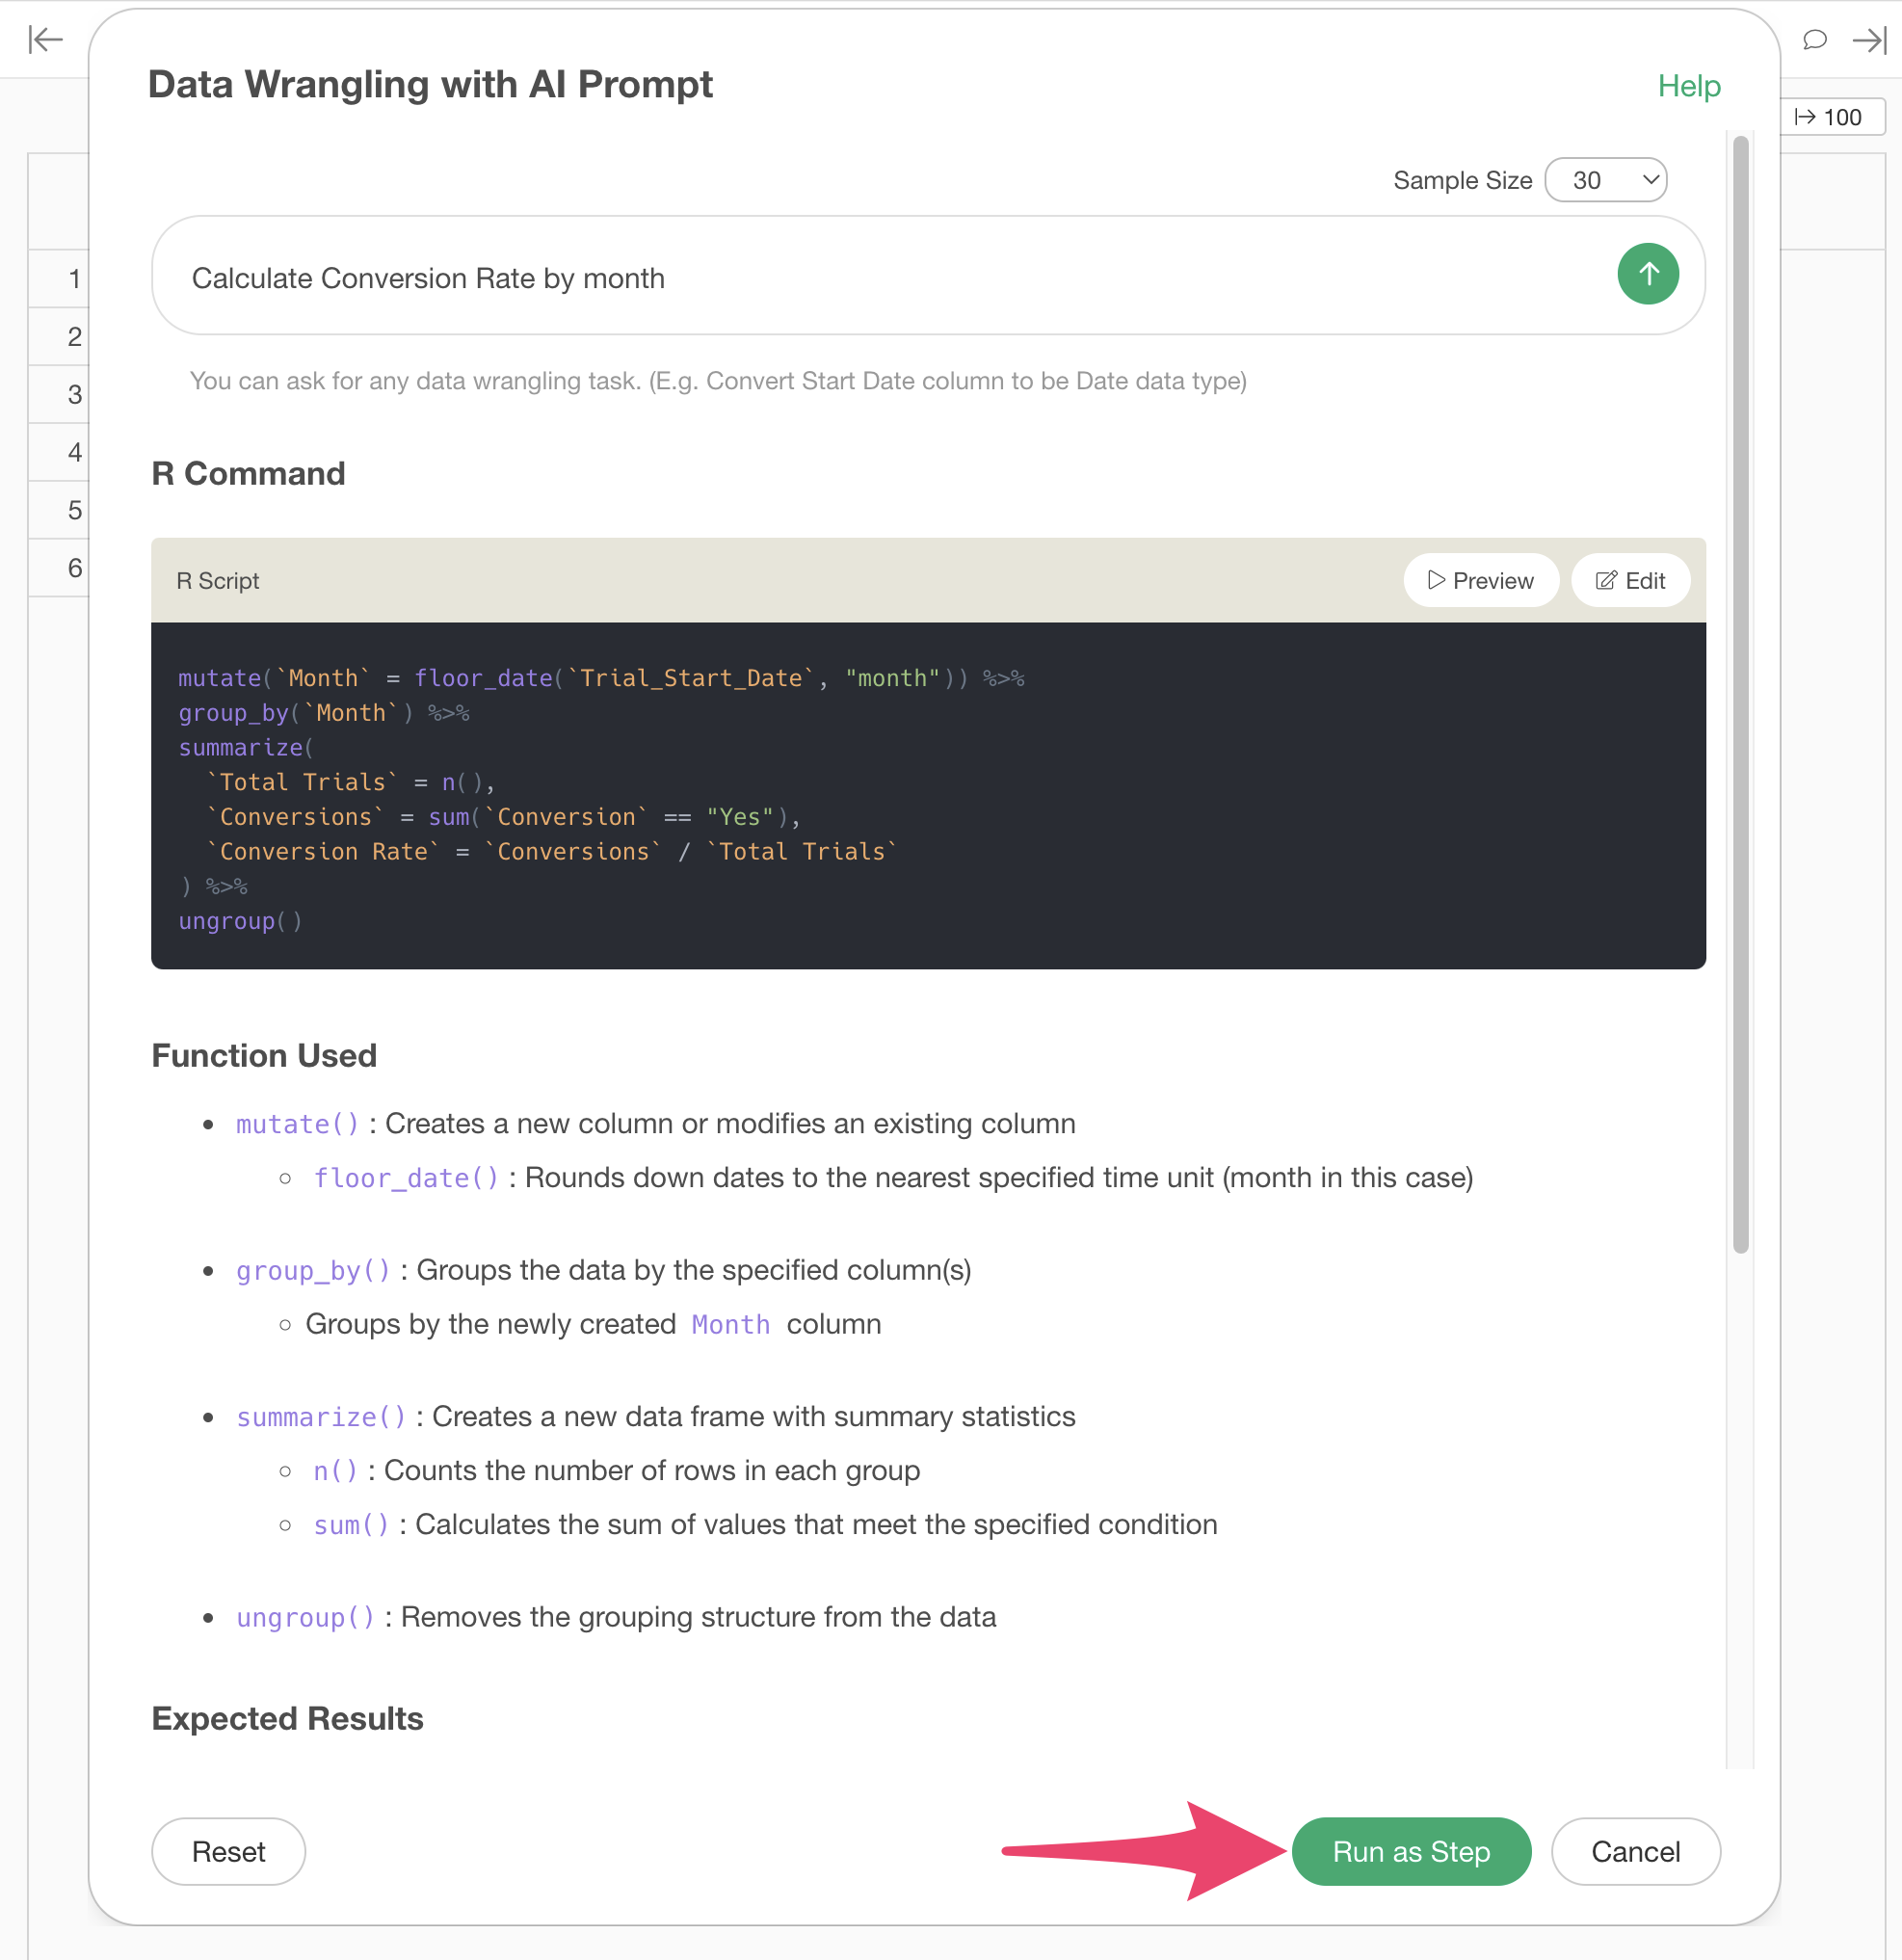
Click the “AI Wrangling” button. When the AI Prompt dialog appears, enter a prompt like the one below and run it:
Calculate conversion by month
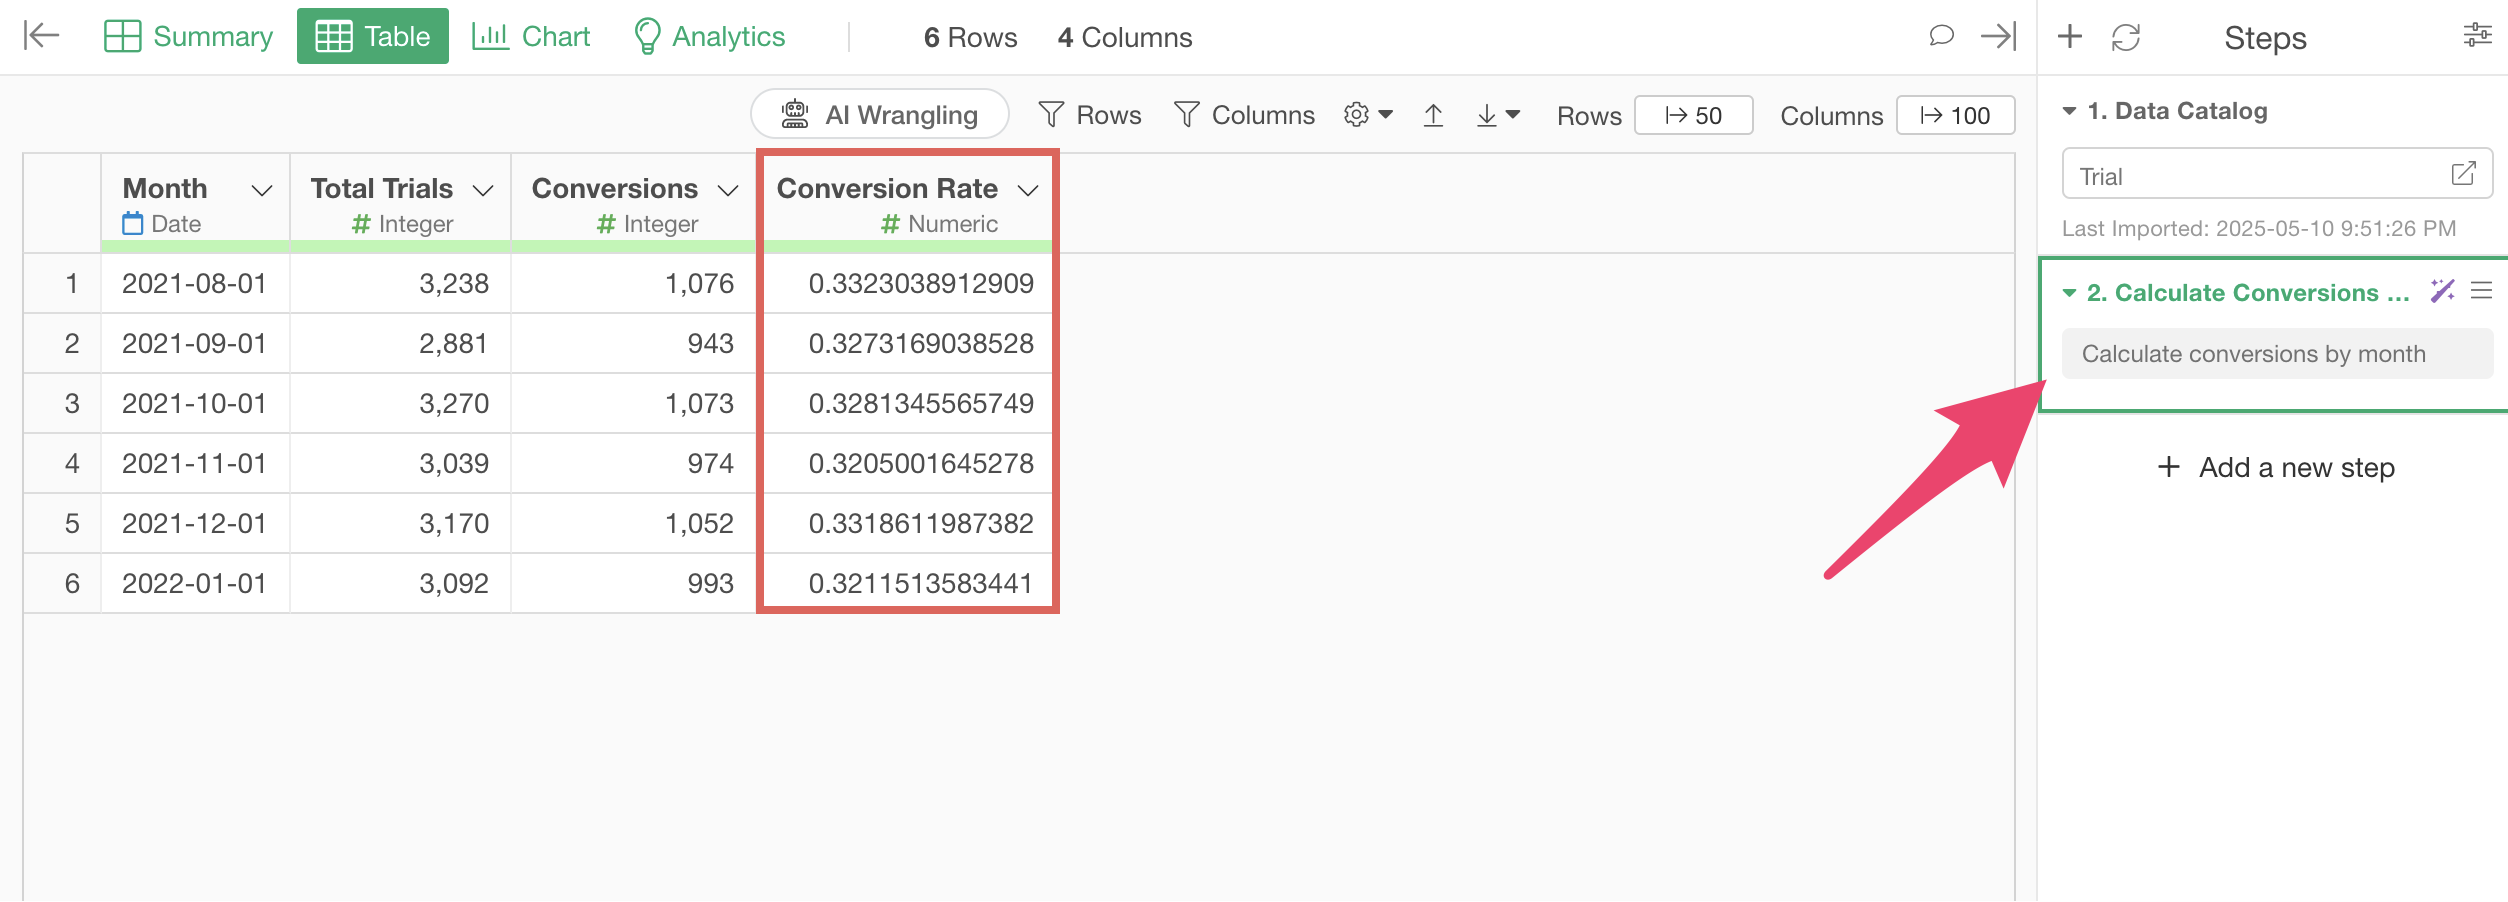
Code to calculate the conversion rate will be generated. Check the results and click the “Run as Step” button.
The step is added, and the conversion rate is calculated.
Calculate Conversion Rate with UI
Now let’s look at how to calculate the conversion rate using the UI.
In our data, converted customers have “Yes” in the “Conversion” column. If we want to calculate conversion rates by month, we can aggregate the data by calculating the proportion of “Yes” values.
For such calculation, if the “Conversion” column is a “Logical type,” we can aggregate by counting “TRUE” or calculating the “proportion of TRUE” to determine conversion numbers or rates.
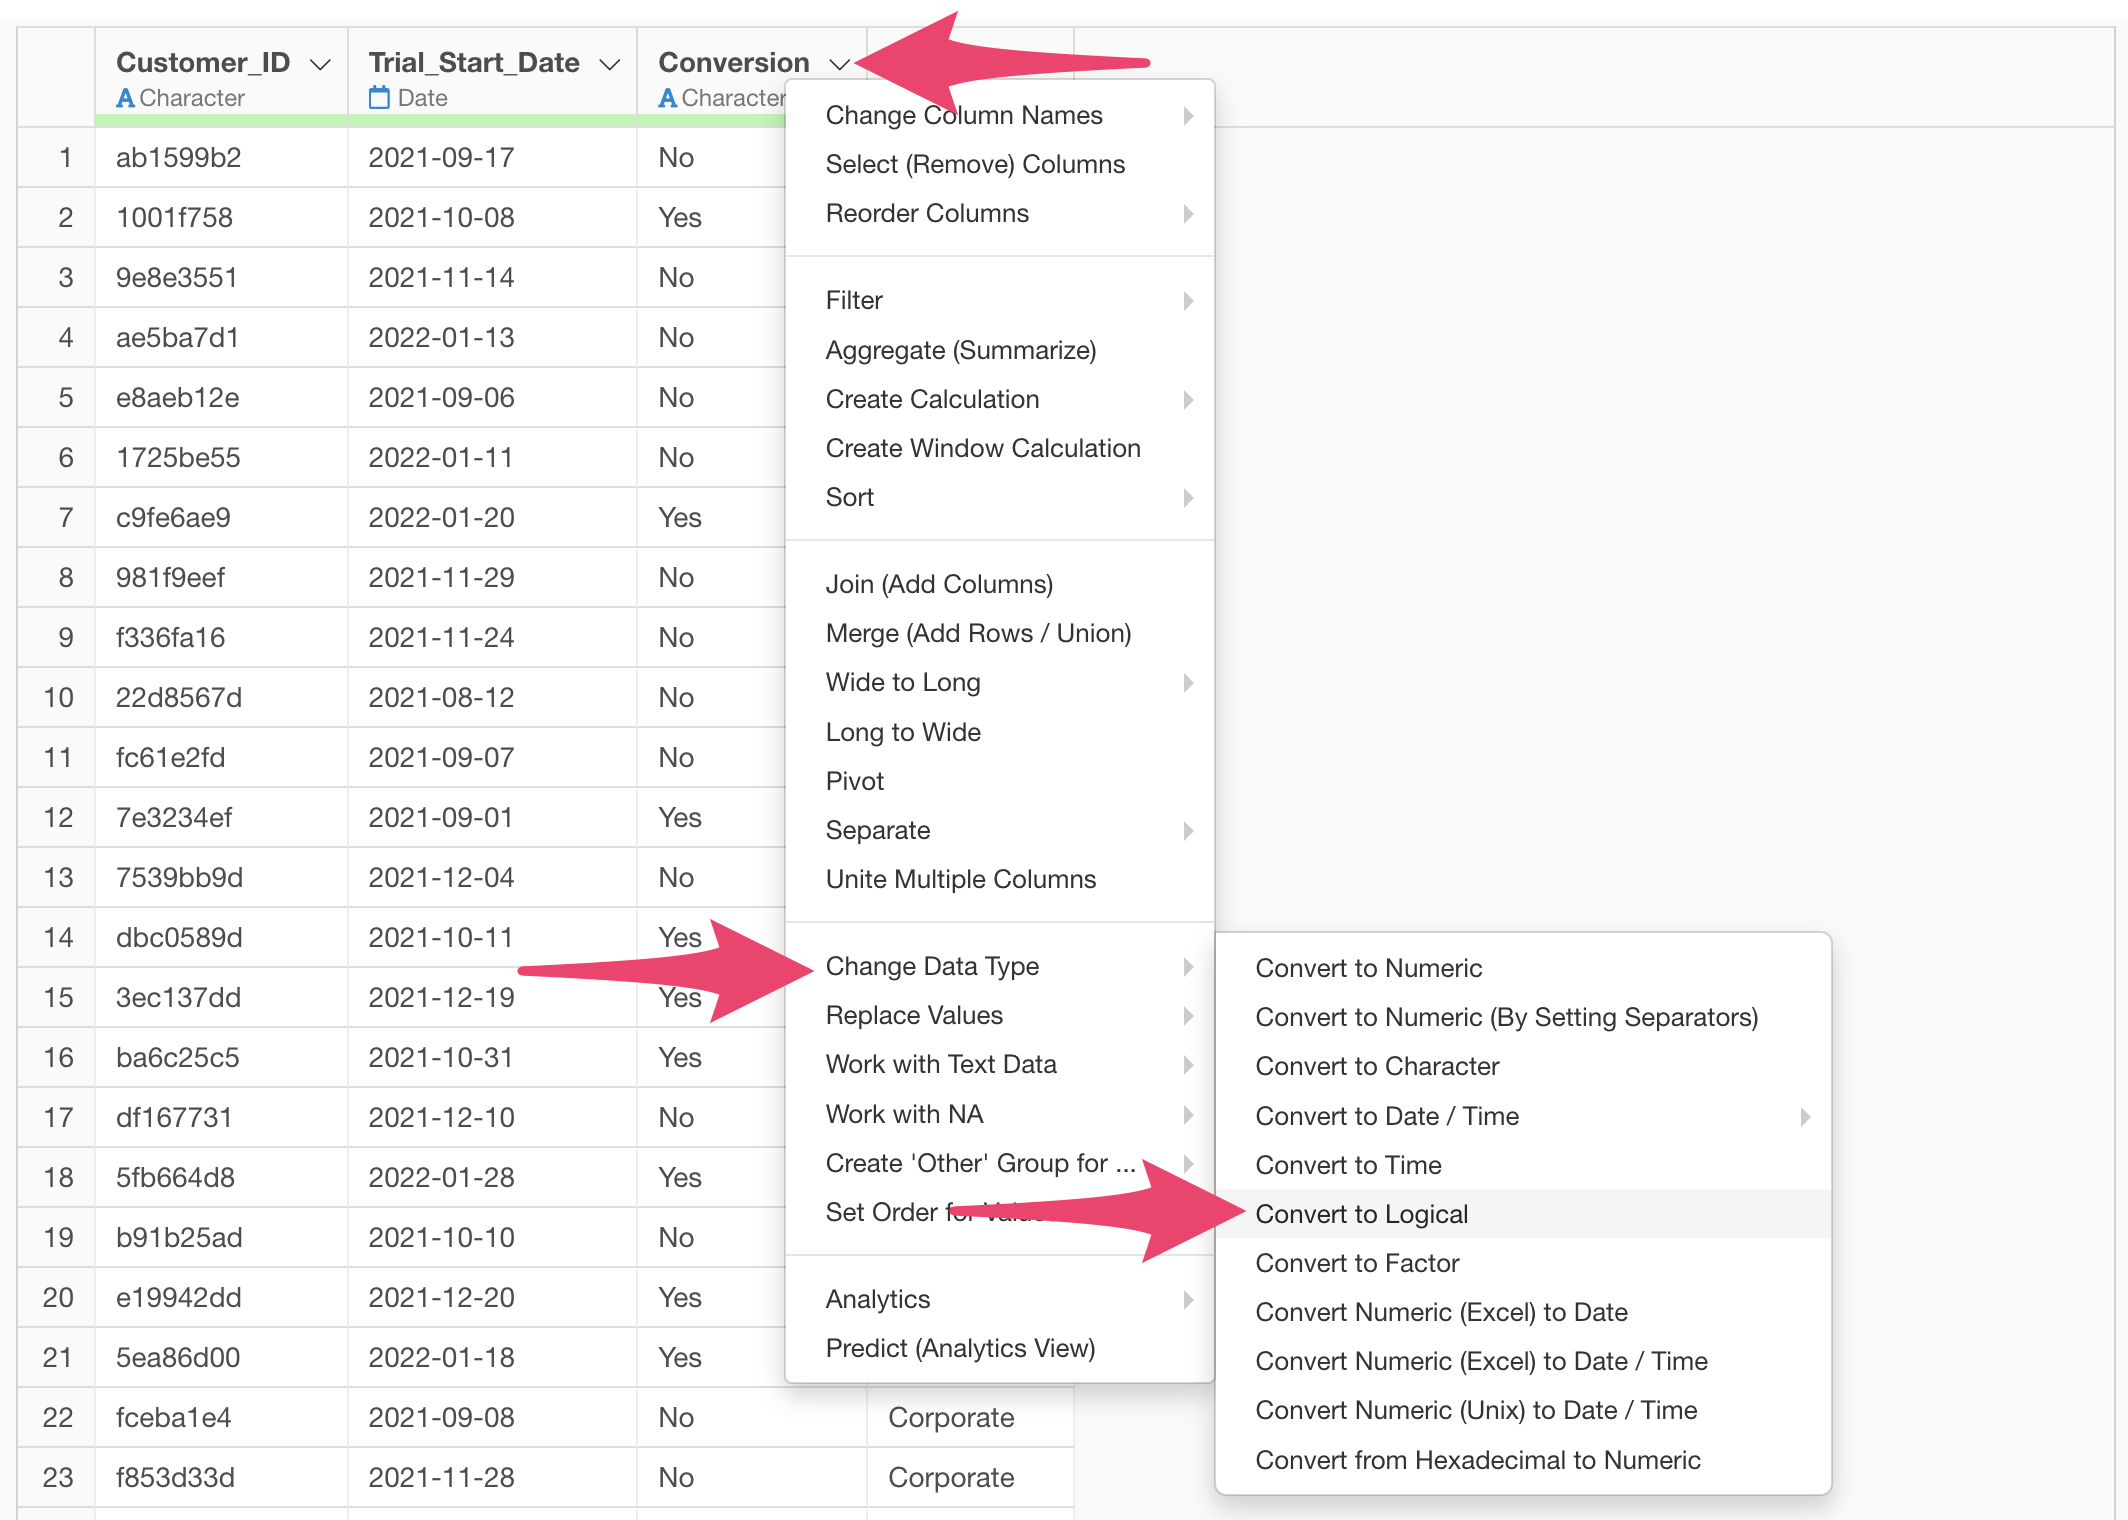
To do this, select “Convert Data Type” from the “Conversion” column header menu, then “Convert to Logical”.
When the calculation dialog appears, run it as is.
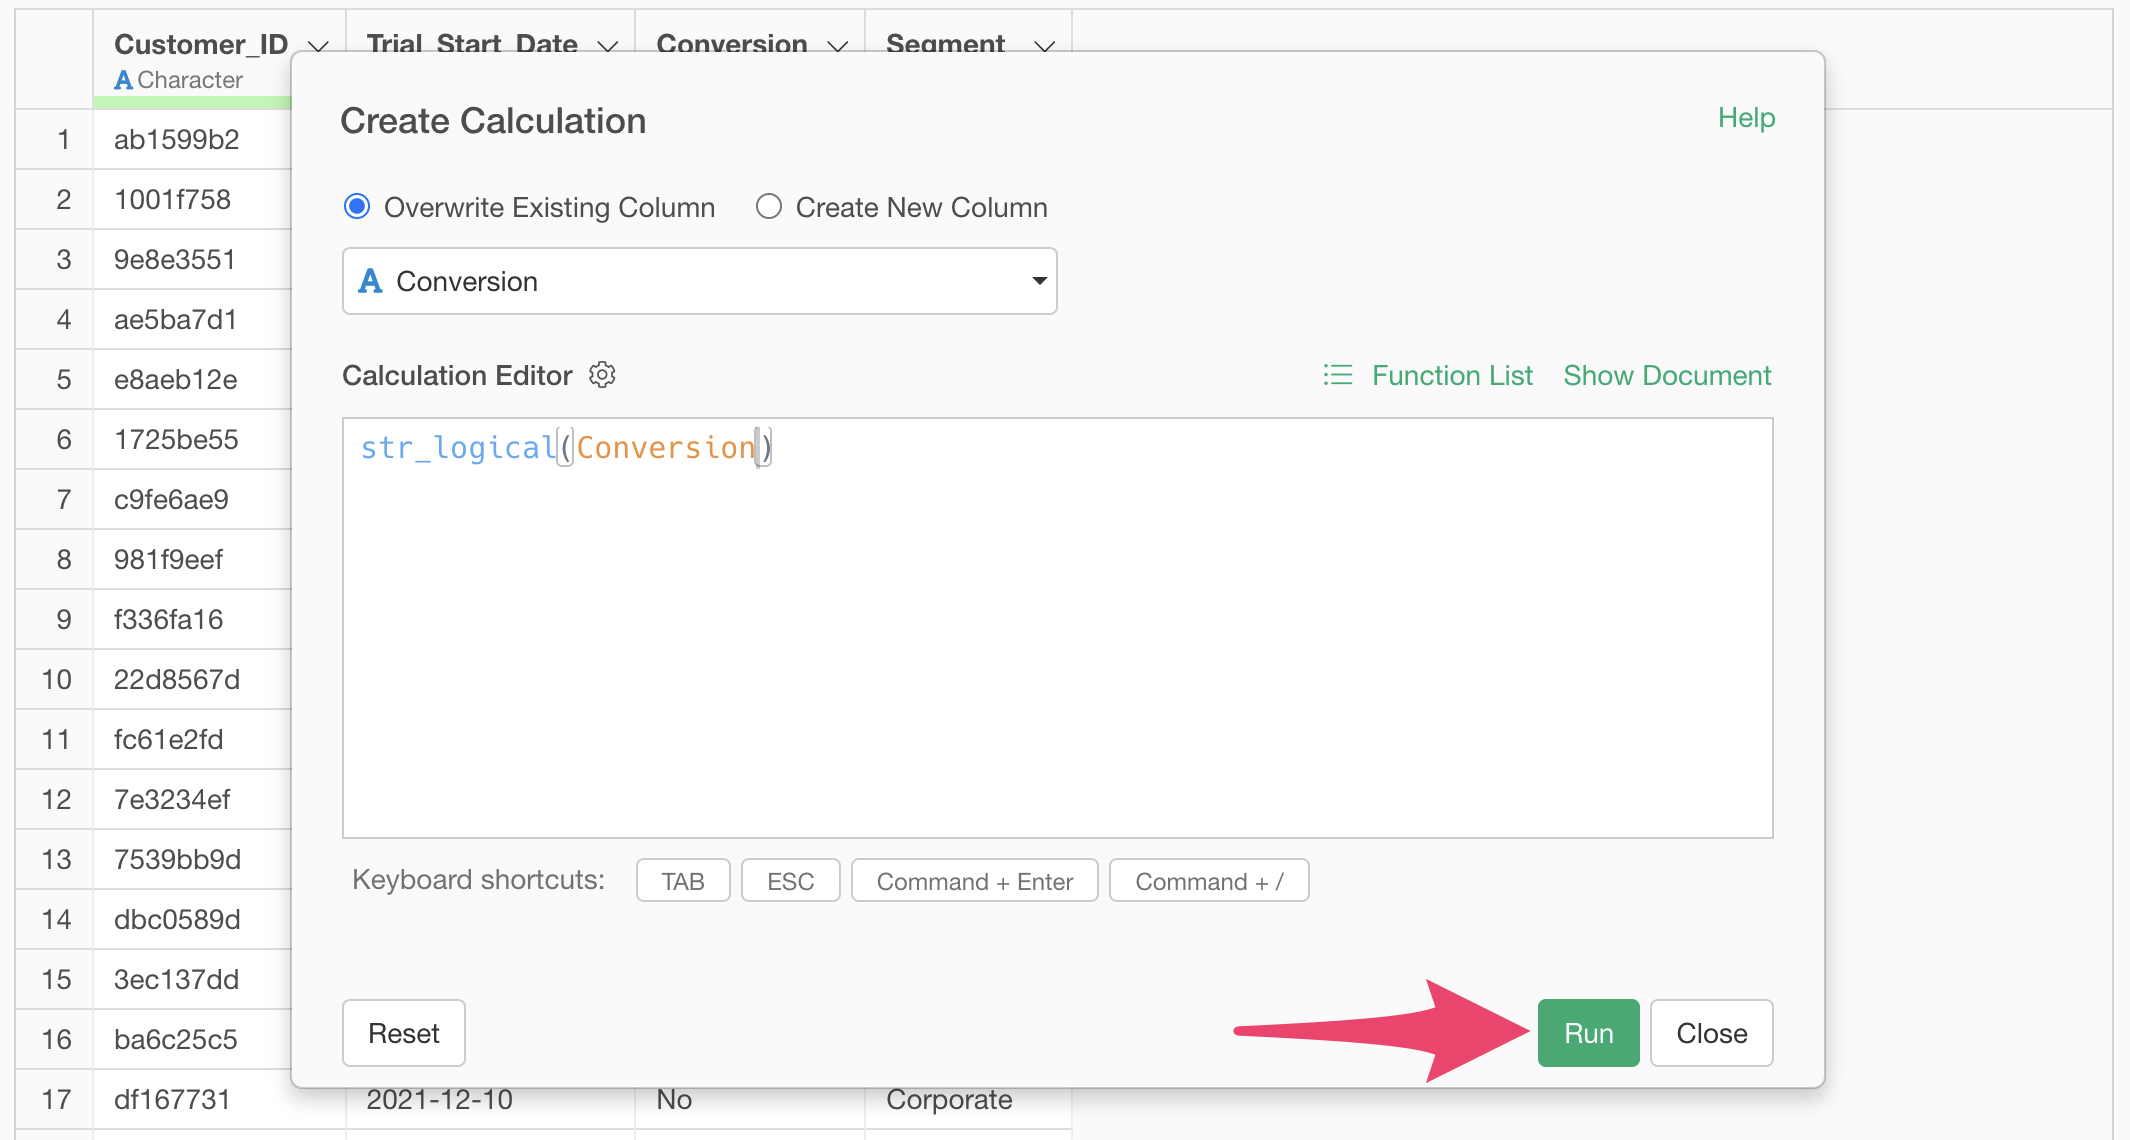
The str_logical function converts data to logical type. For data with only Yes/No or 1/0 values, no special settings are needed.
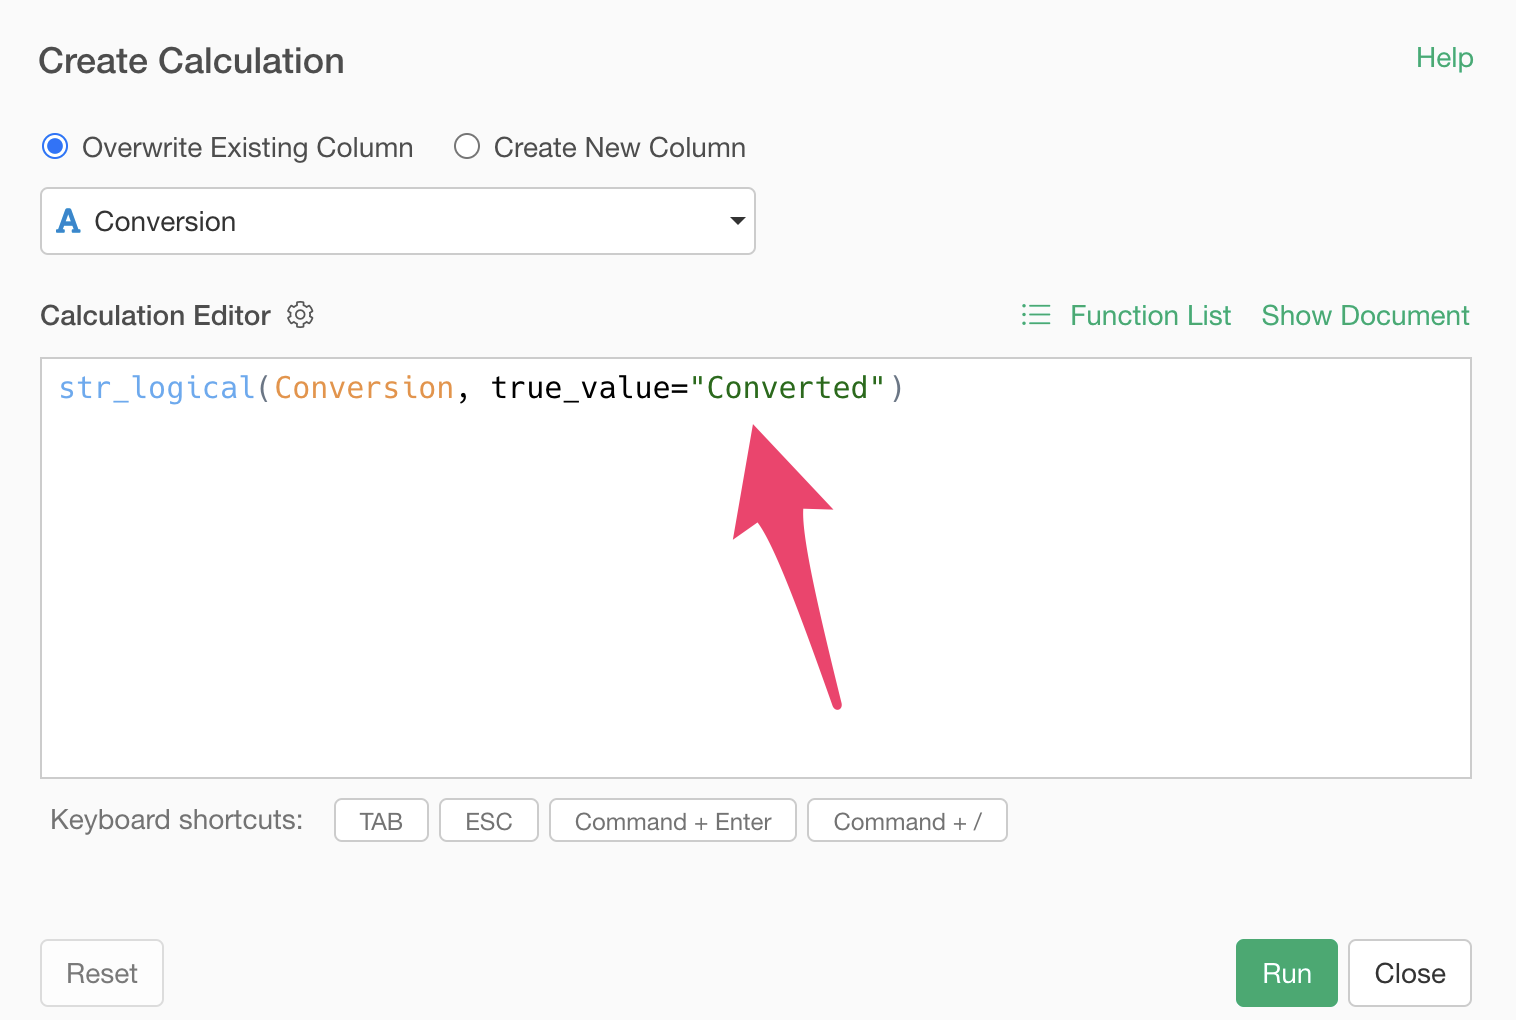
However, for data with values other than Yes/No or 1/0, such as
“Converted”, you can specify which value should be converted to TRUE
using the true_value argument.
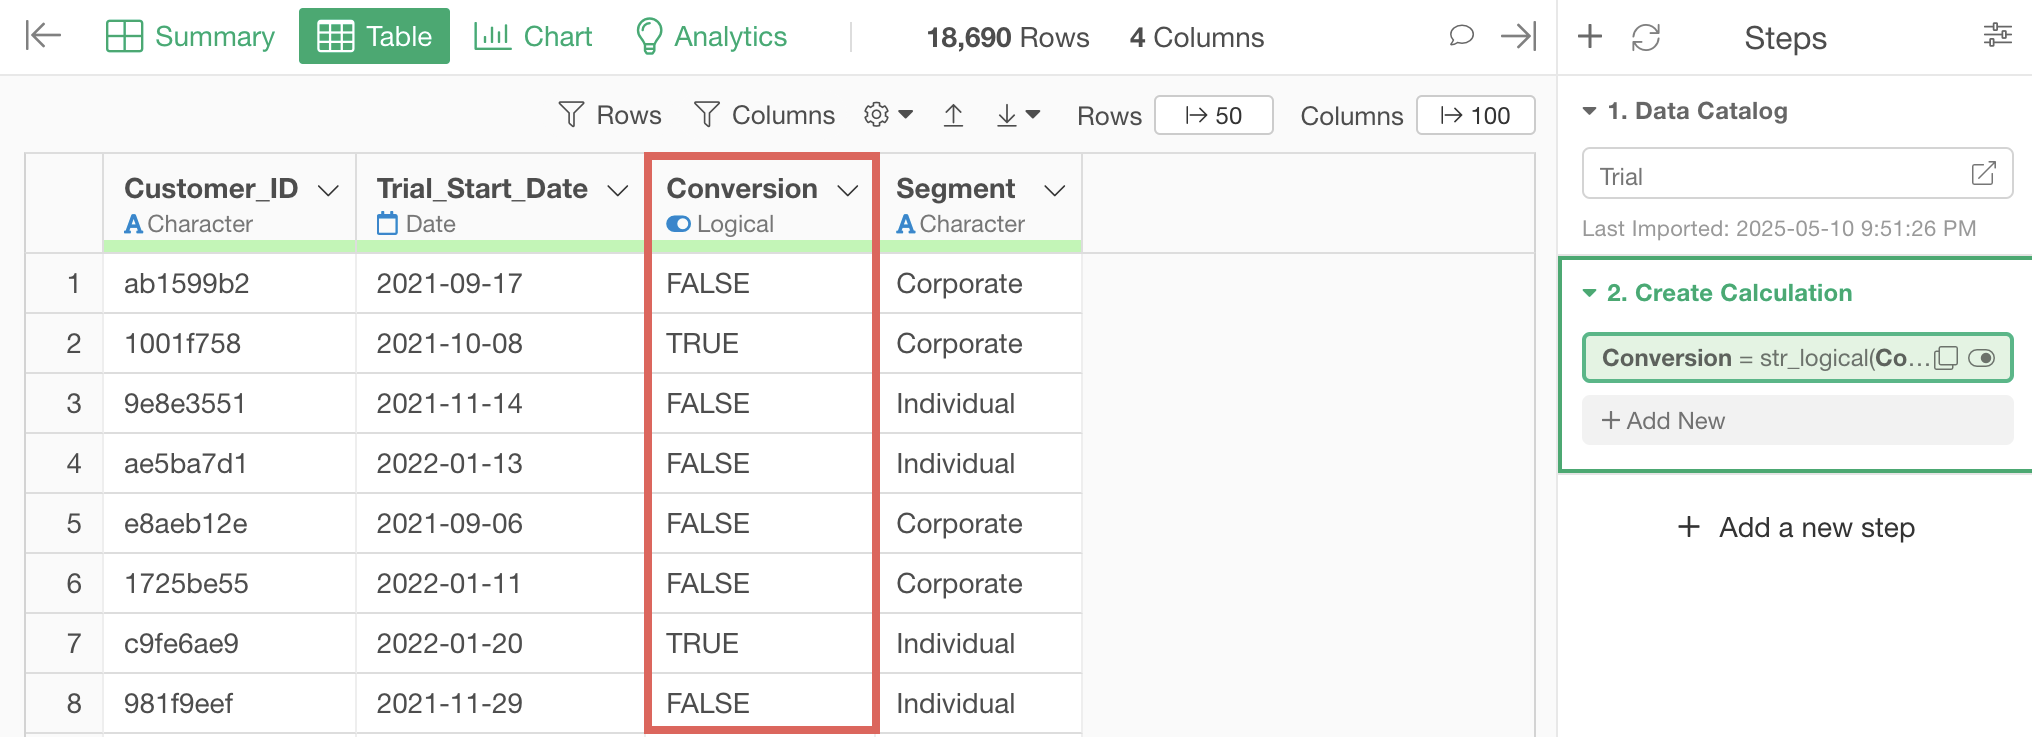
After executing the calculation dialog, you can confirm that the “Conversion” column has been converted to Logical type.

Calculate Conversion Rate in a Chart
After converting the conversion to Logical type, you can calculate the conversion rate directly in a chart. You can also add a data processing step to aggregate the conversion rate as data.
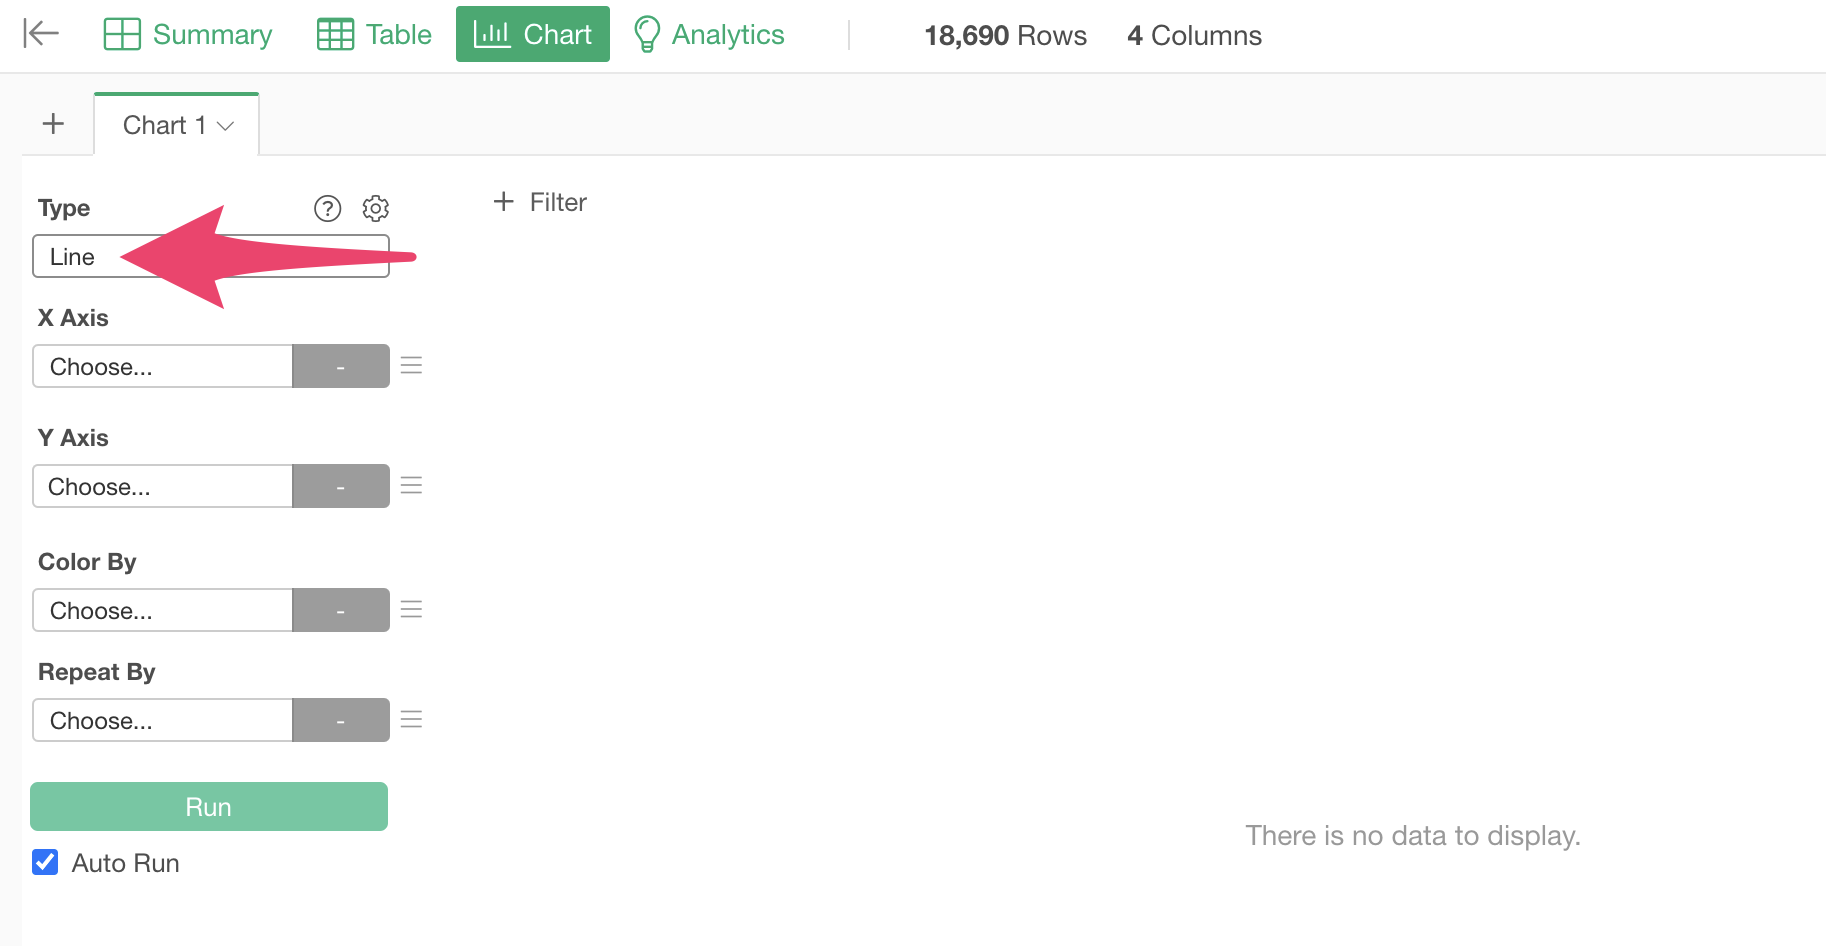
First, let’s look at how to calculate the conversion rate in a chart.
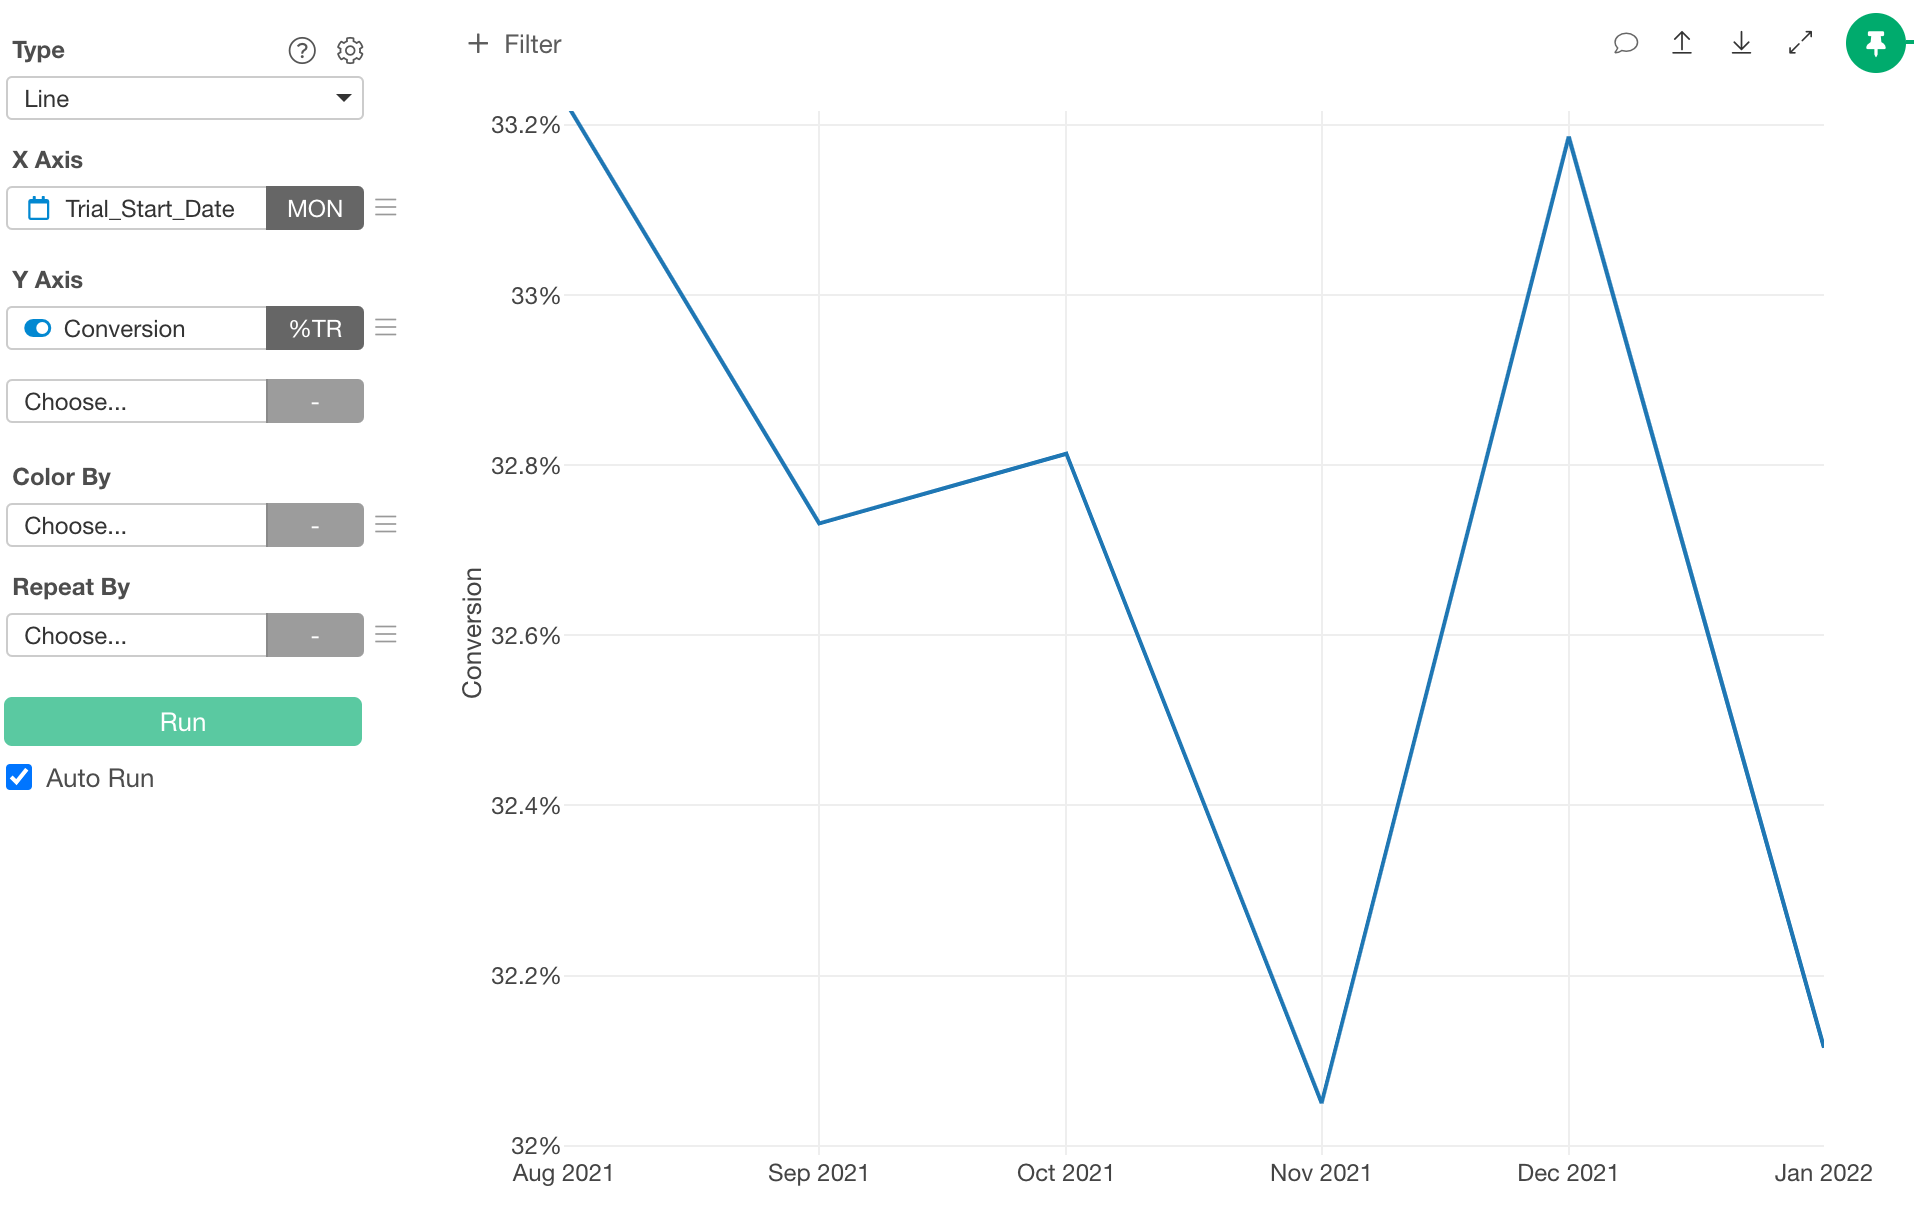
Go to the Chart view and select Line Chart as the chart type.
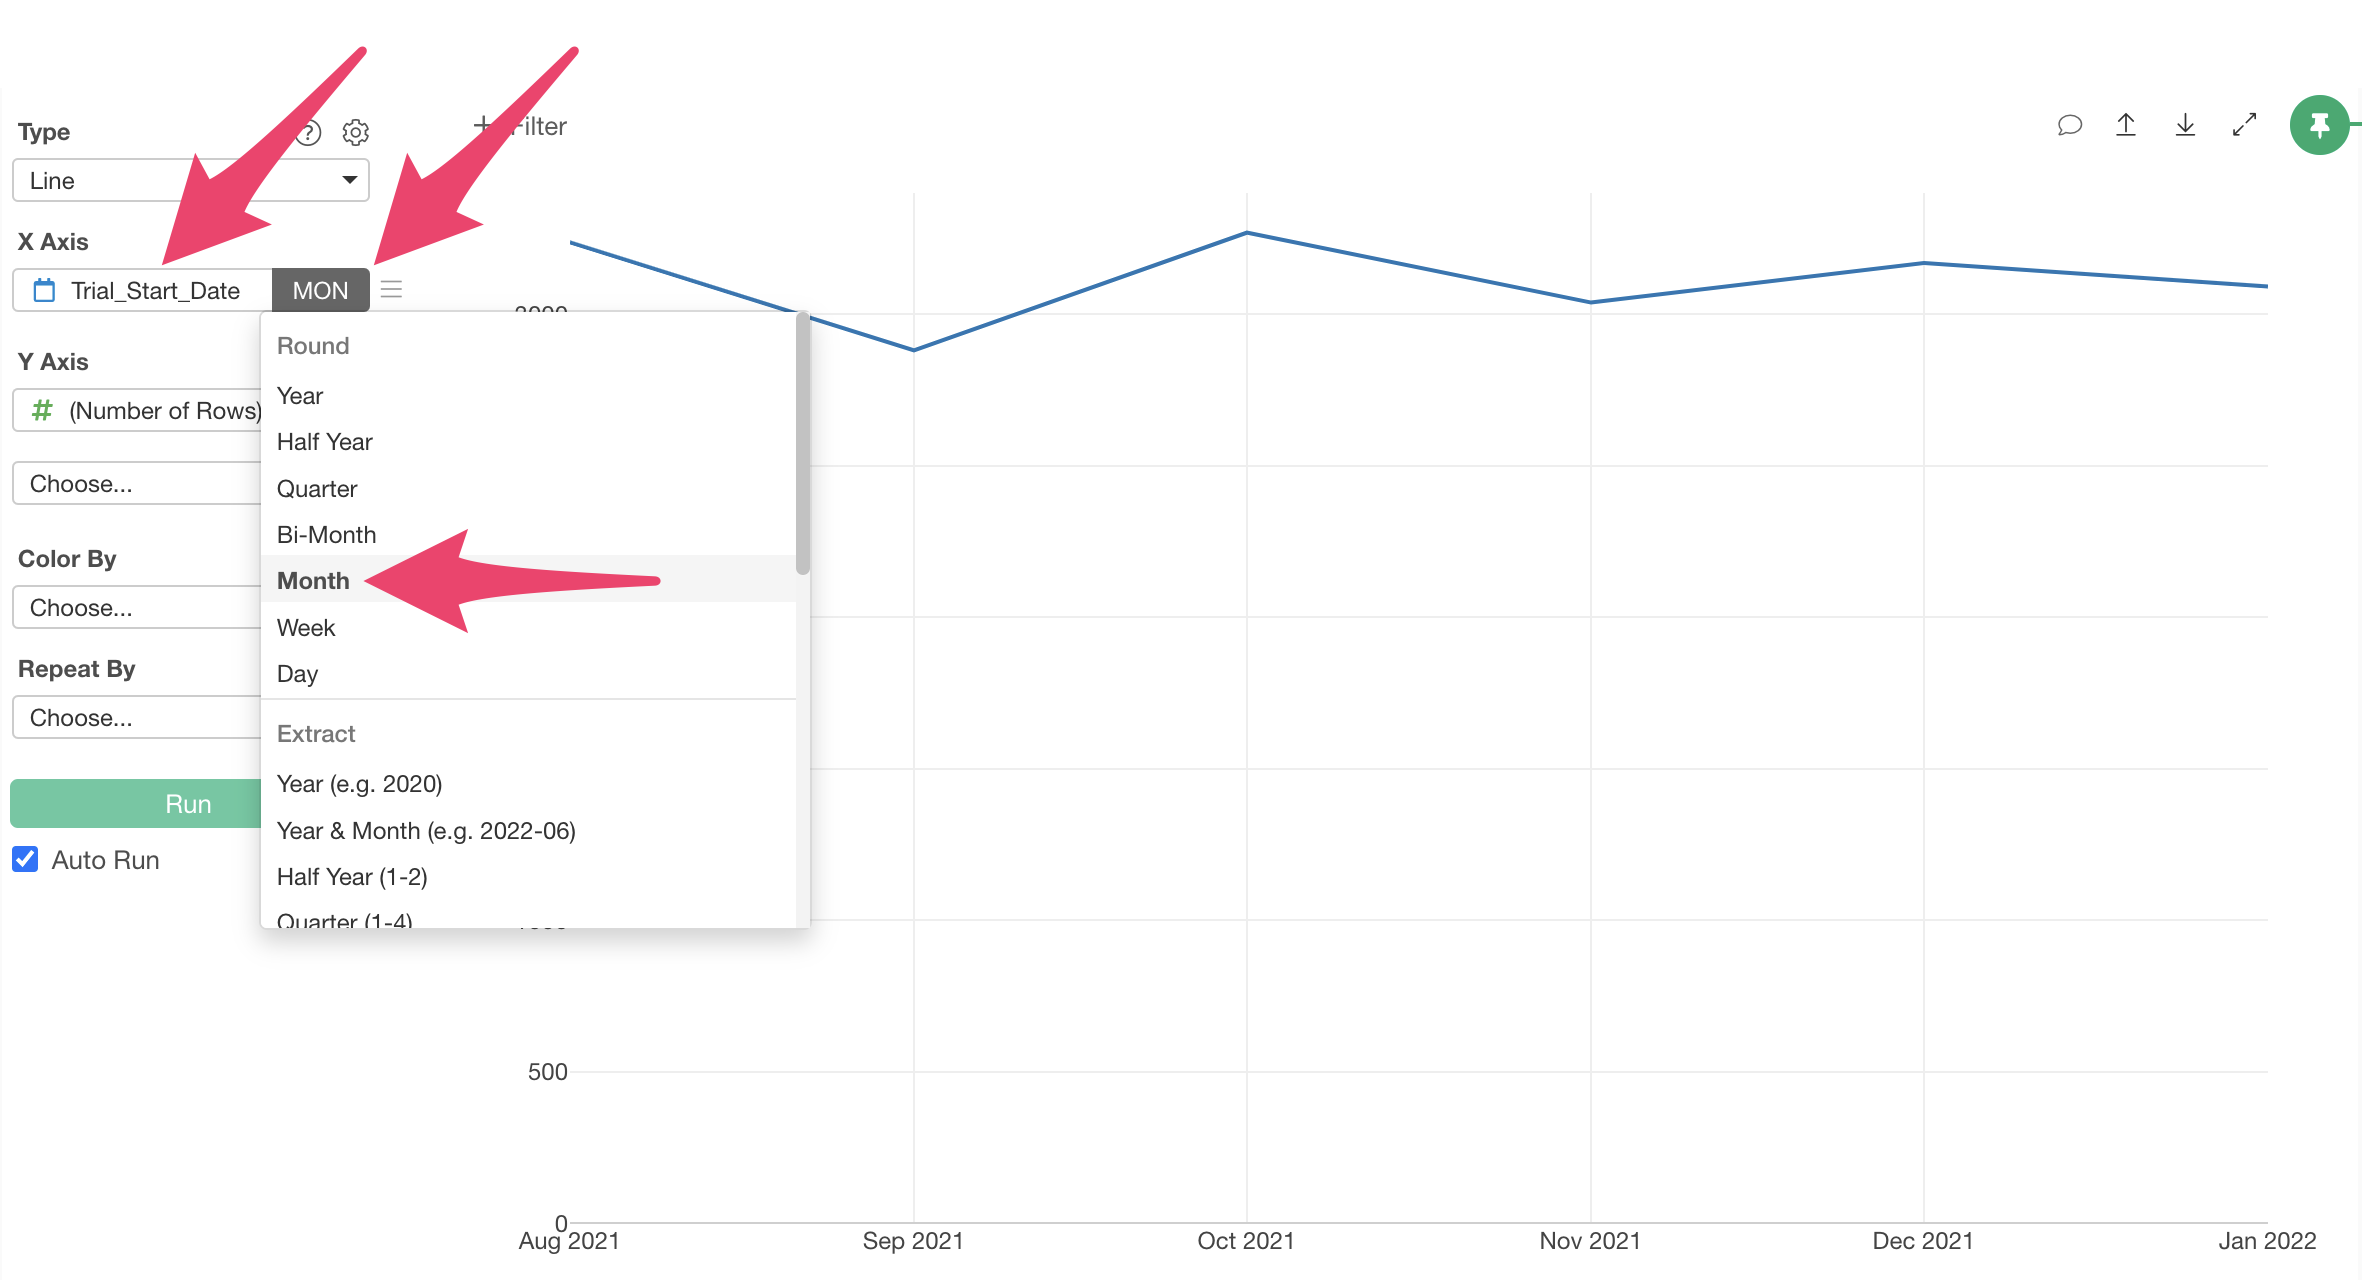
Select “Trial_Start_Date” for the X-axis, and since we want to calculate conversion rates by month, select “Month” as the date unit with rounding.
Next, select “Conversion” for the Y-axis.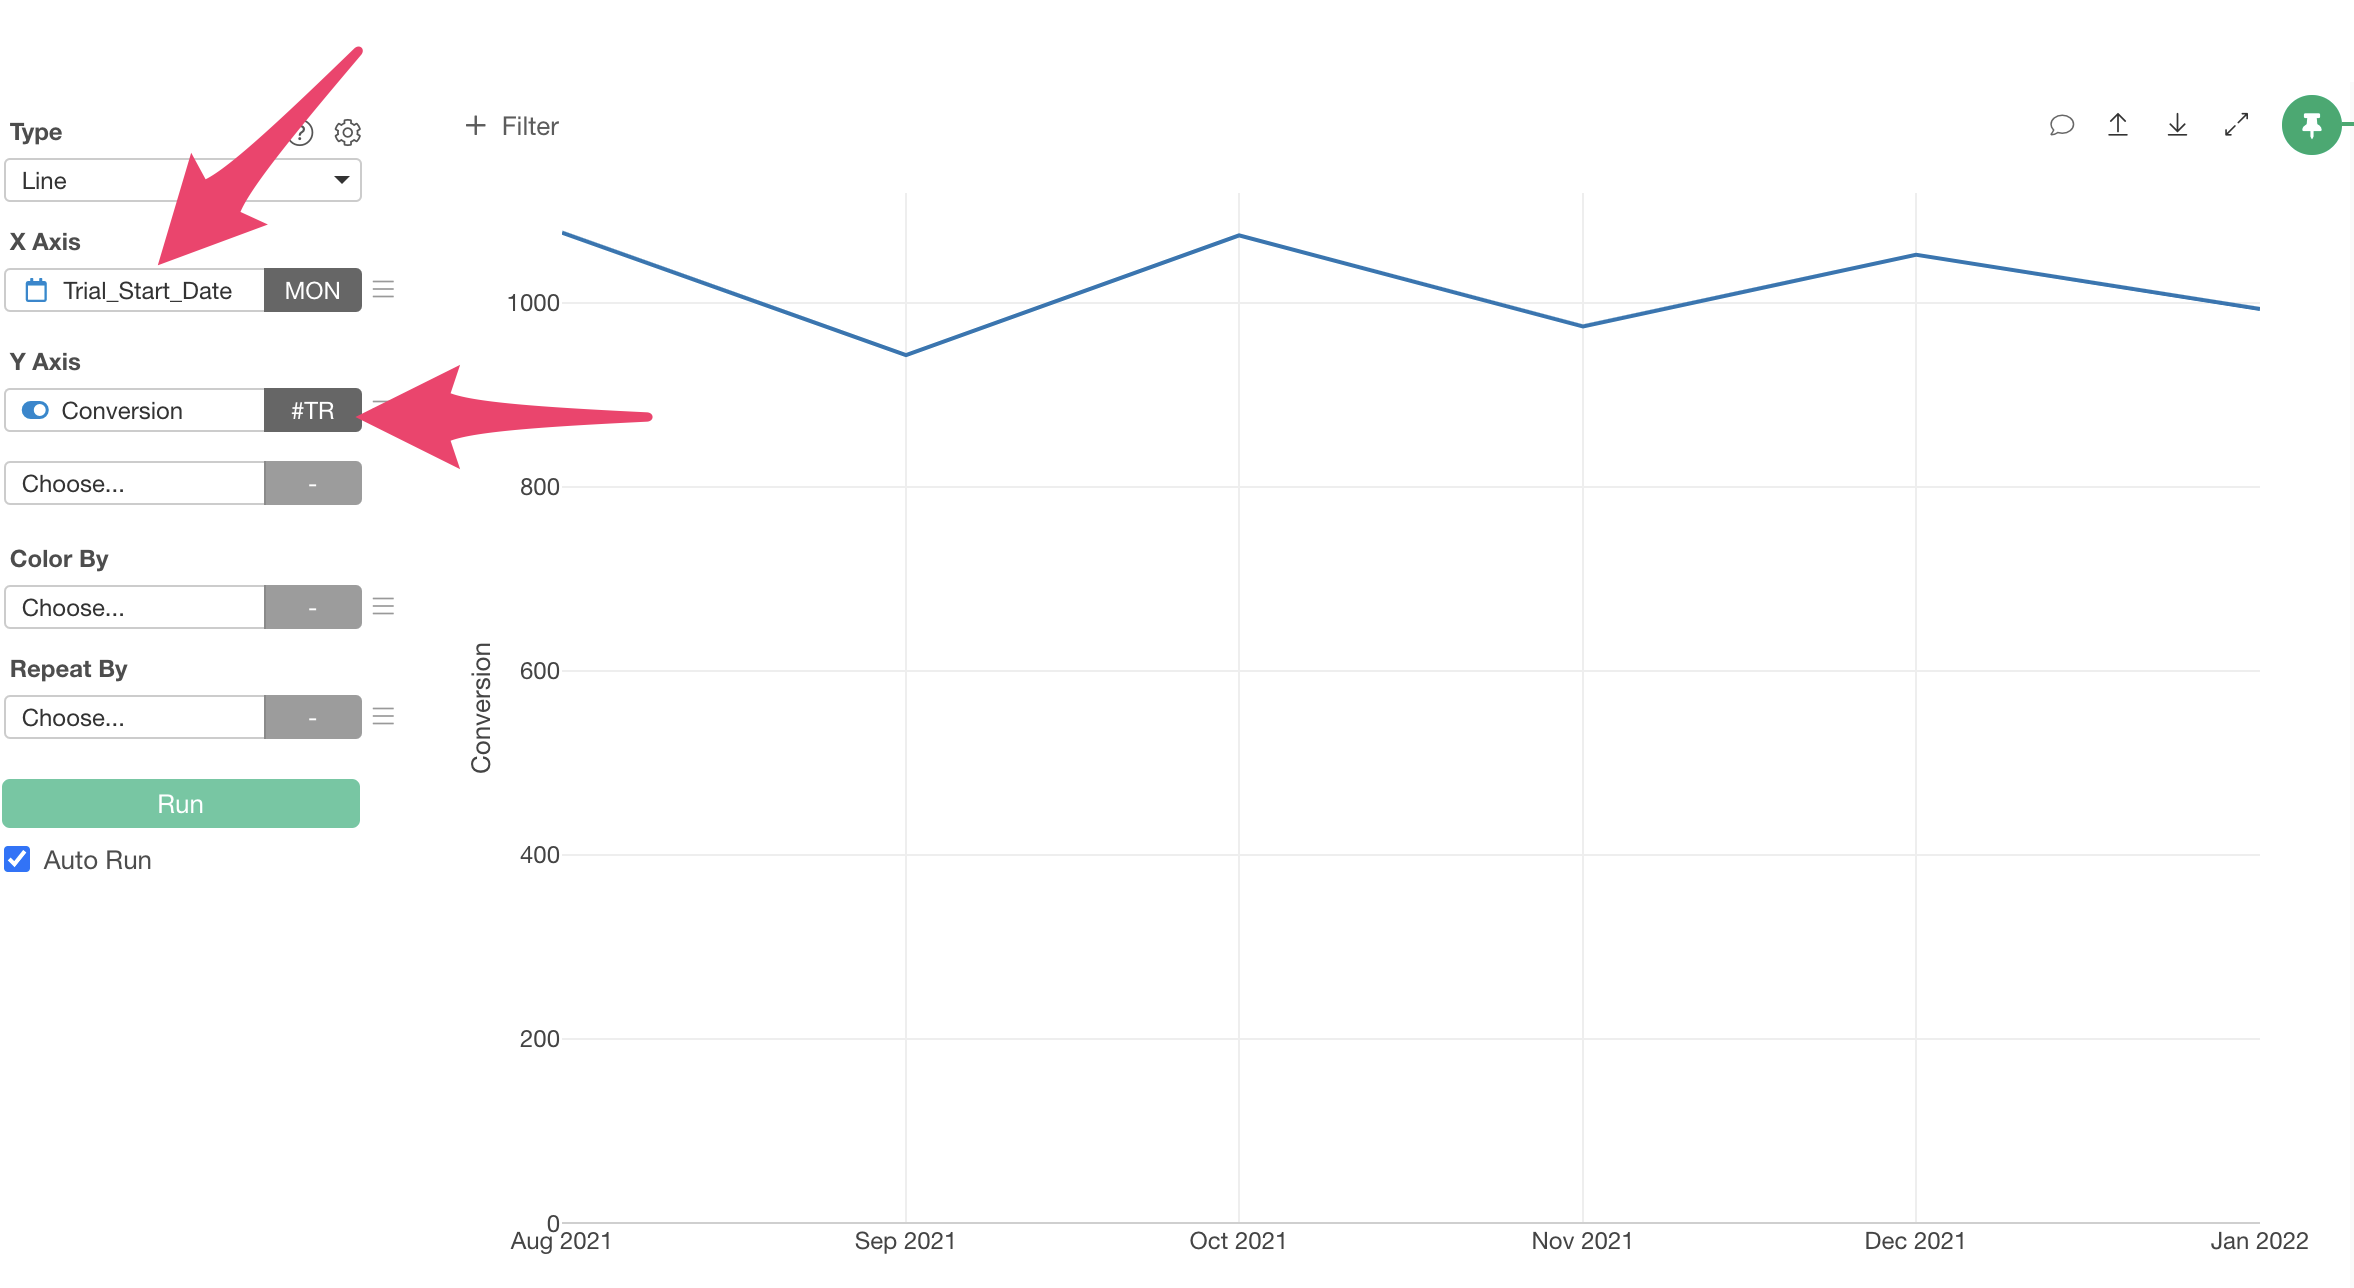 To
calculate the conversion rate, select “% of TRUE” as the aggregation
function.
To
calculate the conversion rate, select “% of TRUE” as the aggregation
function.
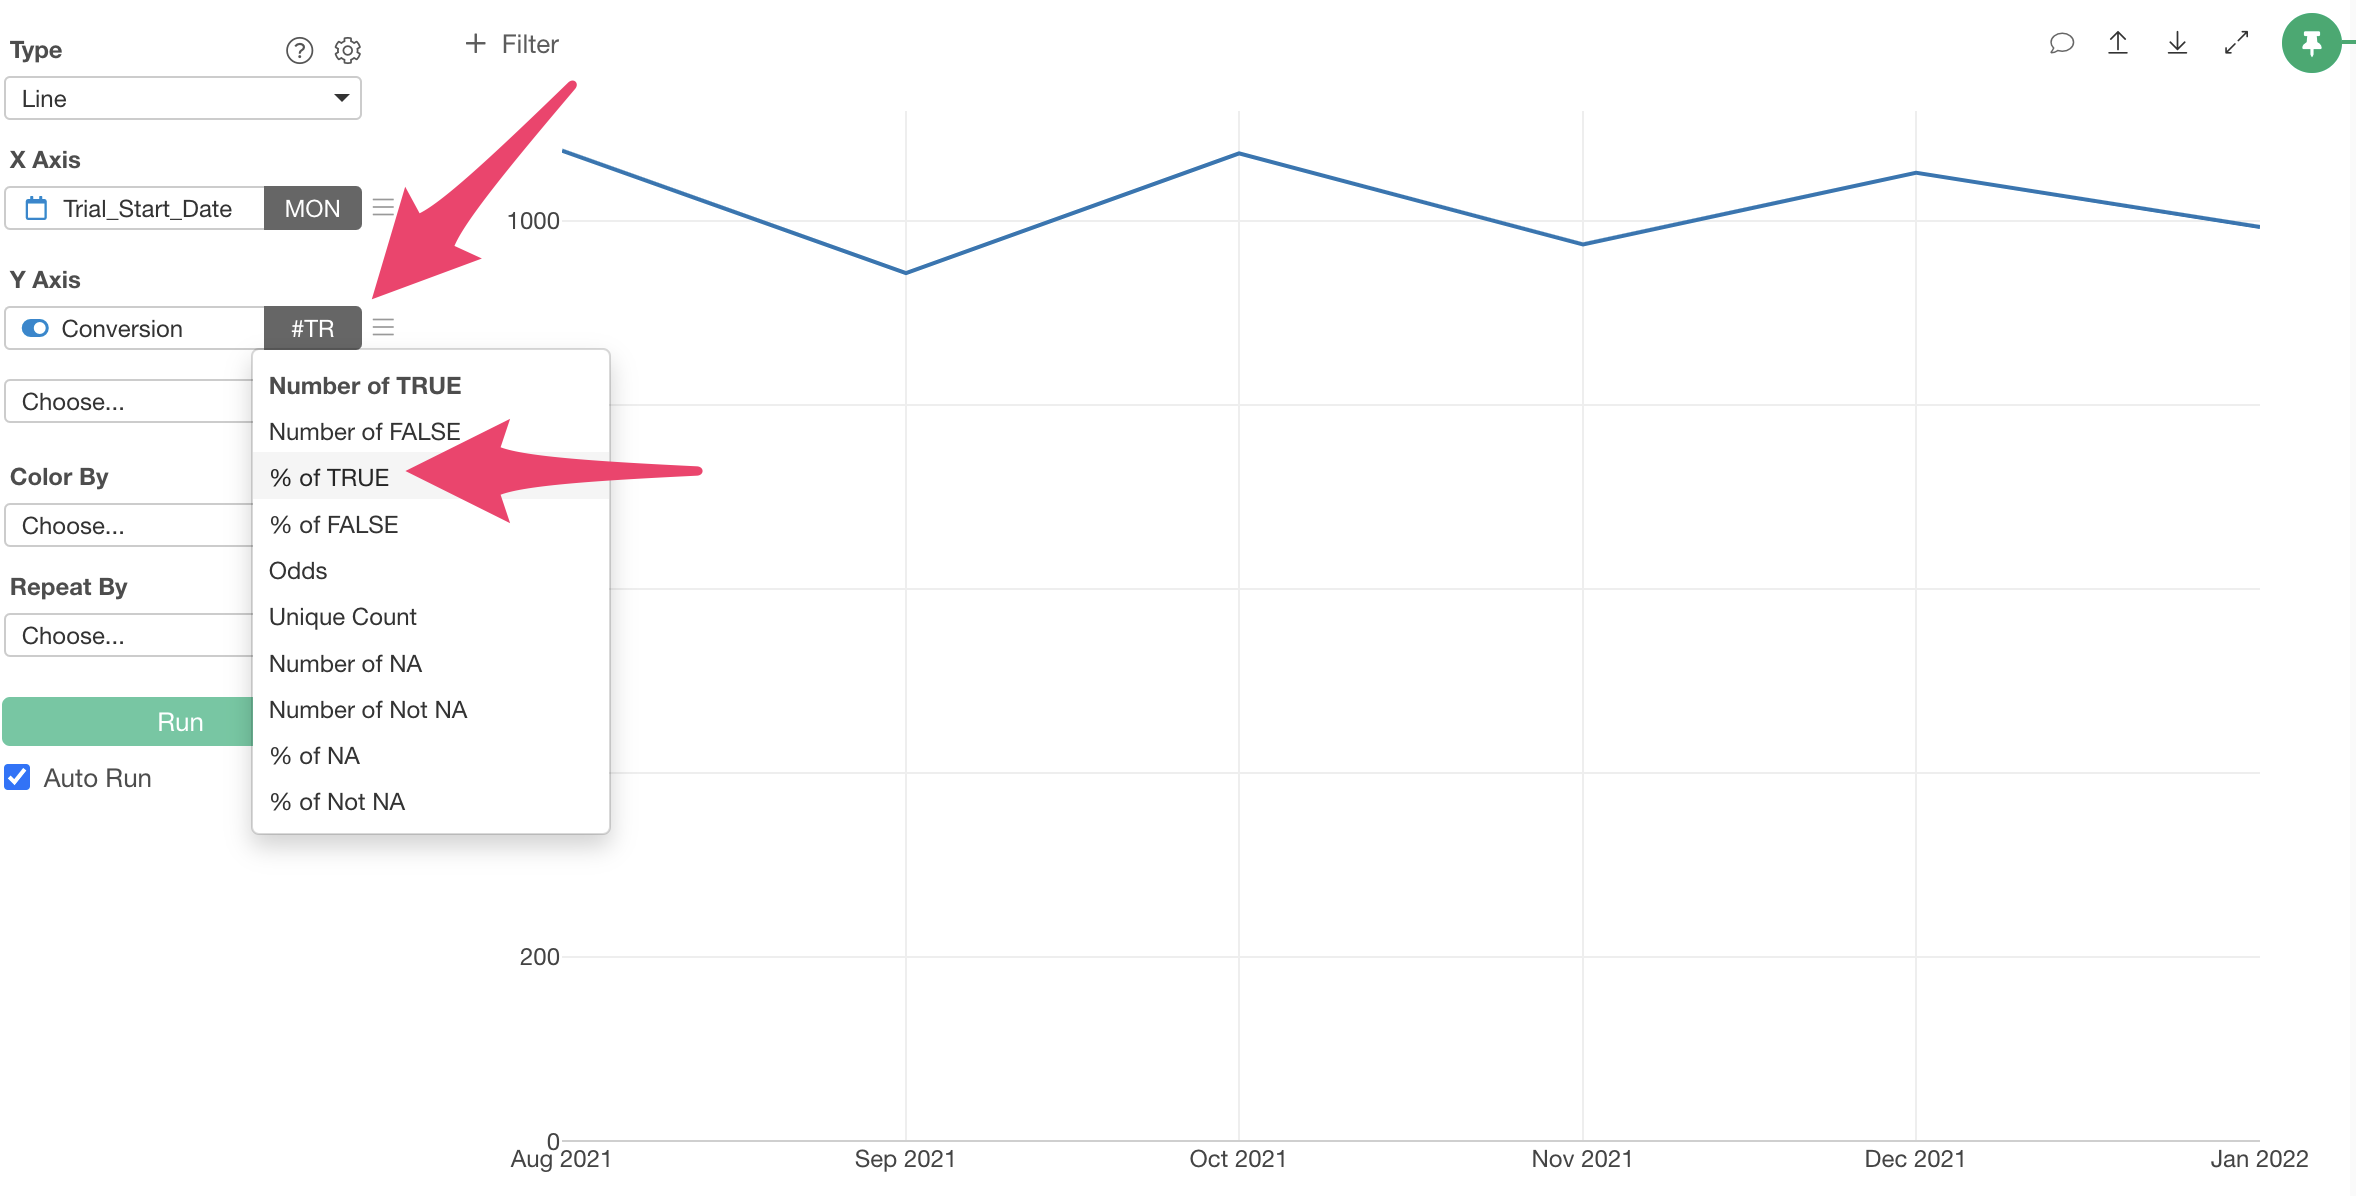
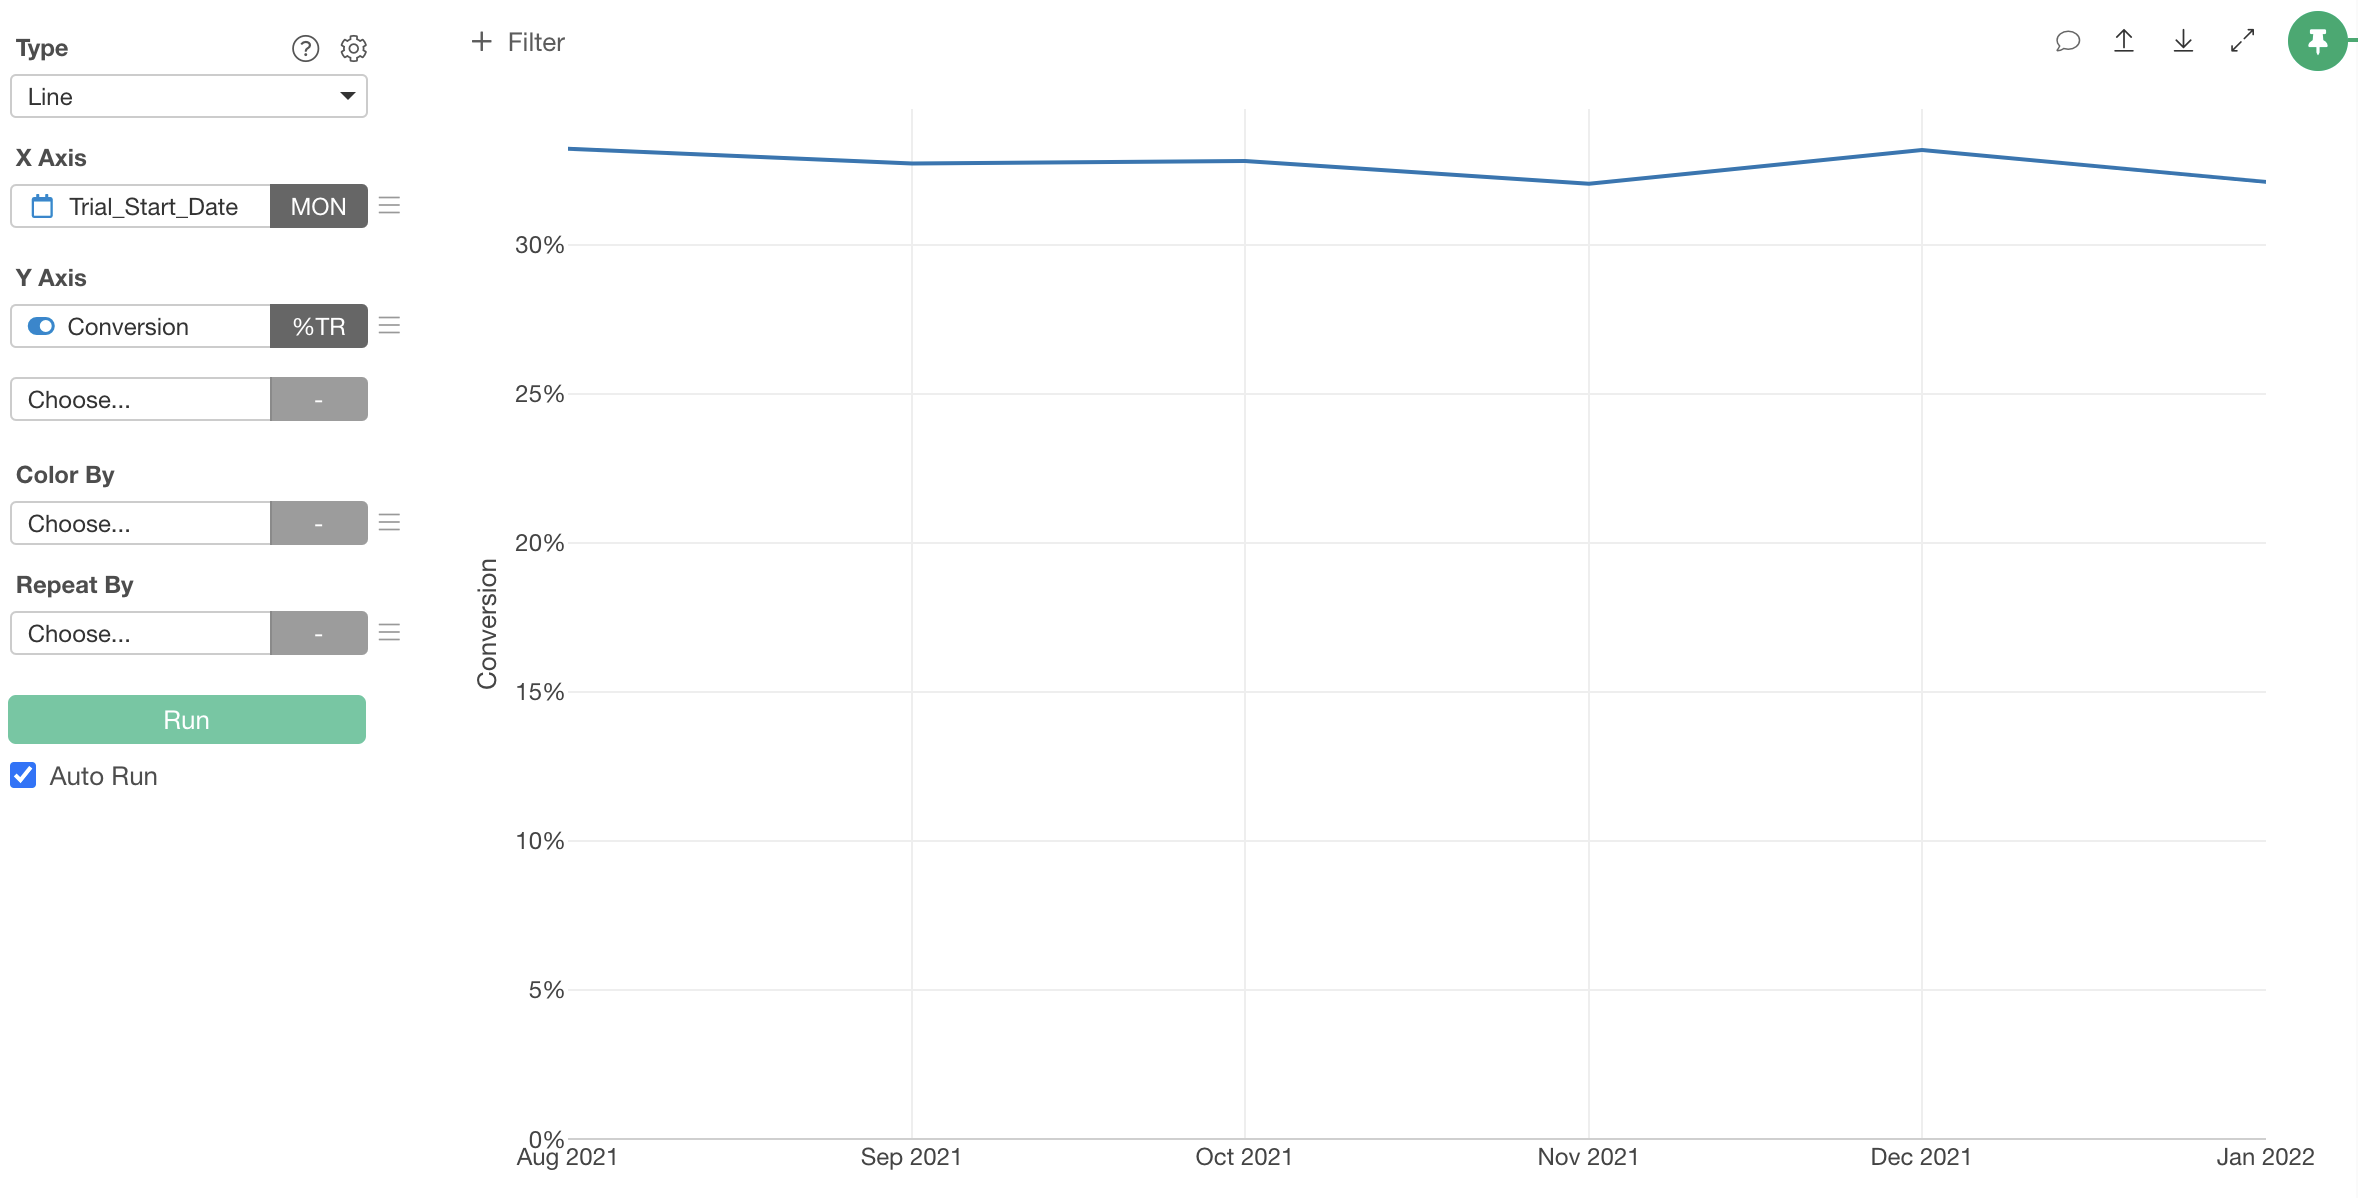
Since we want to calculate the conversion rate, selecting “% of TRUE” as the aggregation function allows us to visualize the conversion rate.
Finally, adjust the chart axes.
Open the chart settings menu, and from the Y Axis menu, uncheck “Always Include 0 in Y axis” and apply.
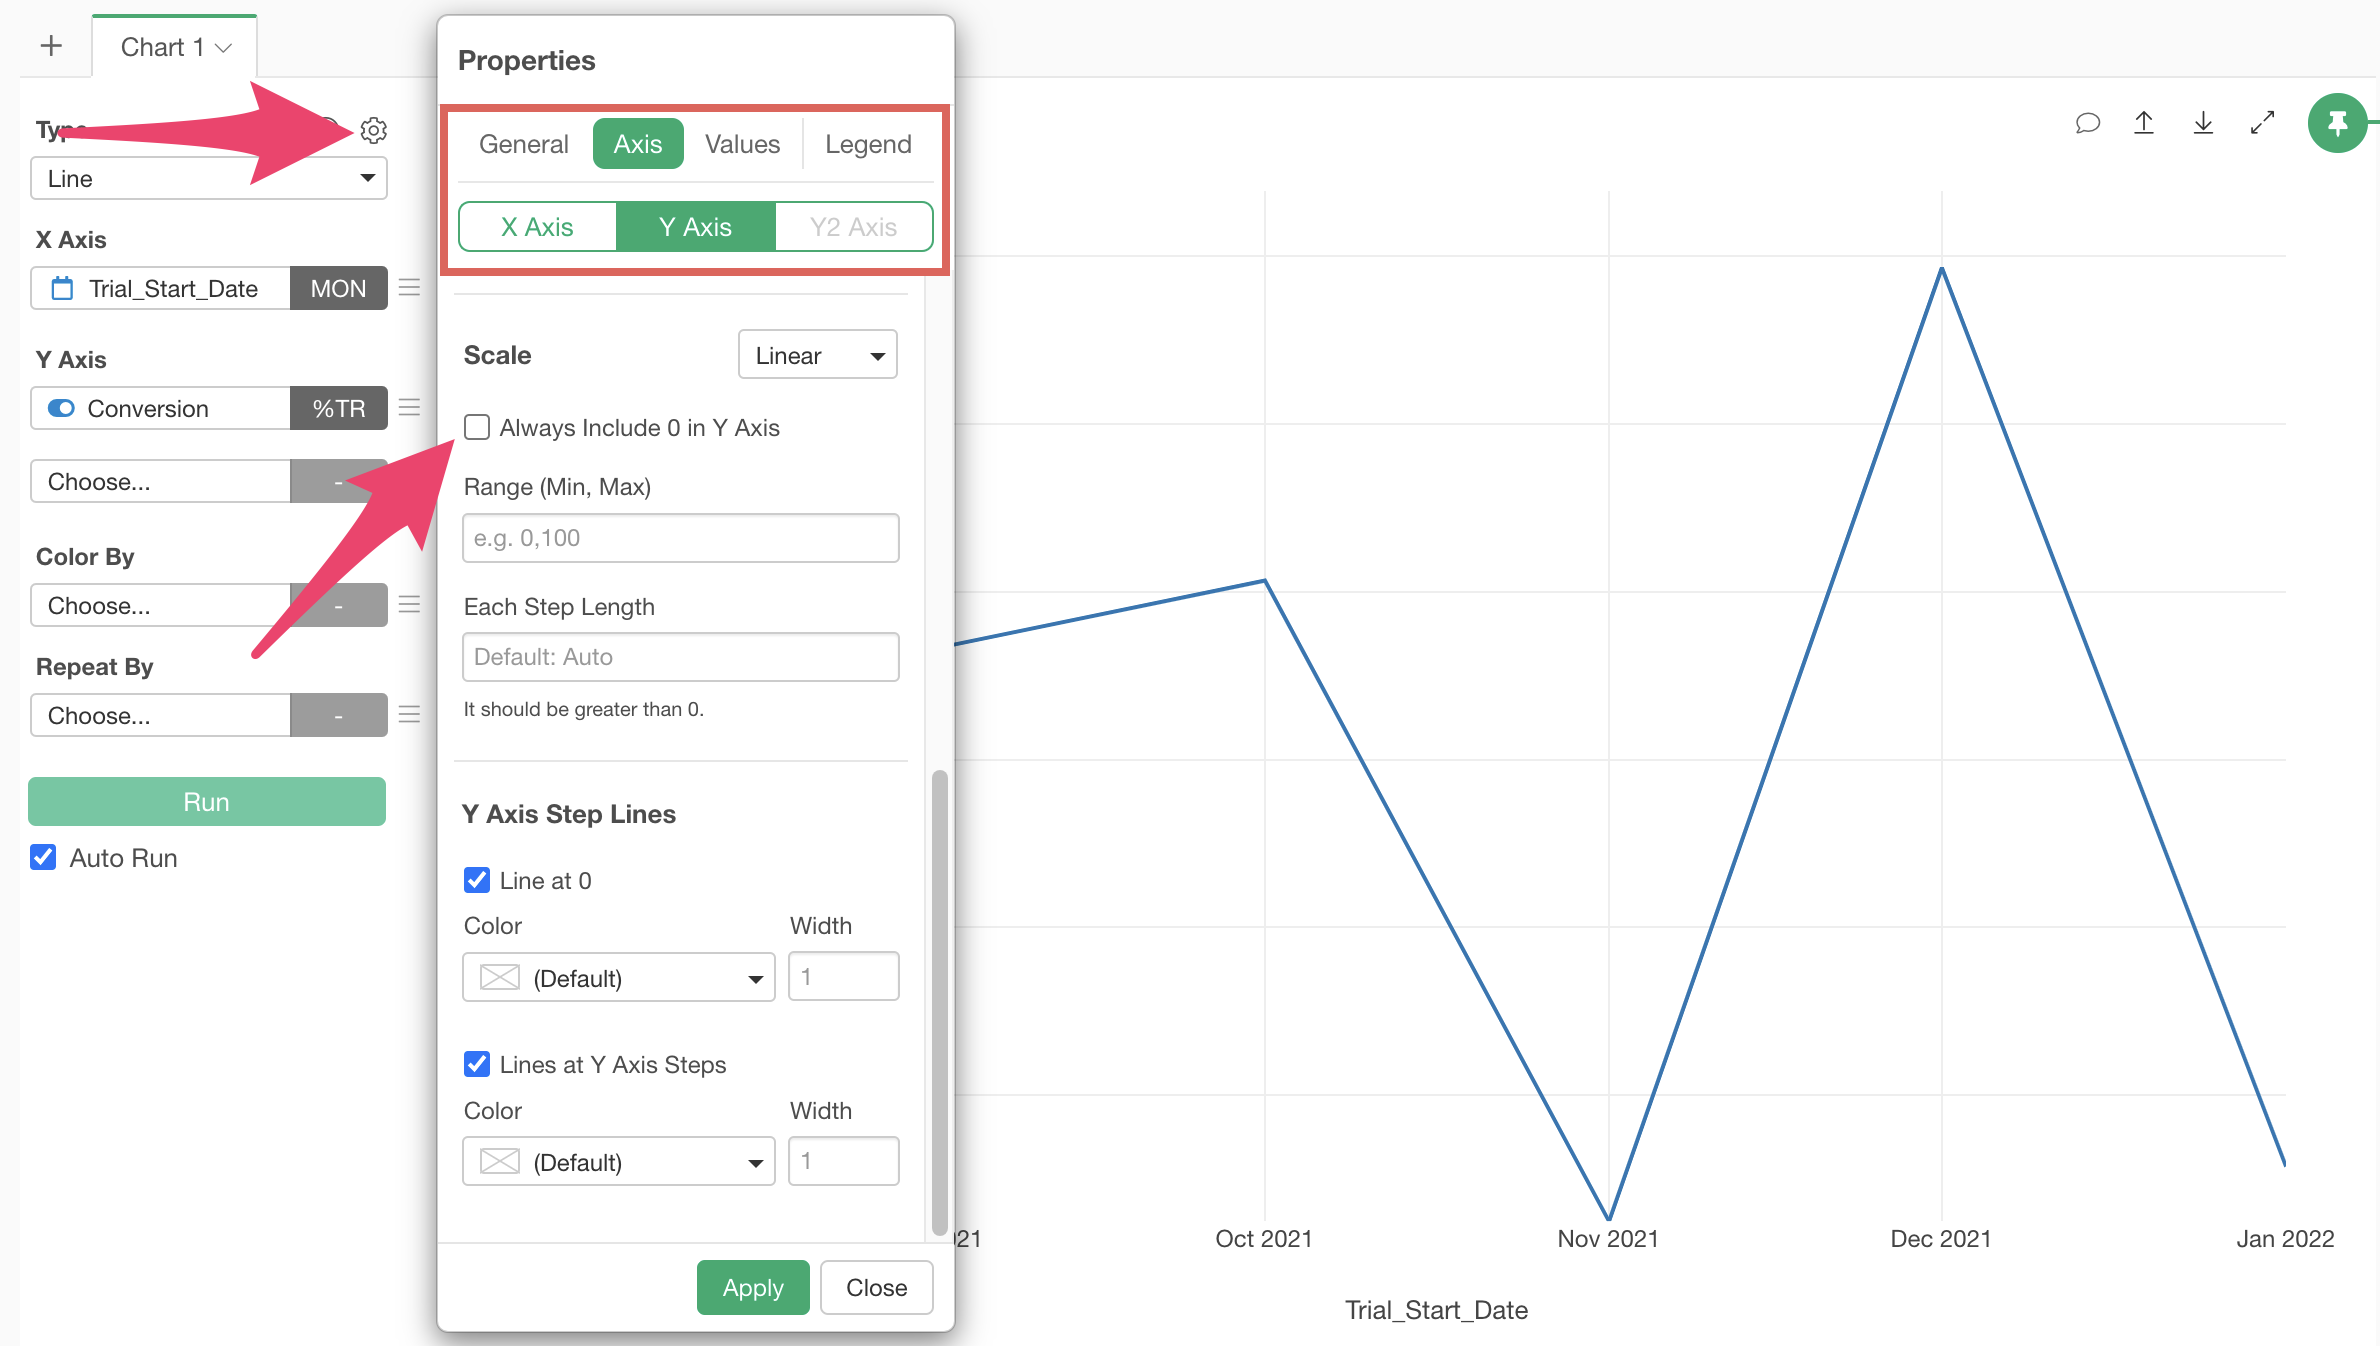
This makes the changes in the line chart easier to see.
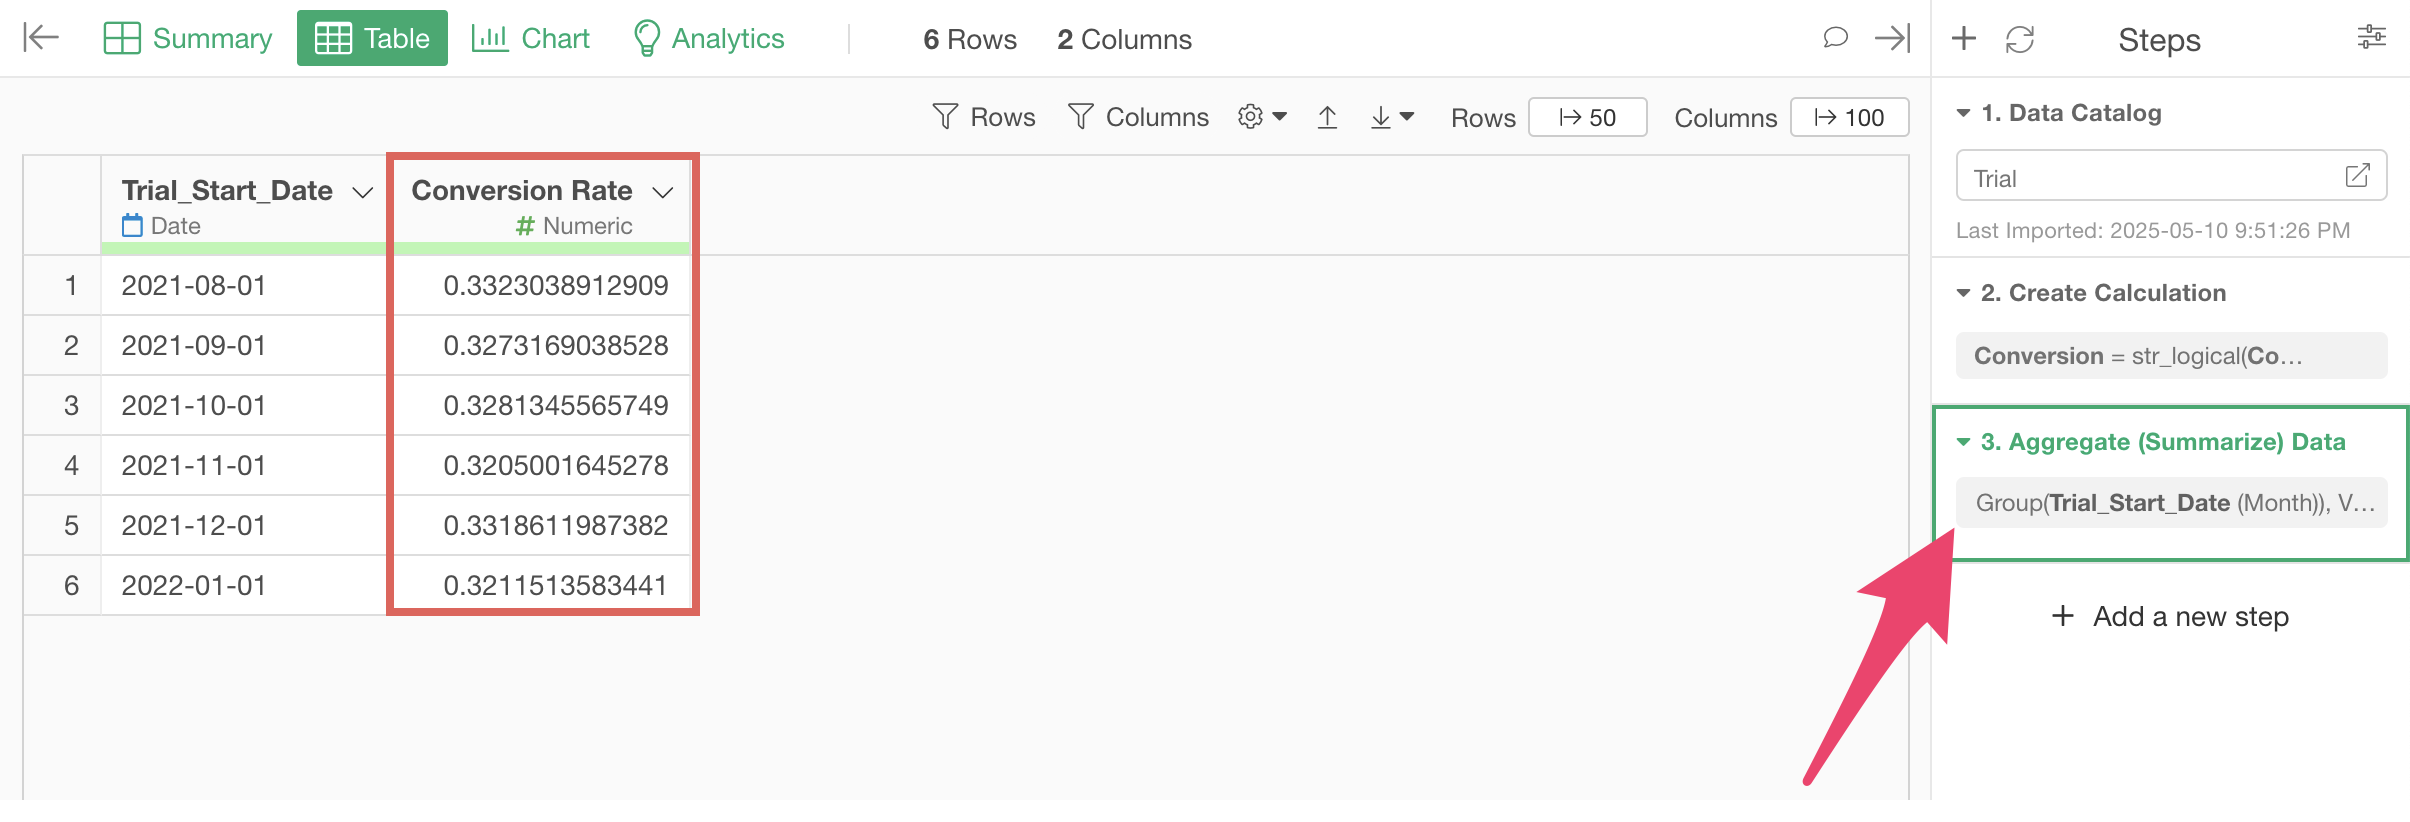
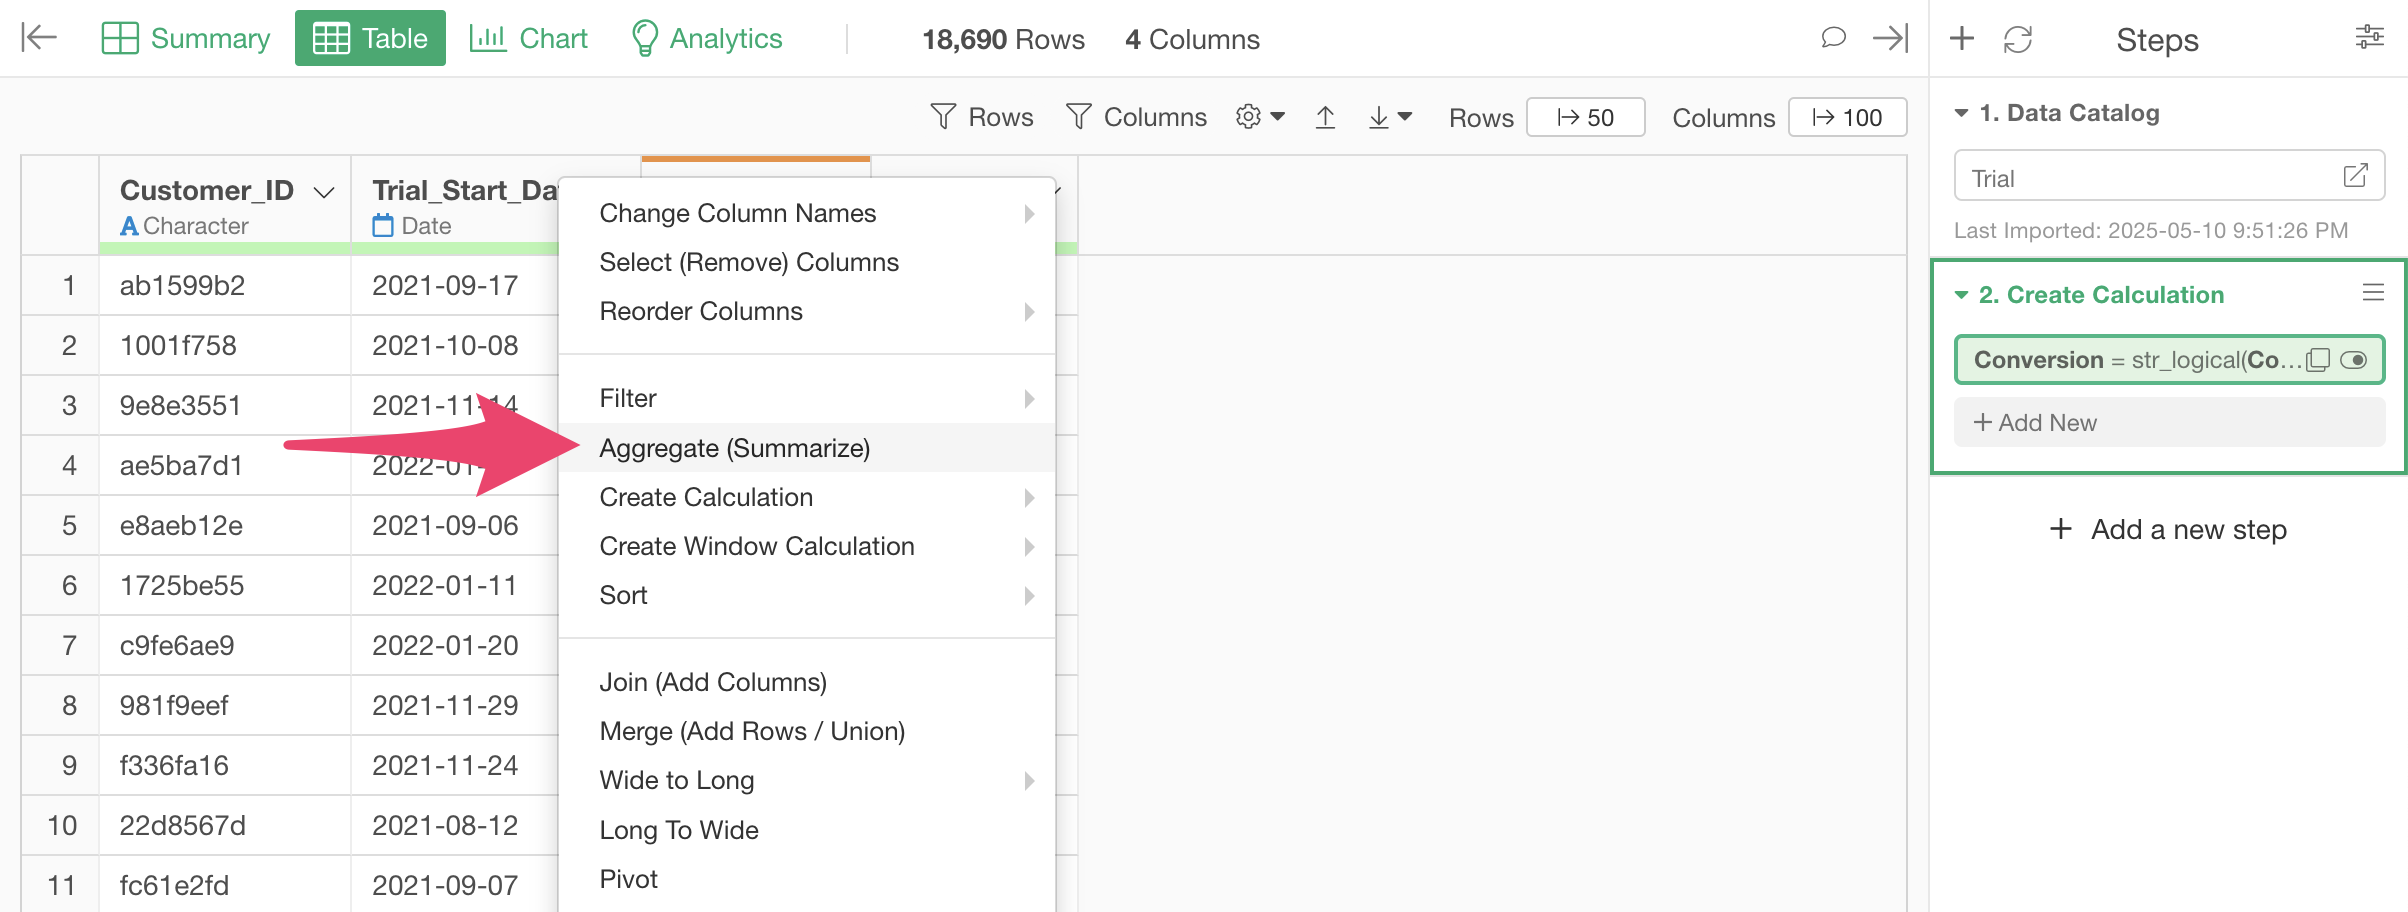
Aggregate Conversion Rate by Month
To aggregate the conversion rate by month, select “Aggregate(Summarize)” from the “Trial_Start_Date” column header menu.
When the summarize dialog opens, round the “Trial_Start_Date” in the Group to “Month” units.
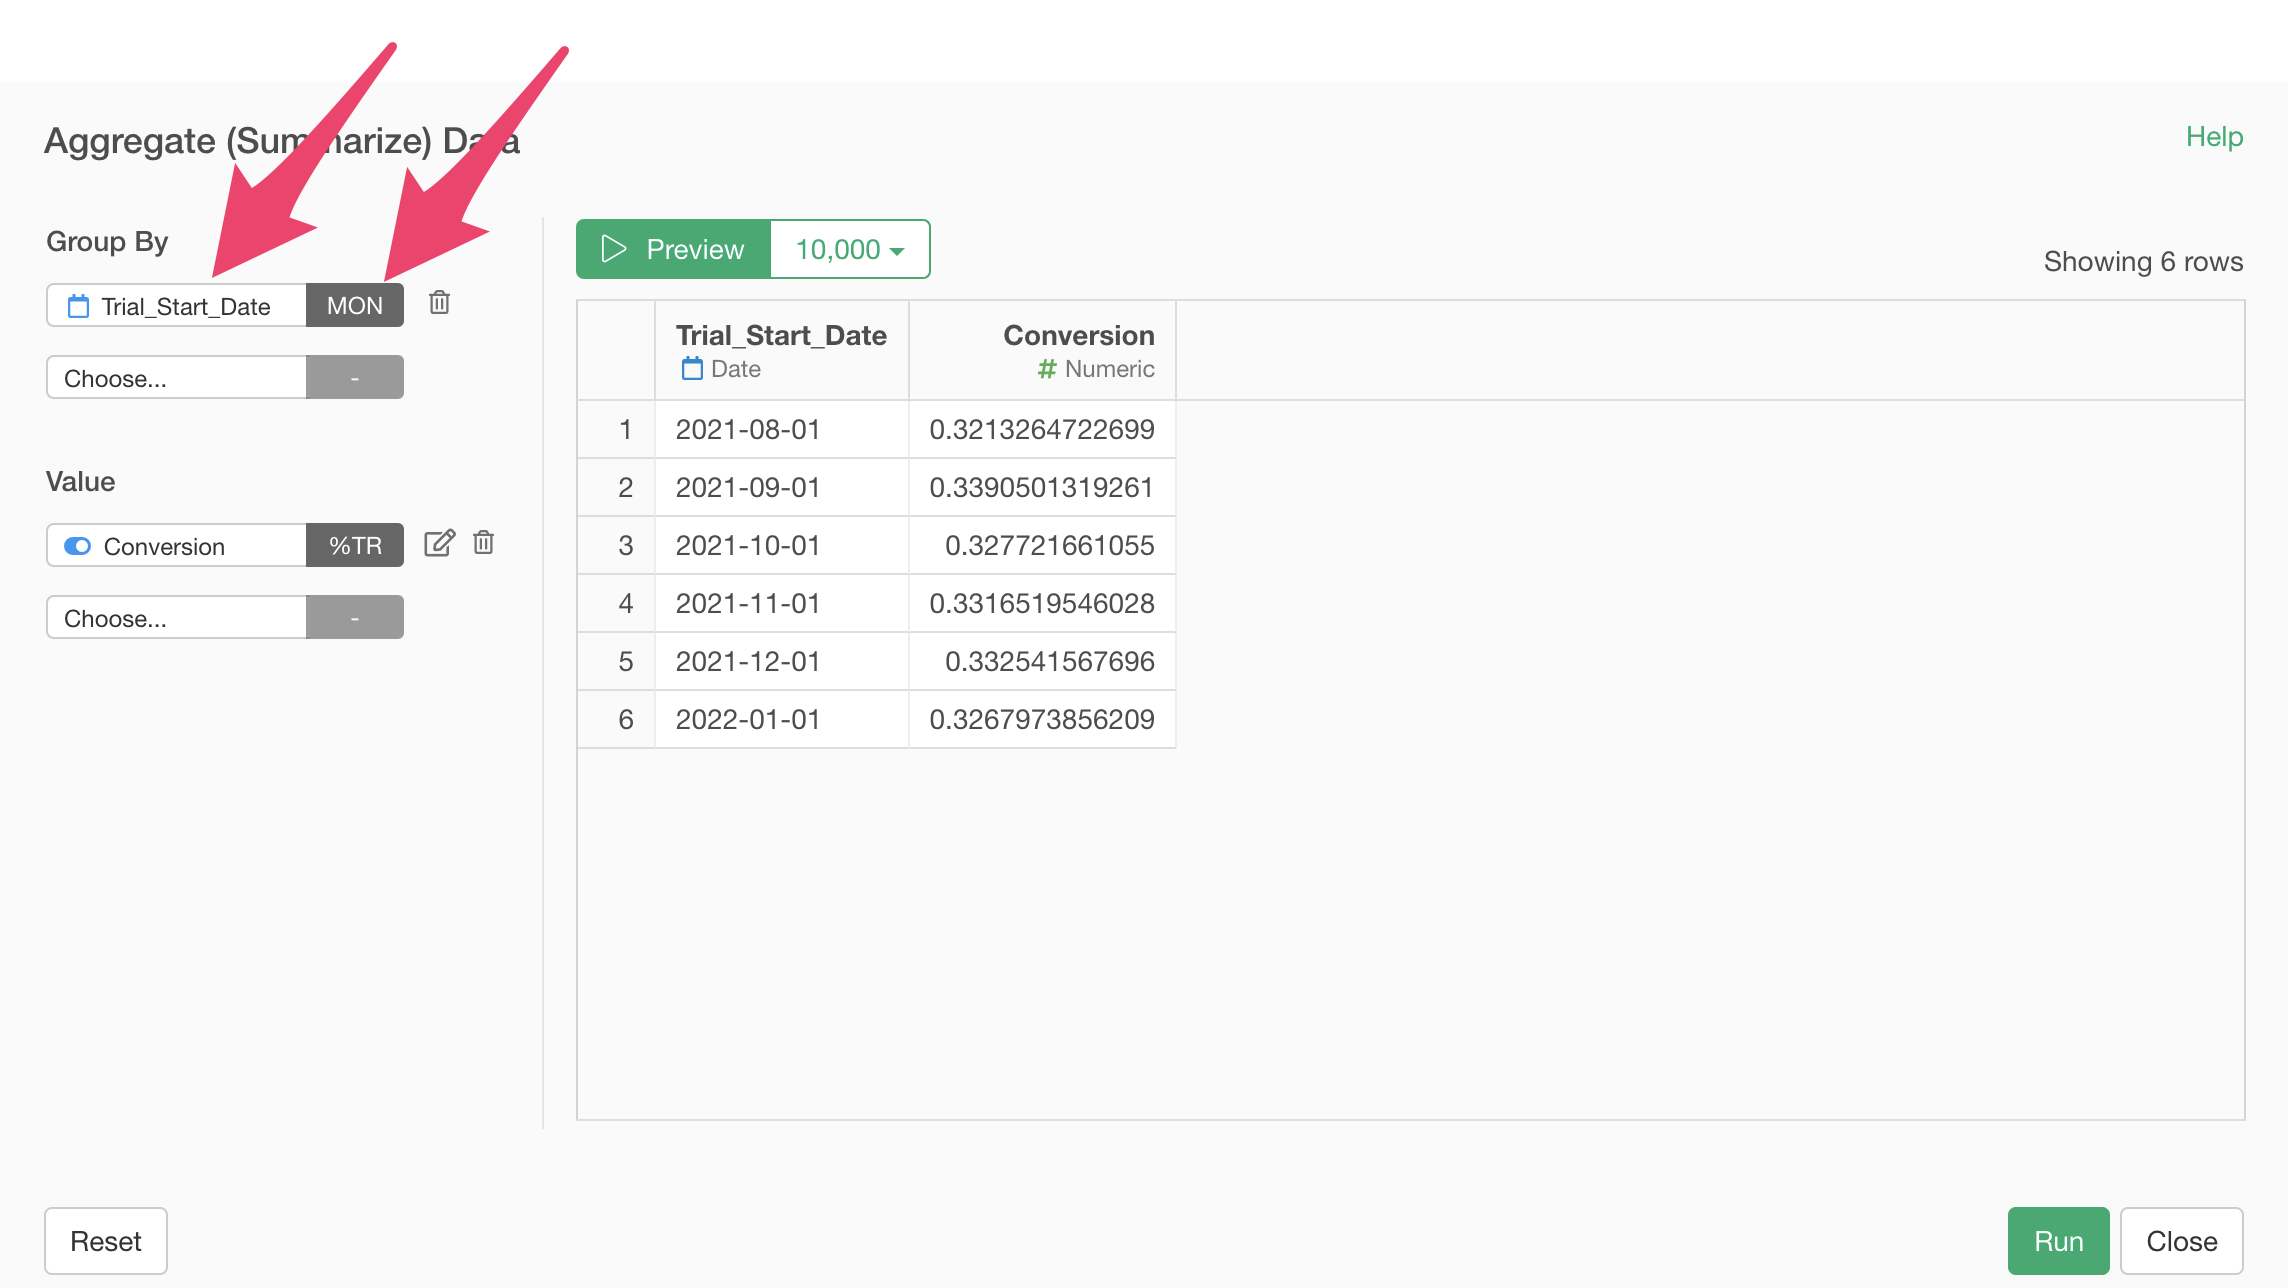
Next, select “Conversion” for Value, choose “% of” as the aggregation function, and press the “Run” button.
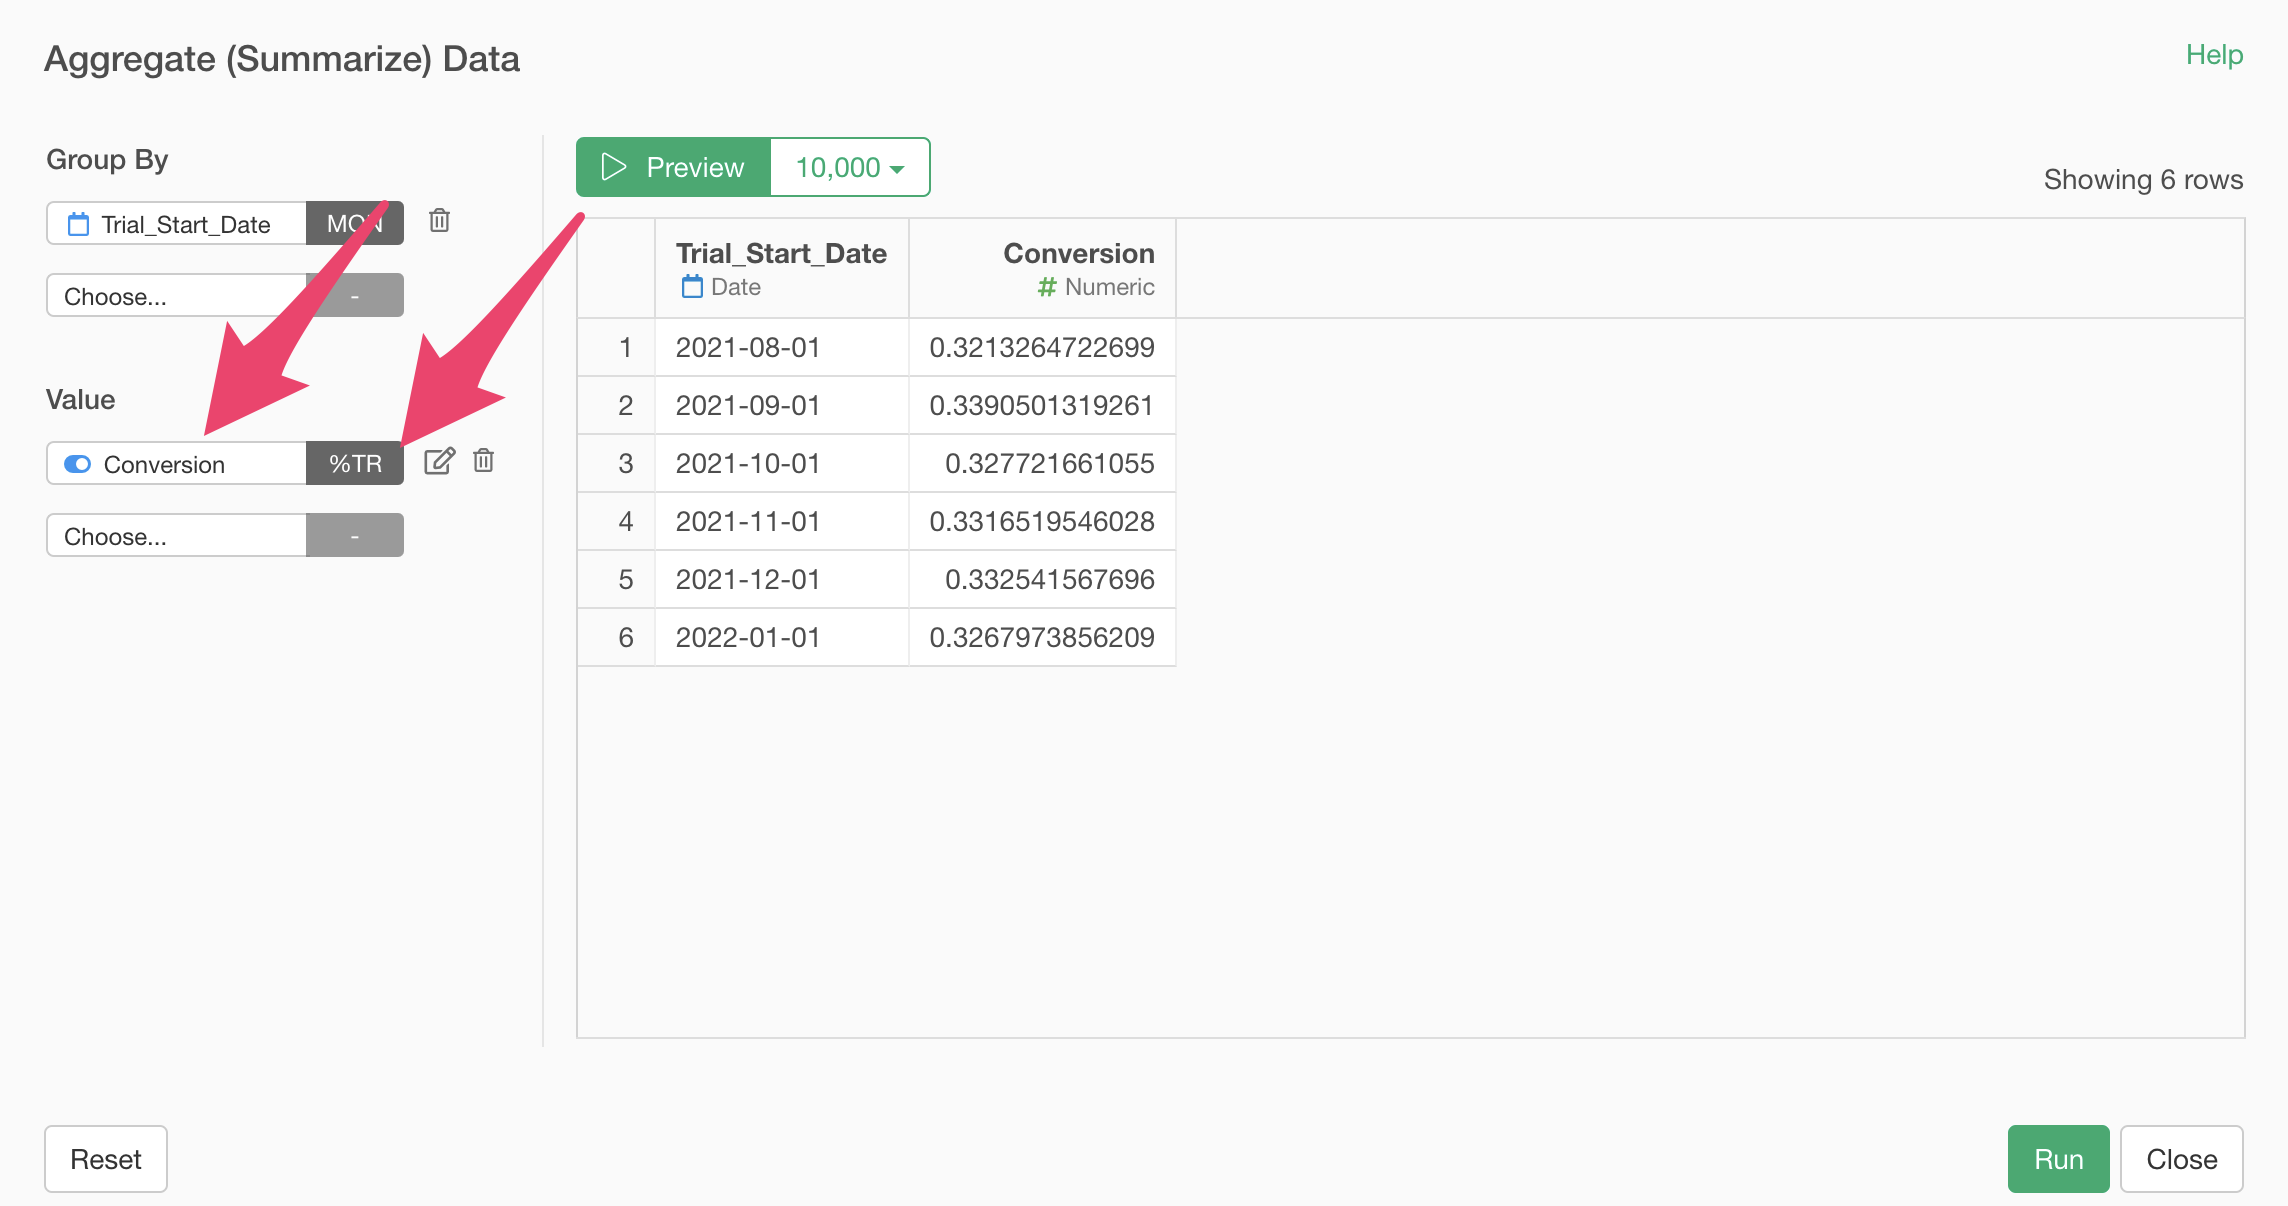
This calculates the conversion rate by month.