How to Create Custom Charts with R Scripts in Dashboard & Note
Since Exploratory is built on top of R it's straightforward to extend Exploratory's out-of-box capability by writing R code. Once of the things you can do is to create custom charts with various R packages such as Treemap, Venn Diagram, Waterfall Chart, etc. for your Dashboards & Notes.
In this seminar, Kan will show you how you can start writing R codes with Dashboards & Notes to create various types of custom charts.
Agenda:
- How to write R codes in Dashboards & Notes
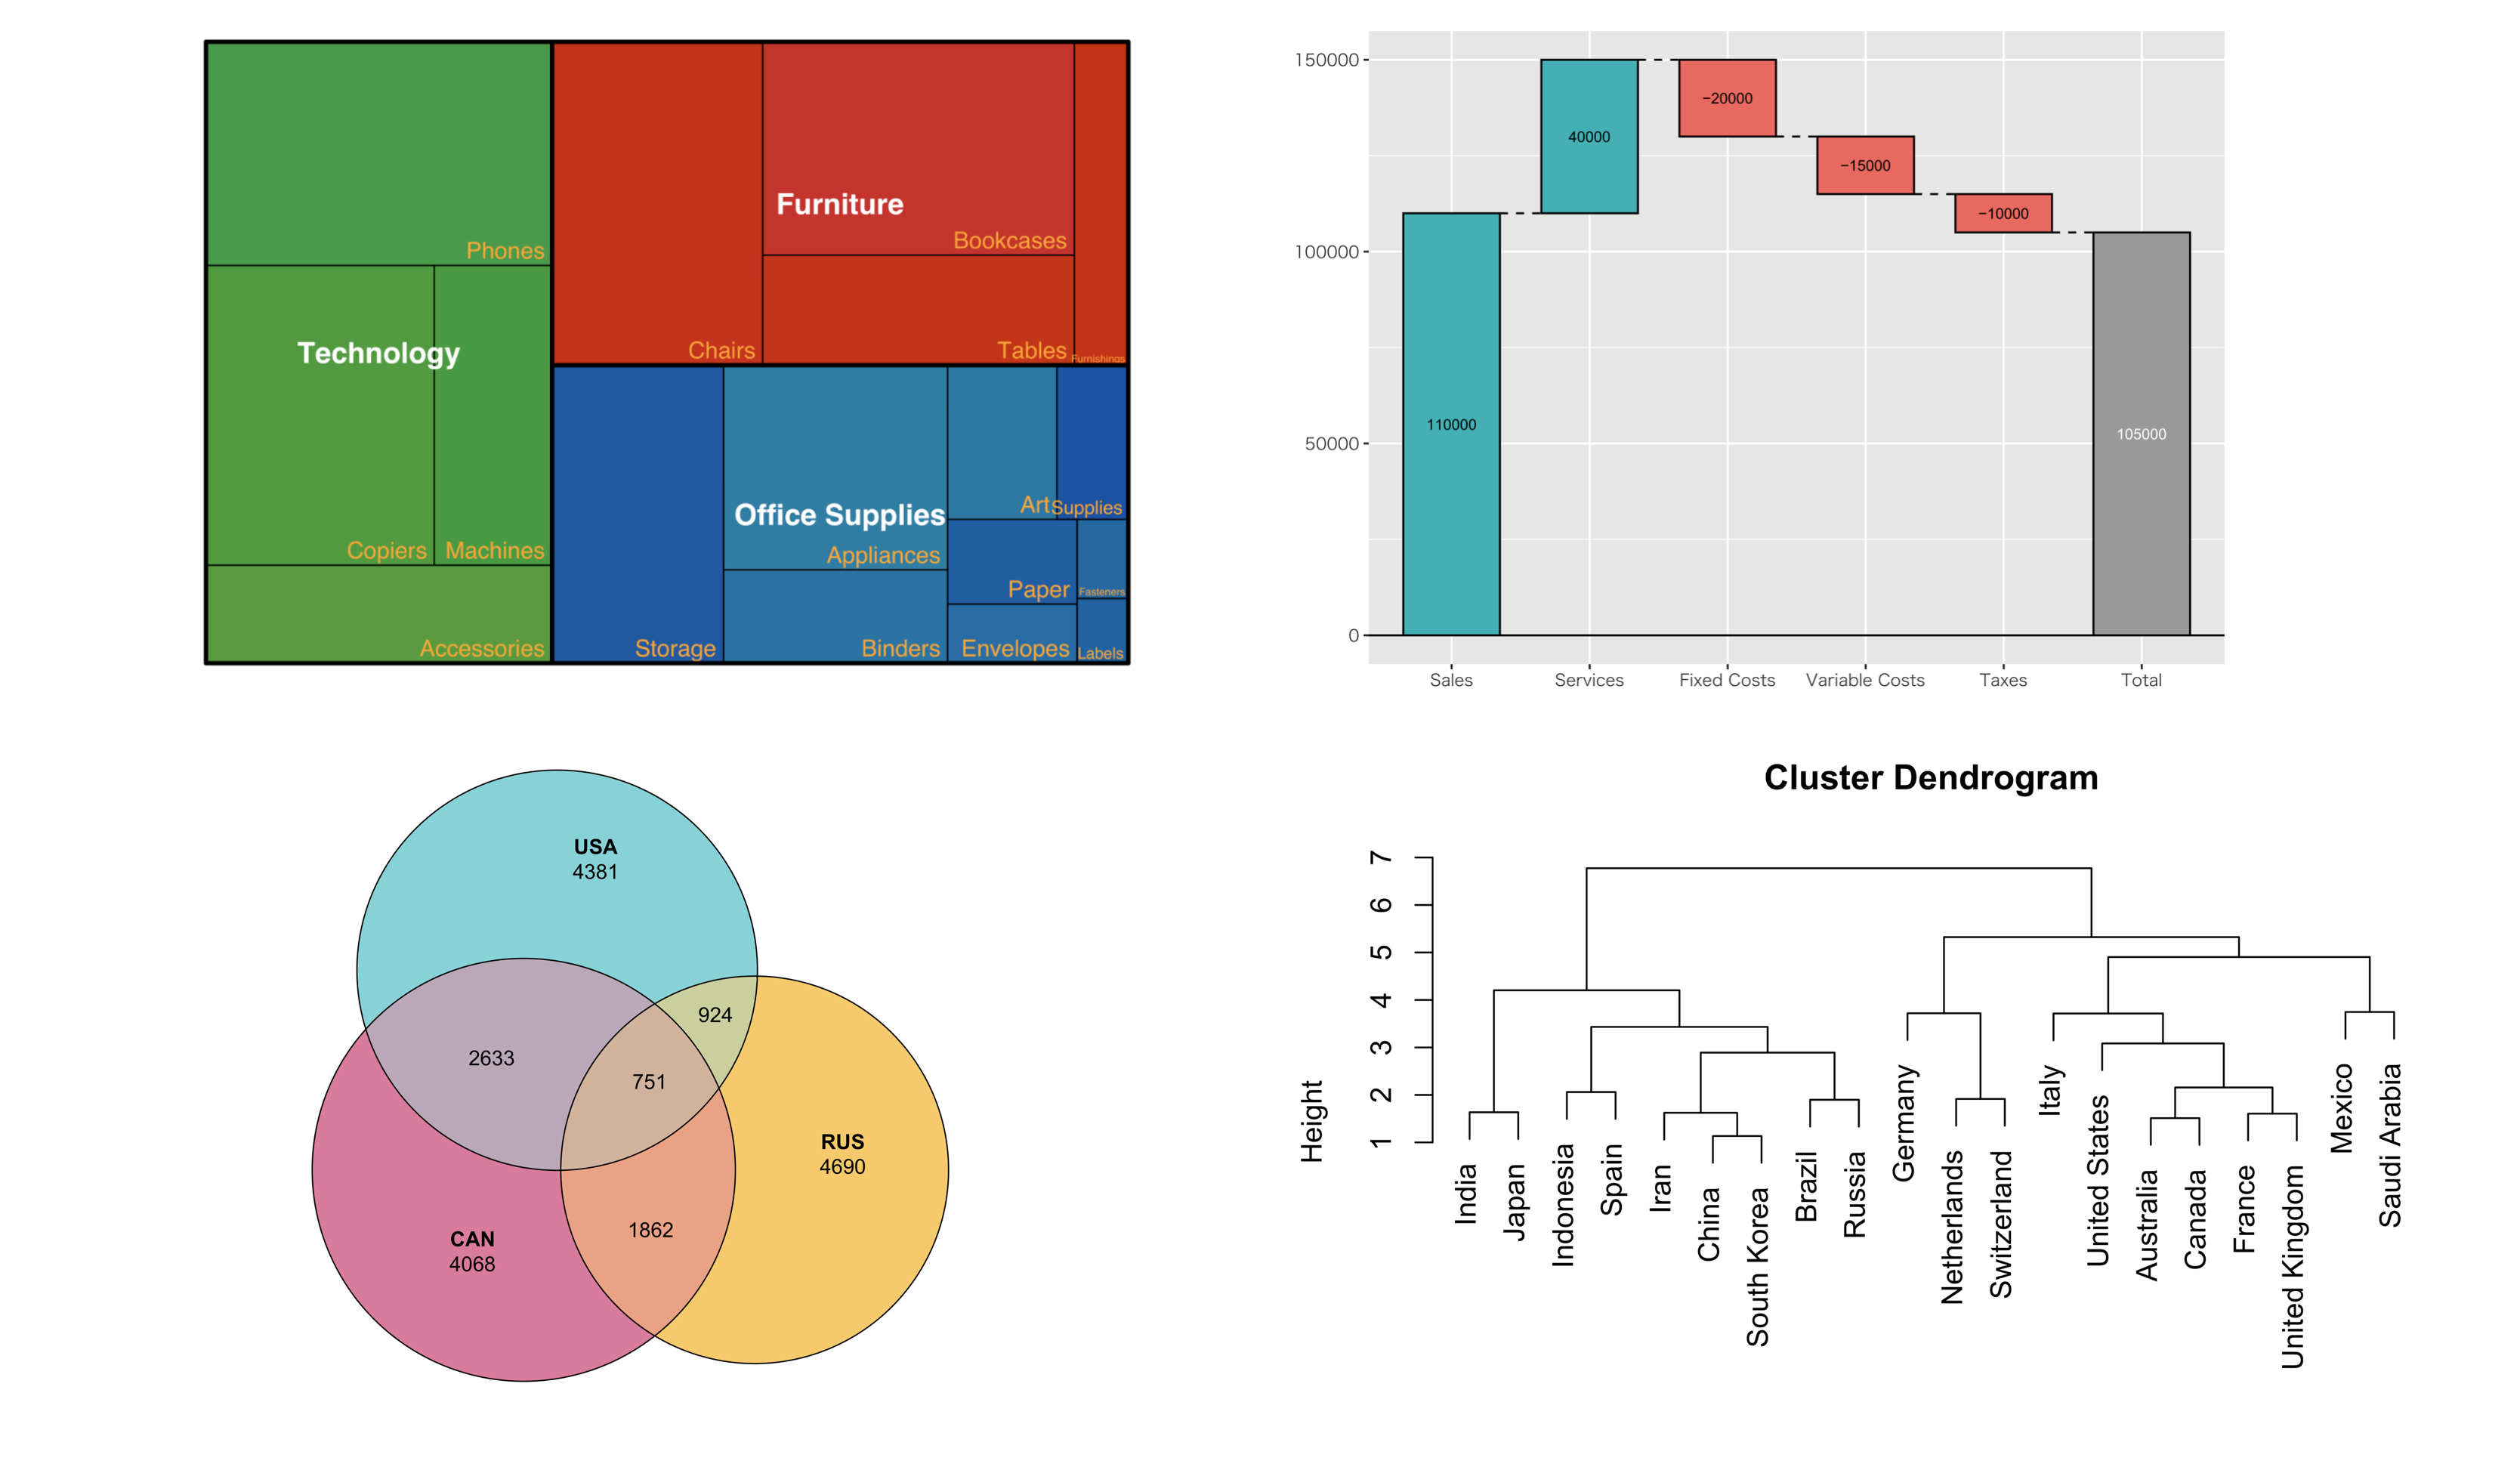
- Venn Diagram
- Waterfall Chart
- Treemap
- Hierarchical Clustering Tree
Video
Here is the recorded video.
Past Seminars
You can check other past seminars on this page.
For the upcoming seminars, check out our Exploratory Online Seminar page!