
Survey Data Analysis Part 2 - Text Analysis
This note is the second part of the “Survey Data Analysis” trial tour, focusing on “Text Analysis,” designed to help you efficiently learn how to leverage survey data to improve business and services. You can find the first part here.
In this tour, you will experience Exploratory’s “Text Analysis - Word Count” feature, which helps you quickly discover which words are frequently used and which words appear together in free-text survey responses.
The estimated time required is about 20 minutes.
Let’s get started!
1. What is Text Analysis?
In surveys, including “free-text” questions is a common practice to elicit specific thoughts from respondents that cannot be captured through 5-point scale ratings or similar structured questions.
However, interpreting qualitative data like free-text responses can vary from person to person, making it difficult to objectively grasp overall characteristics and trends. This often leads to underutilization of such valuable data.
By breaking down text into “words” and counting the frequency of each word (quantification), we can identify patterns and features within the data.
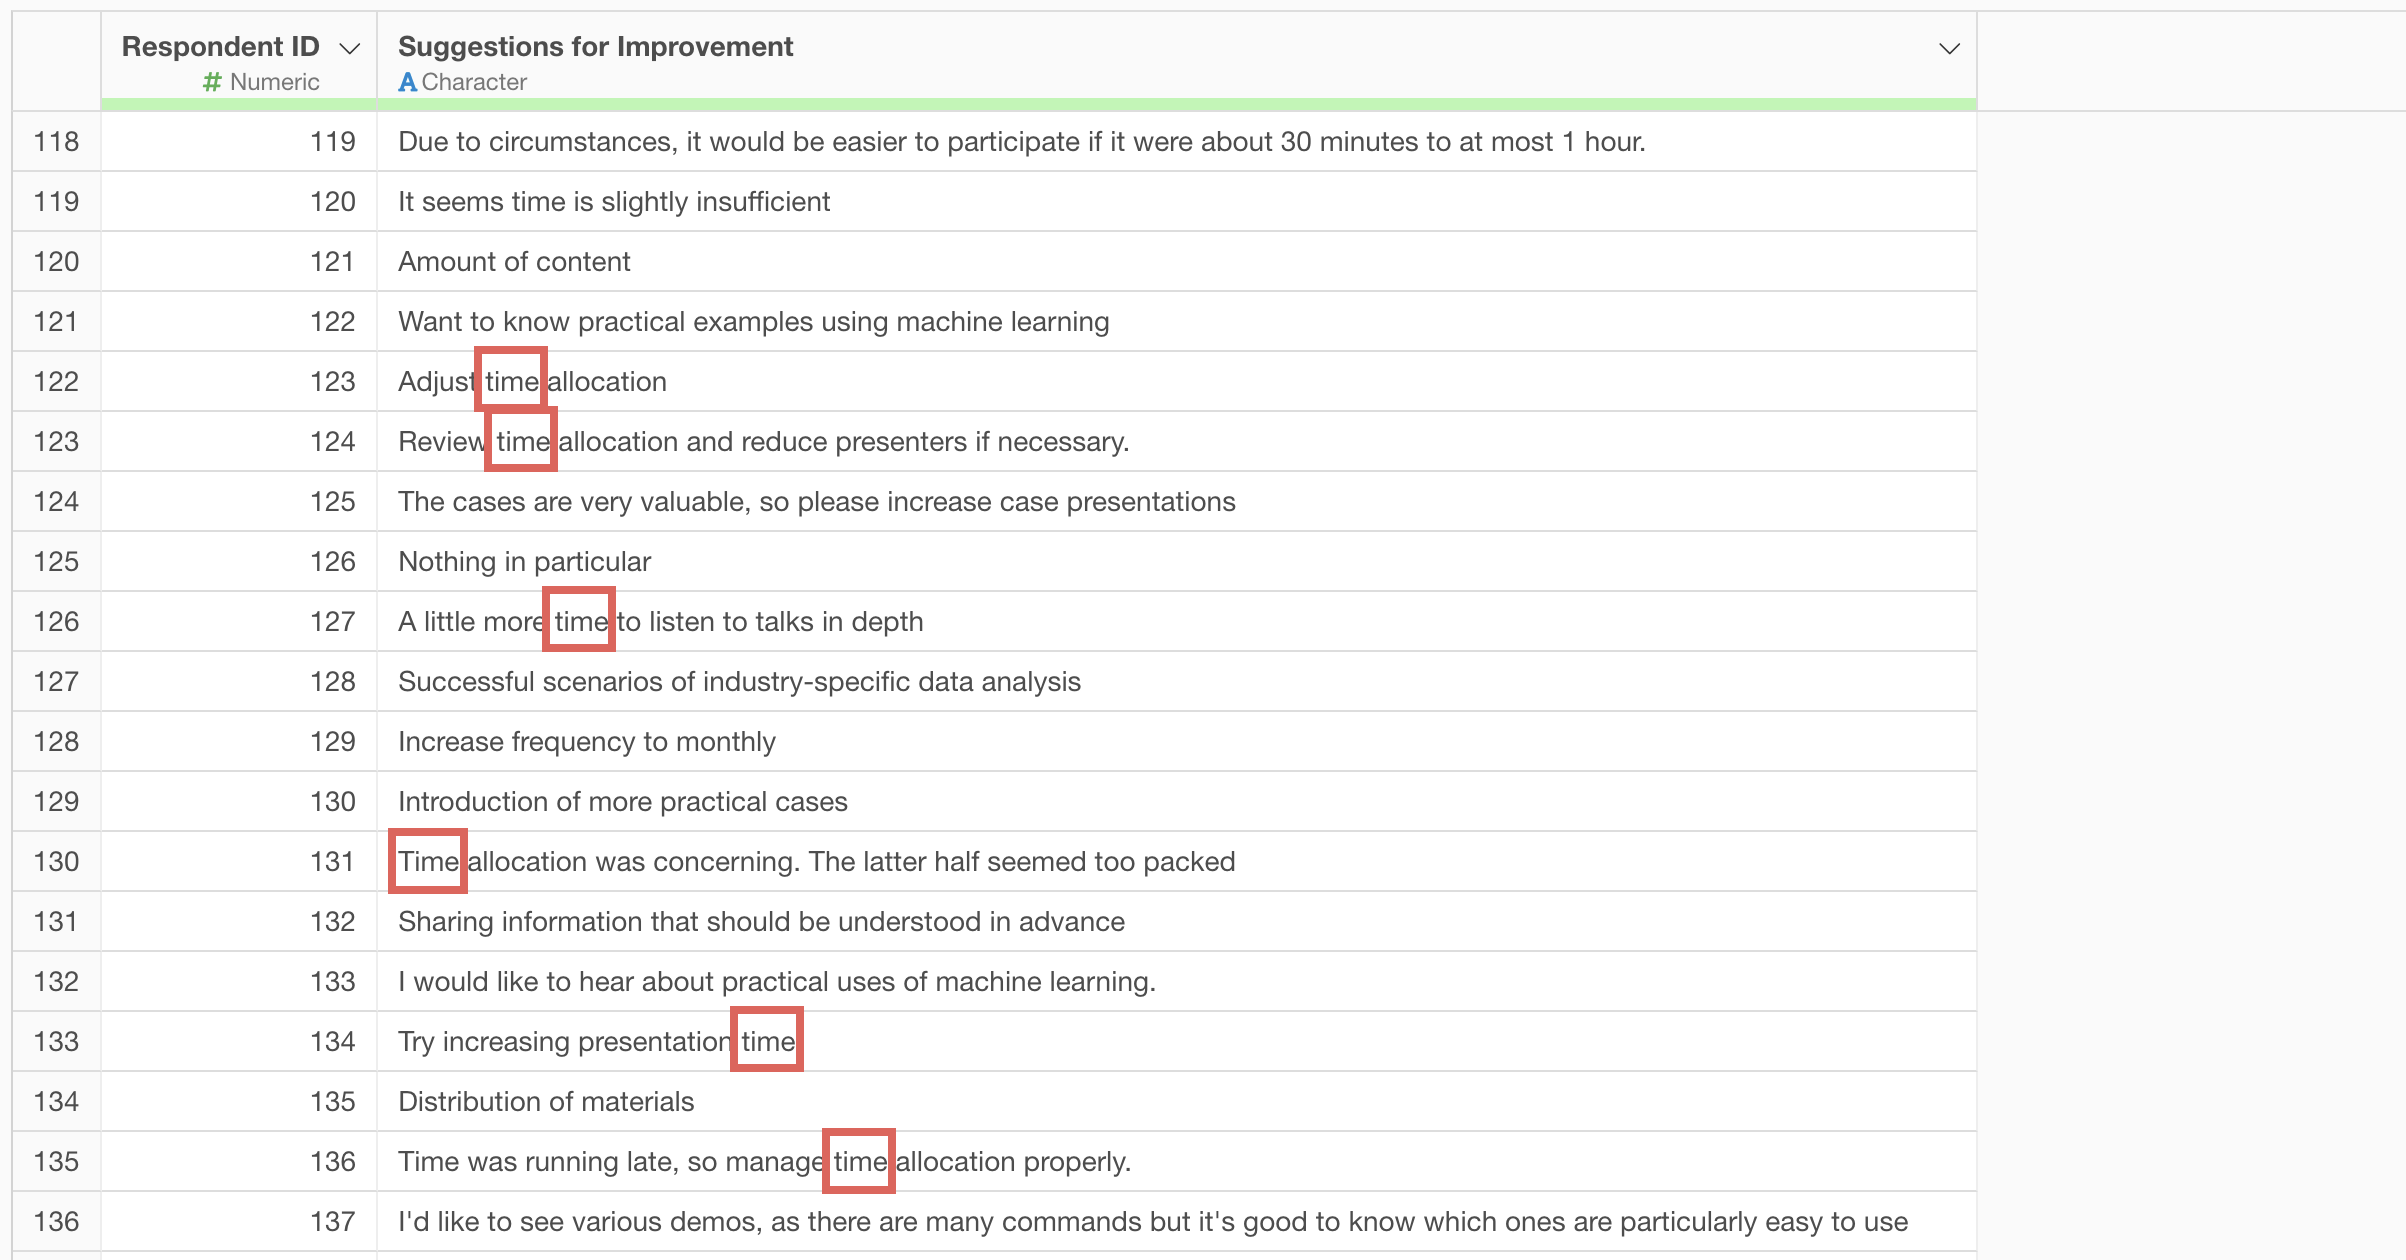
For example, as shown below, by knowing how often the word “time” is used, we can compare whether many or few survey respondents are concerned about “time.”
The image below illustrates how text is broken down into individual words, allowing us to count the frequency of each word. This process can be easily executed using the “Text Analysis - Word Count” feature introduced in this note.

Using “Text Analysis - Word Count,” you can answer the following questions:
- Which words are frequently used?
- What patterns exist among words that are used together?
2. Importing Data
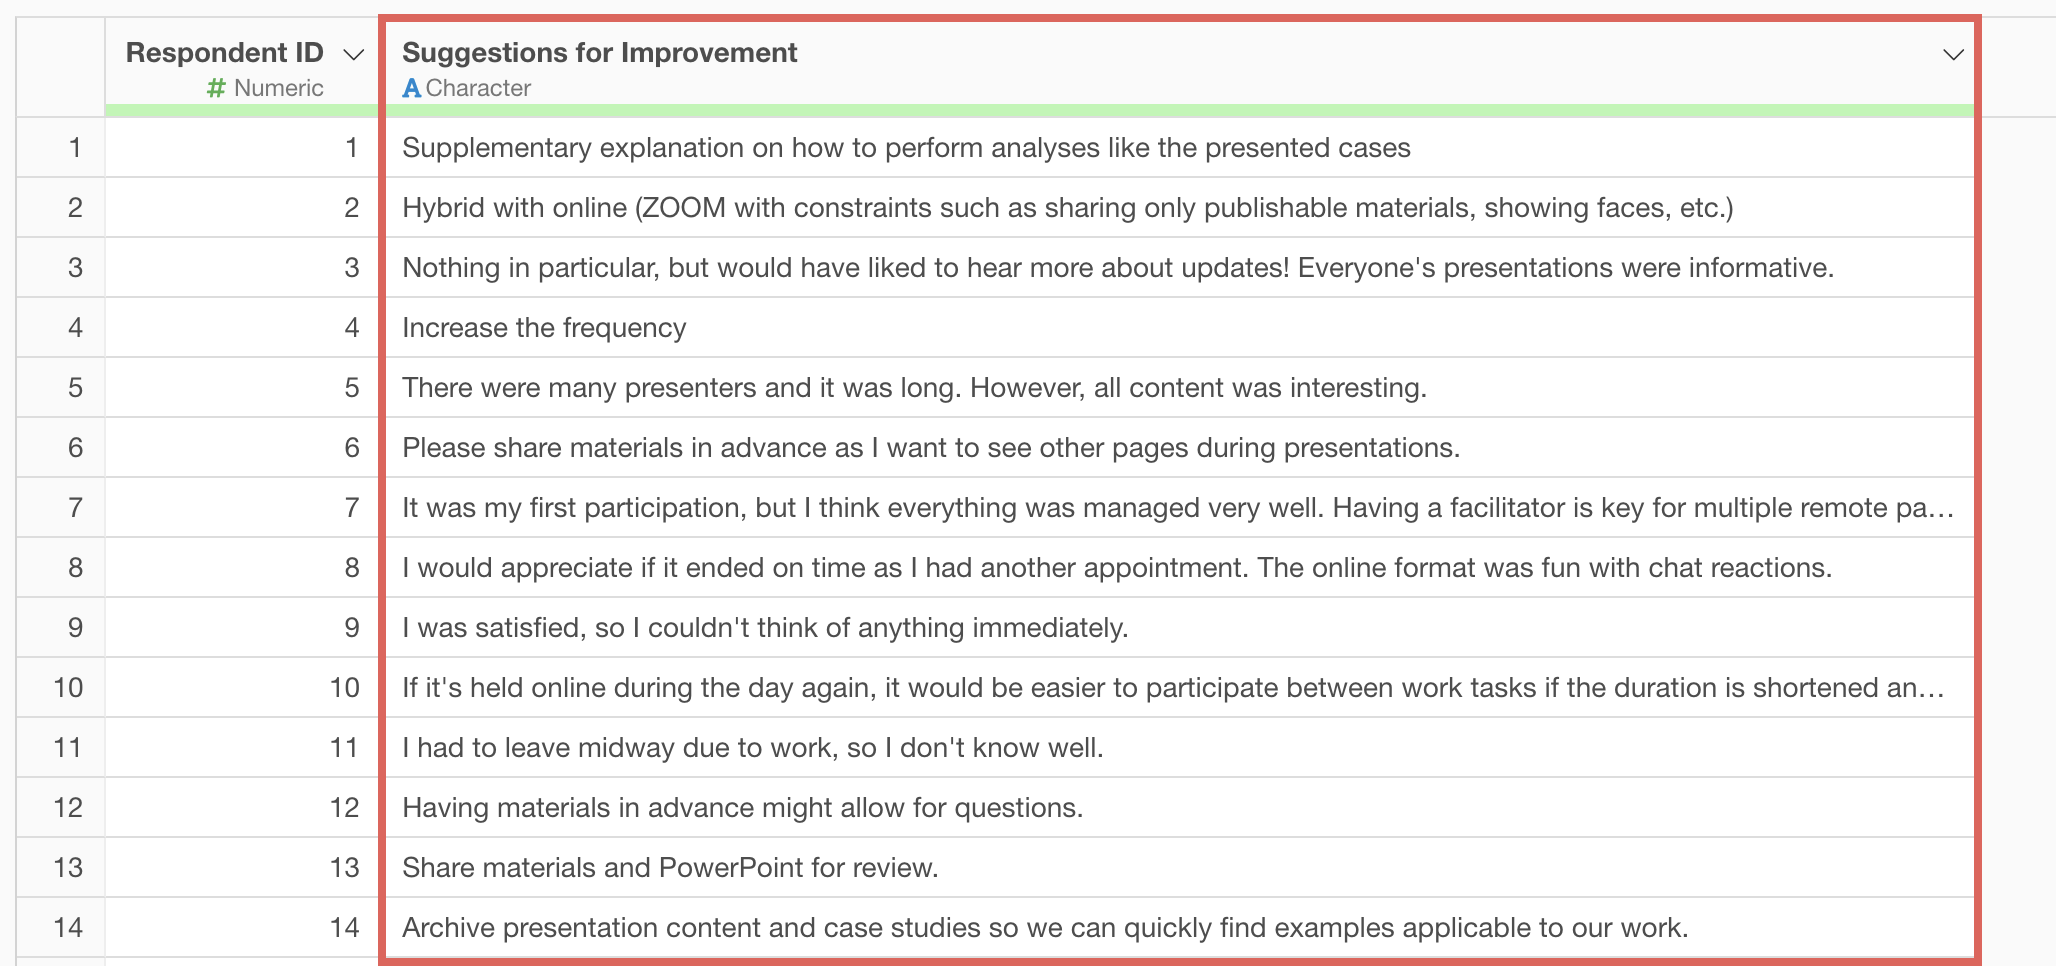
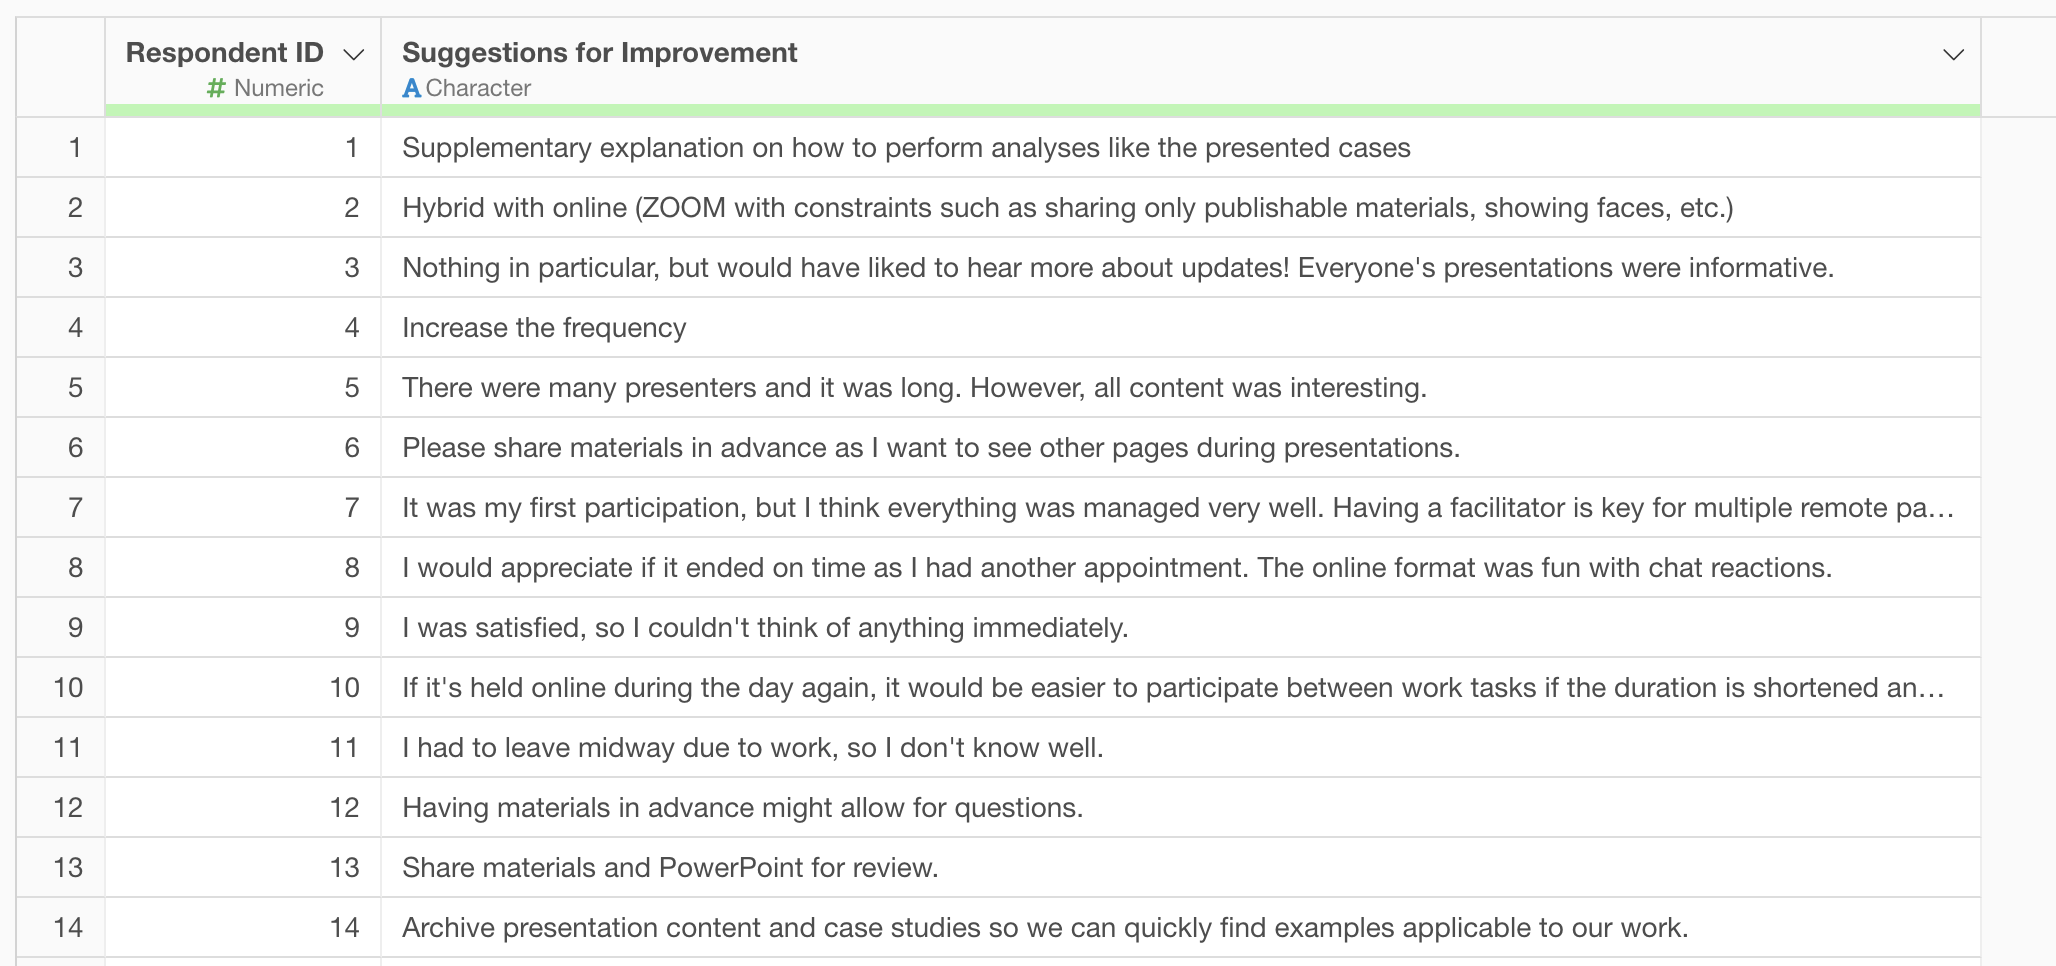
For this exercise, we’ll use “Seminar_Survey” sample data. Each row represents one respondent, and there is a column containing free-text responses to the question “Suggestions for improving.”
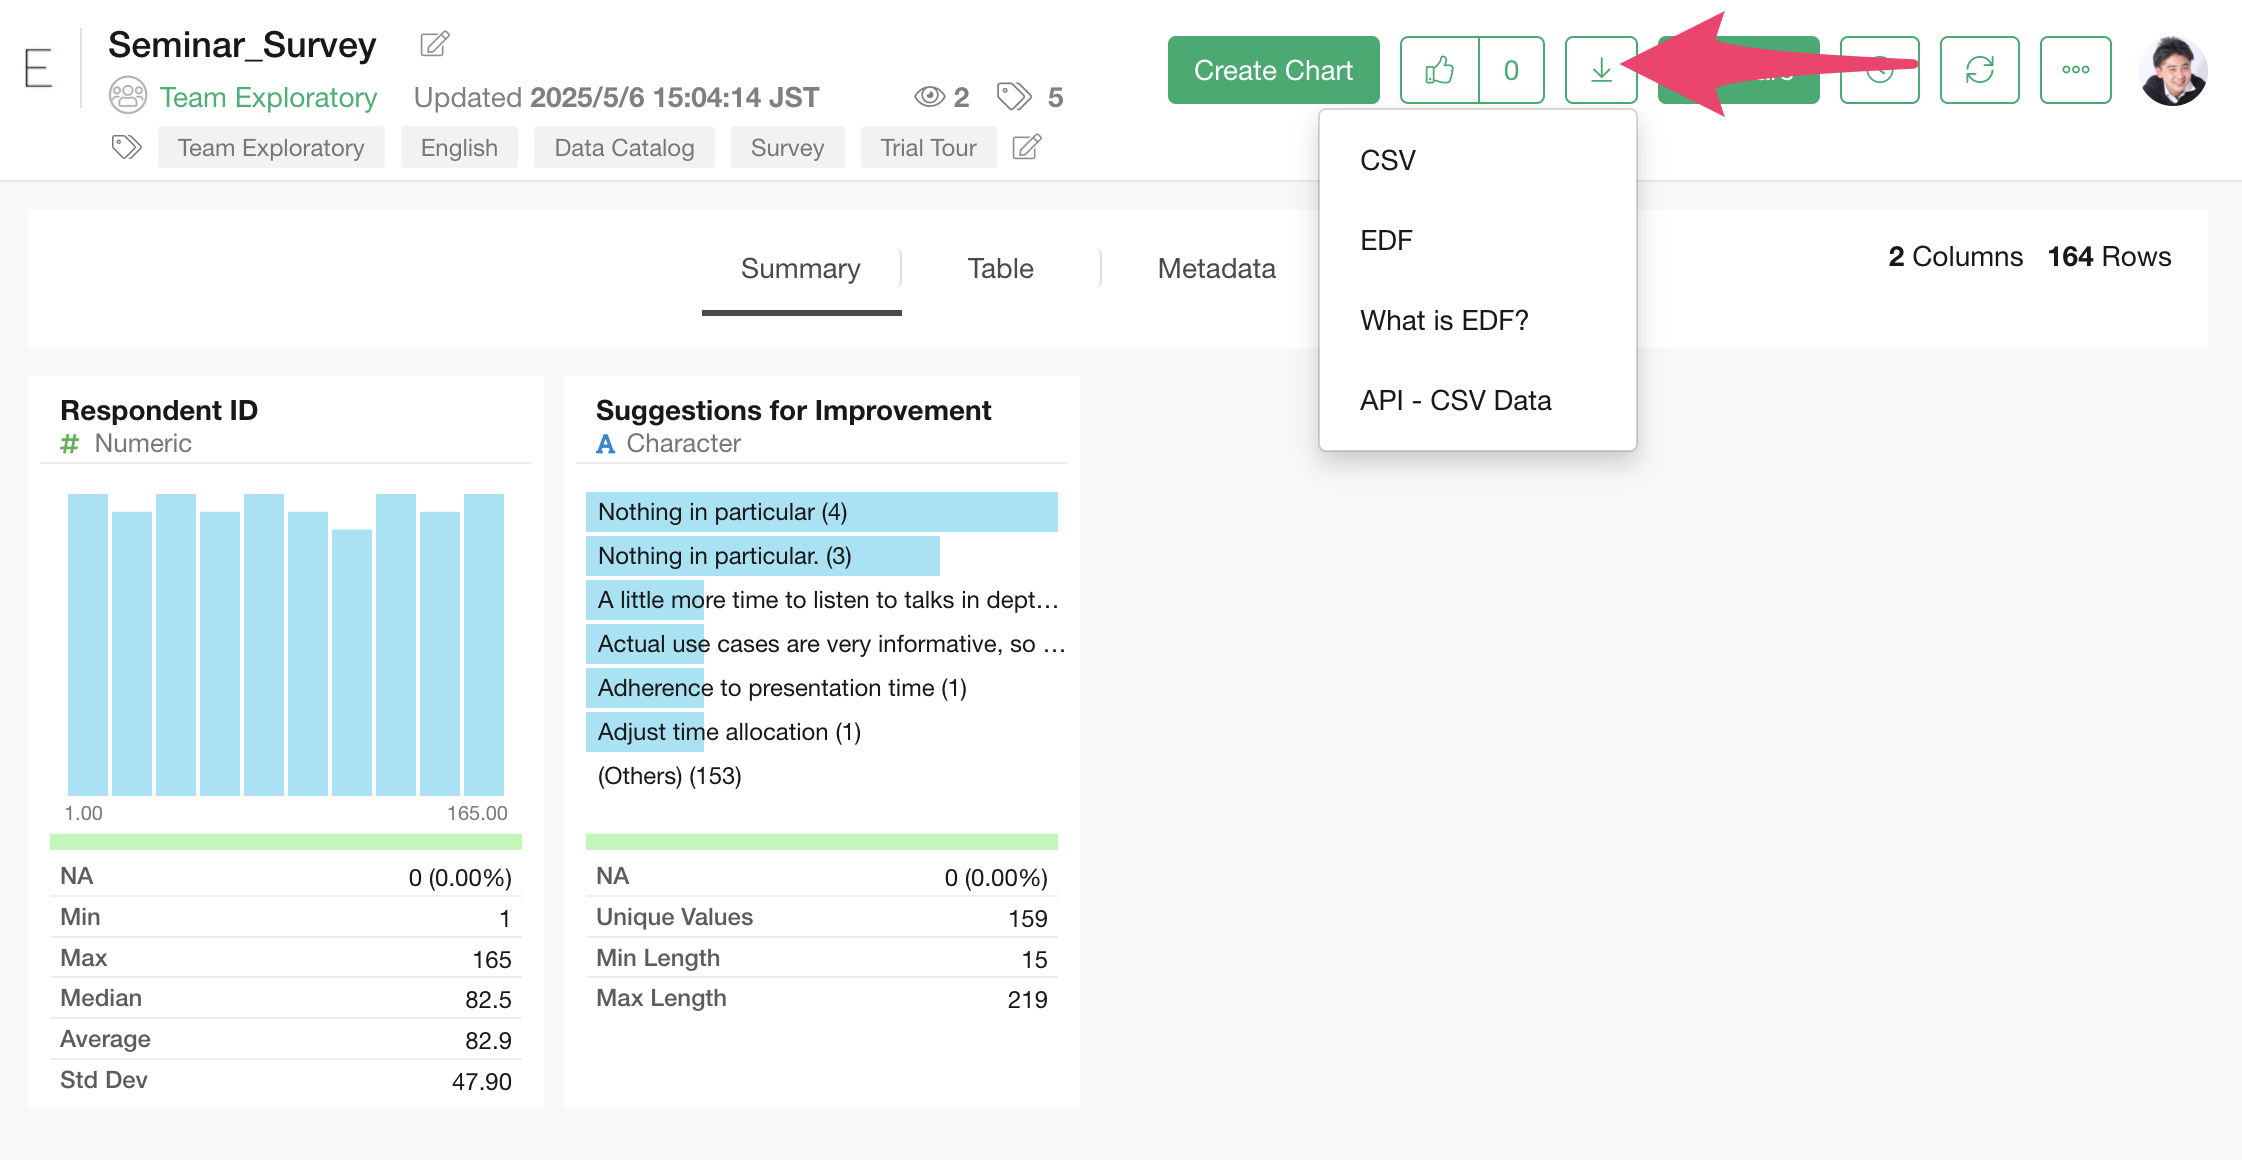
You can download the data from this page. Mac users should download “CSV”
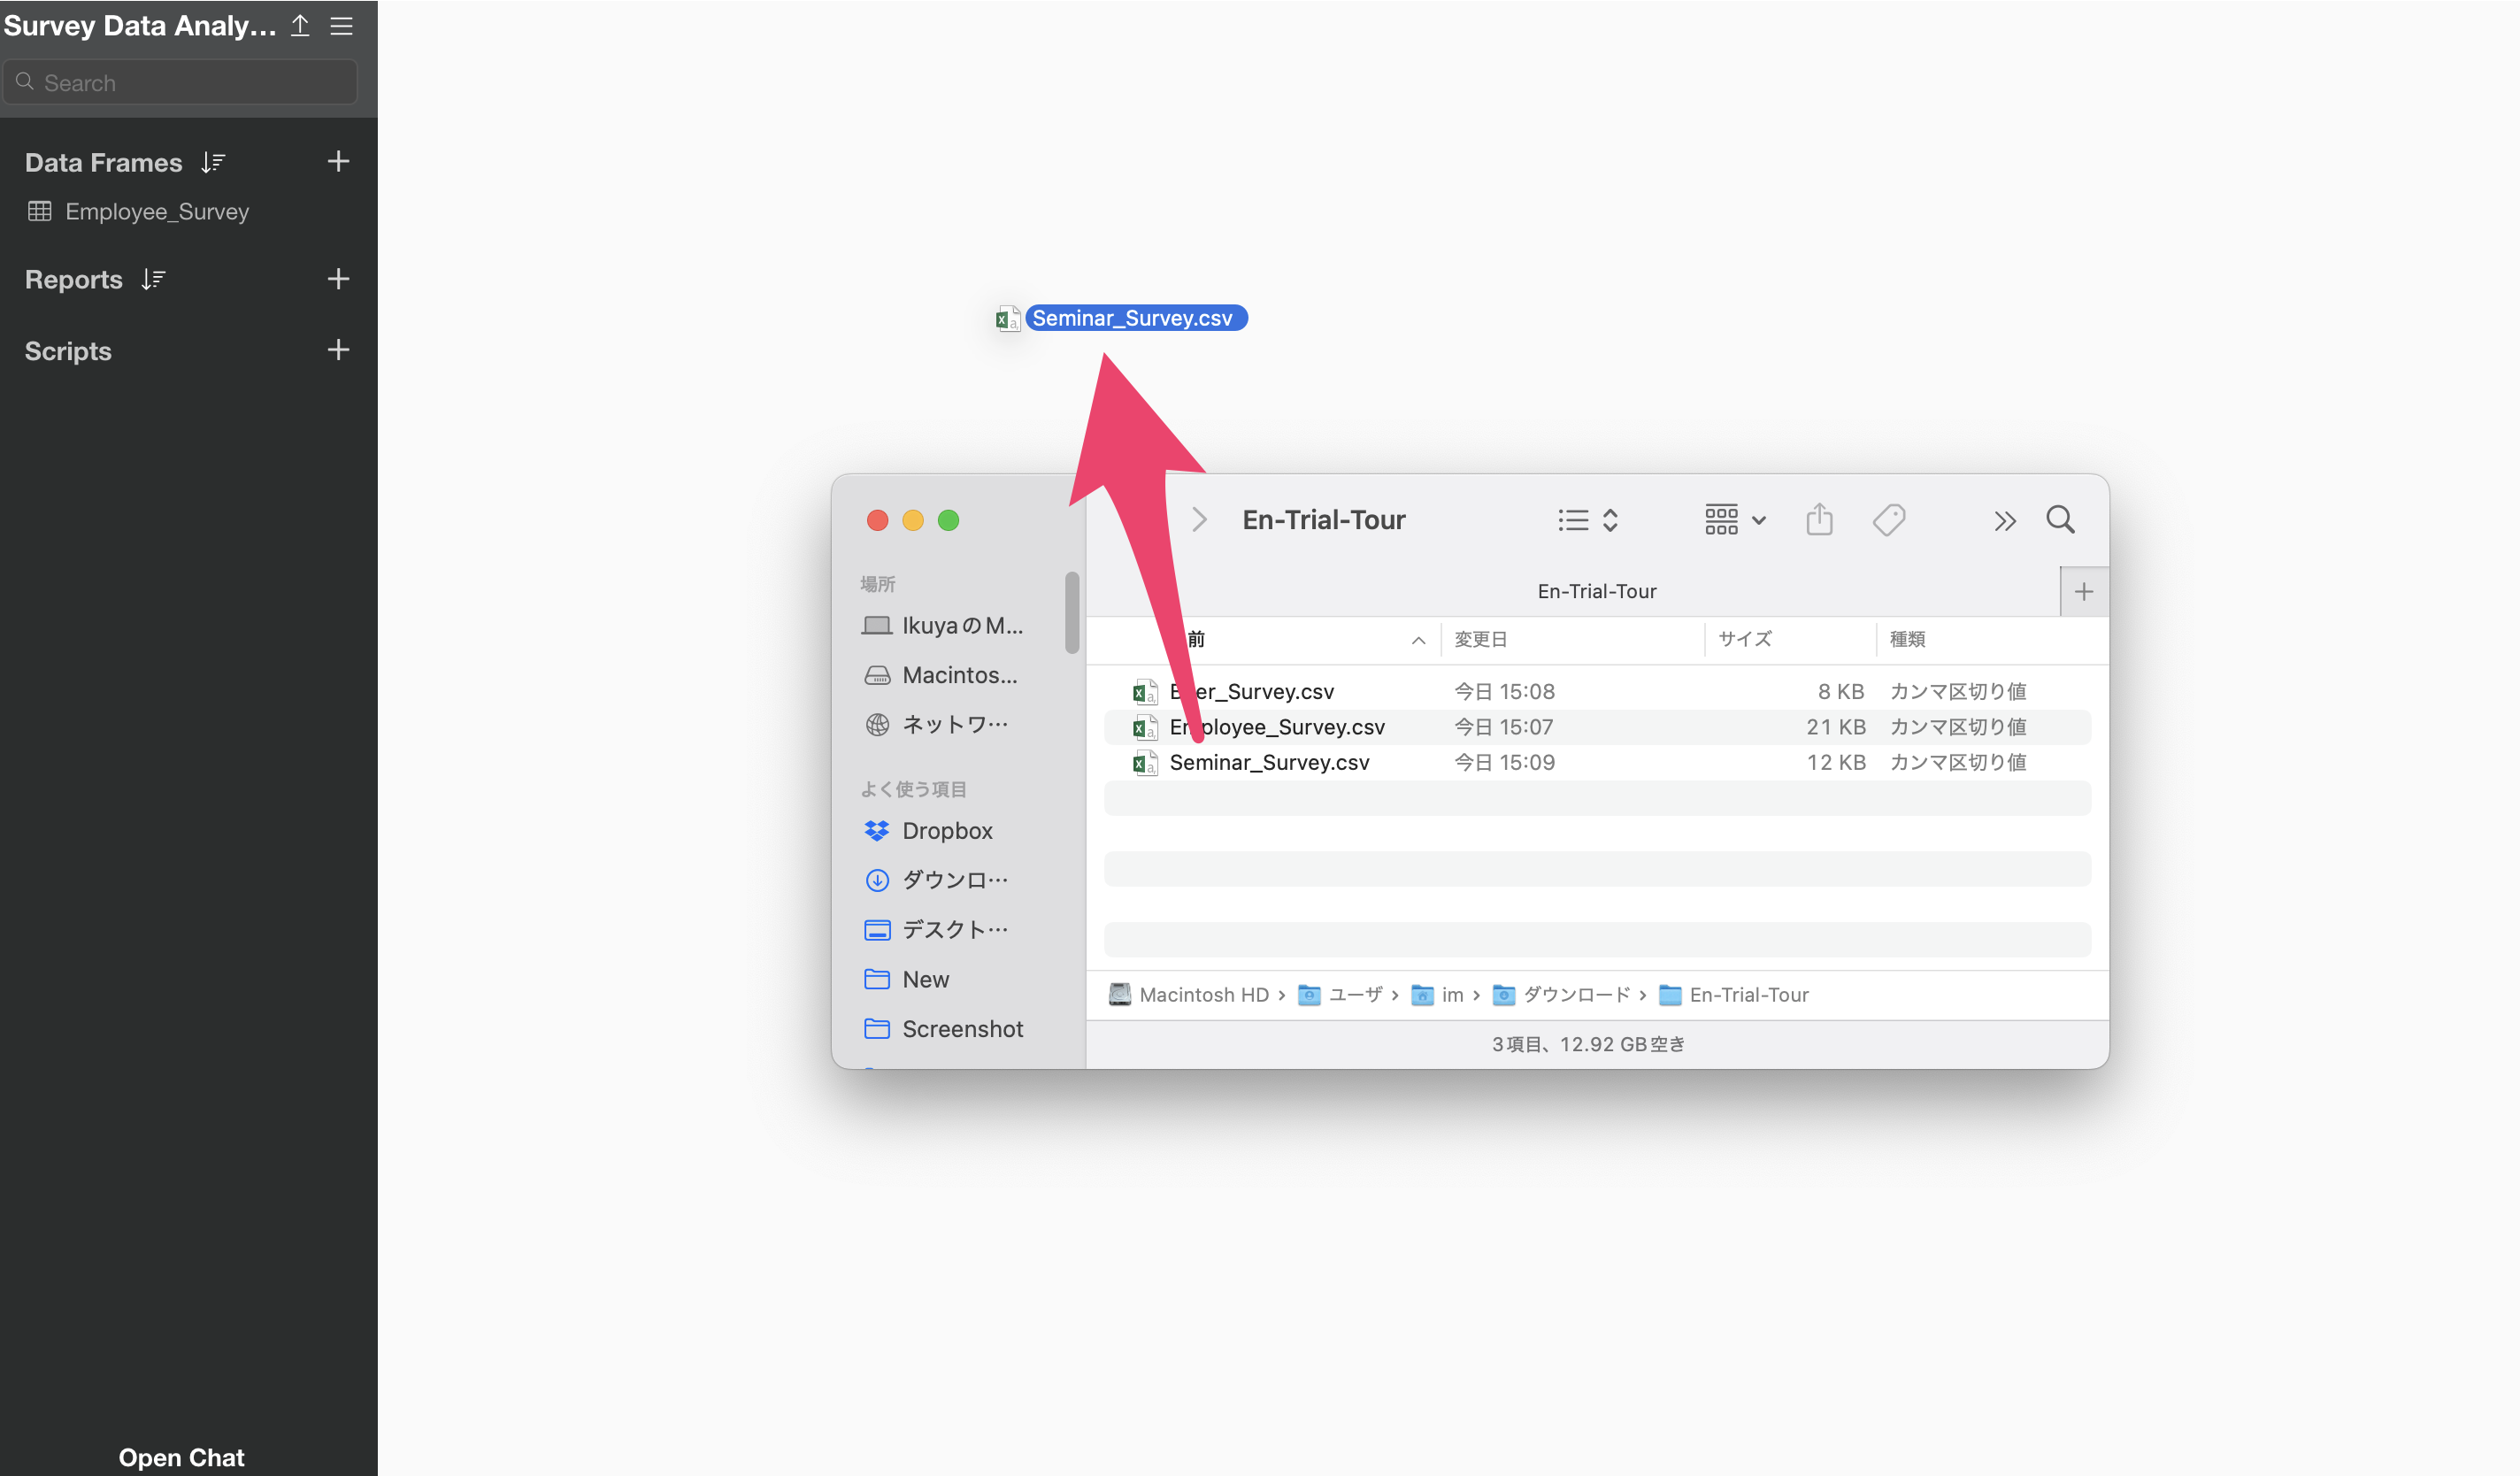
After downloading the seminar survey data, open the download folder and drag and drop it onto the Exploratory screen.
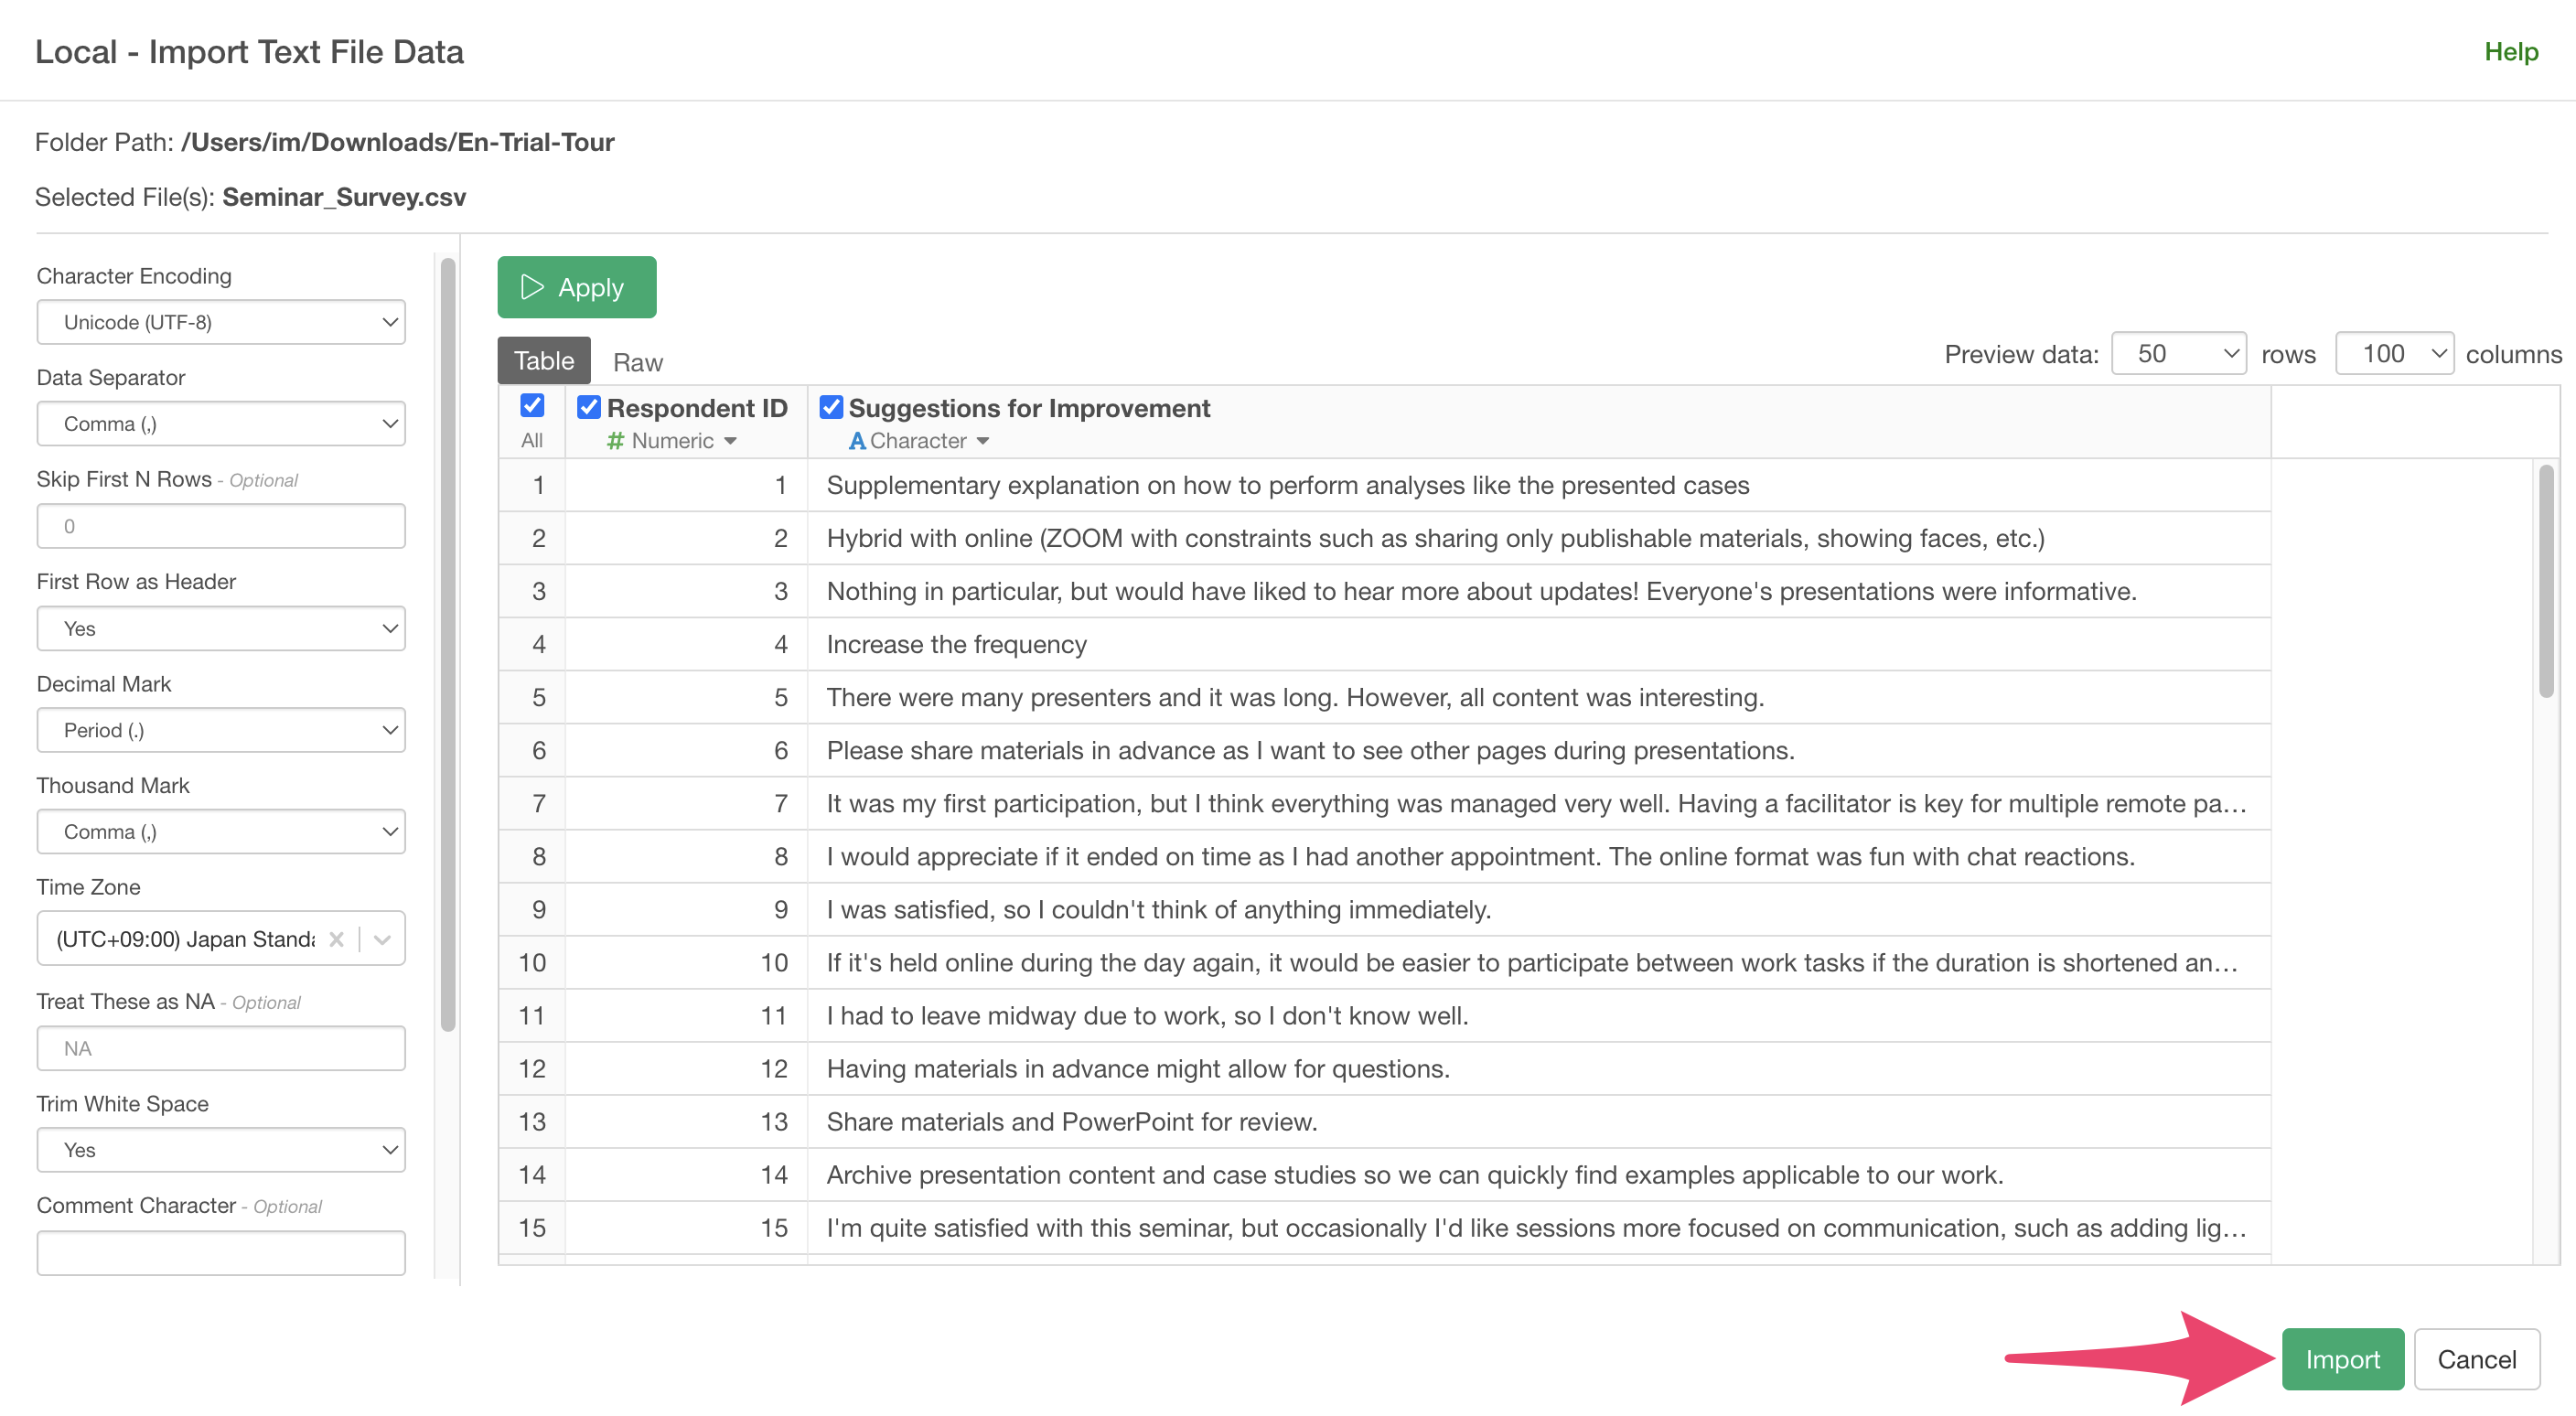
An import dialog will appear. You can configure import settings from the items on the left side of the dialog, but no settings are required for this exercise, so click the “Save” button.
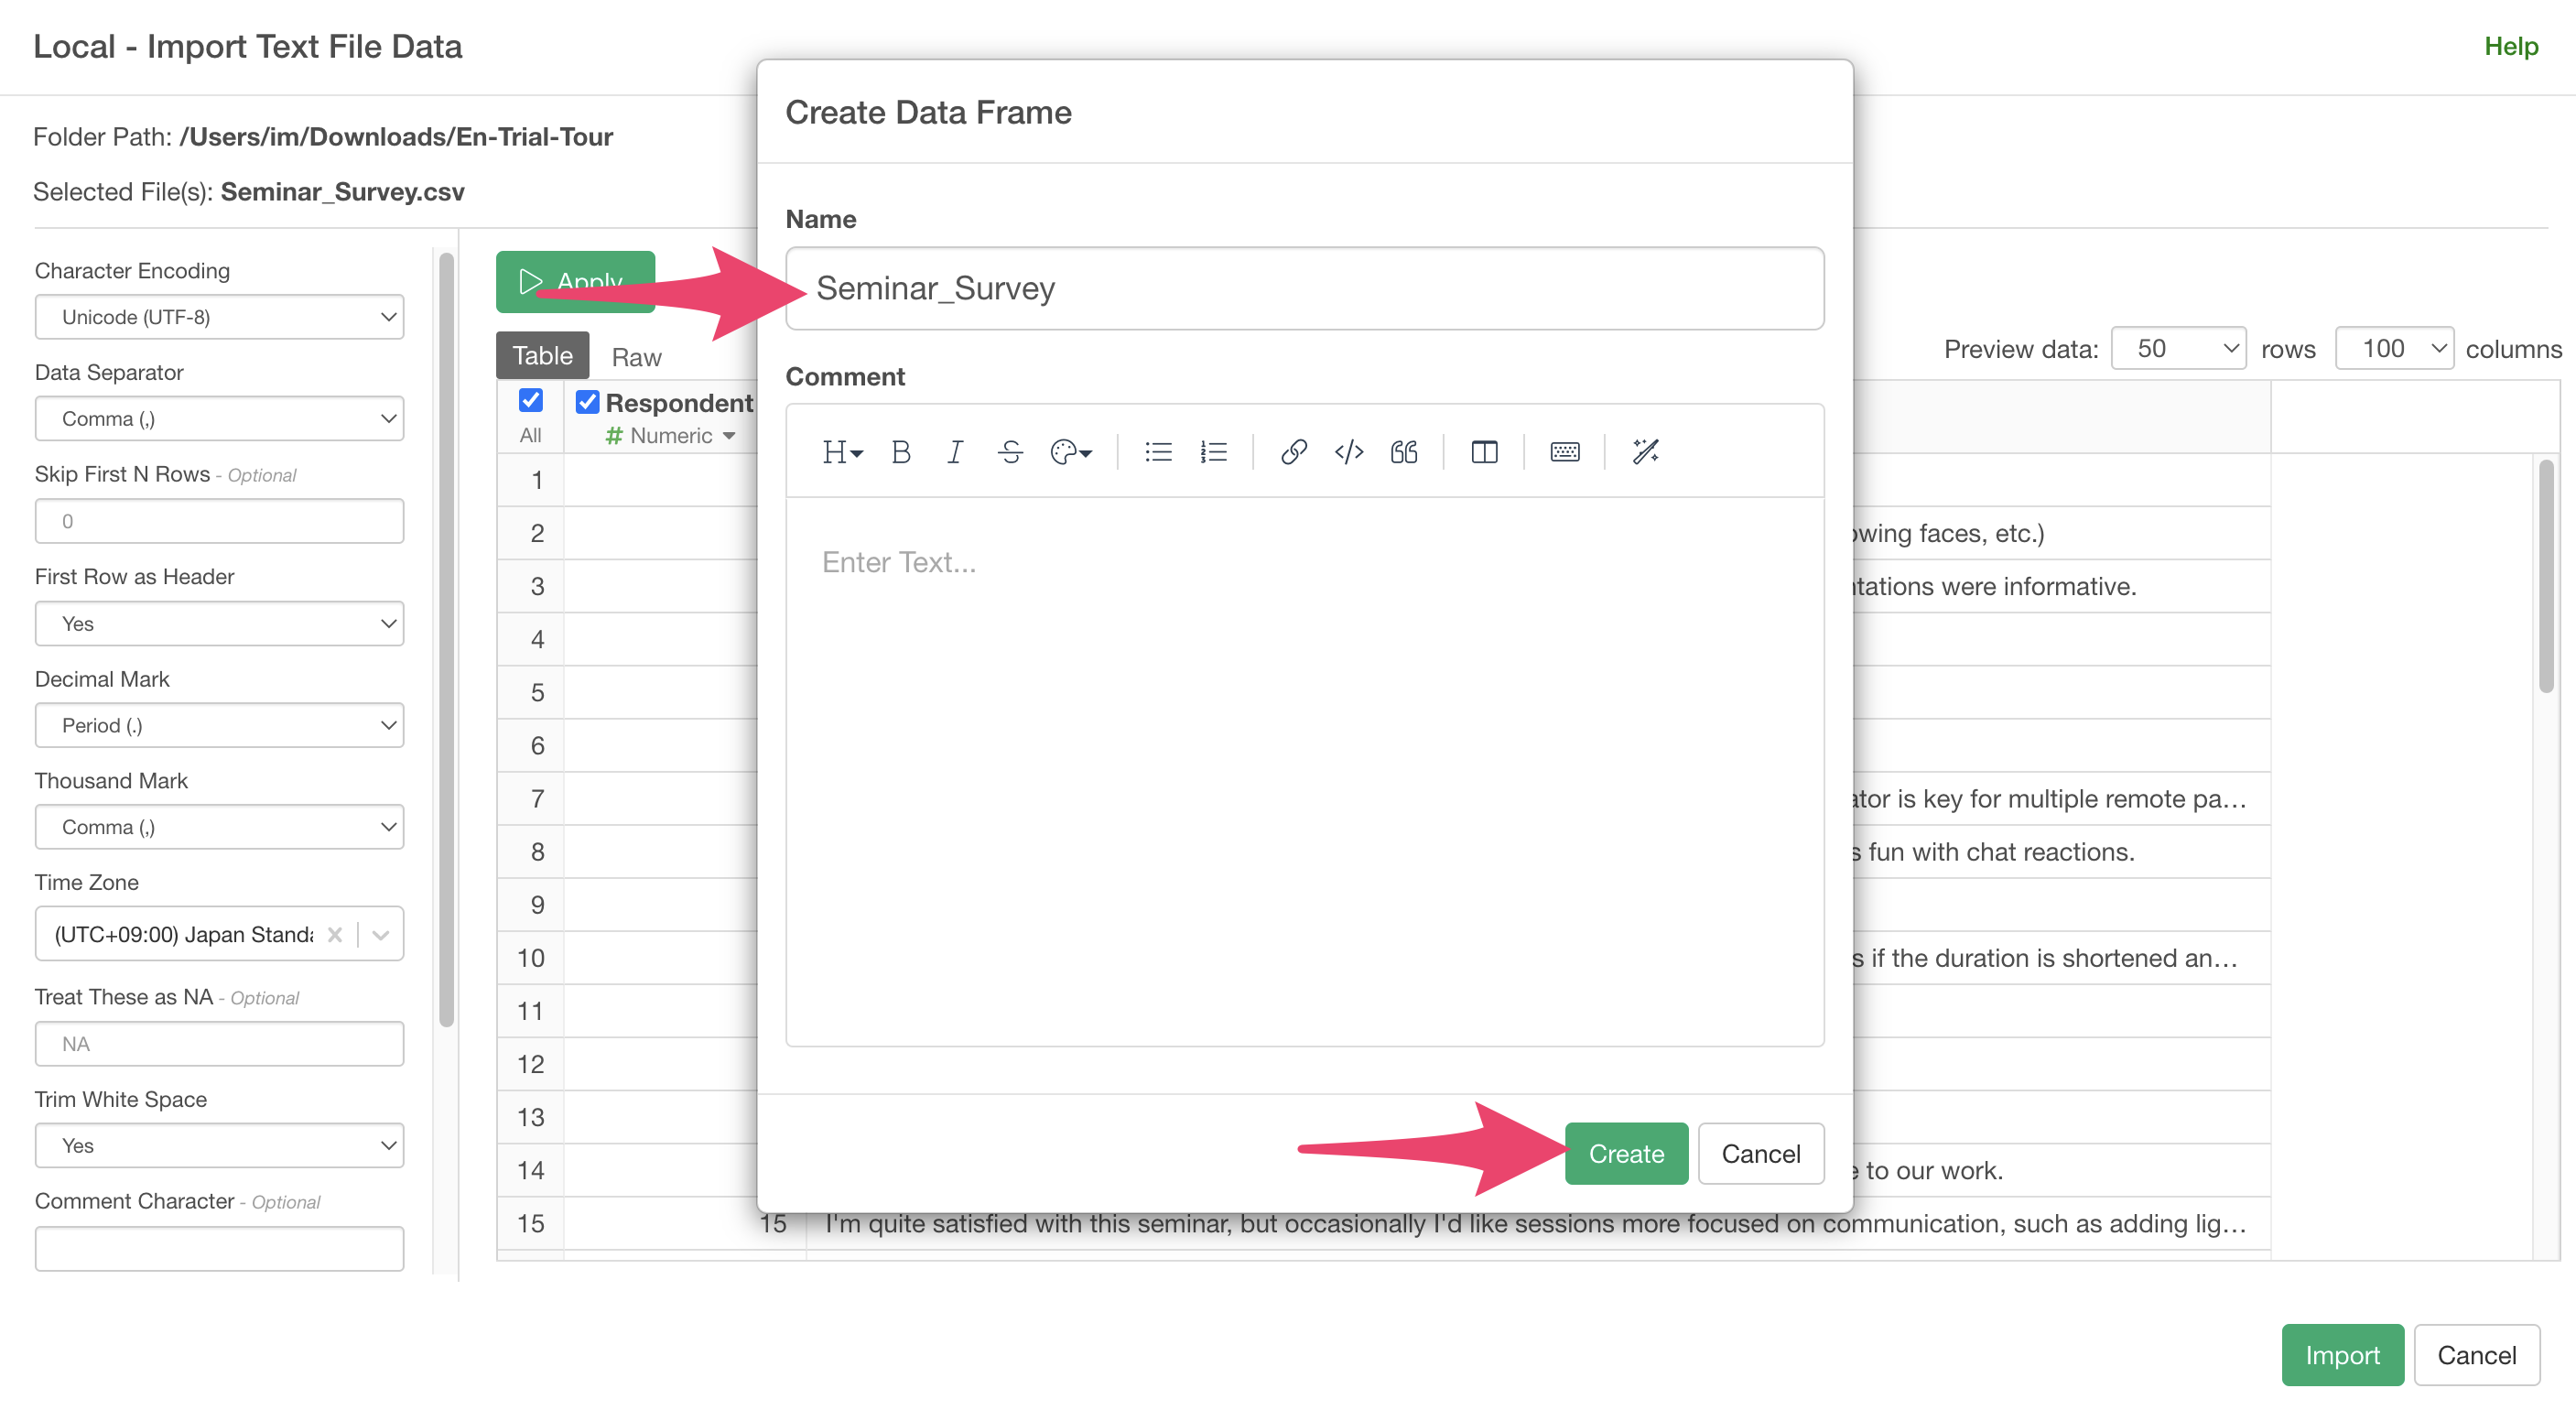
Specify any data frame name and click the “Create” button.
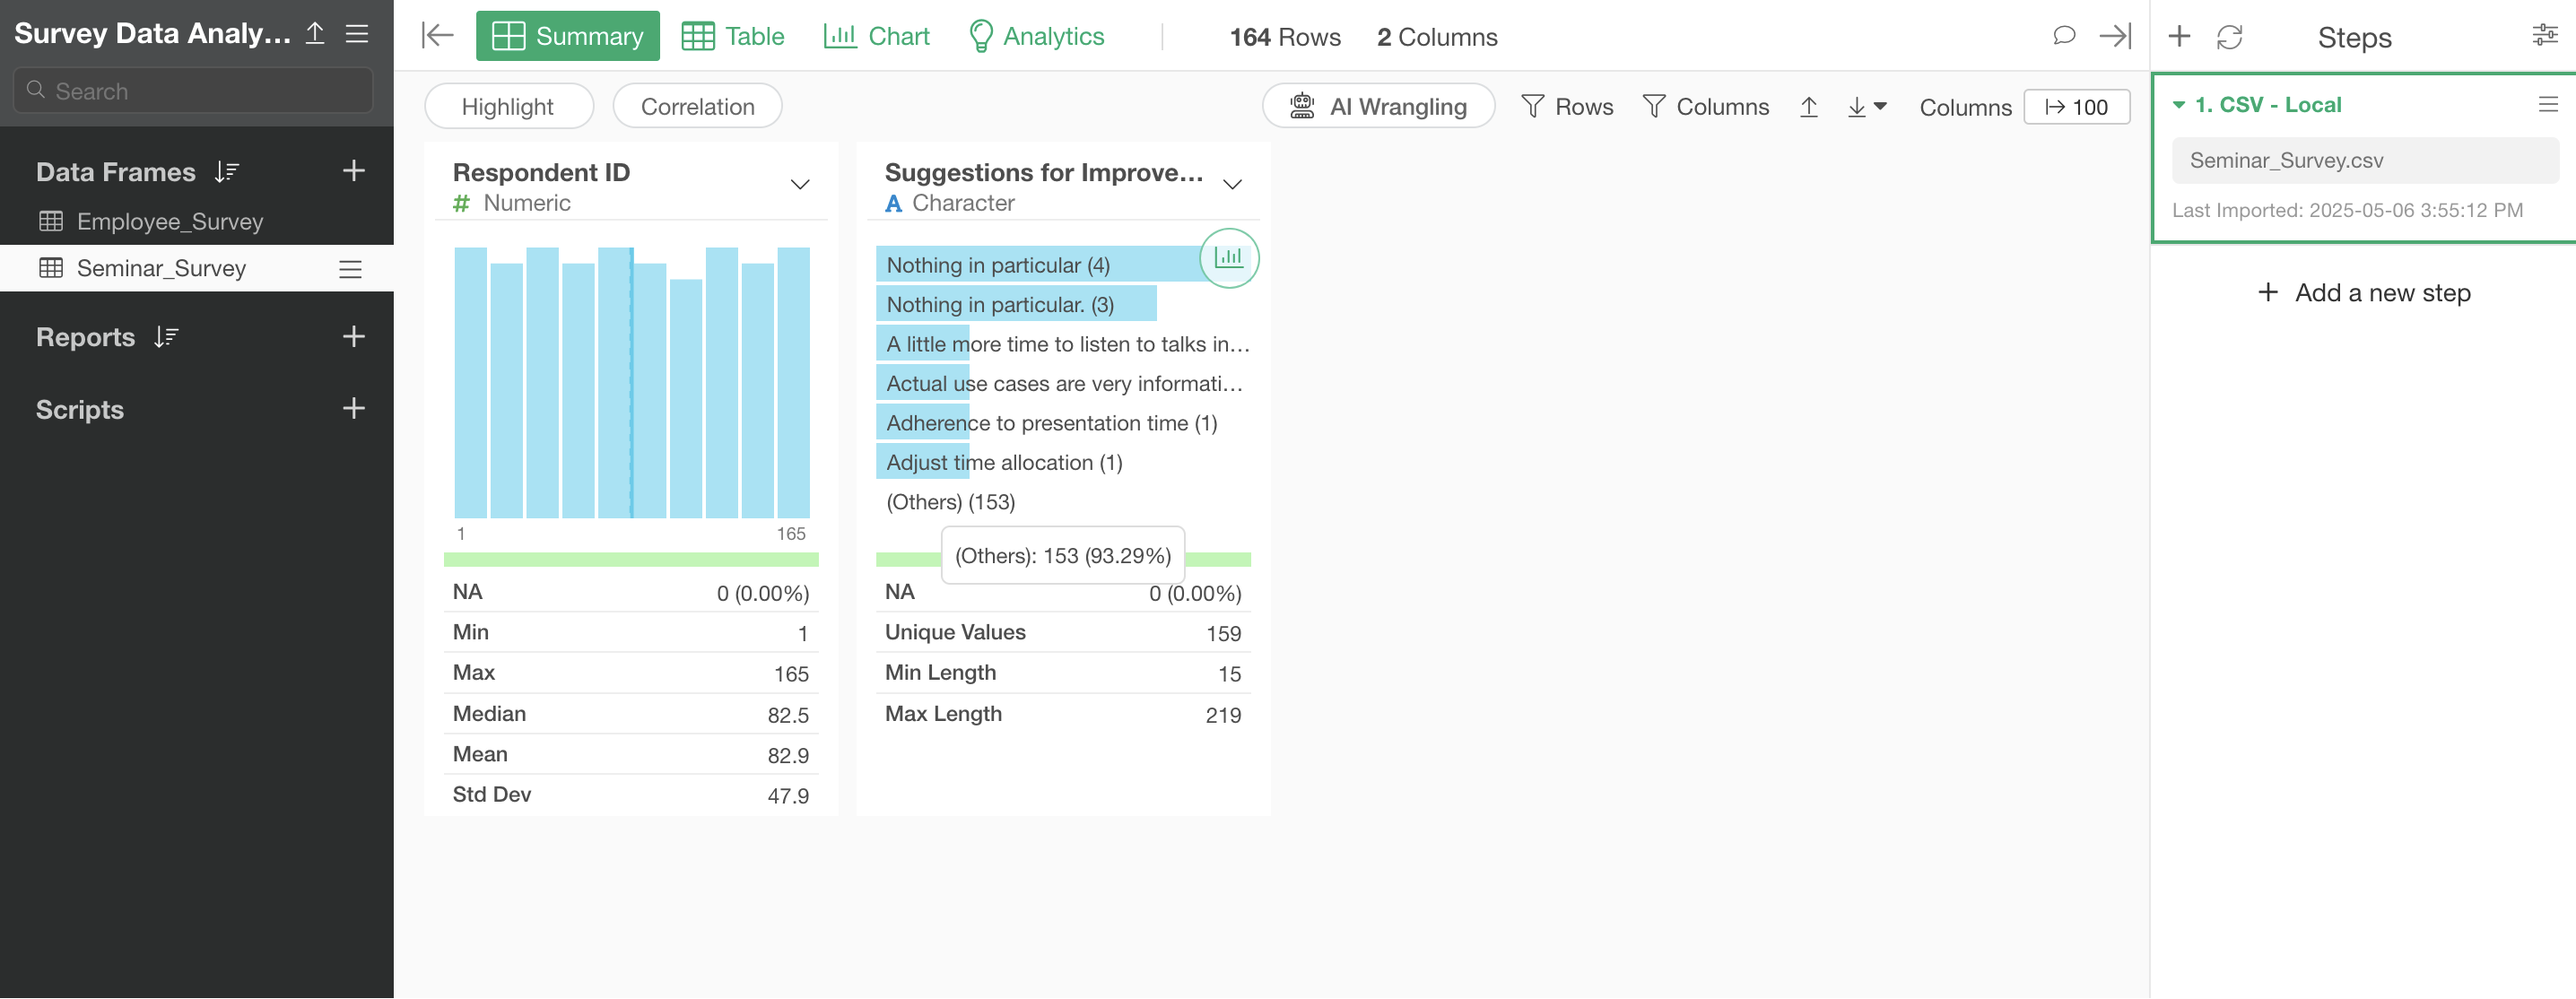
 You
have successfully imported the seminar survey data.
You
have successfully imported the seminar survey data.
3. Running Text Analysis - Word Count
Now, let’s examine which words are frequently used in the free-text responses to “Suggestions for improvement.”
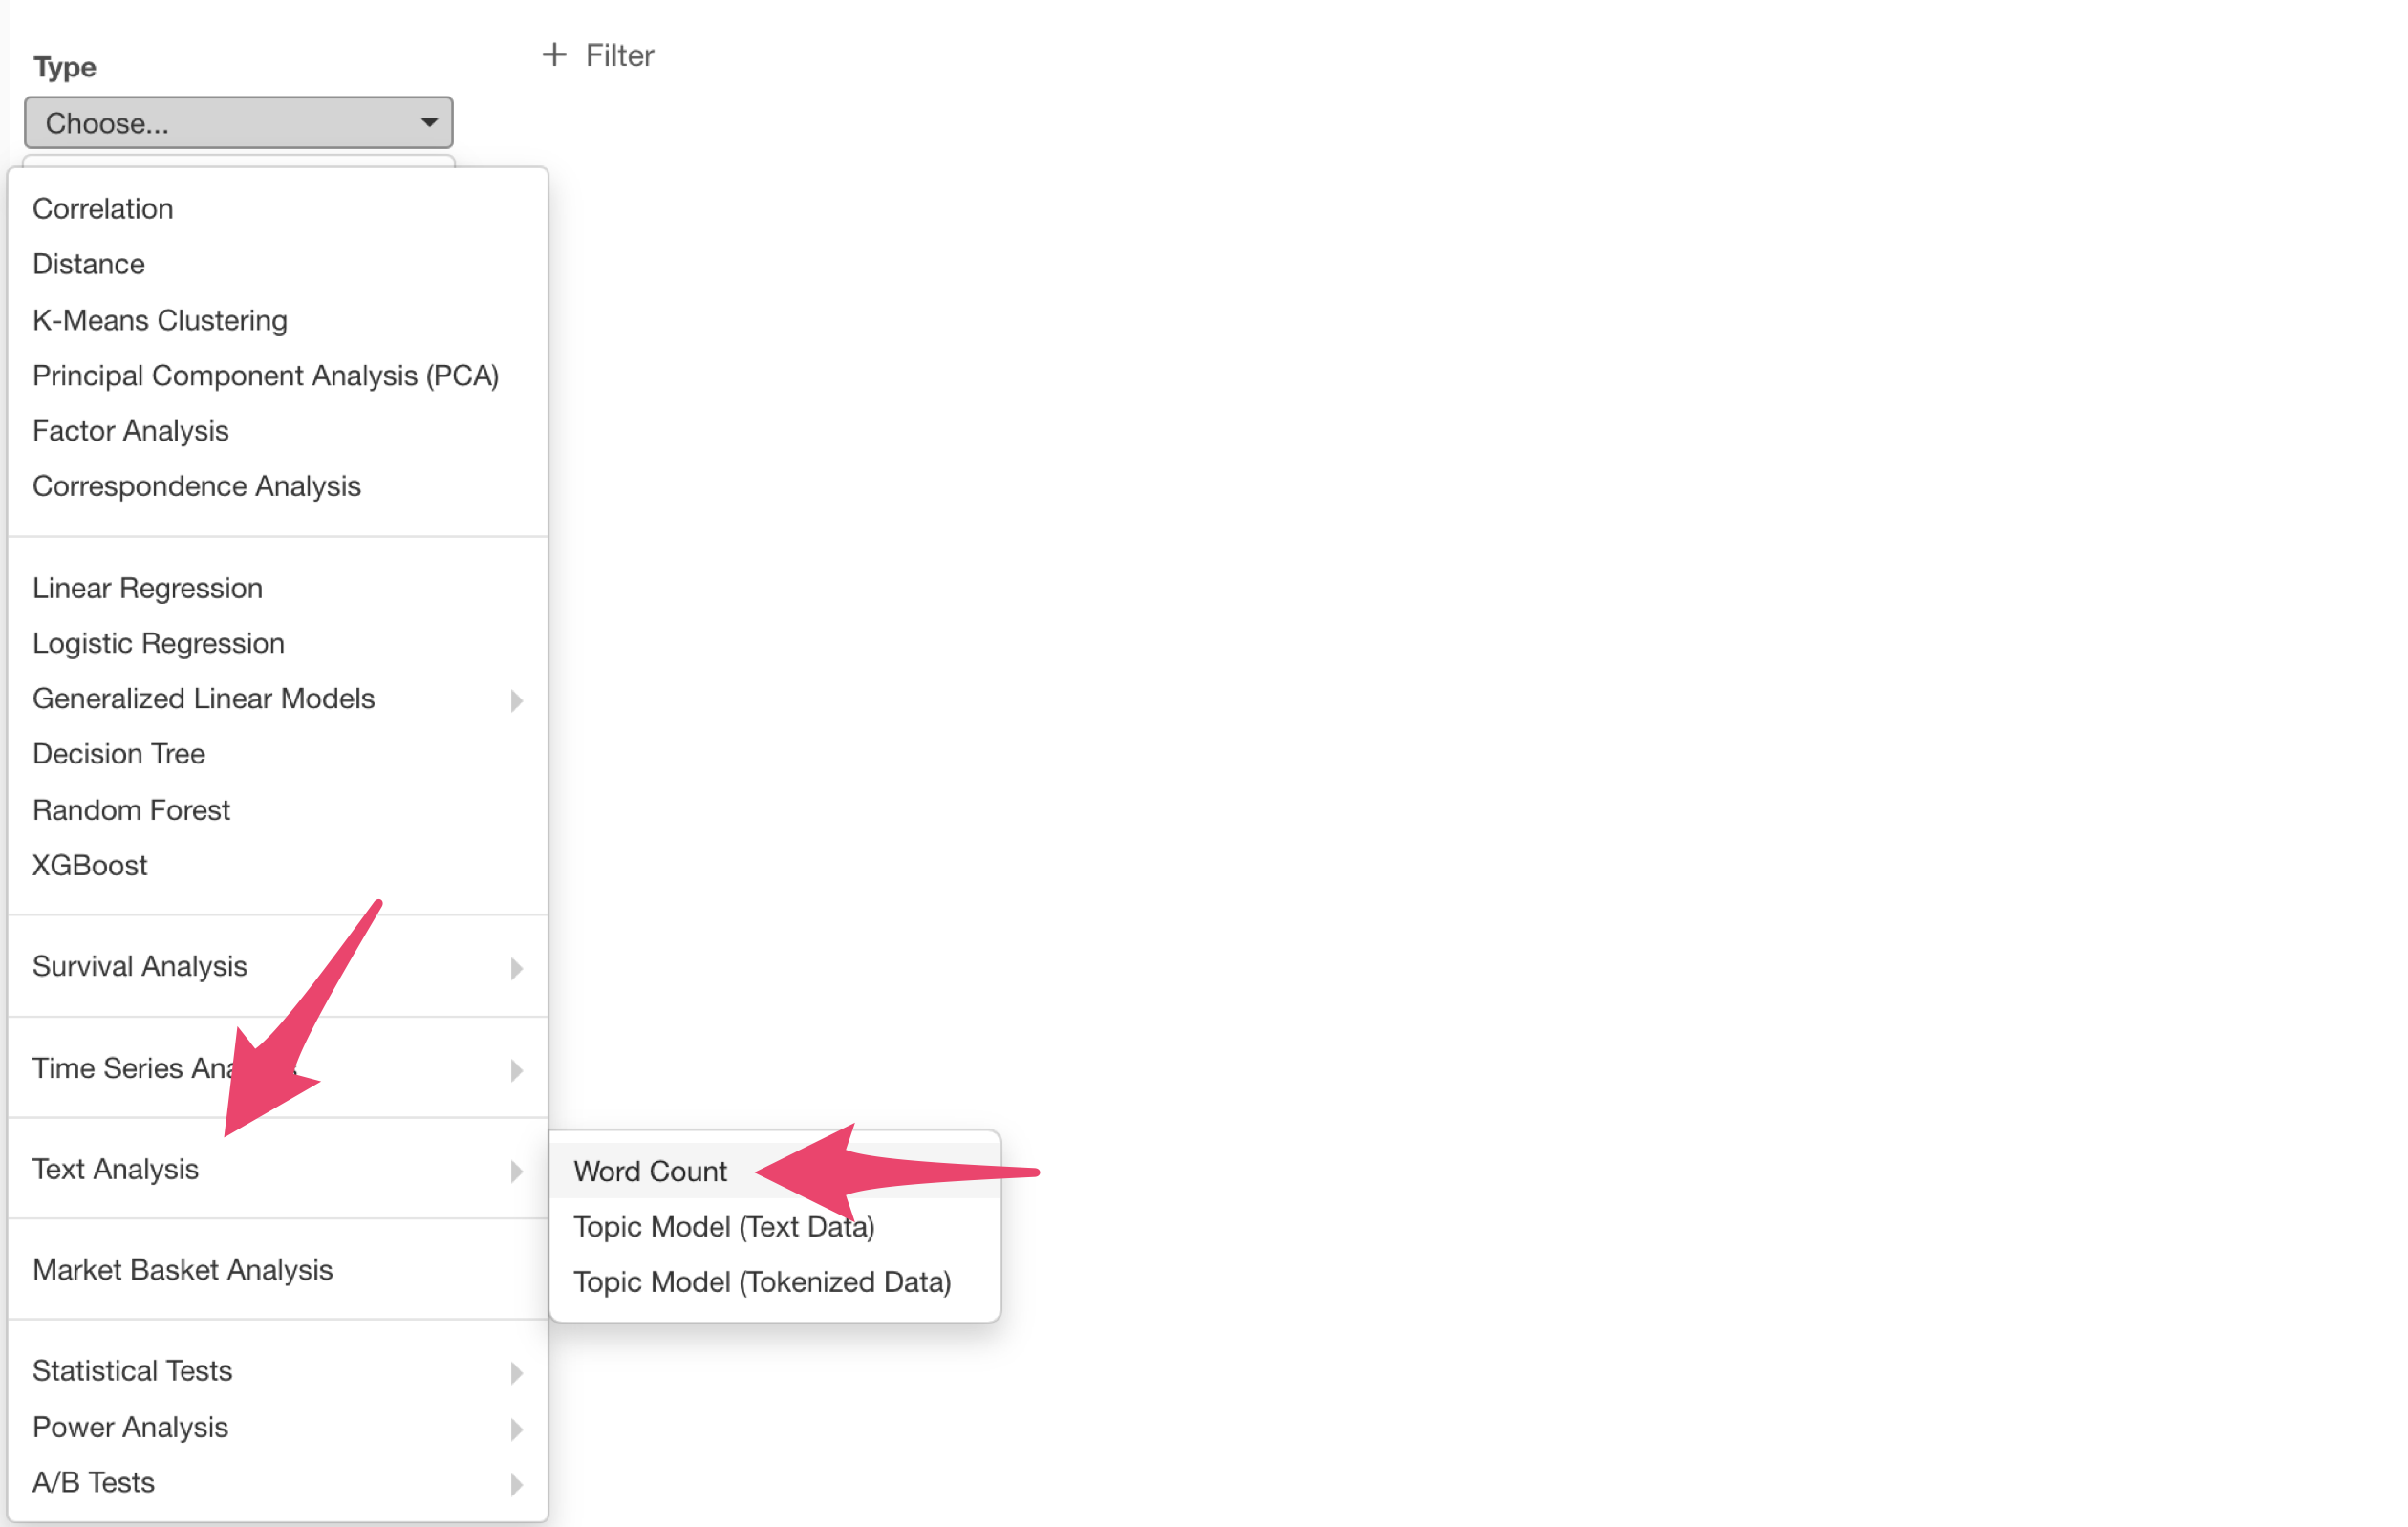
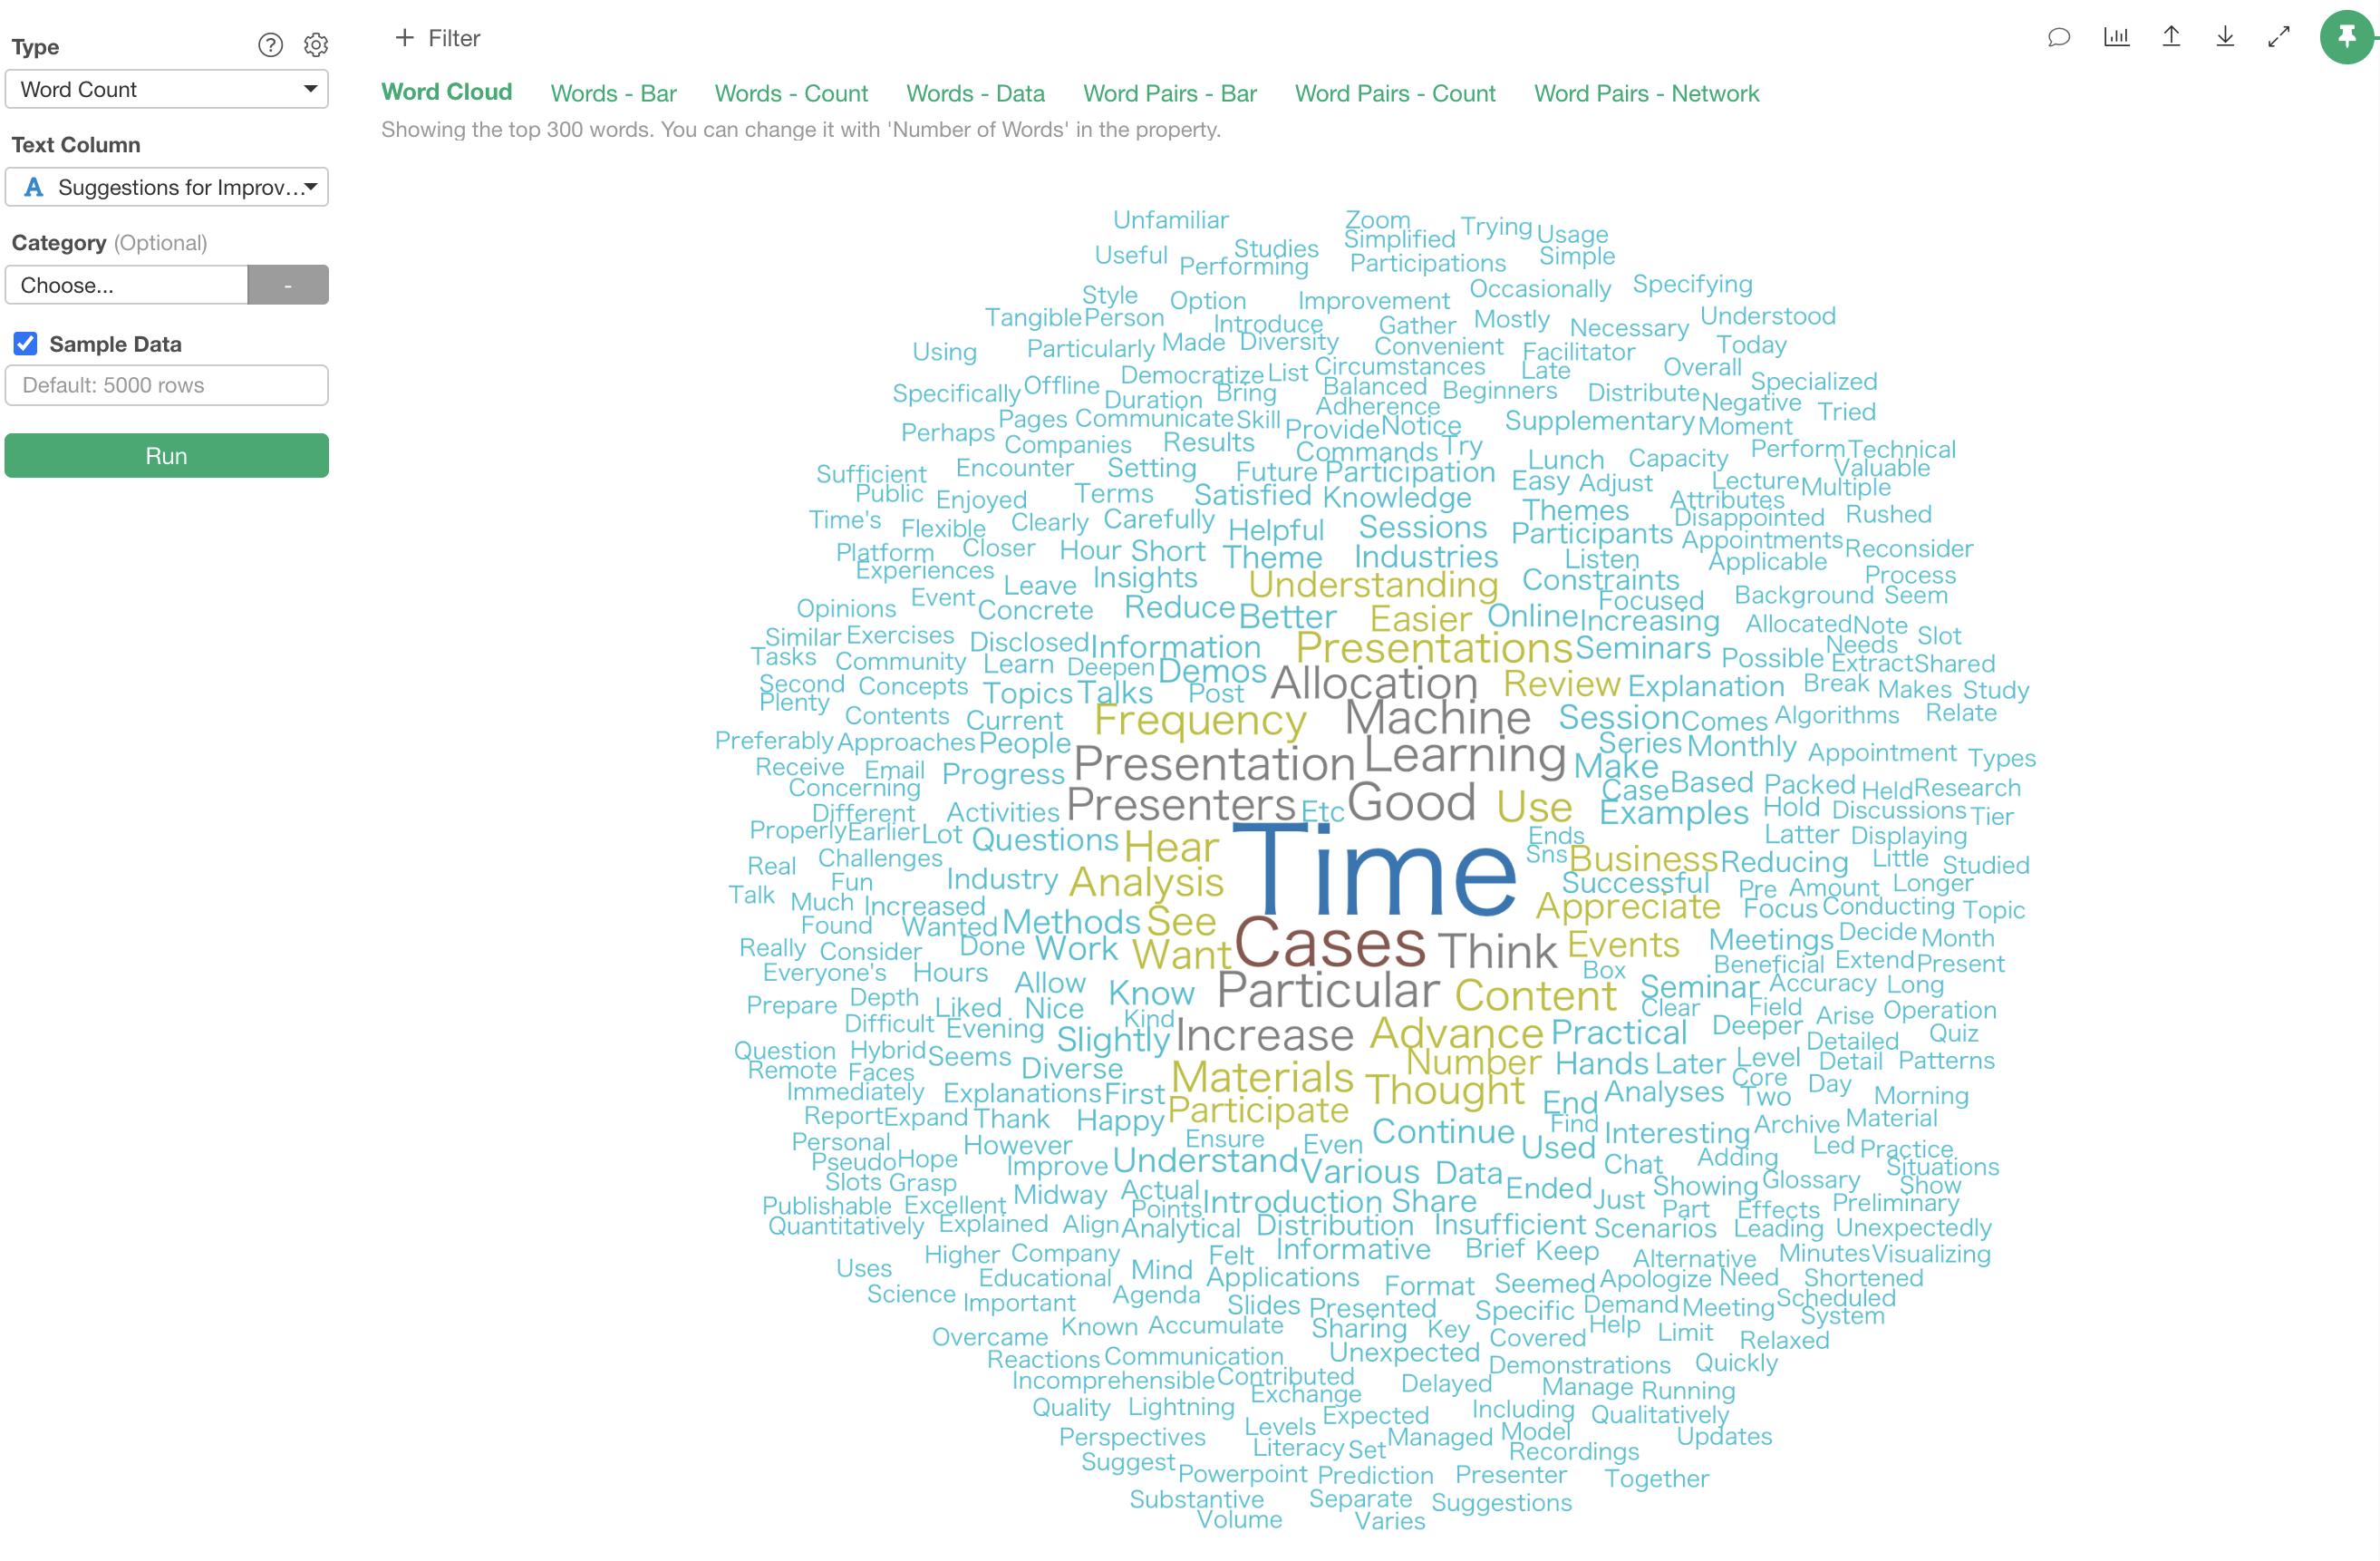
Select the Analytics view, and choose “Text Analysis” > “Word Count” as the type.
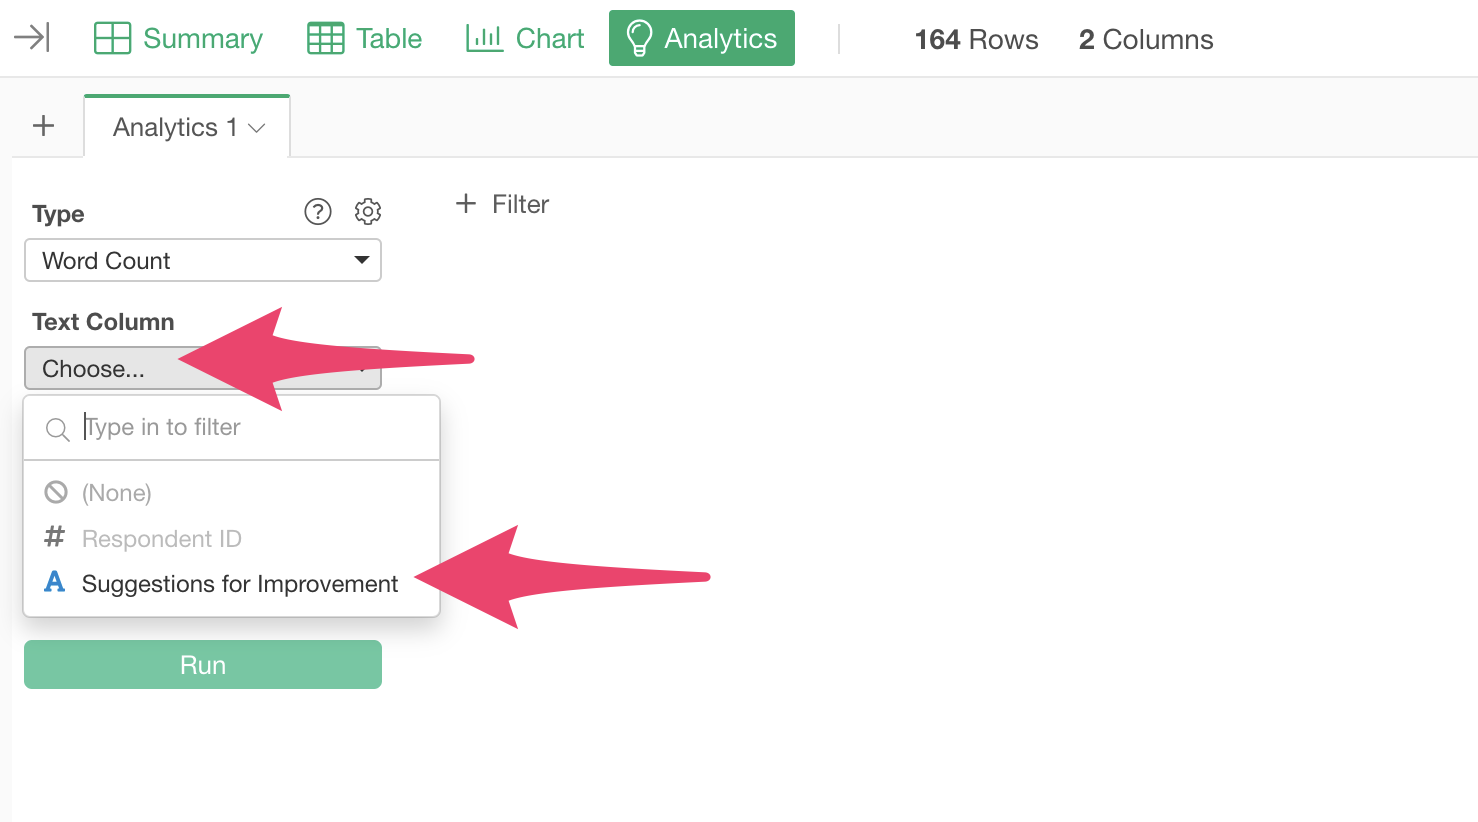
Select “Suggestions for improvement” as the Text Column.
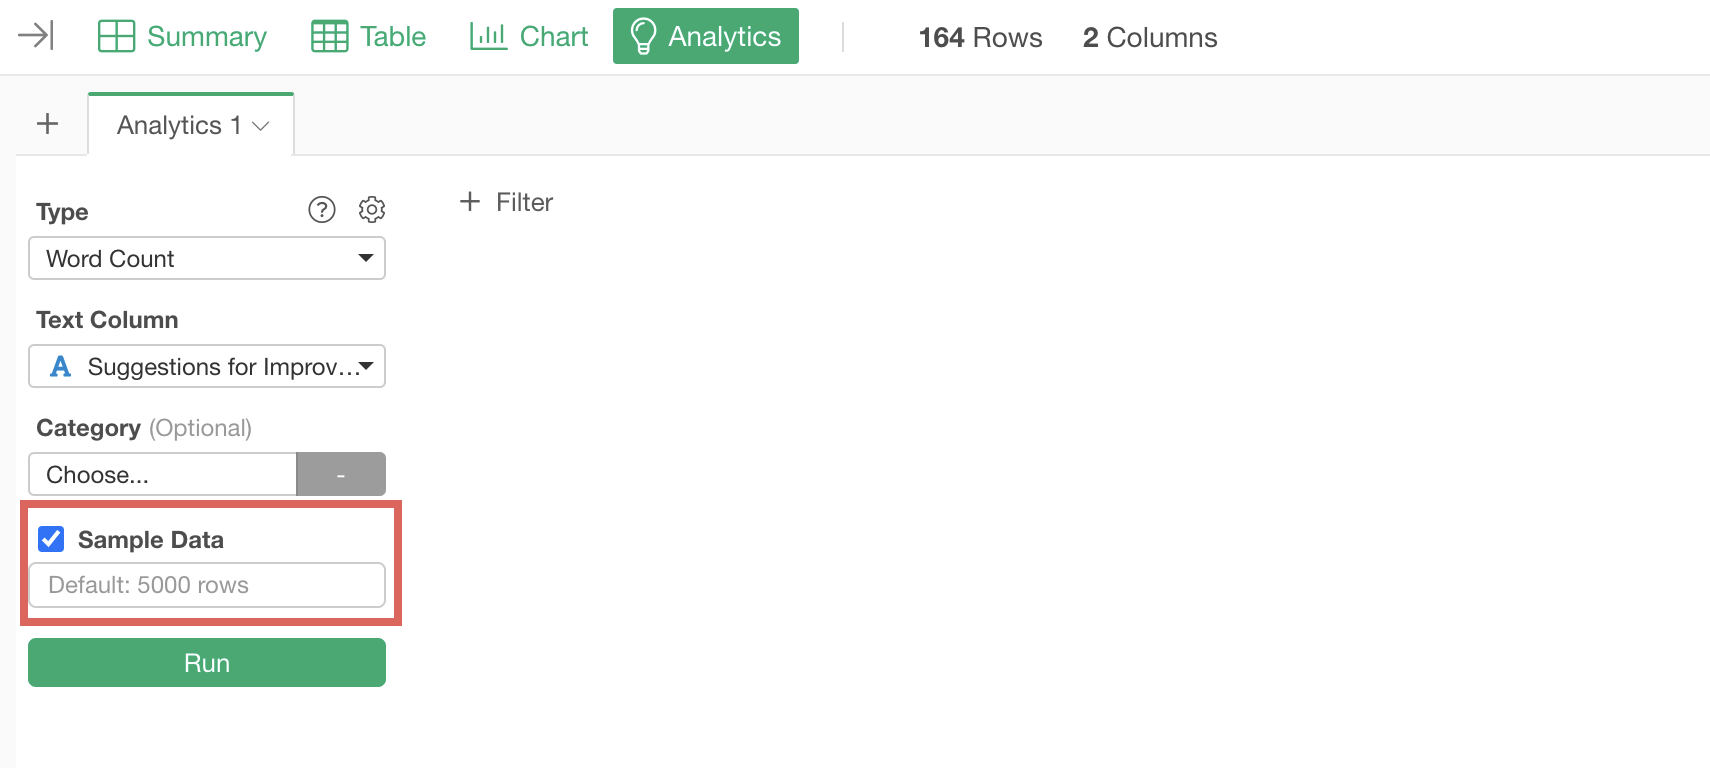
If your data has more than 5,000 rows and you want to use all the data, uncheck “Sample Data.” However, depending on the number of rows, processing may take longer, which is why data is sampled at 5,000 rows by default.
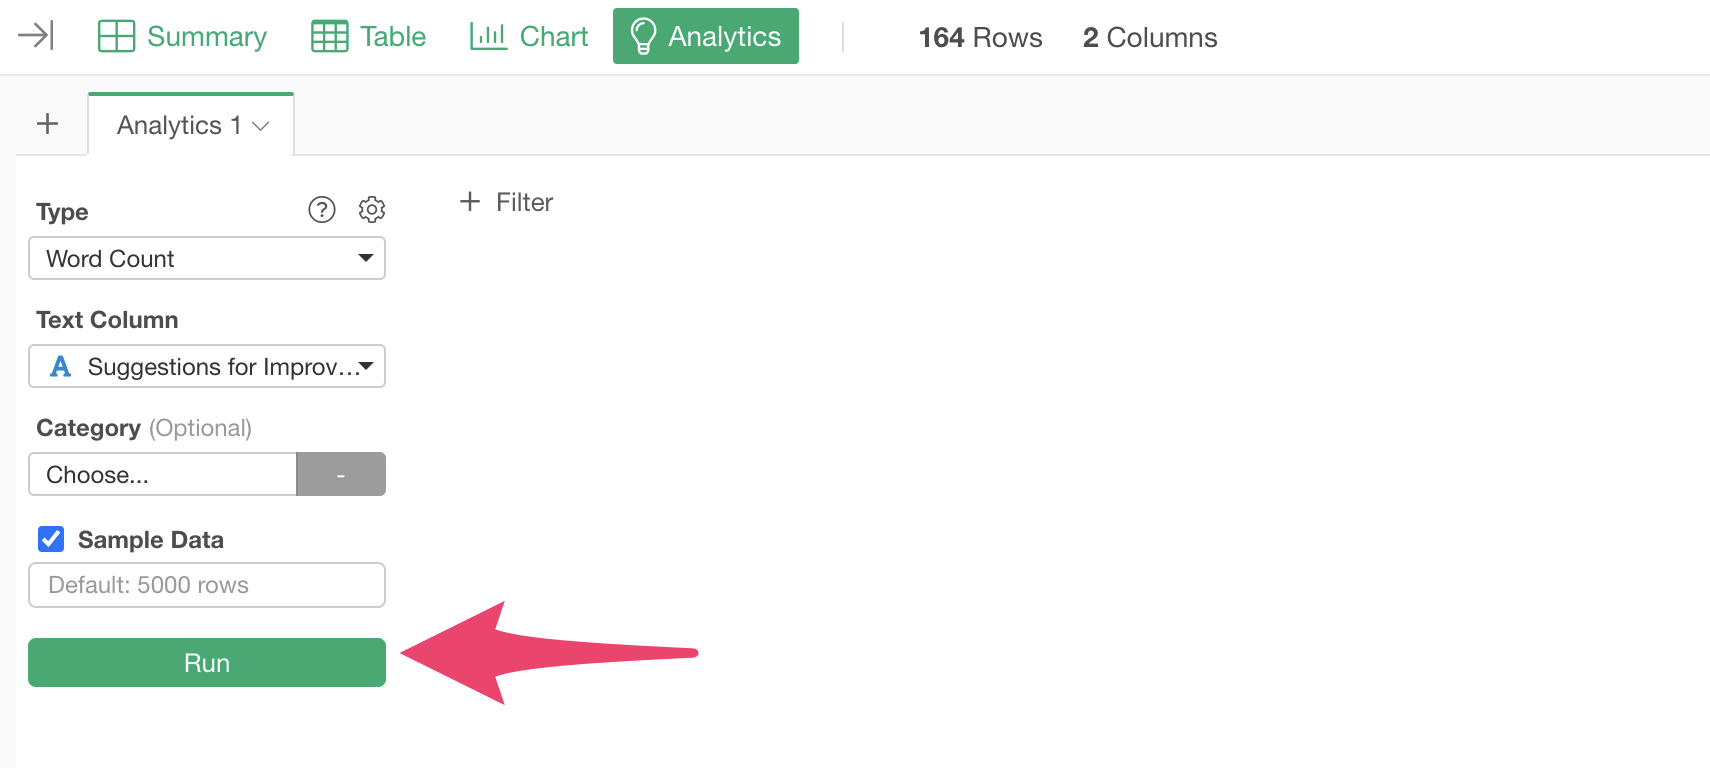
 Once
configured, click the “Run” button.
Once
configured, click the “Run” button.
The “Word Count” text analysis has been executed.

4. Interpreting the Results
The “Word Count” text analysis has two main tabs: one related to “word frequency” and another related to “relationships between co-occurring words.”
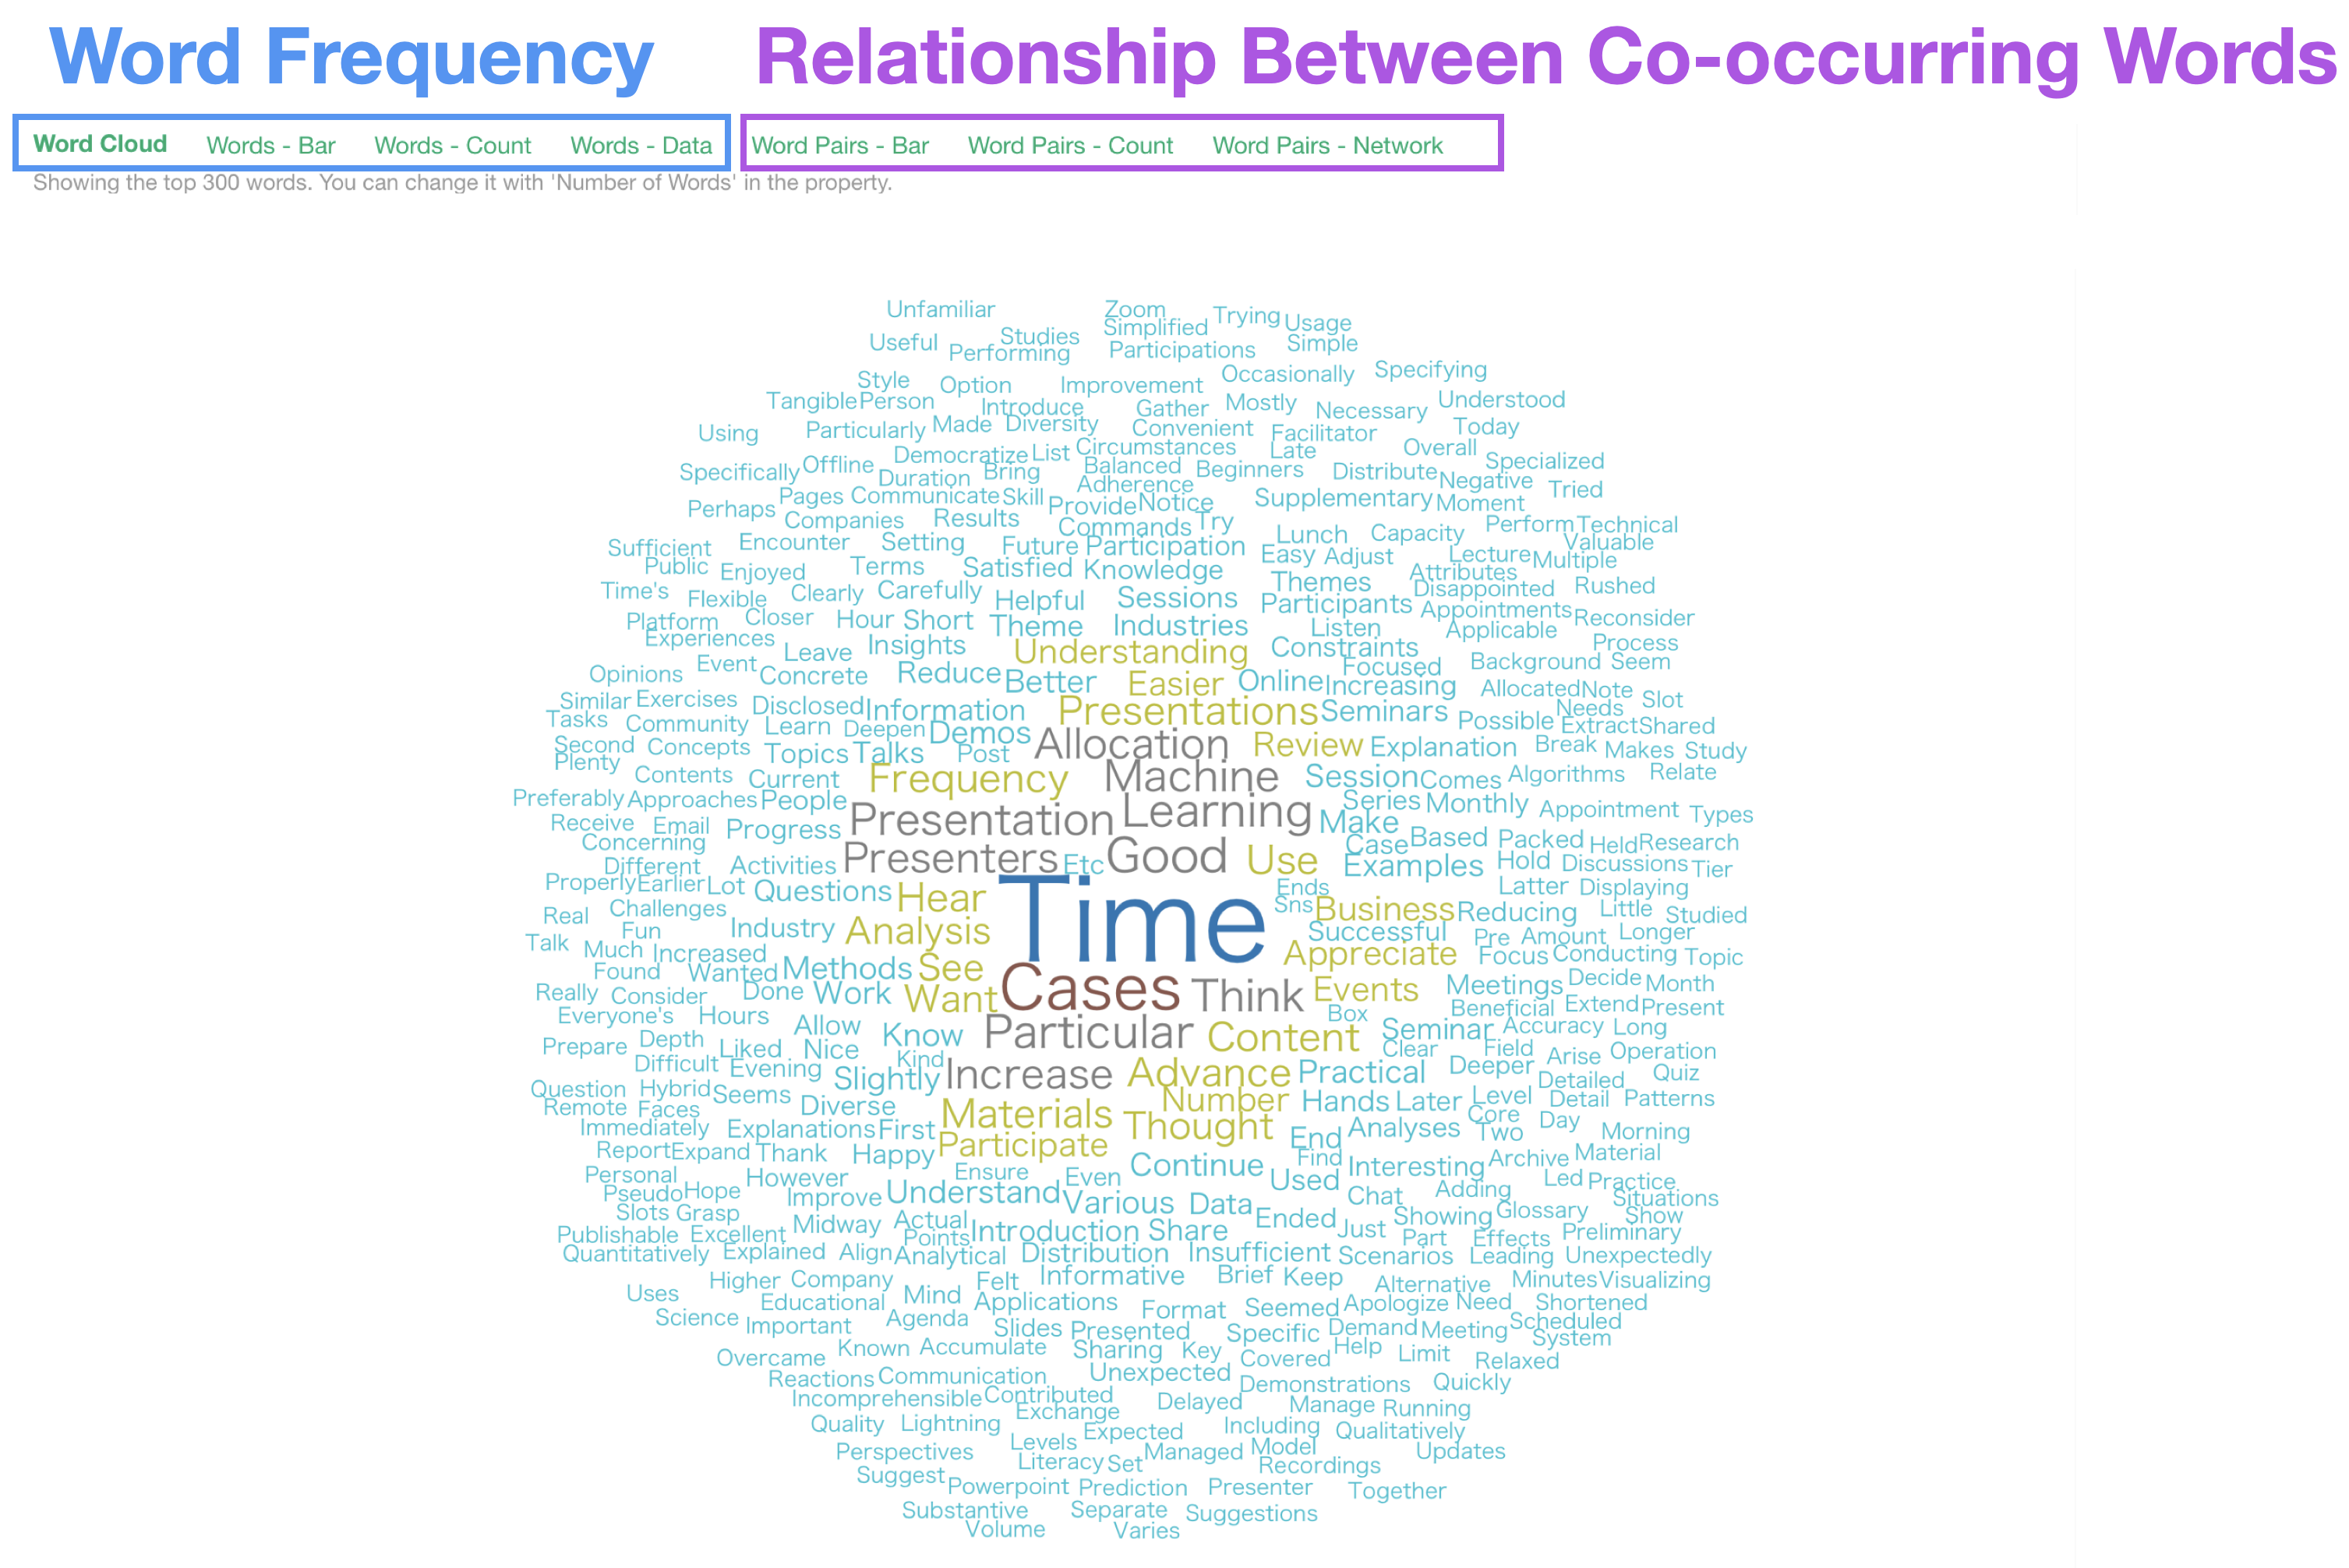
Word Cloud
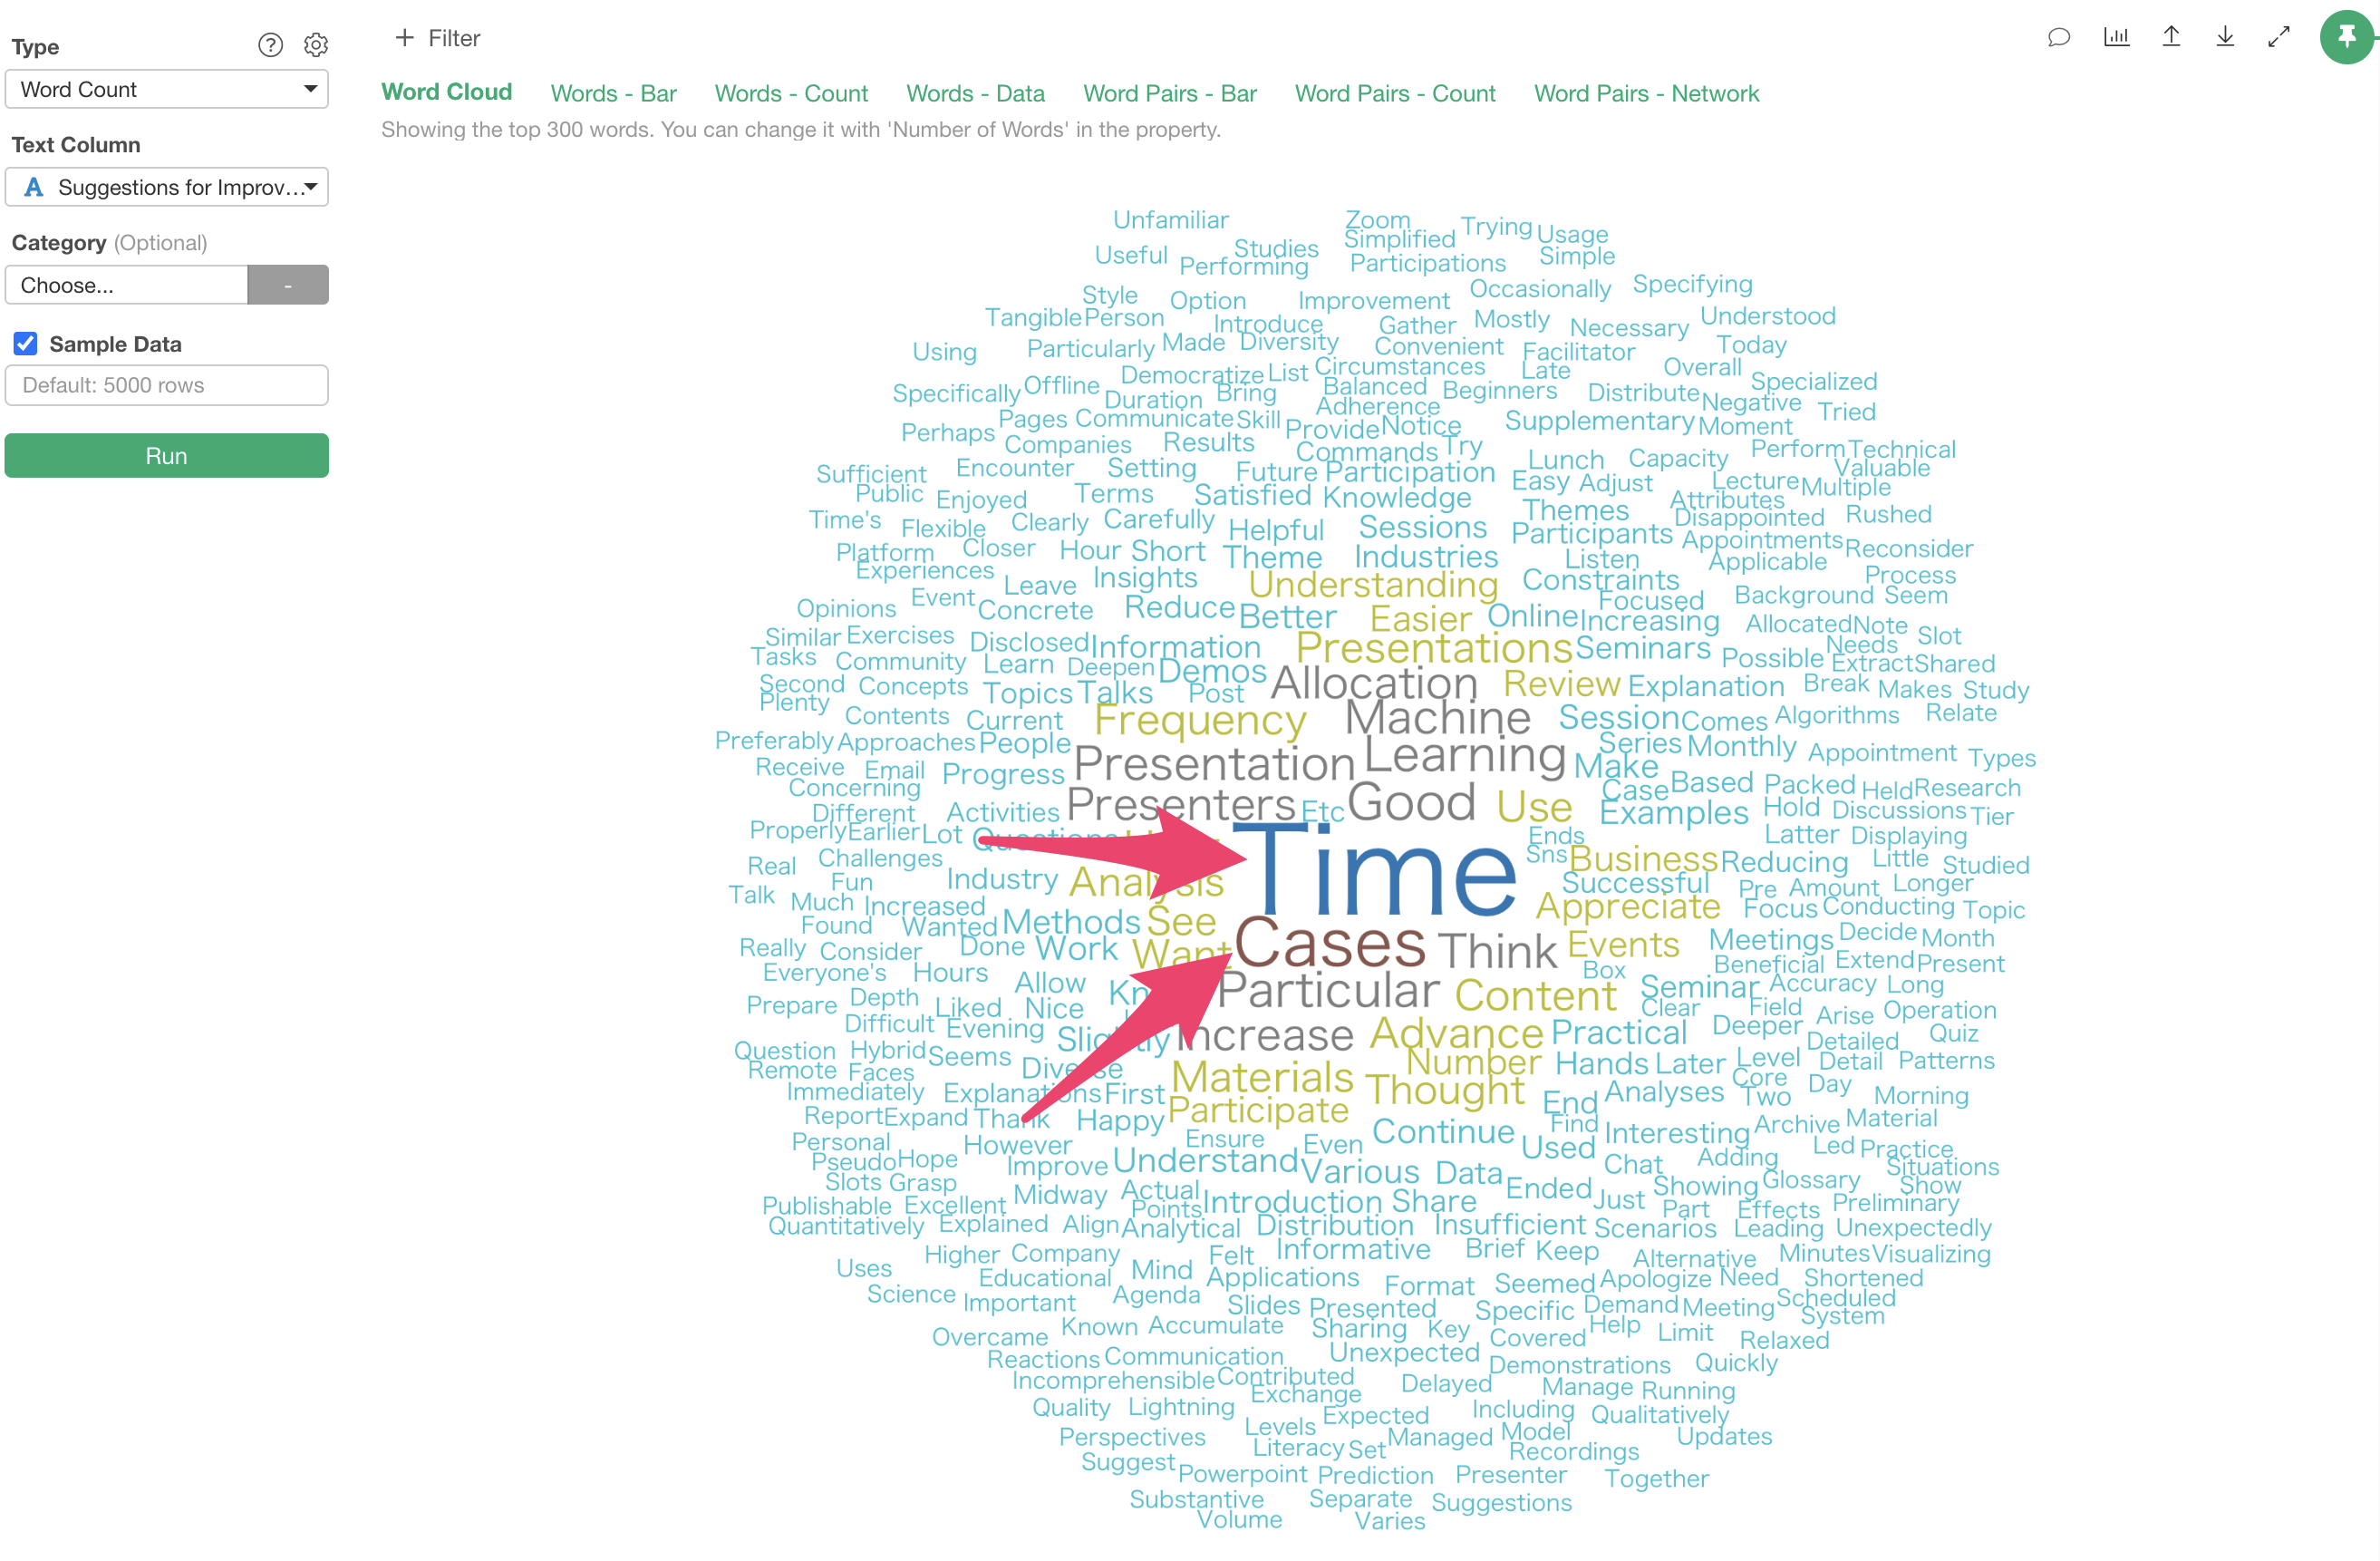
In the “Word Cloud” tab, the “size” and “color” of each word are determined by its frequency of occurrence.
In this case, we can see that words like “Time,” “Cases” are frequently used.
Words - Bar
While word clouds are visually interesting, they don’t show how many times each word appears or which words are most frequent.
The “Words - Bar” tab visualizes the frequency of each word as a bar chart, making it easier to compare which words appear more or less frequently.
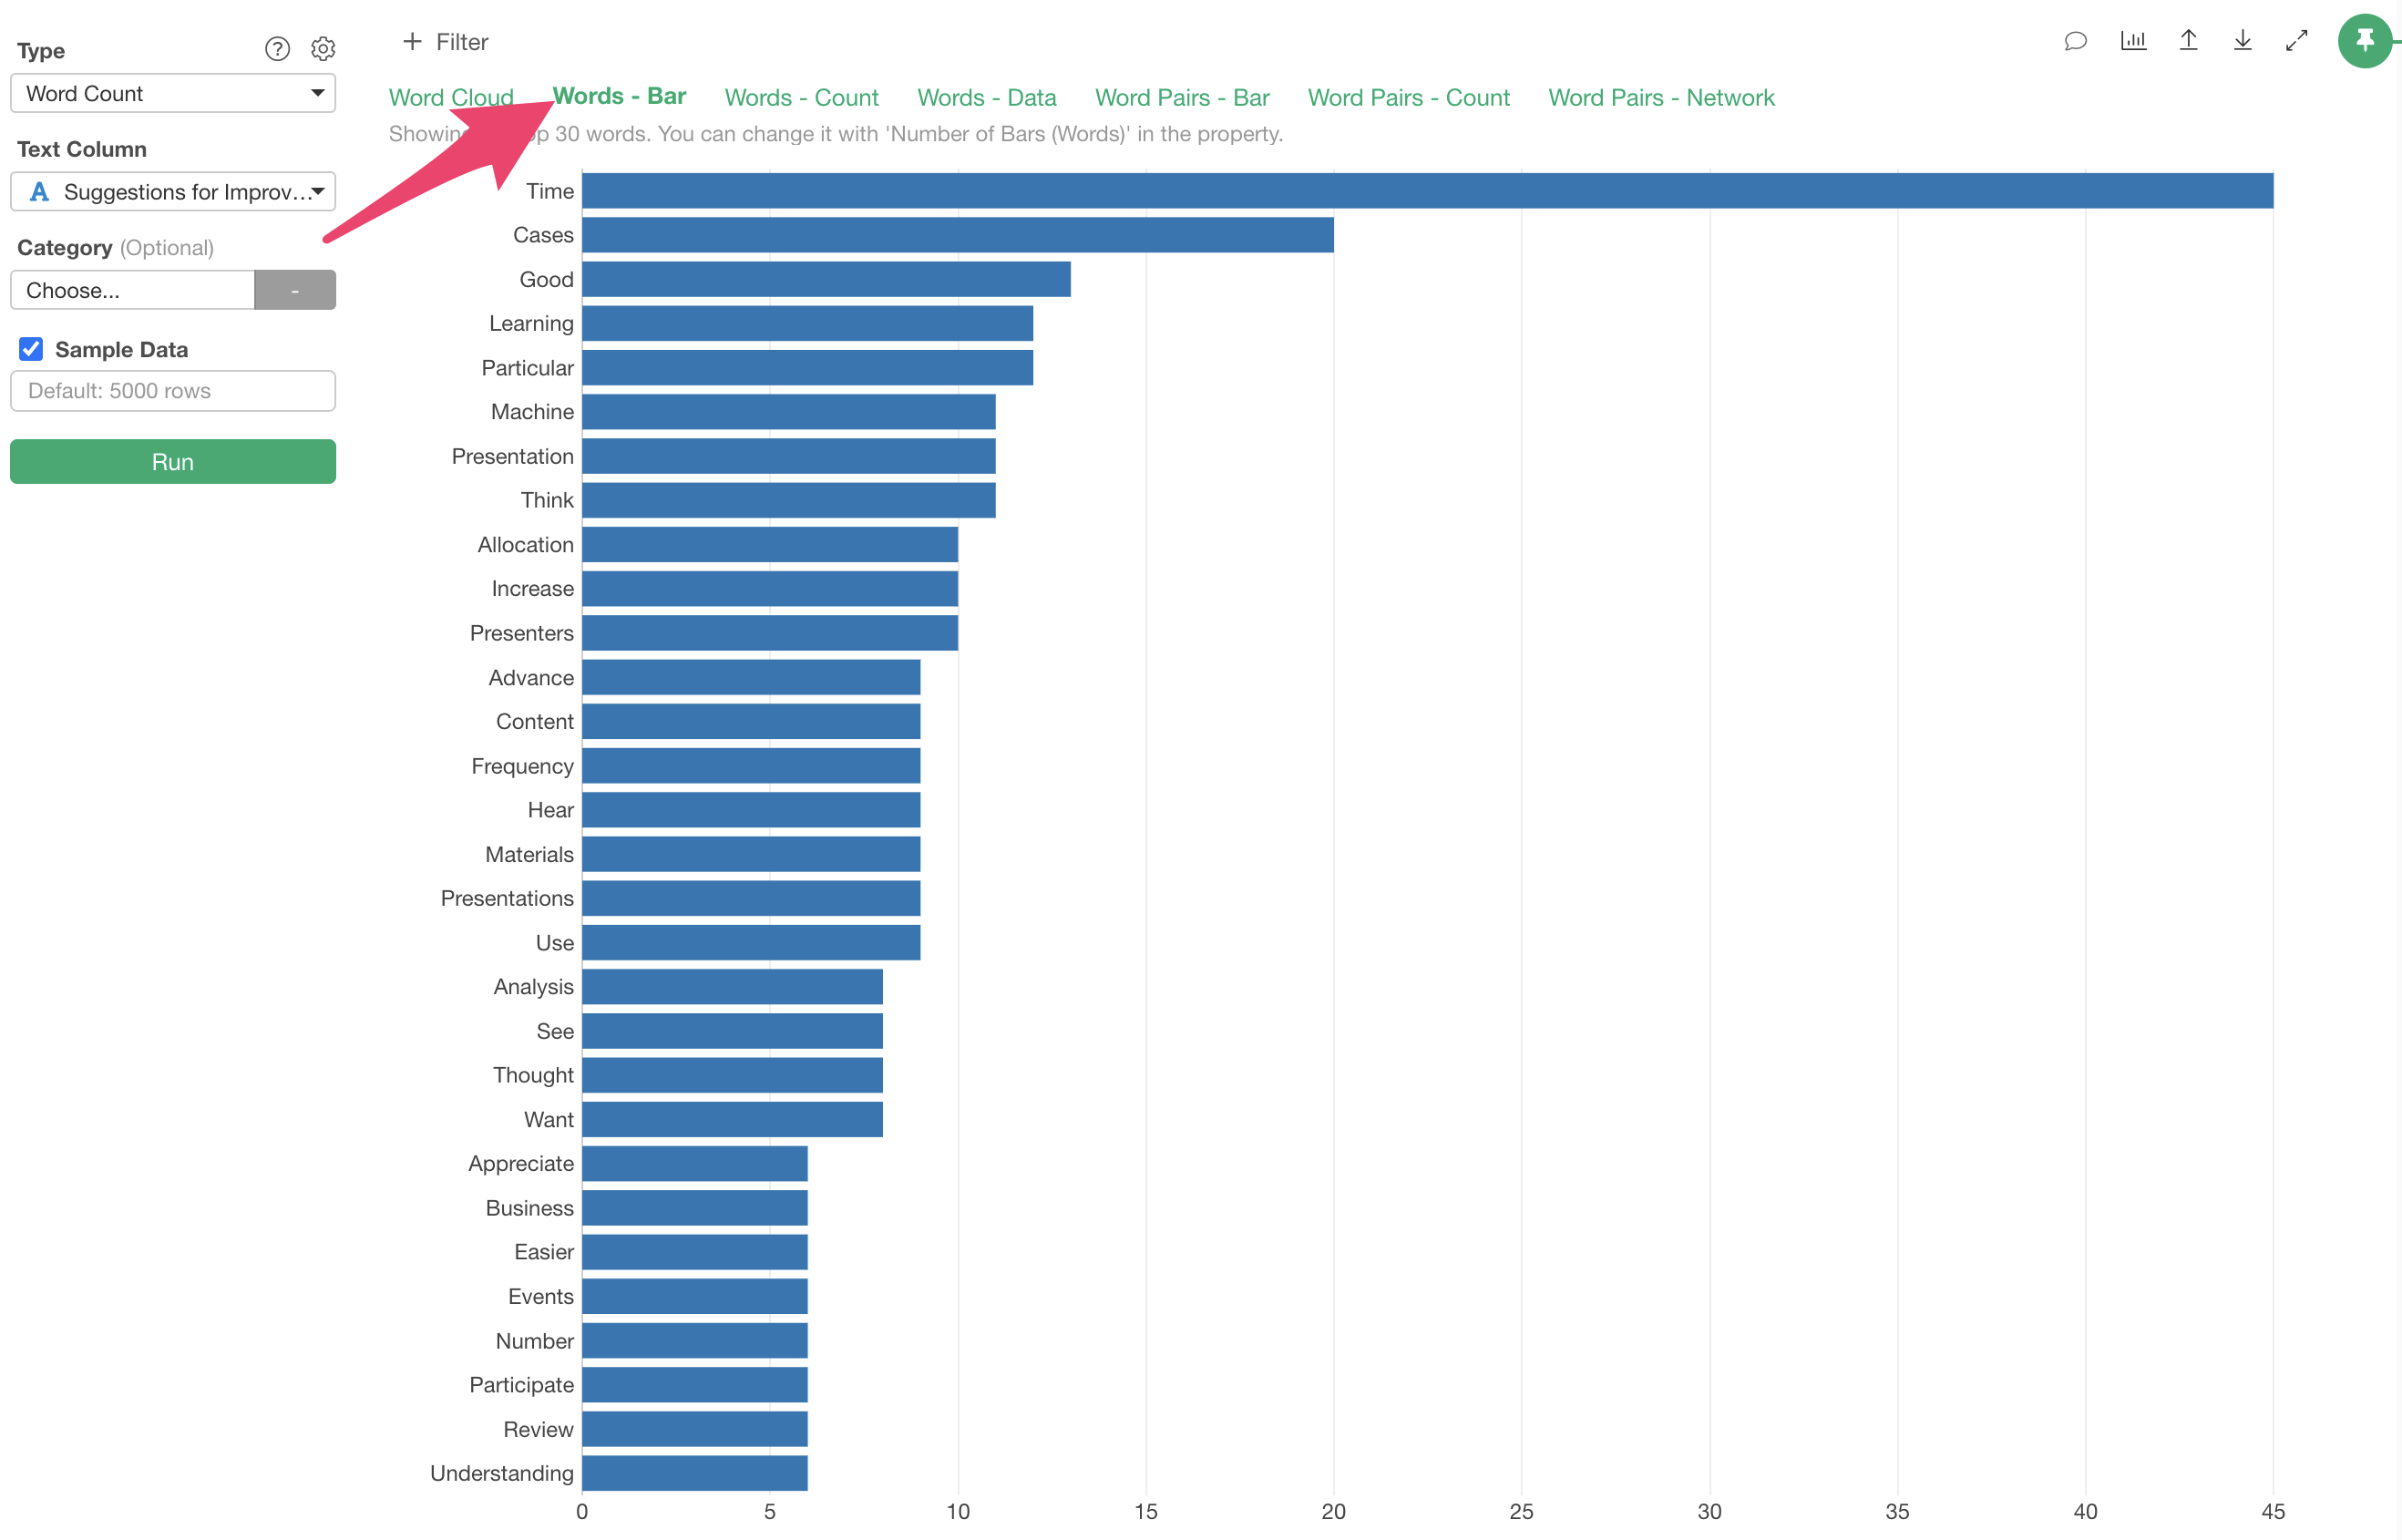
In this case, we can confirm that words like “Time,” and “Cases” are
frequently used, with “Time” appearing about 45 times.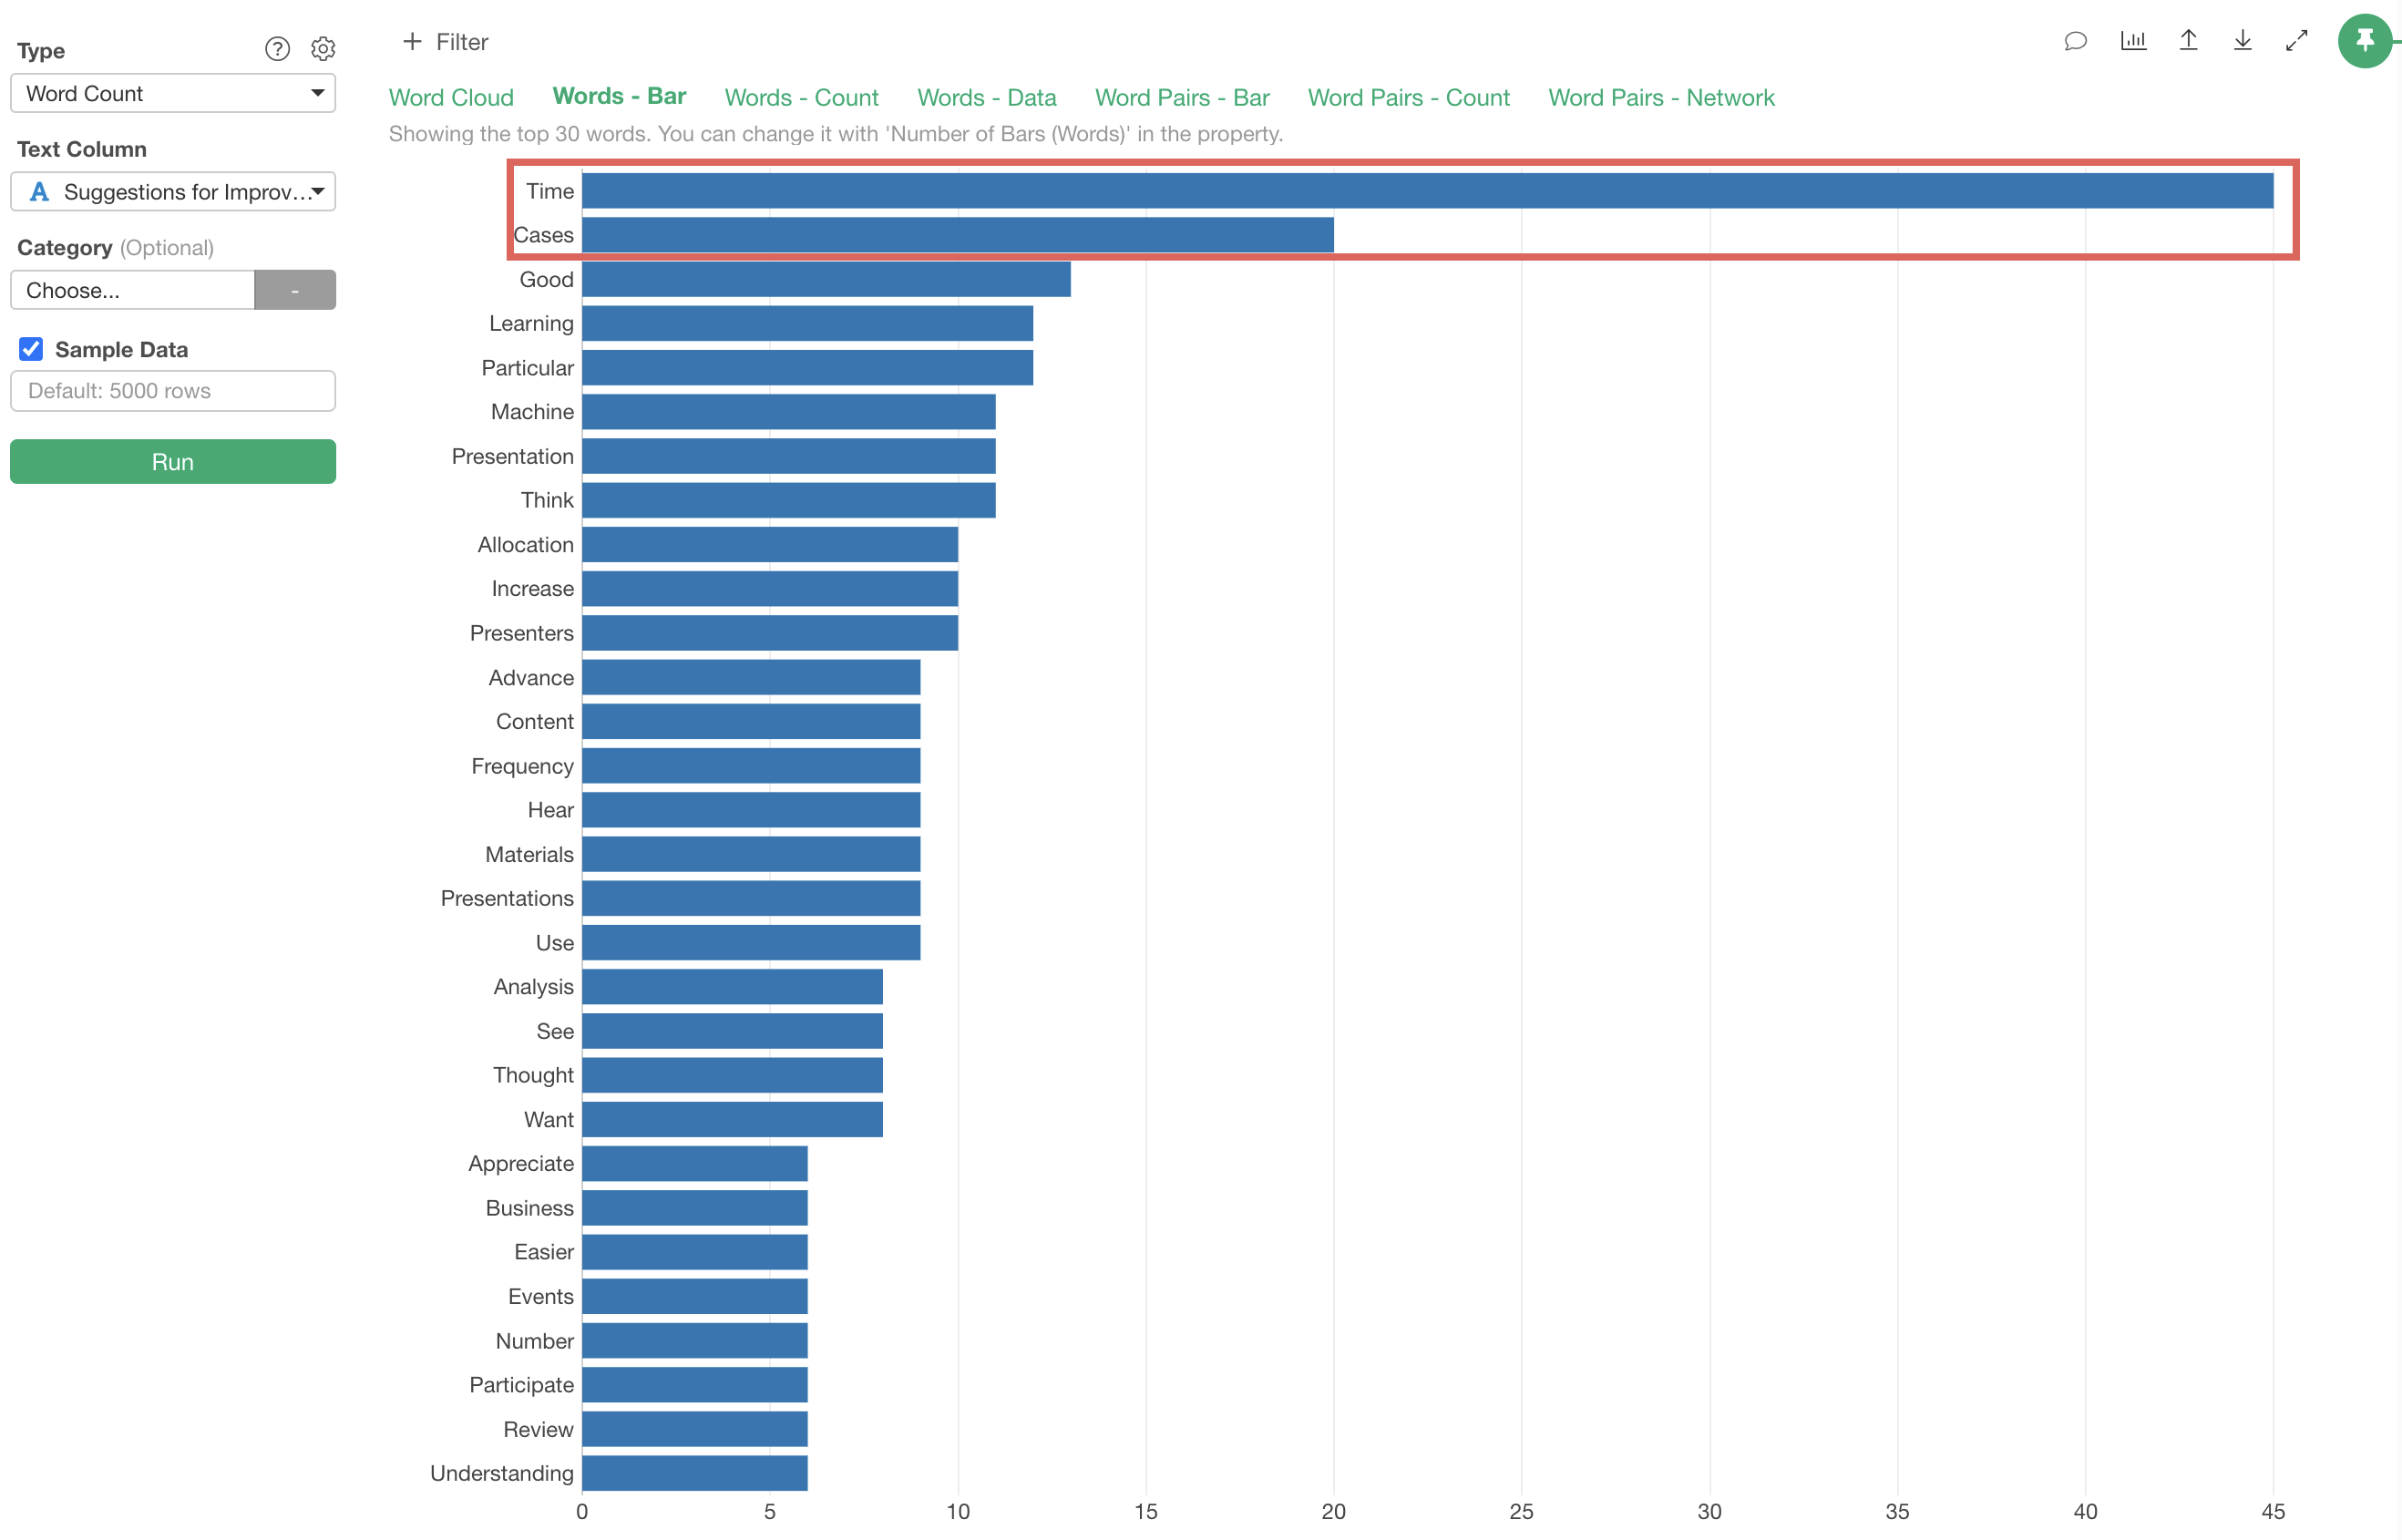
Word Pairs - Bar
The “Word Pairs - Bar” tab visualizes the frequency of co-occurring word combinations as a bar chart.
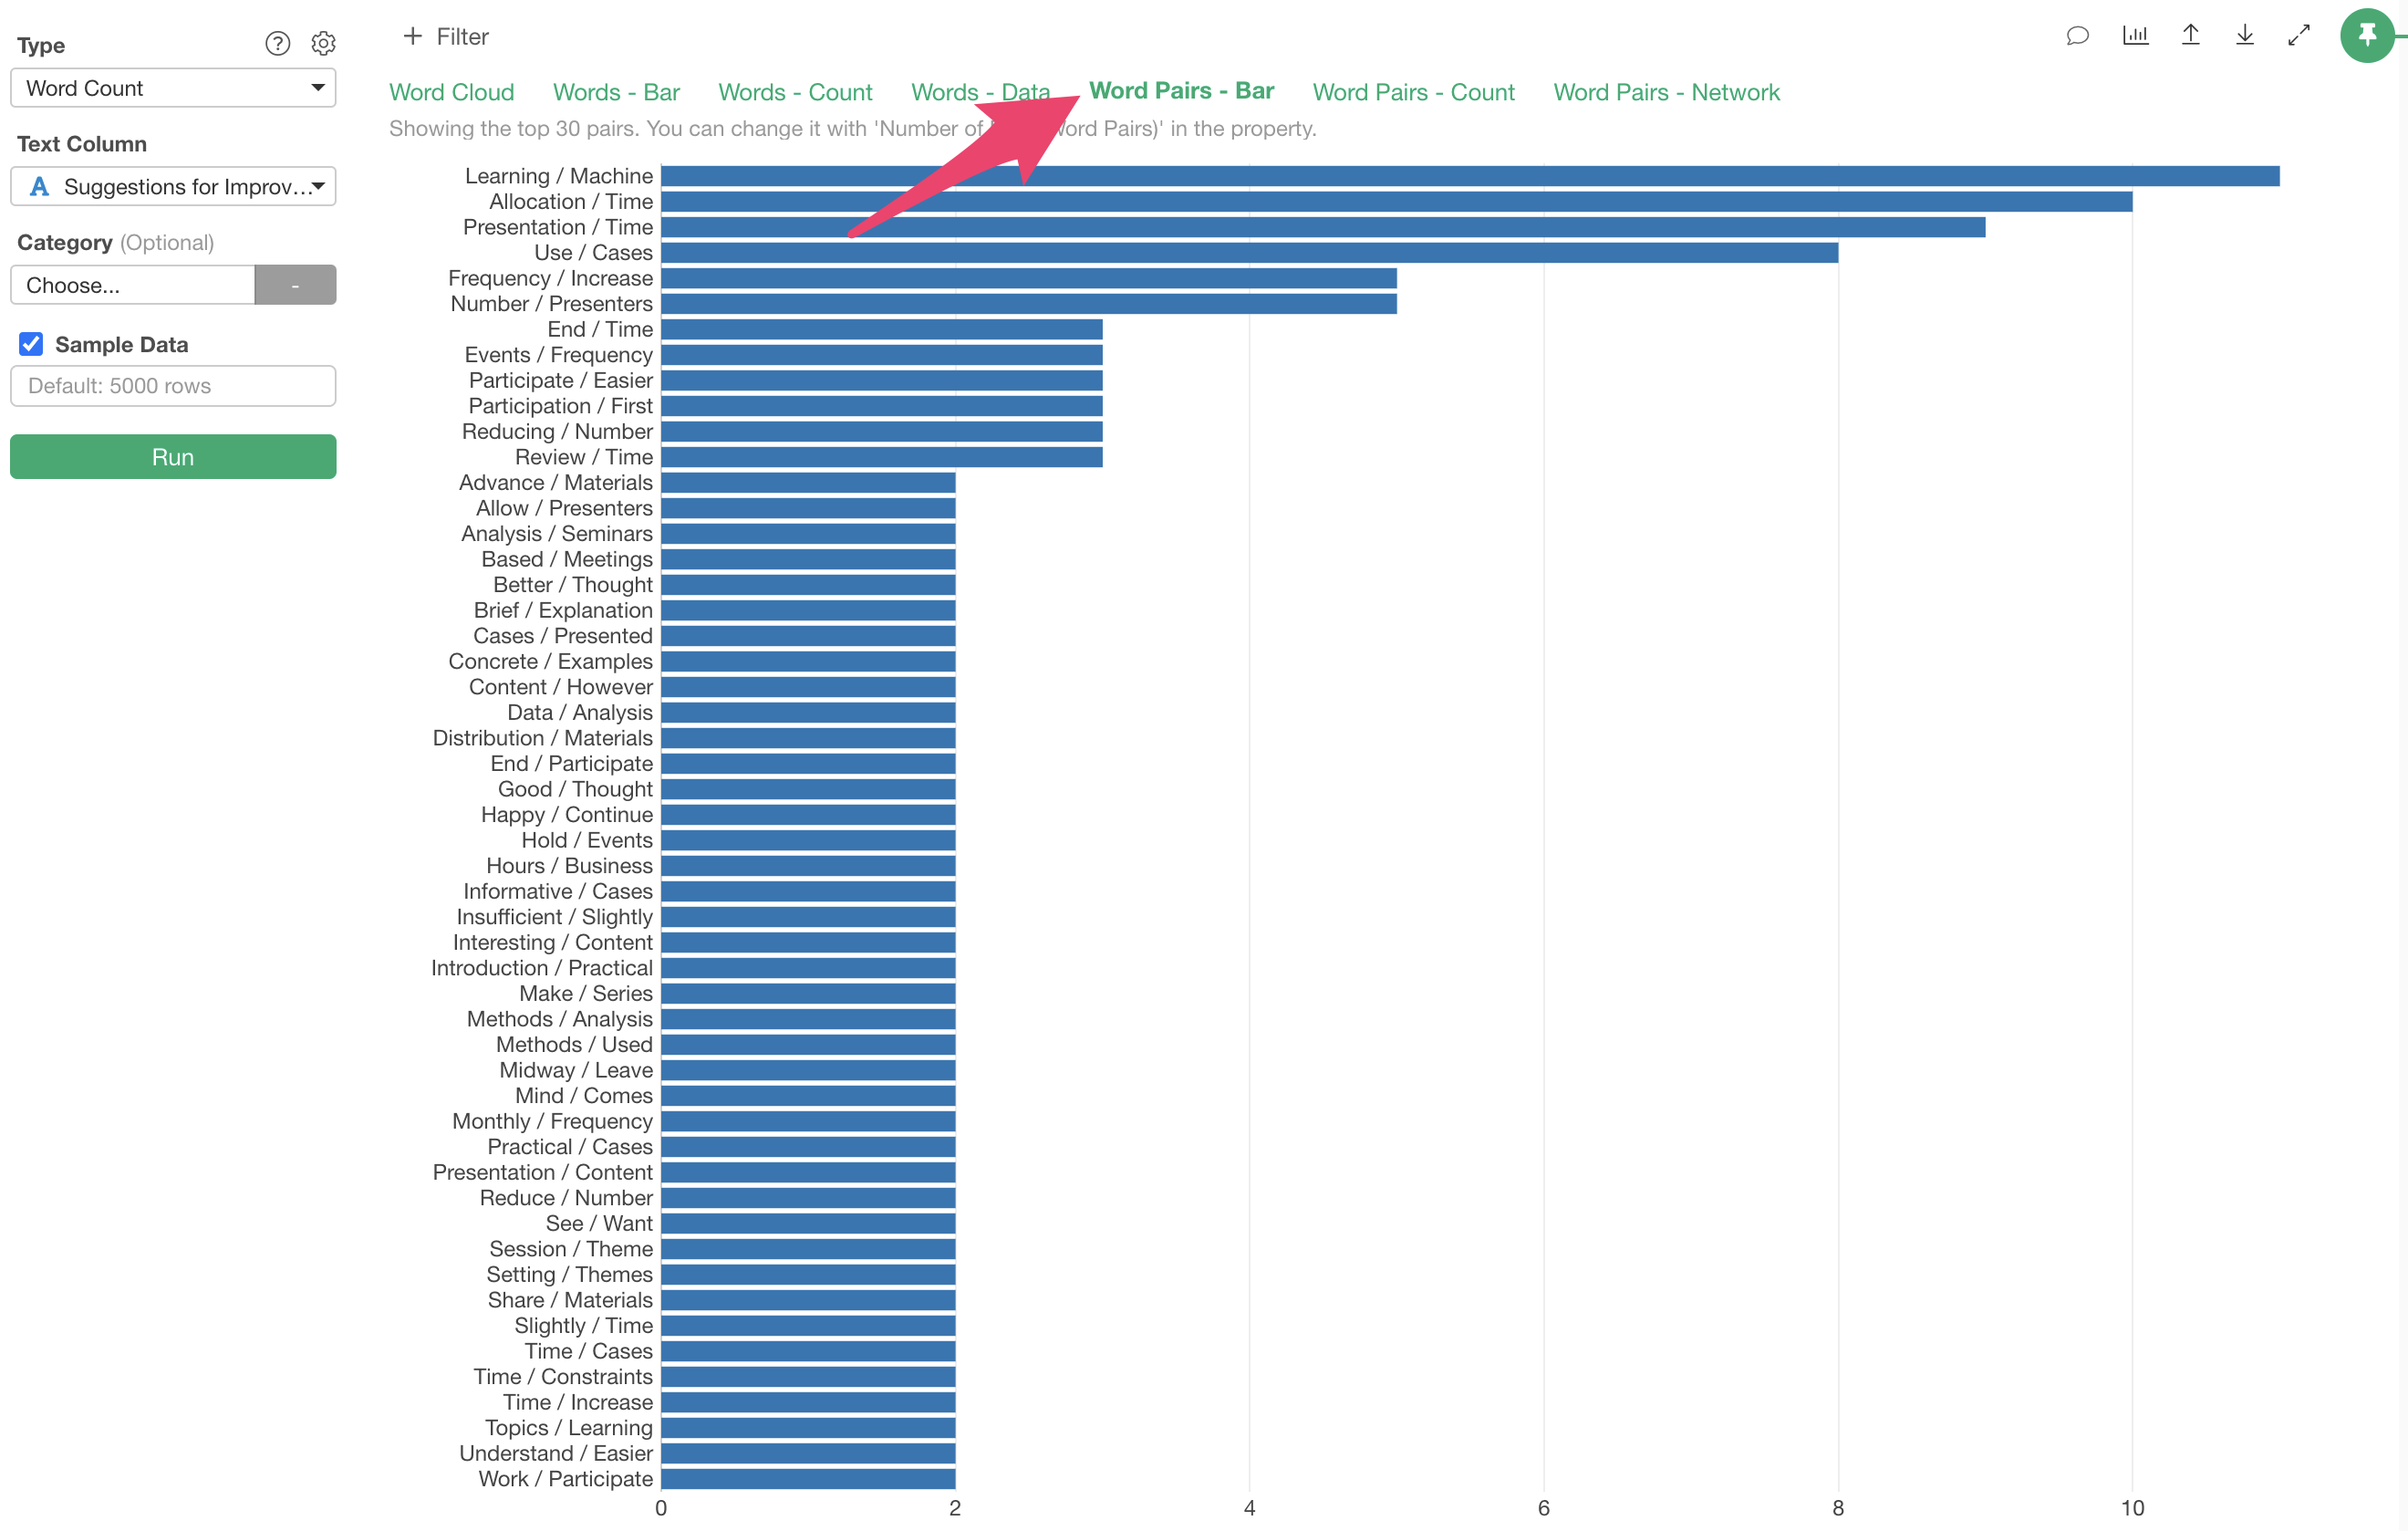
In this case, we can see that word pairs like “Learning/Machine,” “Allocation/Time,” and “Time/Presentation” frequently appear together.
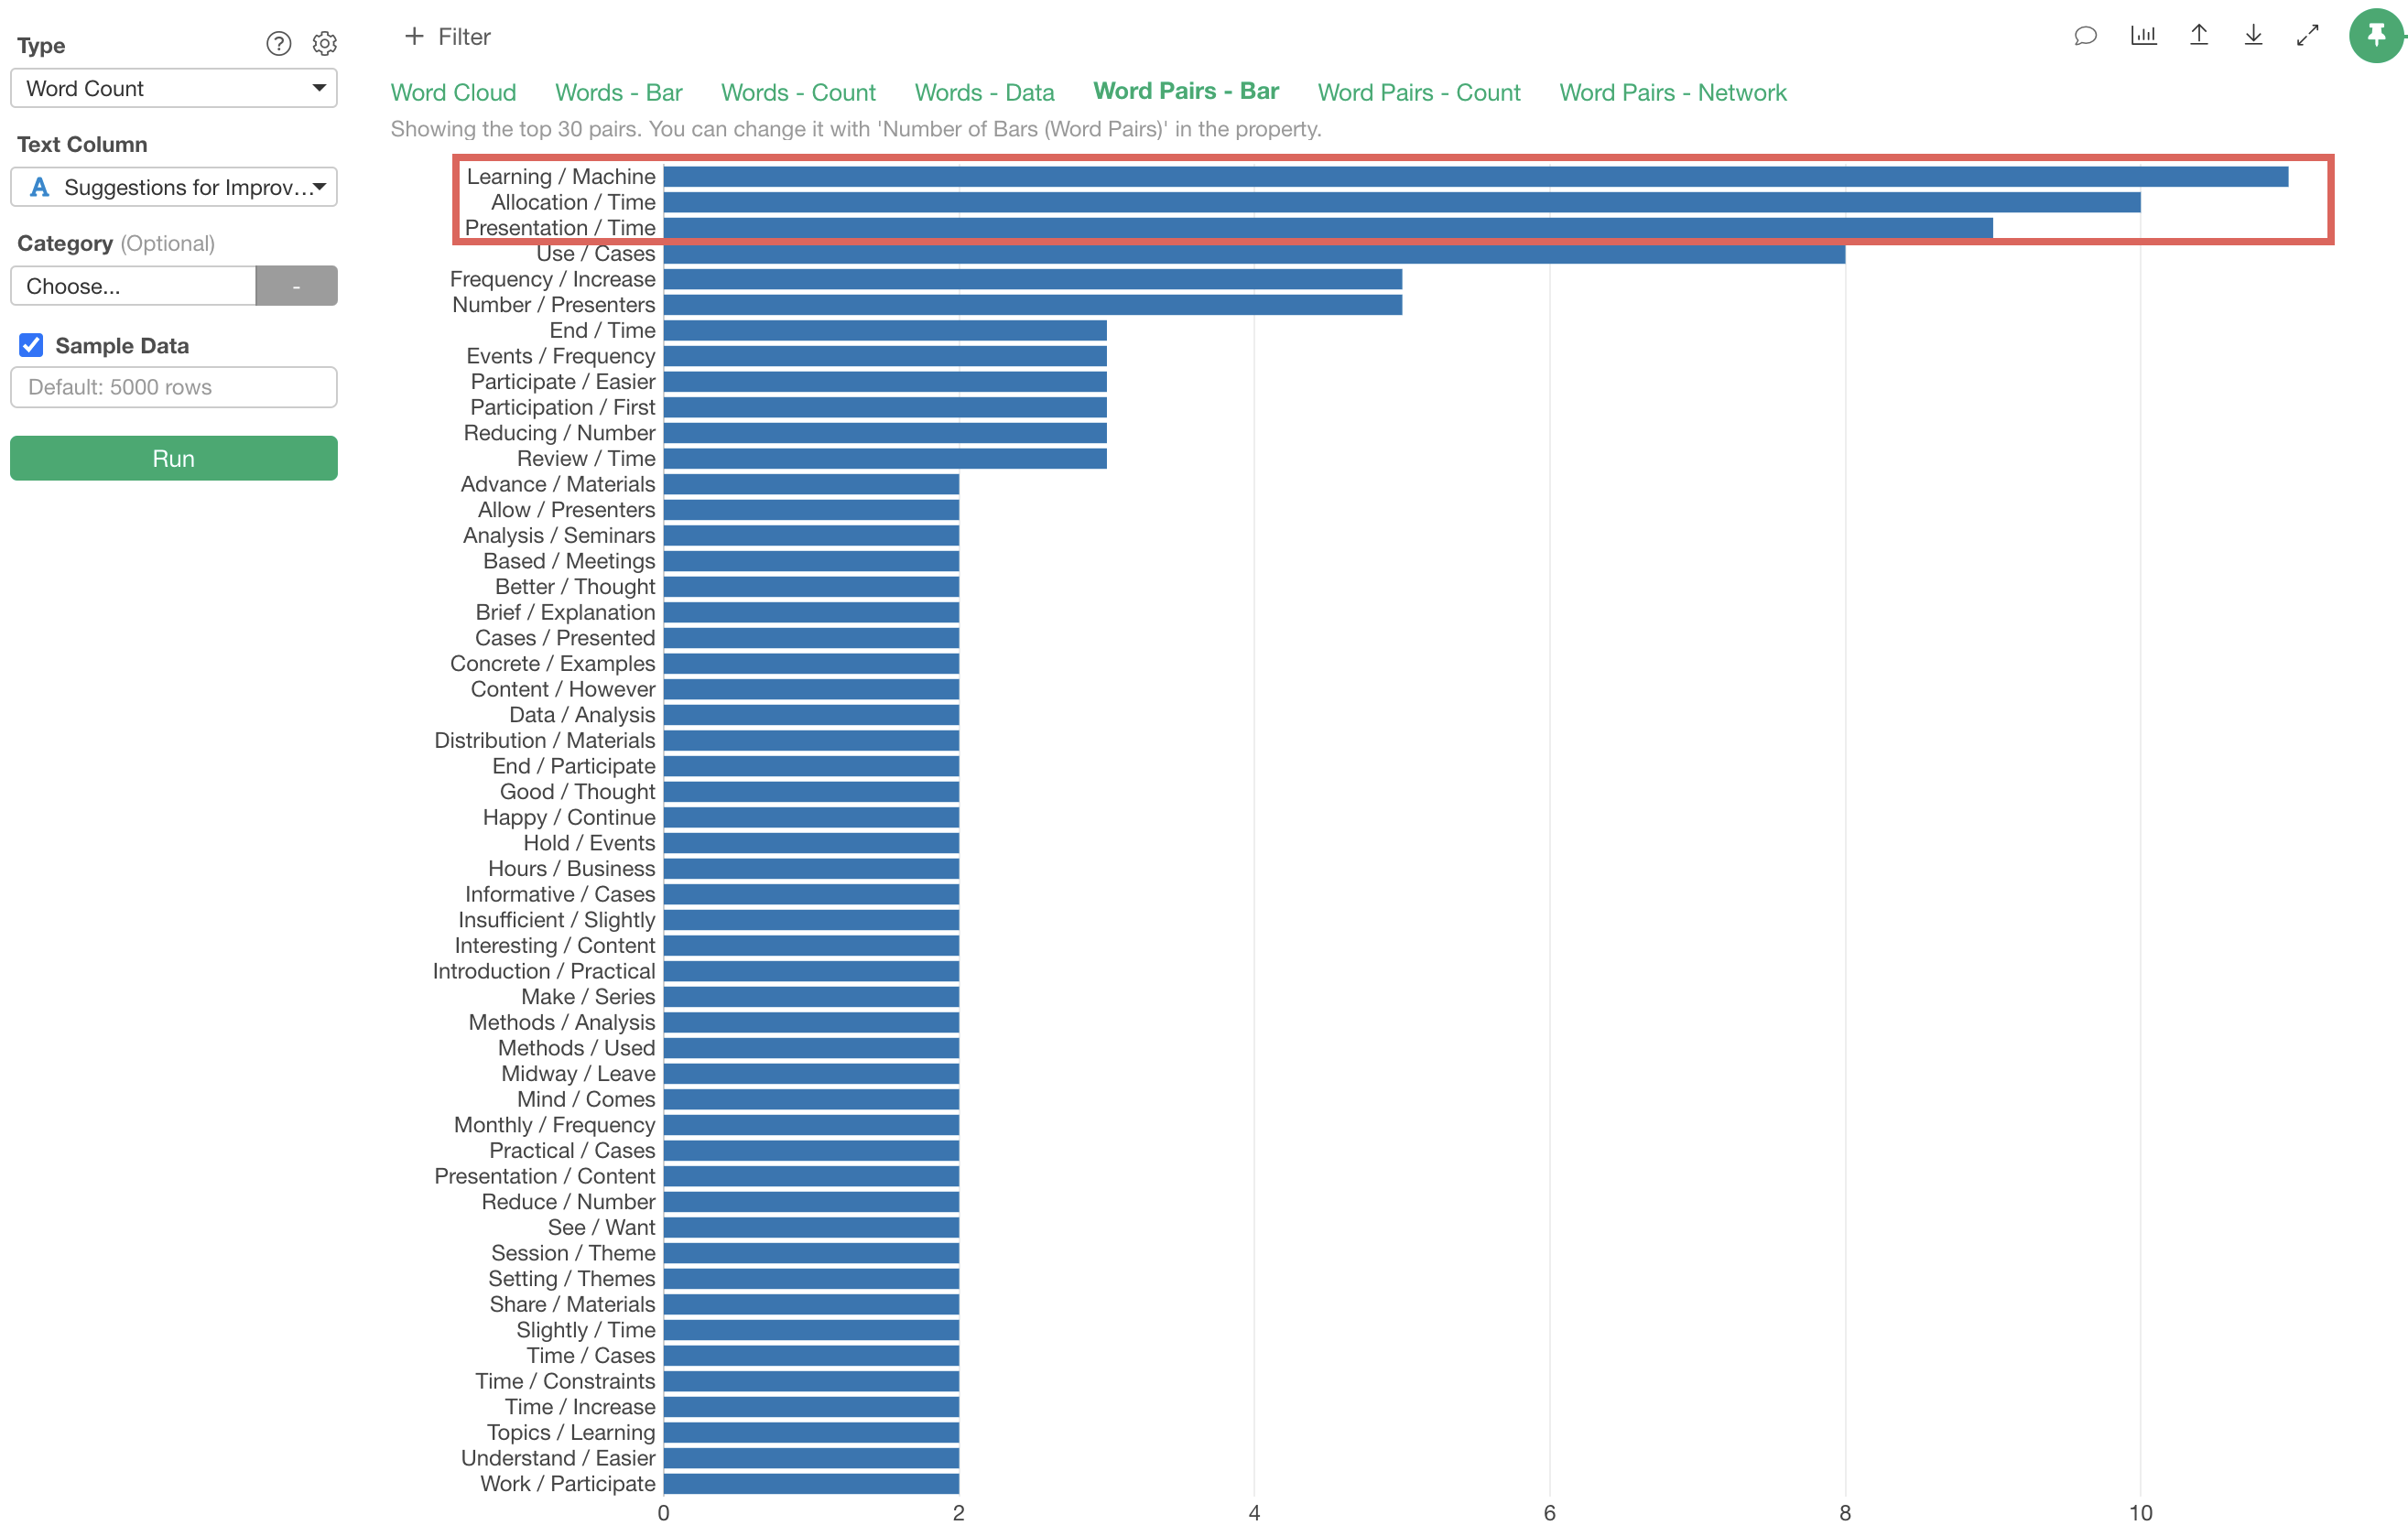
However, these words are likely used as “Learning/Machine,” “Allocation/Time”. For words that you don’t want to be separated, you can register them as single words using the “connecting words” dictionary feature, which will be introduced later.
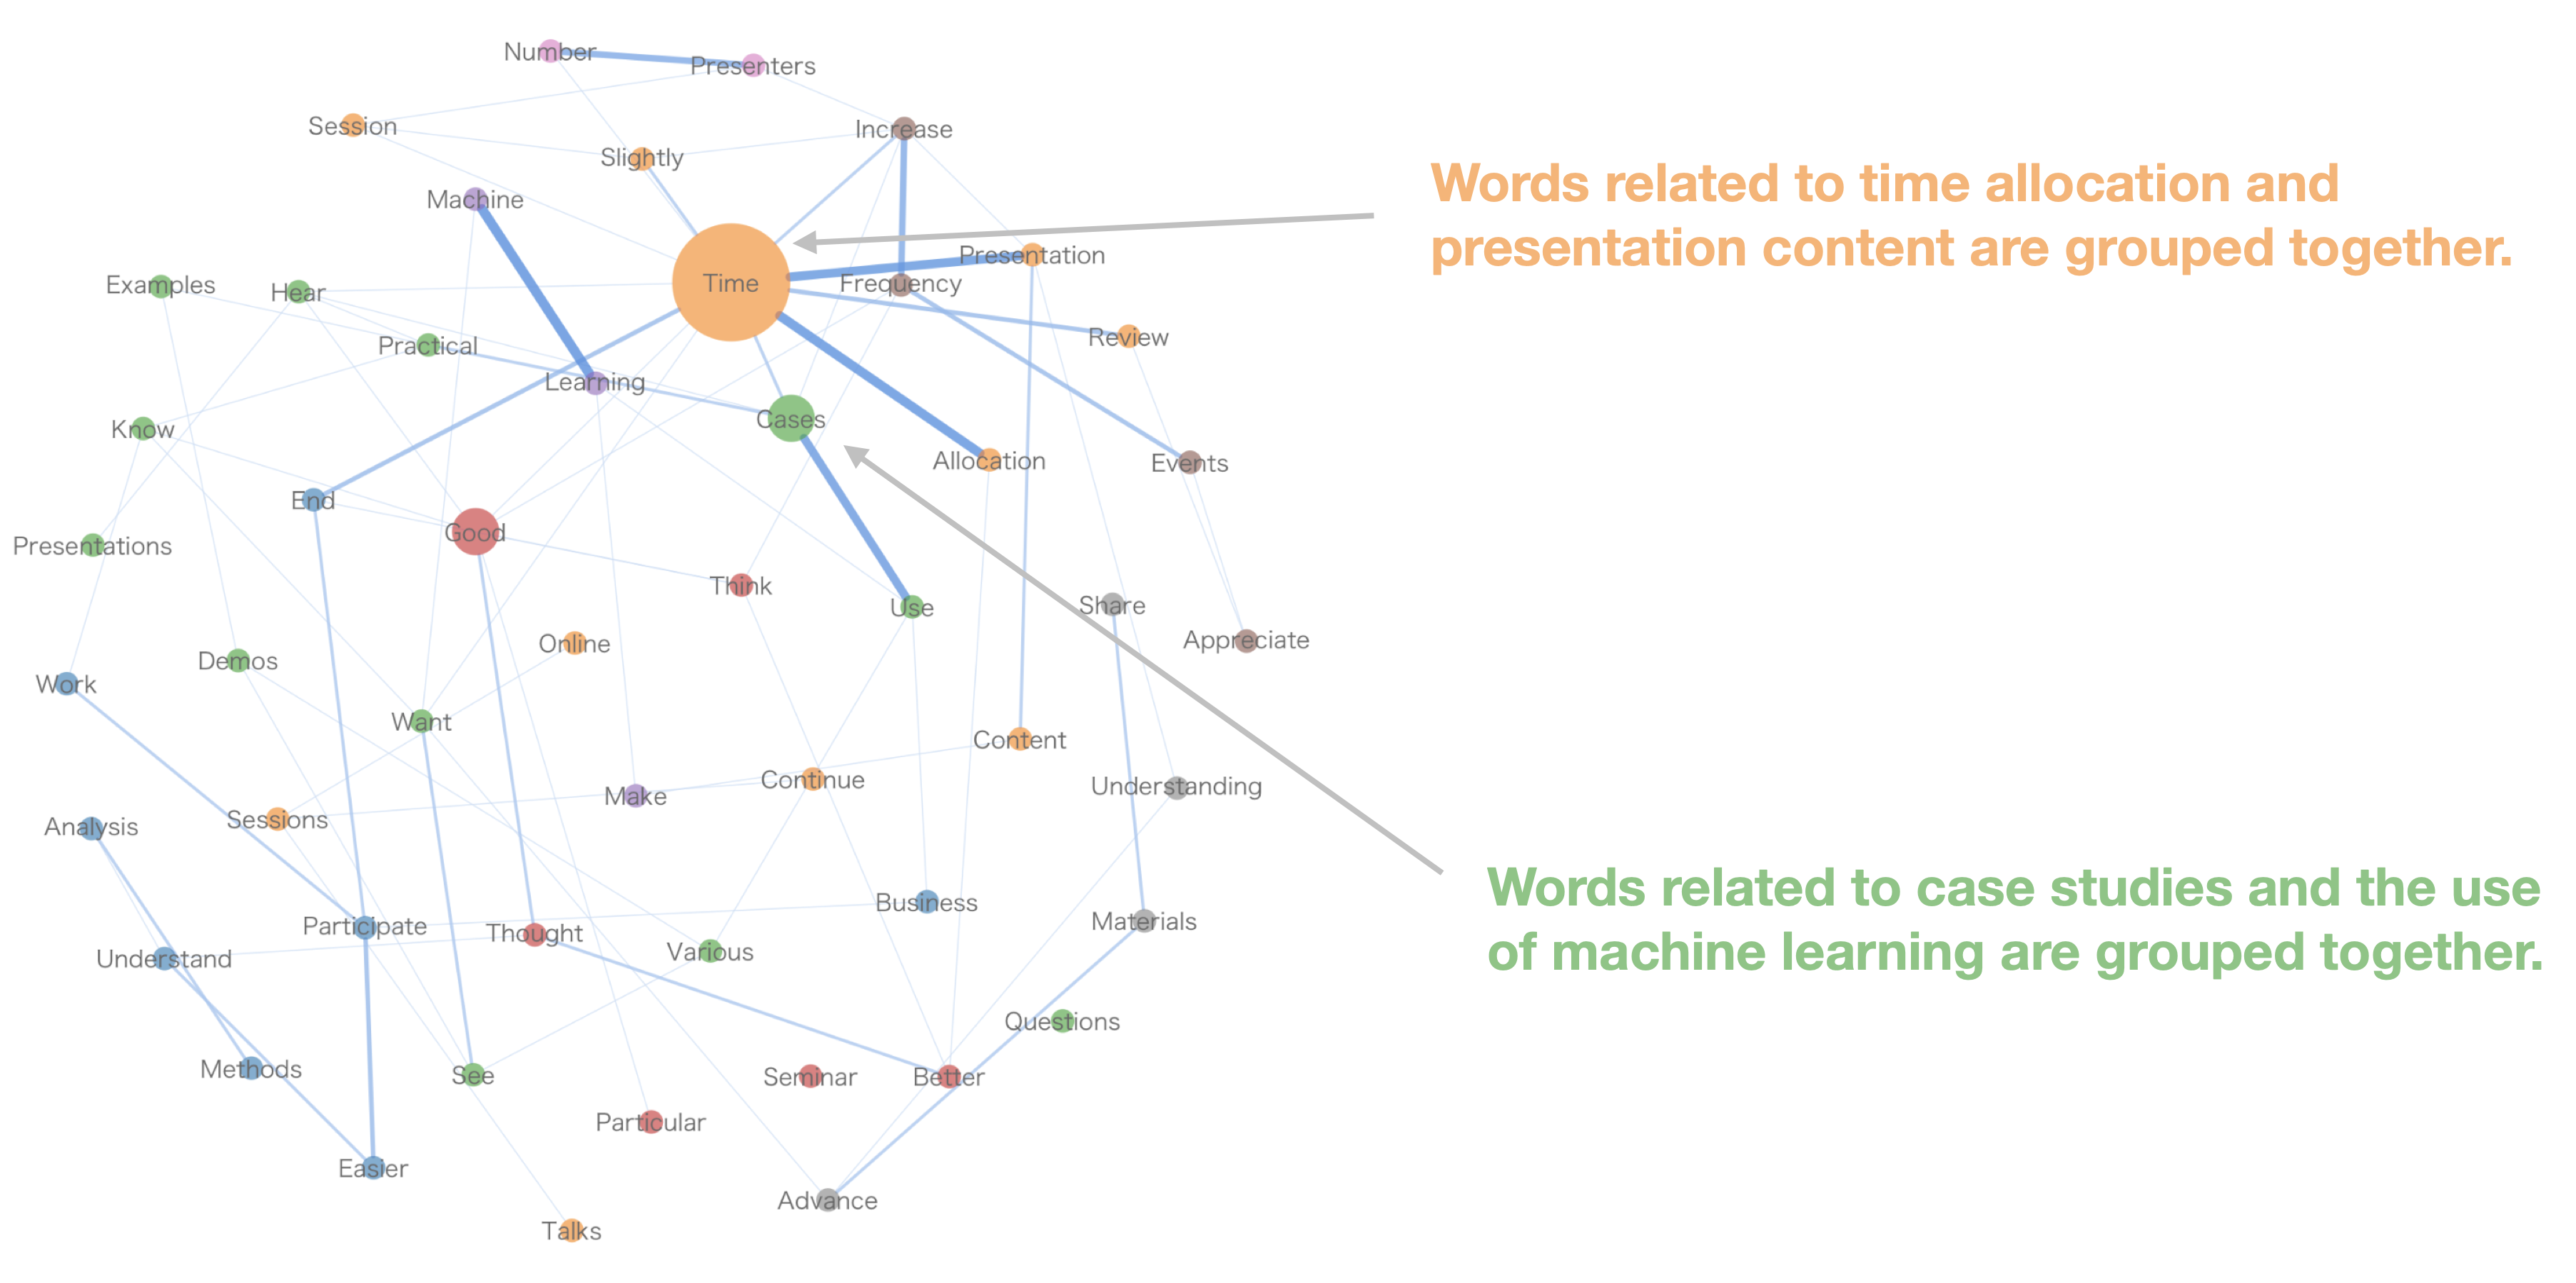
Word Pairs - Network
While “Word Pairs - Bar” shows which words most frequently appear together, it doesn’t reveal relationships beyond pairs of words.
The “Word Pairs - Network” allows you to view co-occurring words as “relationships between words.”
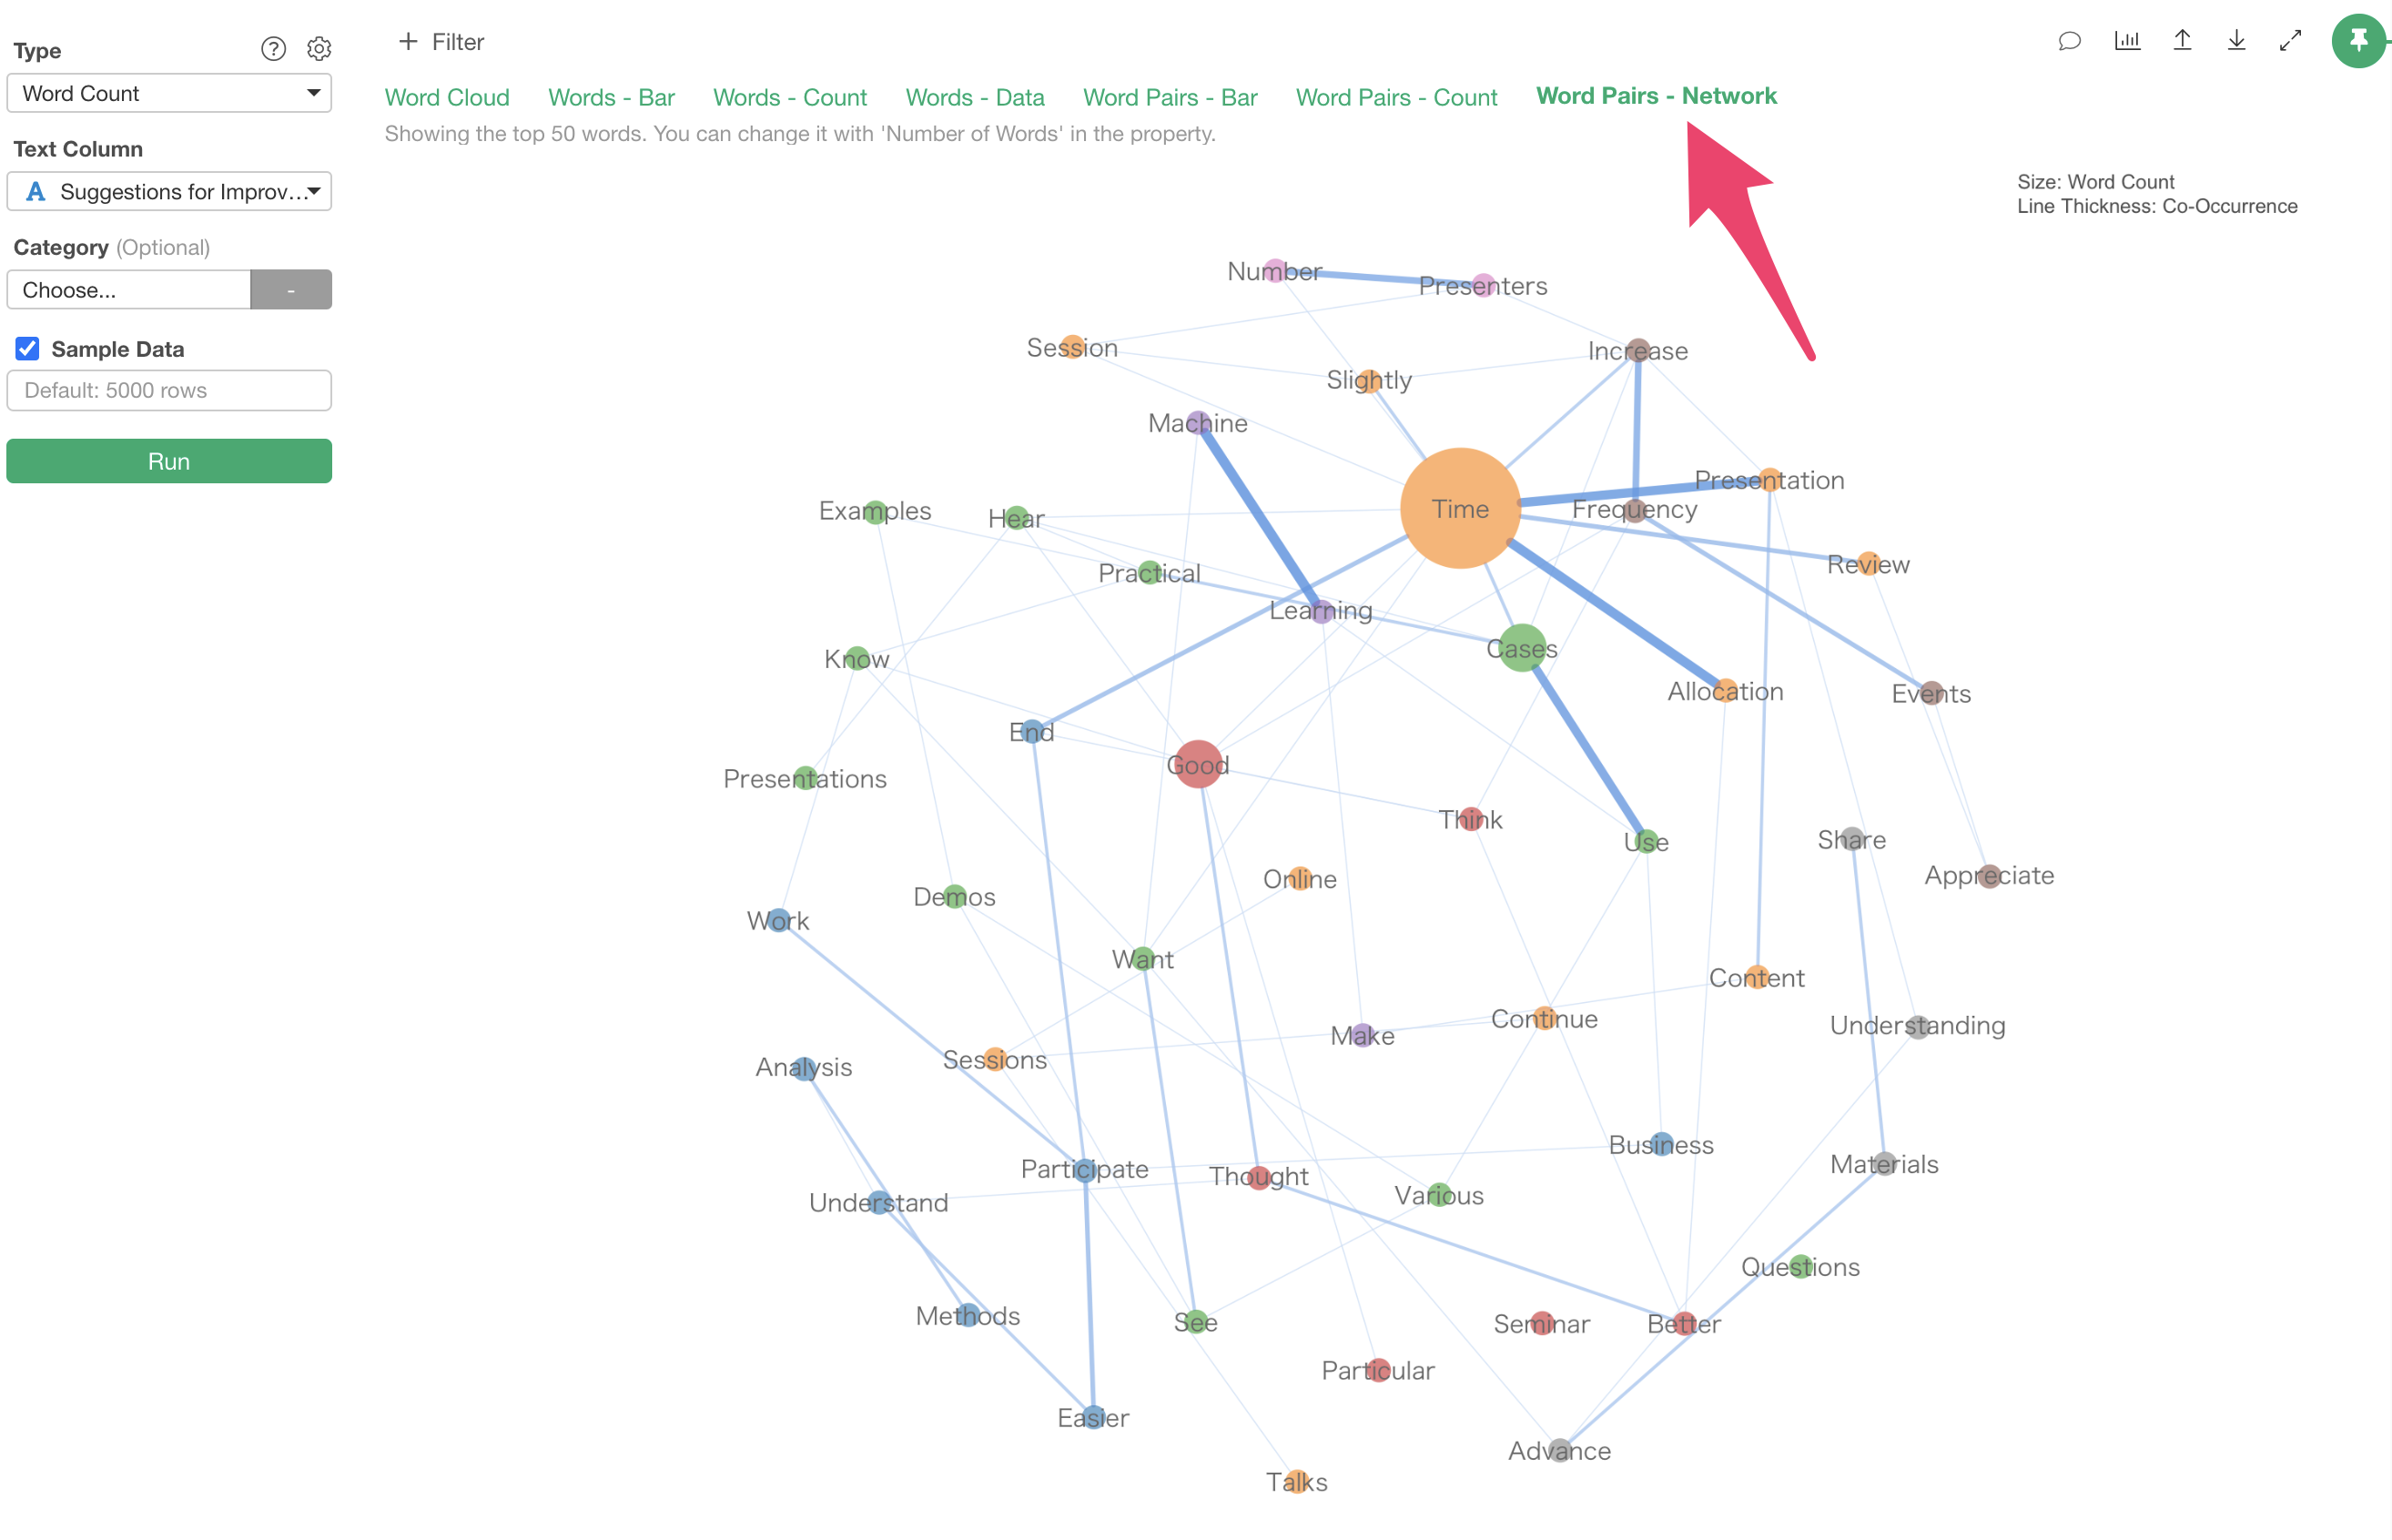
Words are grouped based on how frequently they appear together, with each group assigned a different “color.”
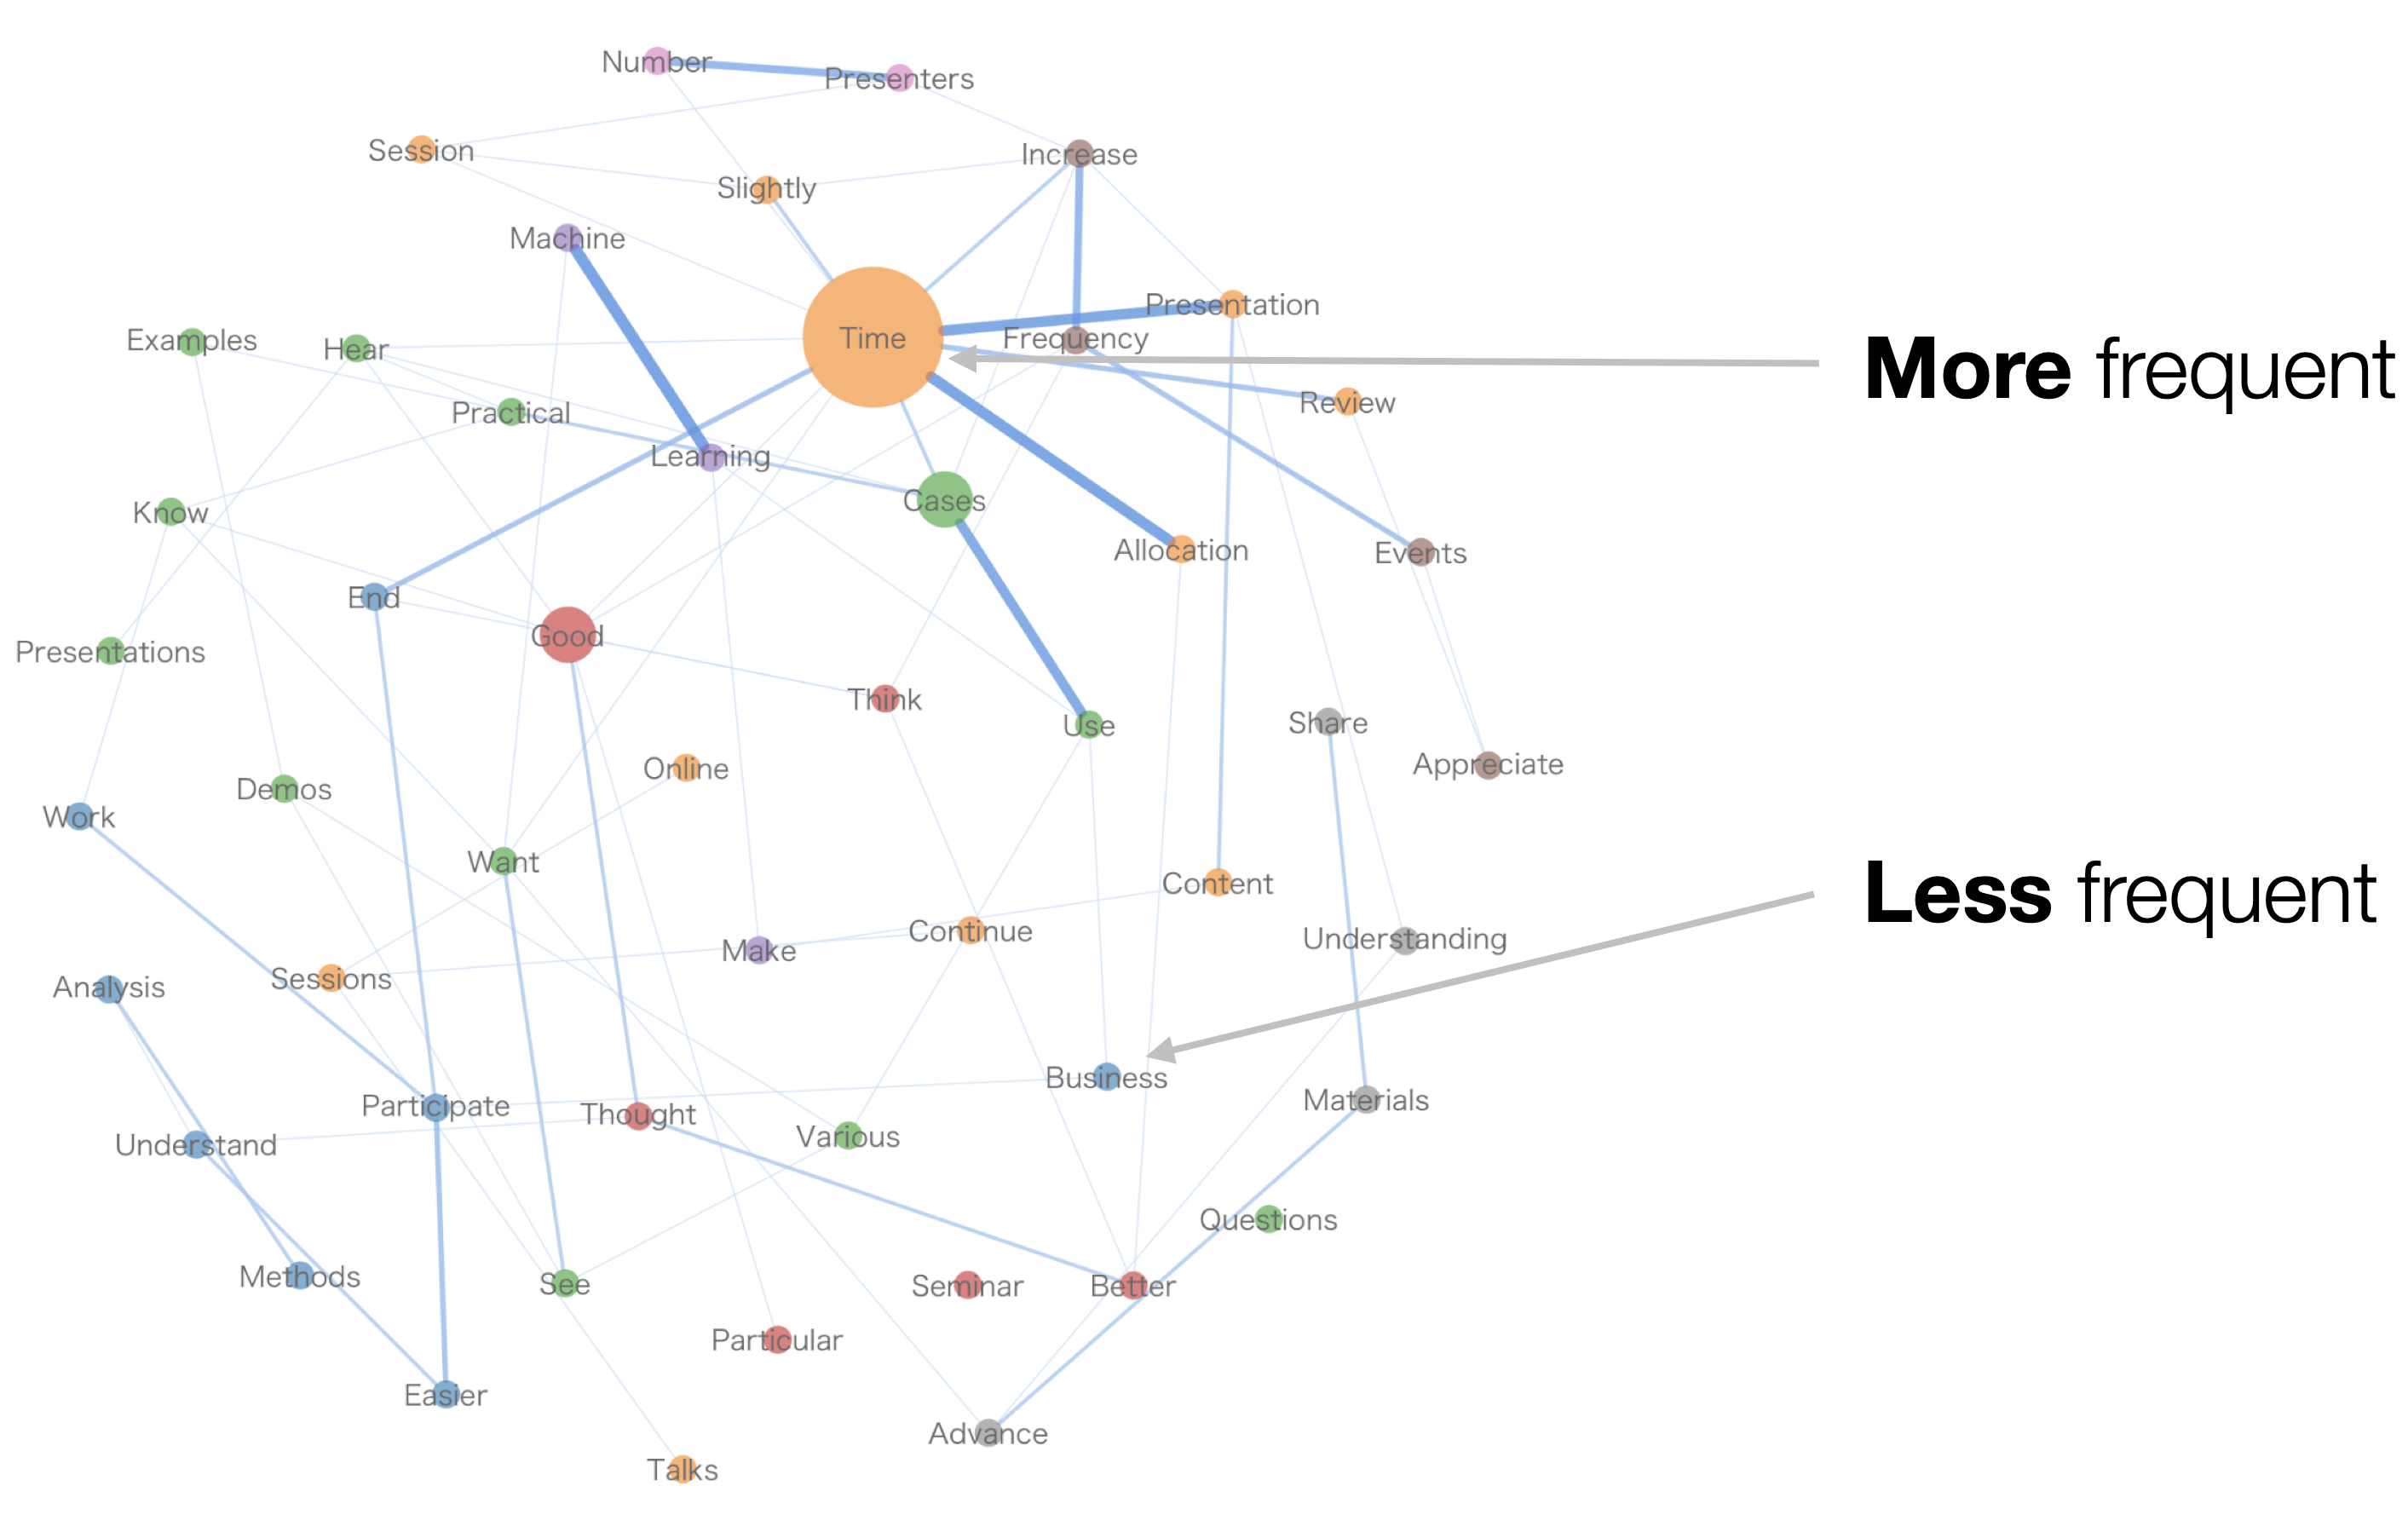
The size of the circle is determined by “frequency of occurrence” - more frequent words have larger circles, while less frequent words have smaller circles.
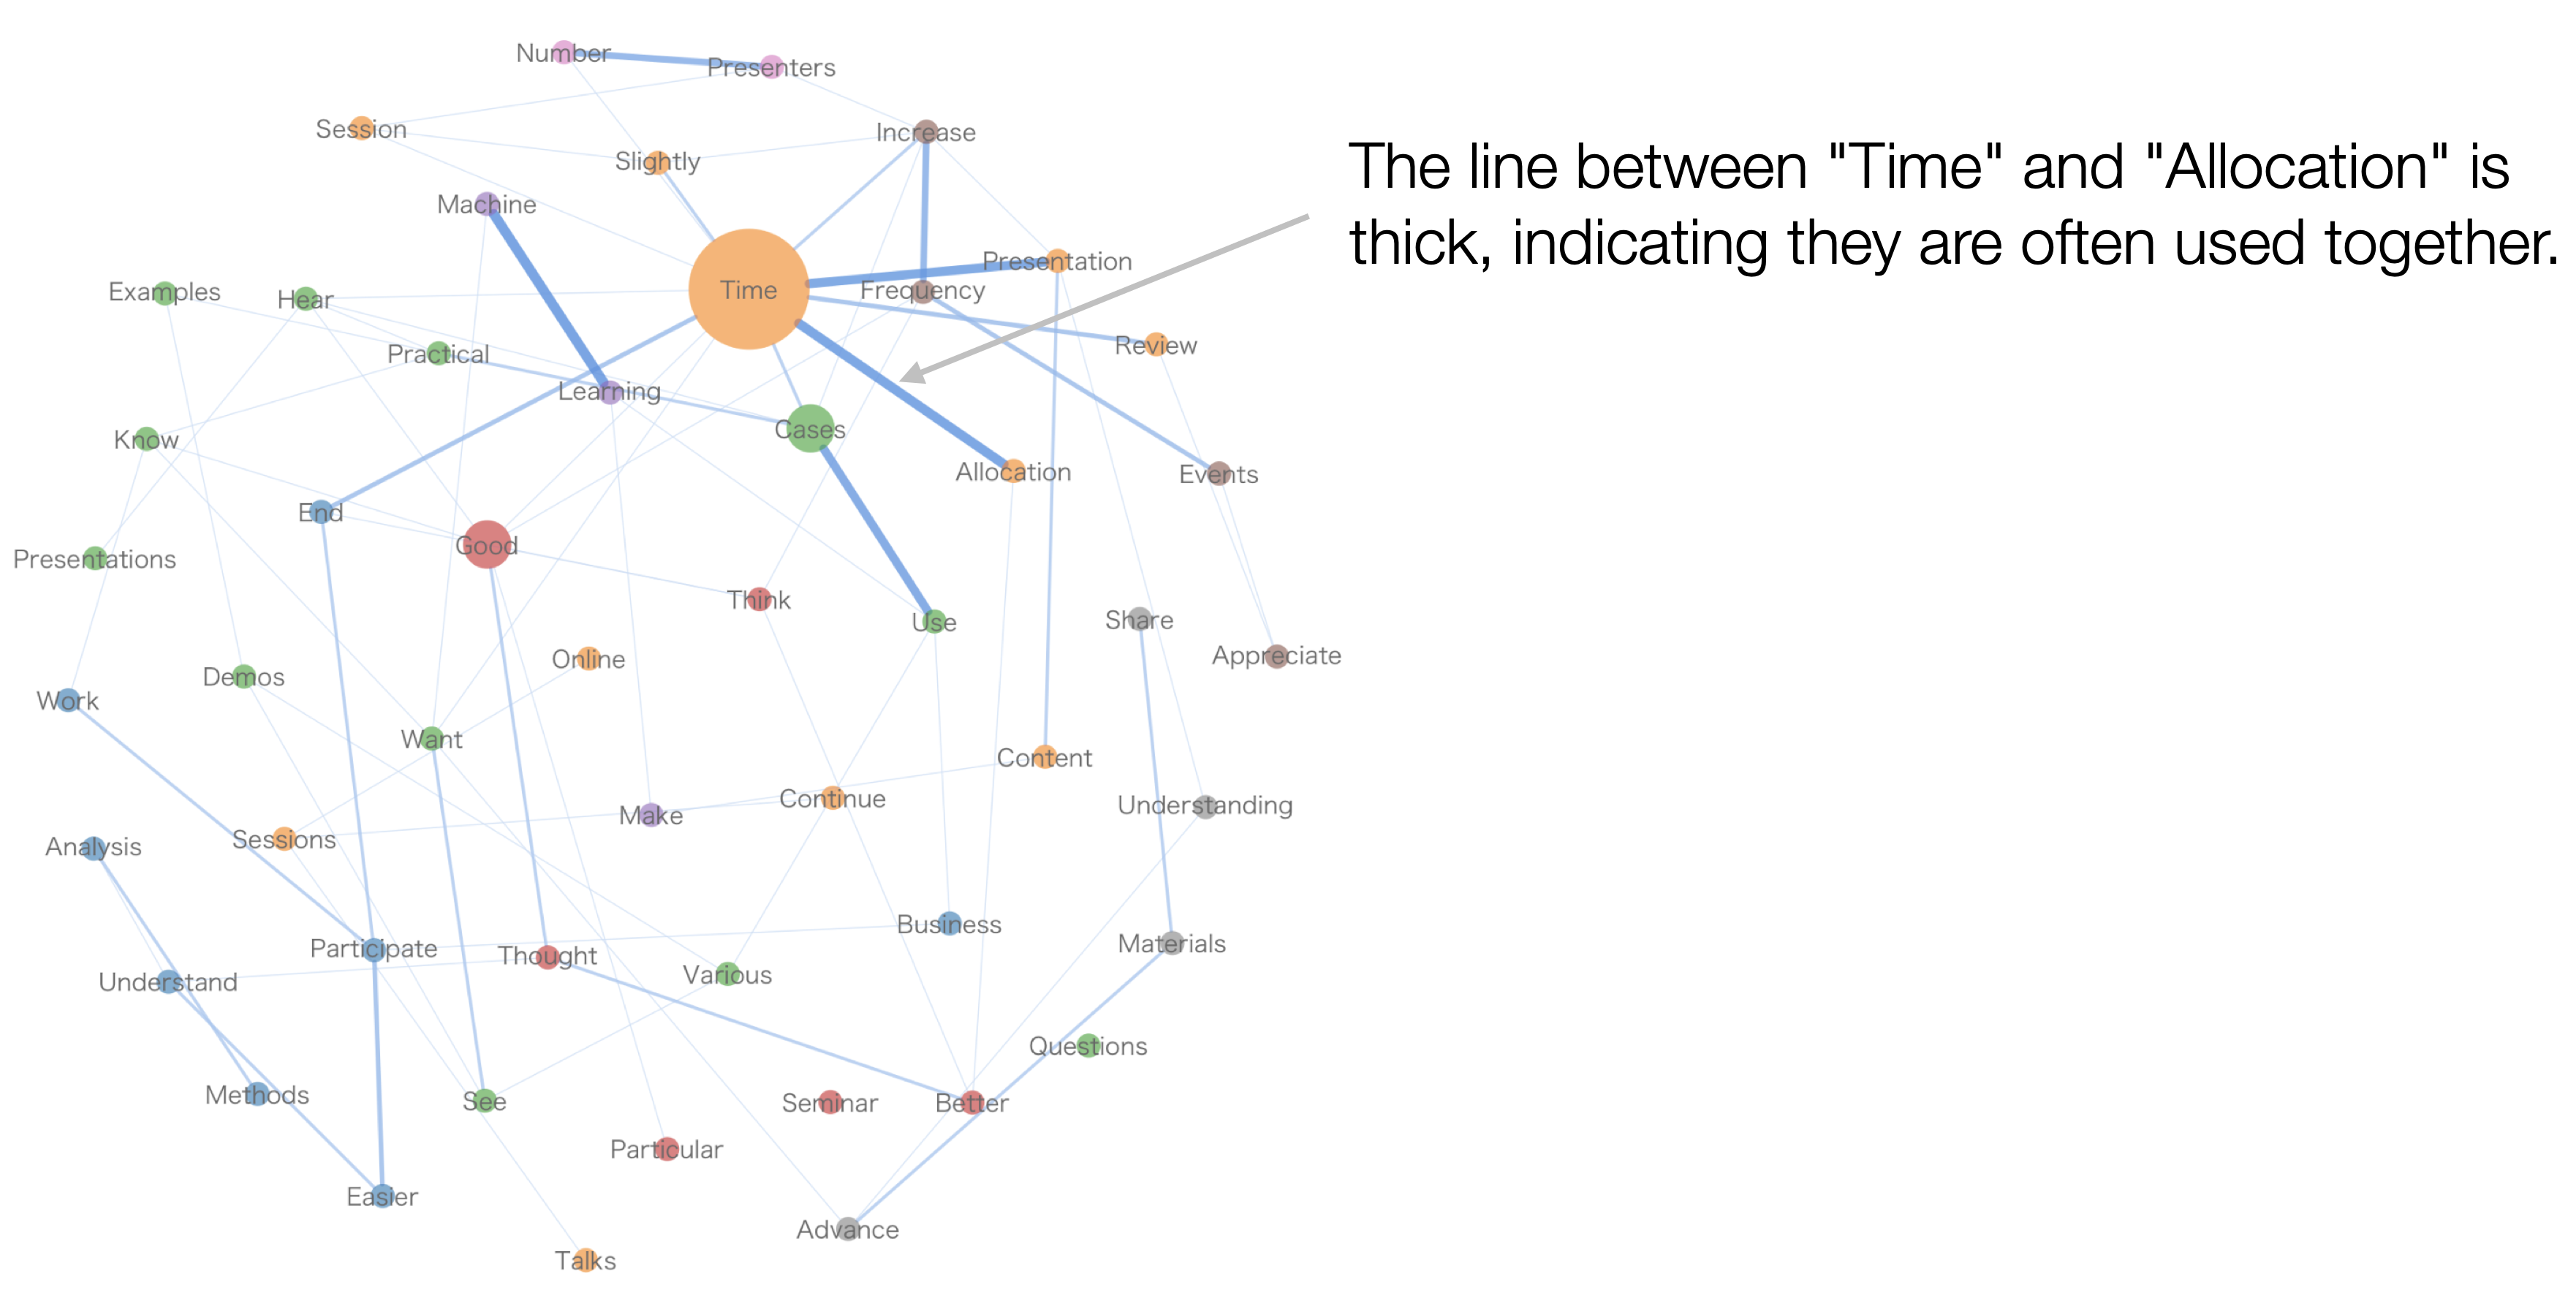
Additionally, word combinations that frequently appear together are represented by thicker lines.
5. Setting Up Stopword and Compound Word Dictionaries
In Exploratory, you can register and use dictionaries for “Stopword” (common words that don’t characterize each text) and “connecting words” (words that should be treated as a single word even when separated).
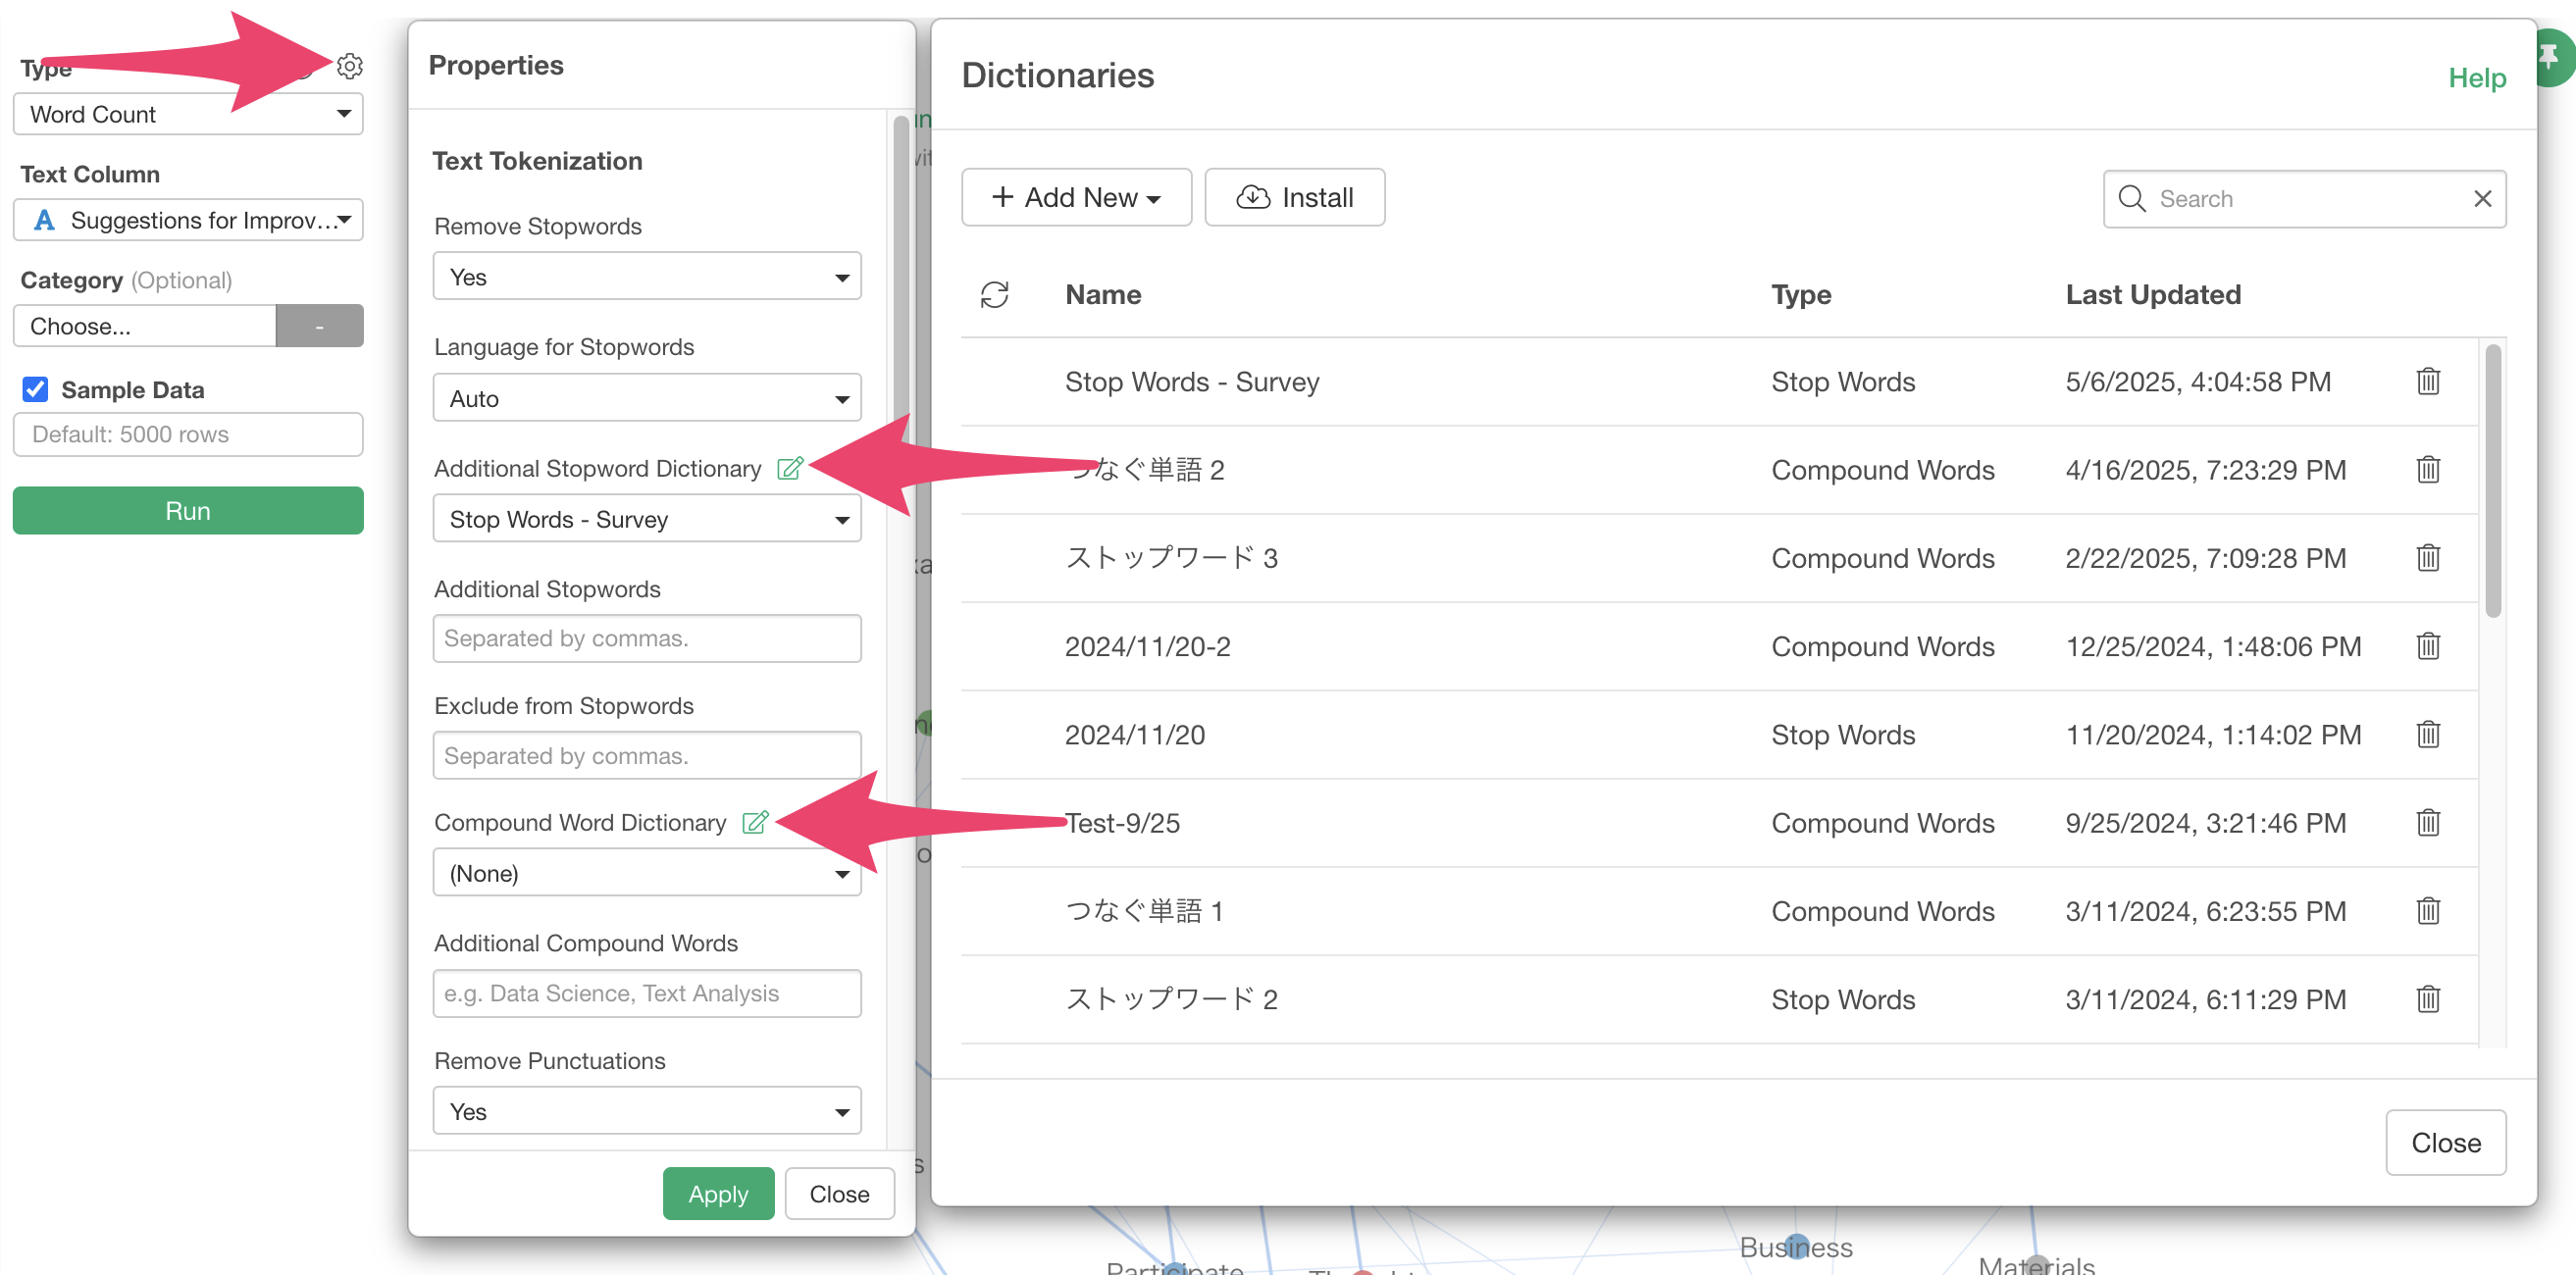
In the dictionary, you can register words by entering one word per line.
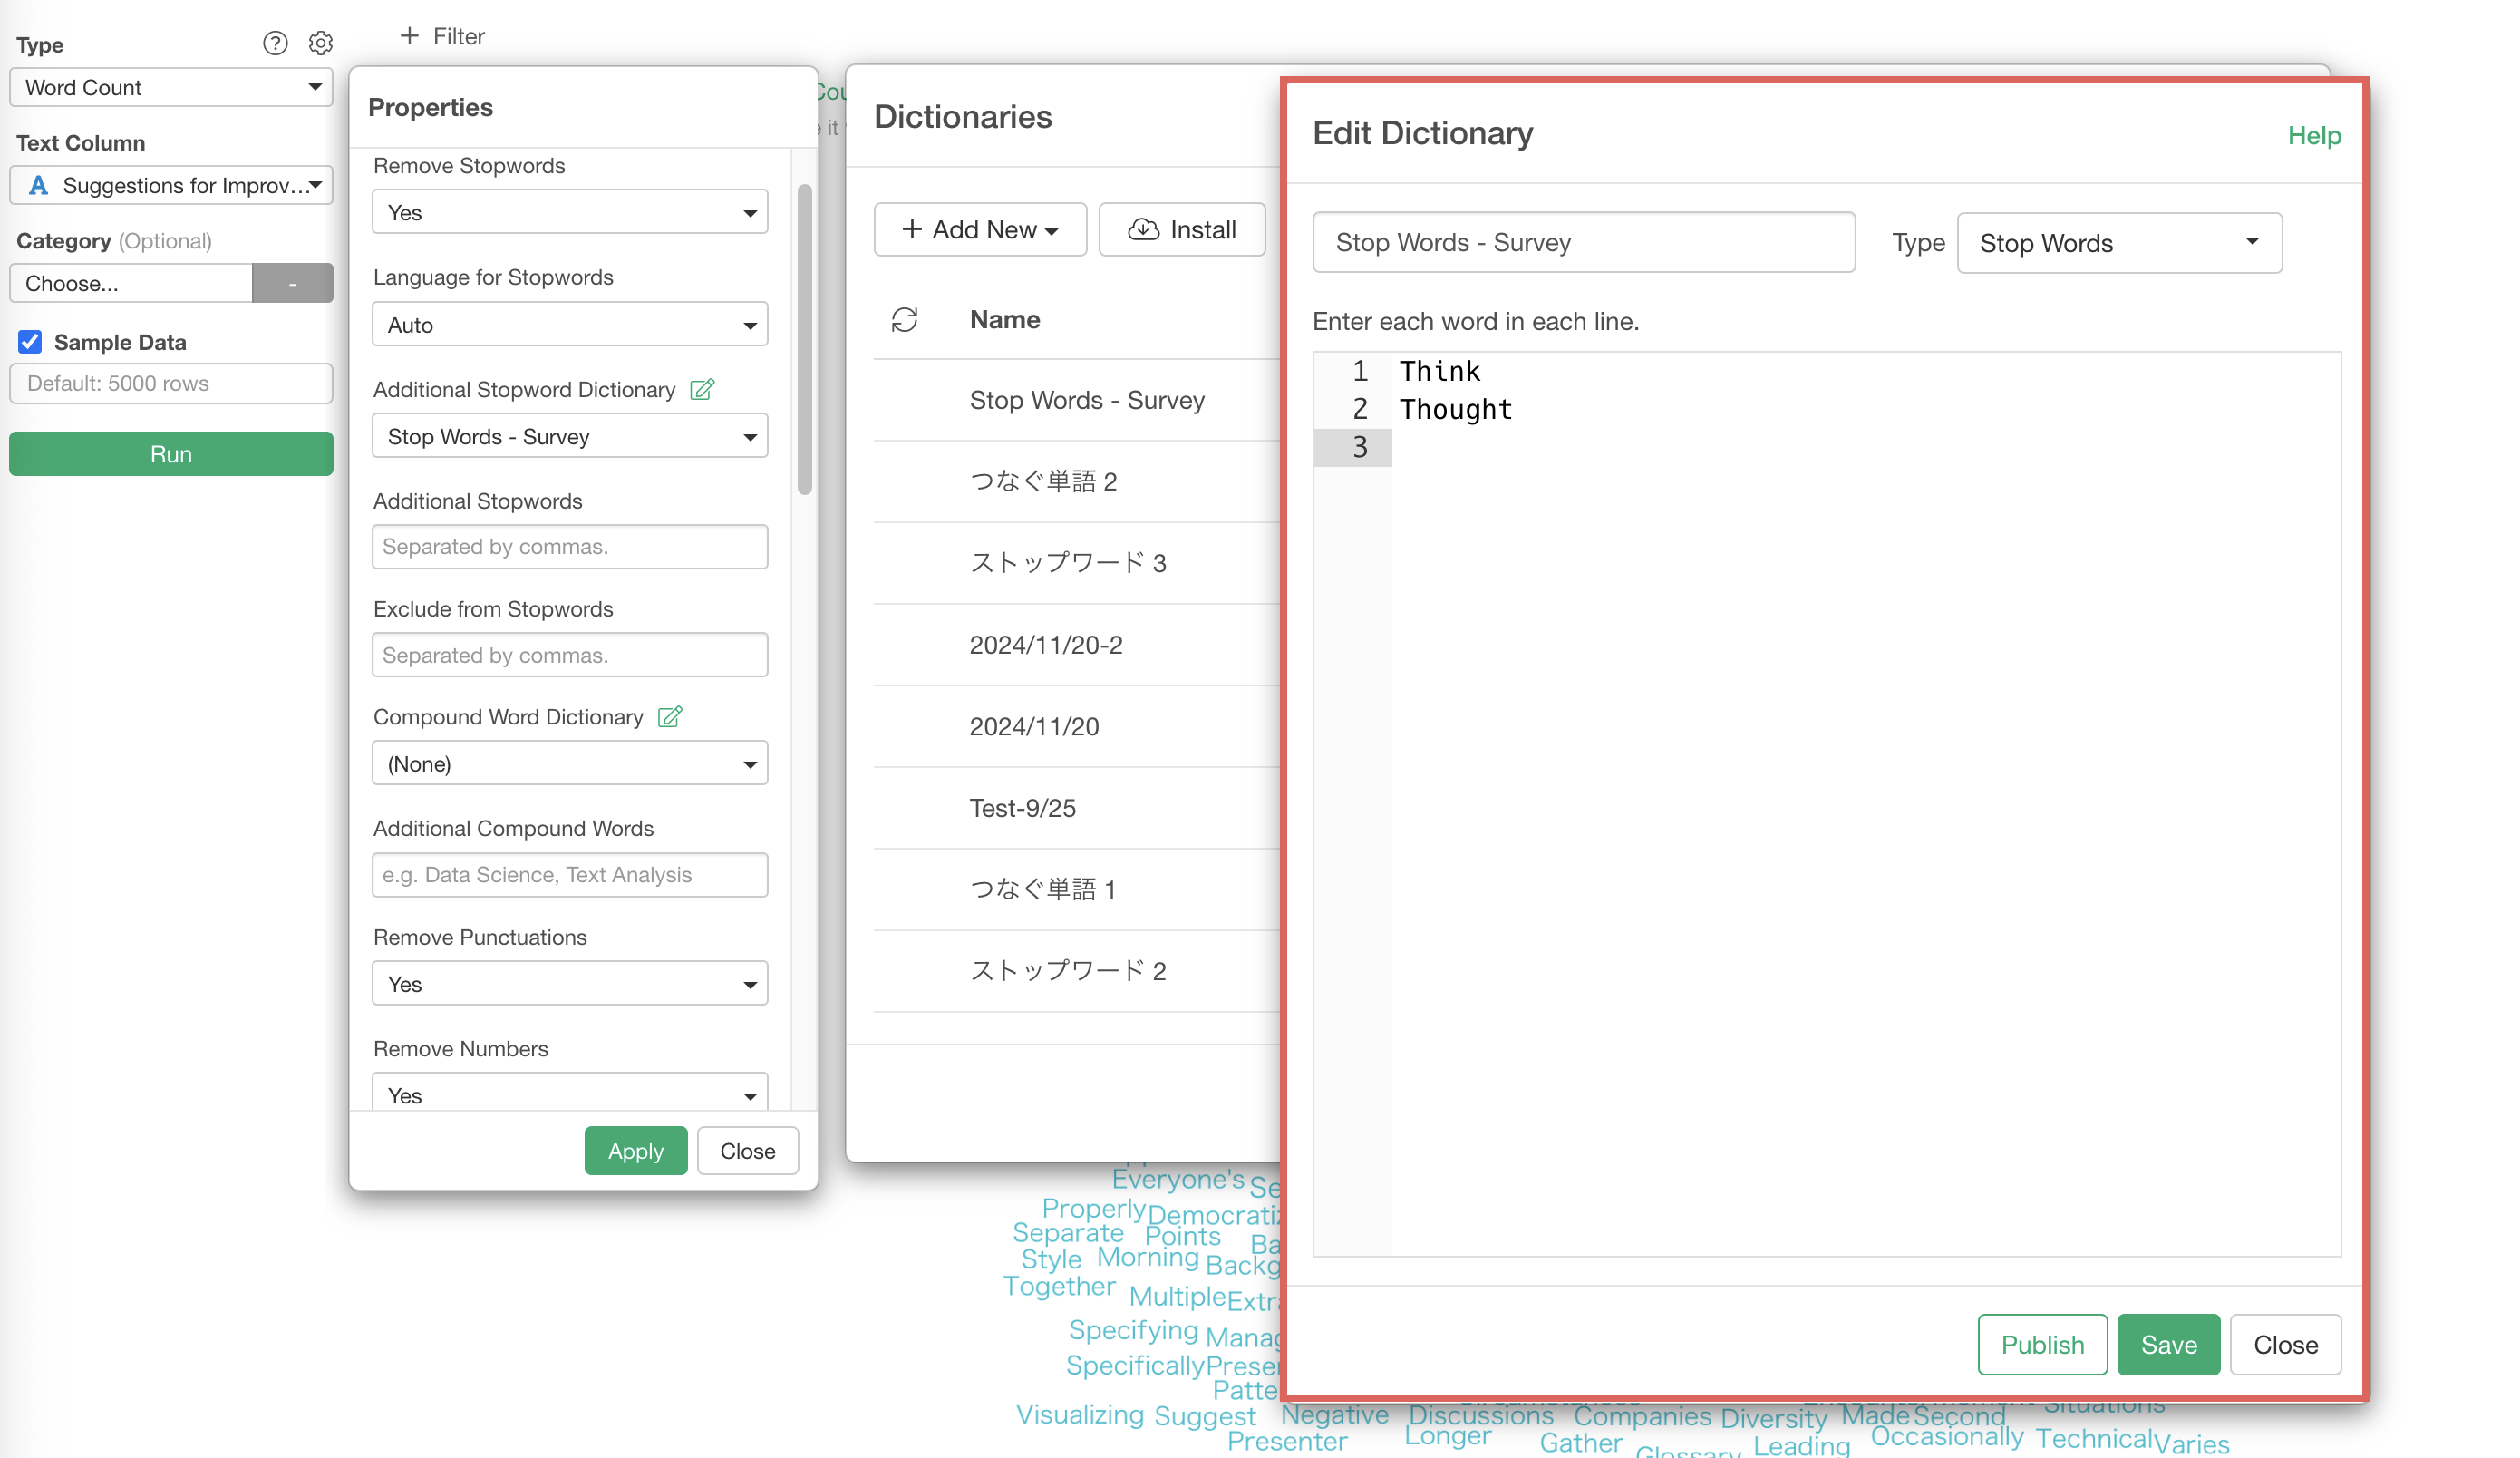
For example, if you register stopword like “Think” and “Thought”in the dictionary, you can confirm that these words are removed from the analysis.
Furthermore, dictionaries can be published to the Exploratory server to share with team members and others.
This concludes the text analysis section of the survey data analysis!