Survey Data Analysis Part 4 - Aggregating Responses
This note is the fourth part of the “Survey Data Analysis” trial tour, focusing on “Aggregation,” designed to help you efficiently learn how to utilize survey data to improve your business or services. You can find the complete tour at Survey Data Analysis.
This section will introduce you to convenient features for quickly and flexibly aggregating or visualizing survey responses.
The estimated time required is about 10 minutes. Let’s get started!
Data Format Suitable for Aggregation: Long Format
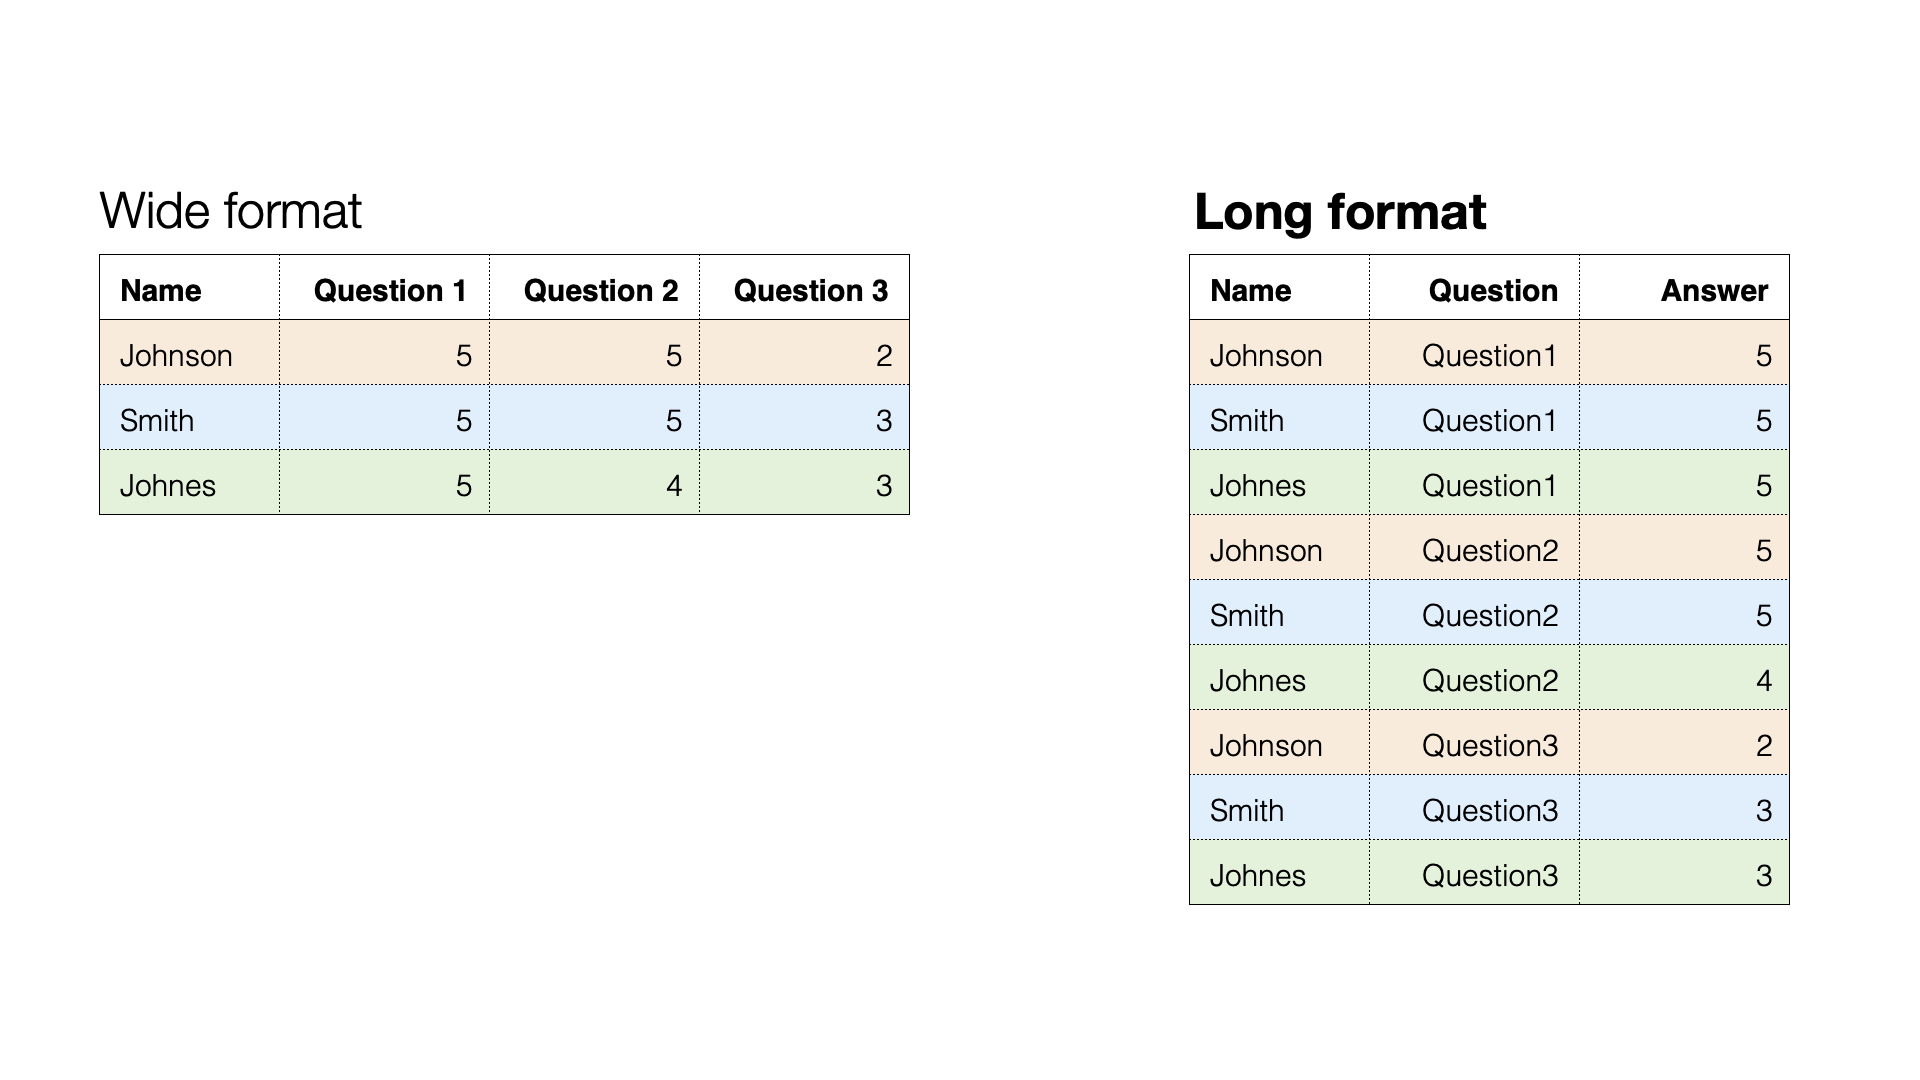
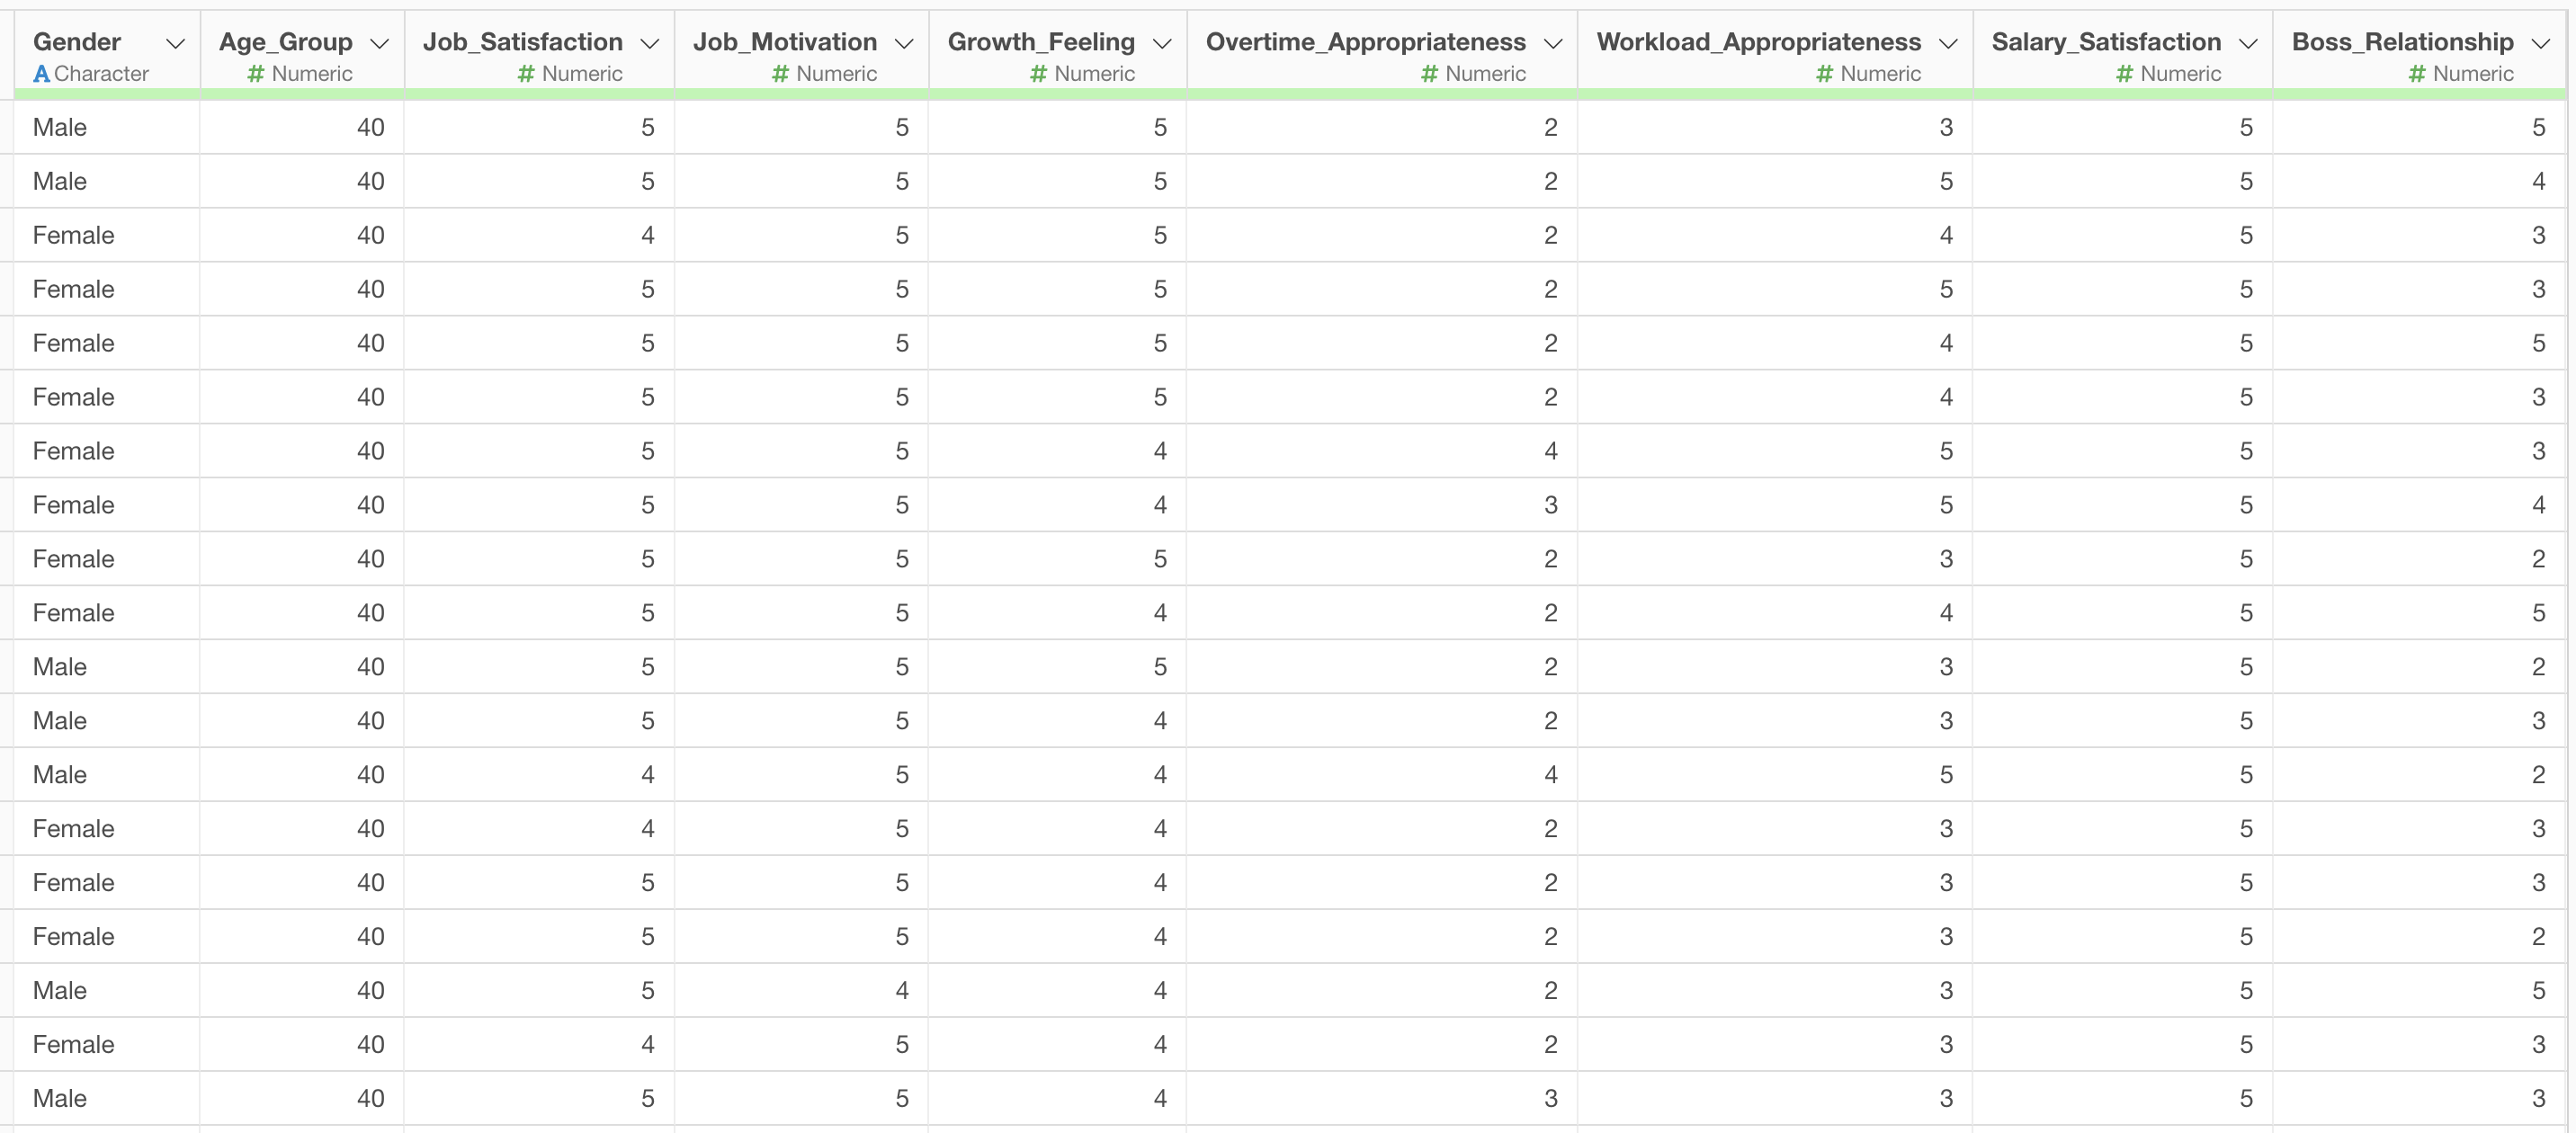
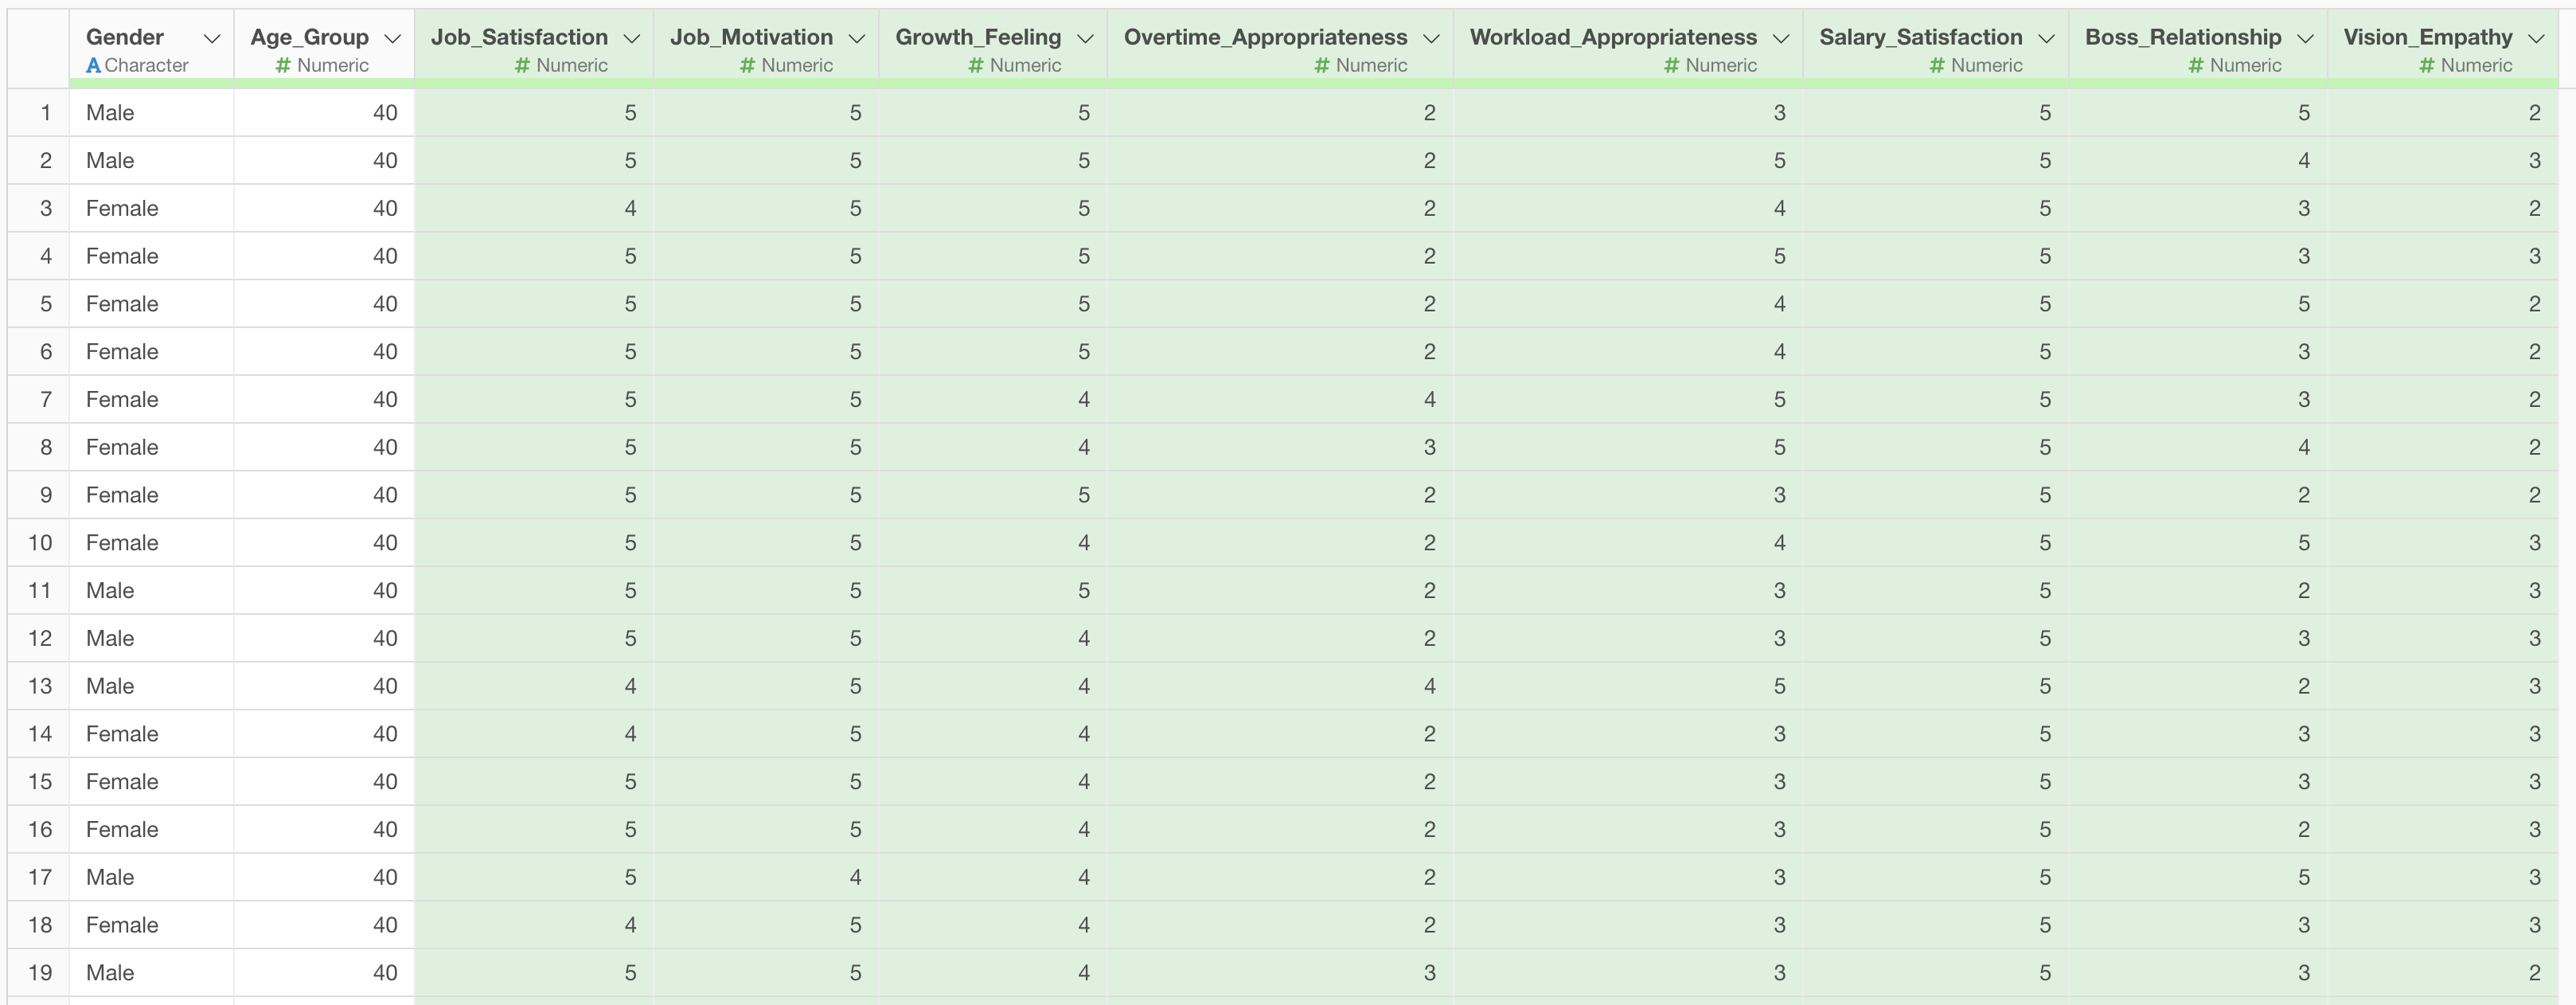
In many cases, survey response data is structured with one row representing one respondent’s answers, with columns containing the values for each question.
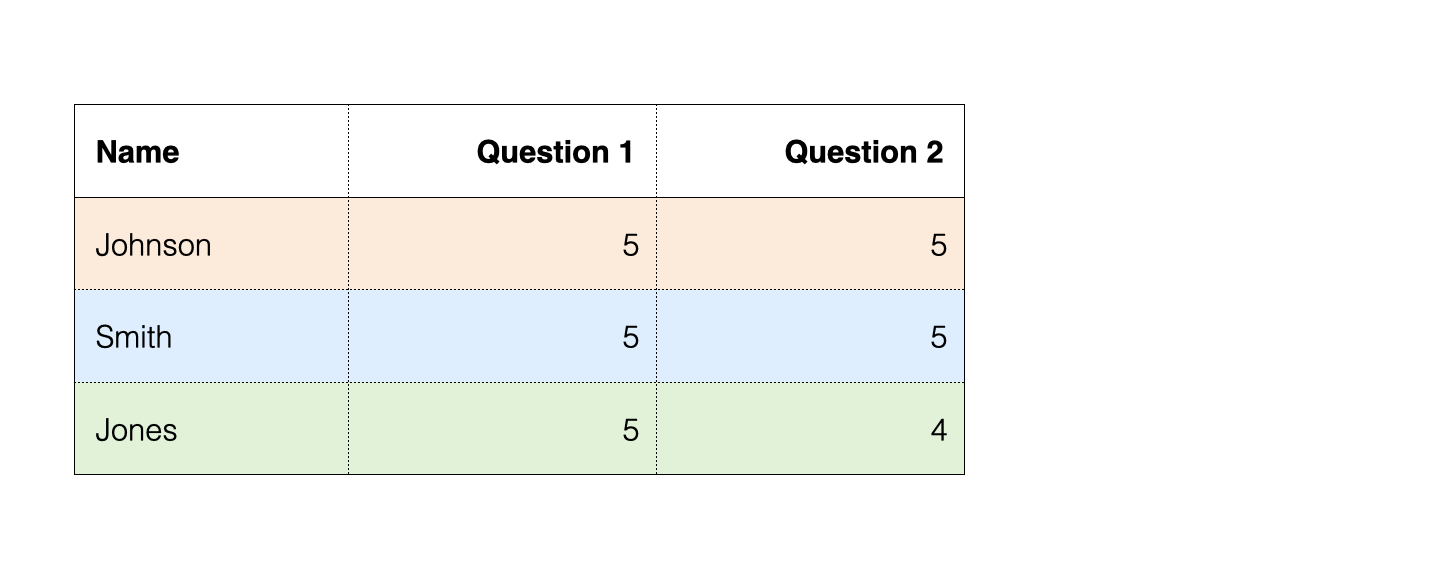 With
this type of data, as the number of questions increases, the data
(responses) expands horizontally.
With
this type of data, as the number of questions increases, the data
(responses) expands horizontally.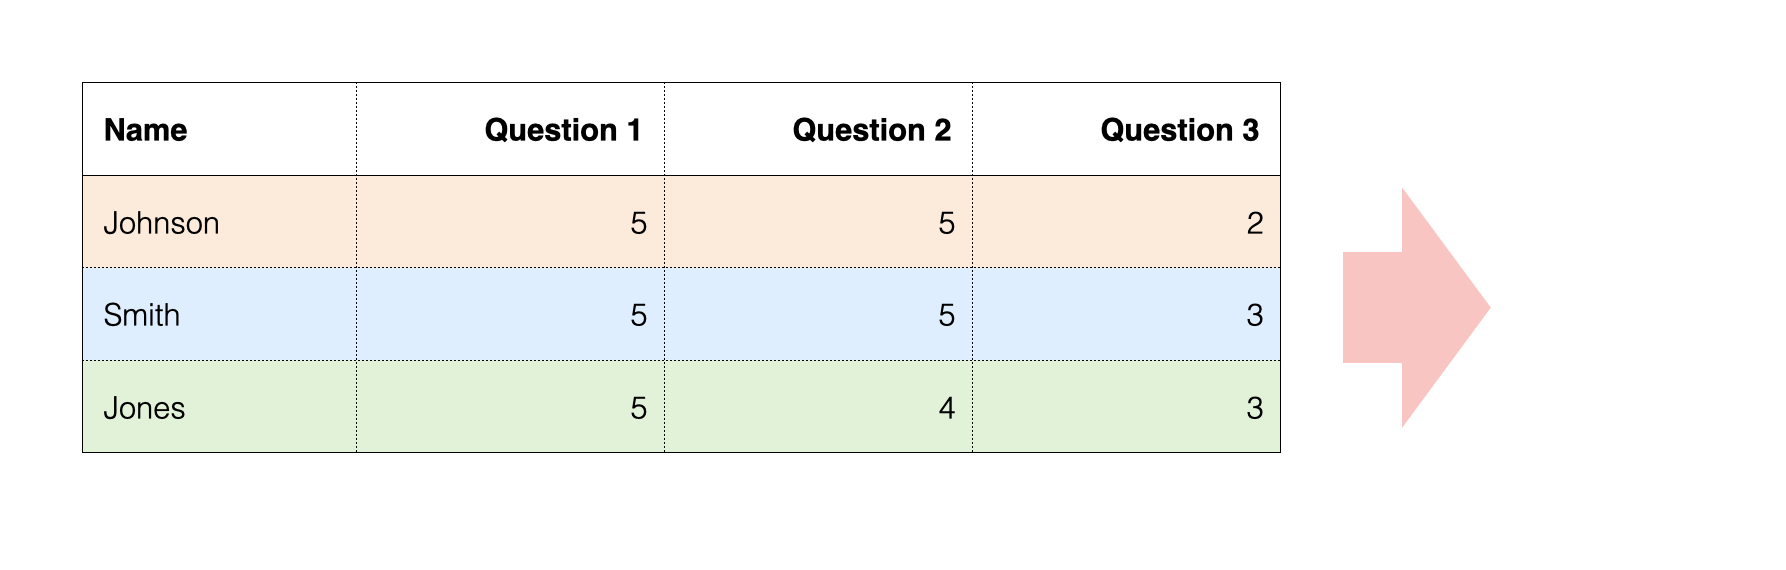 This
type of data structure is called wide format.
This
type of data structure is called wide format.
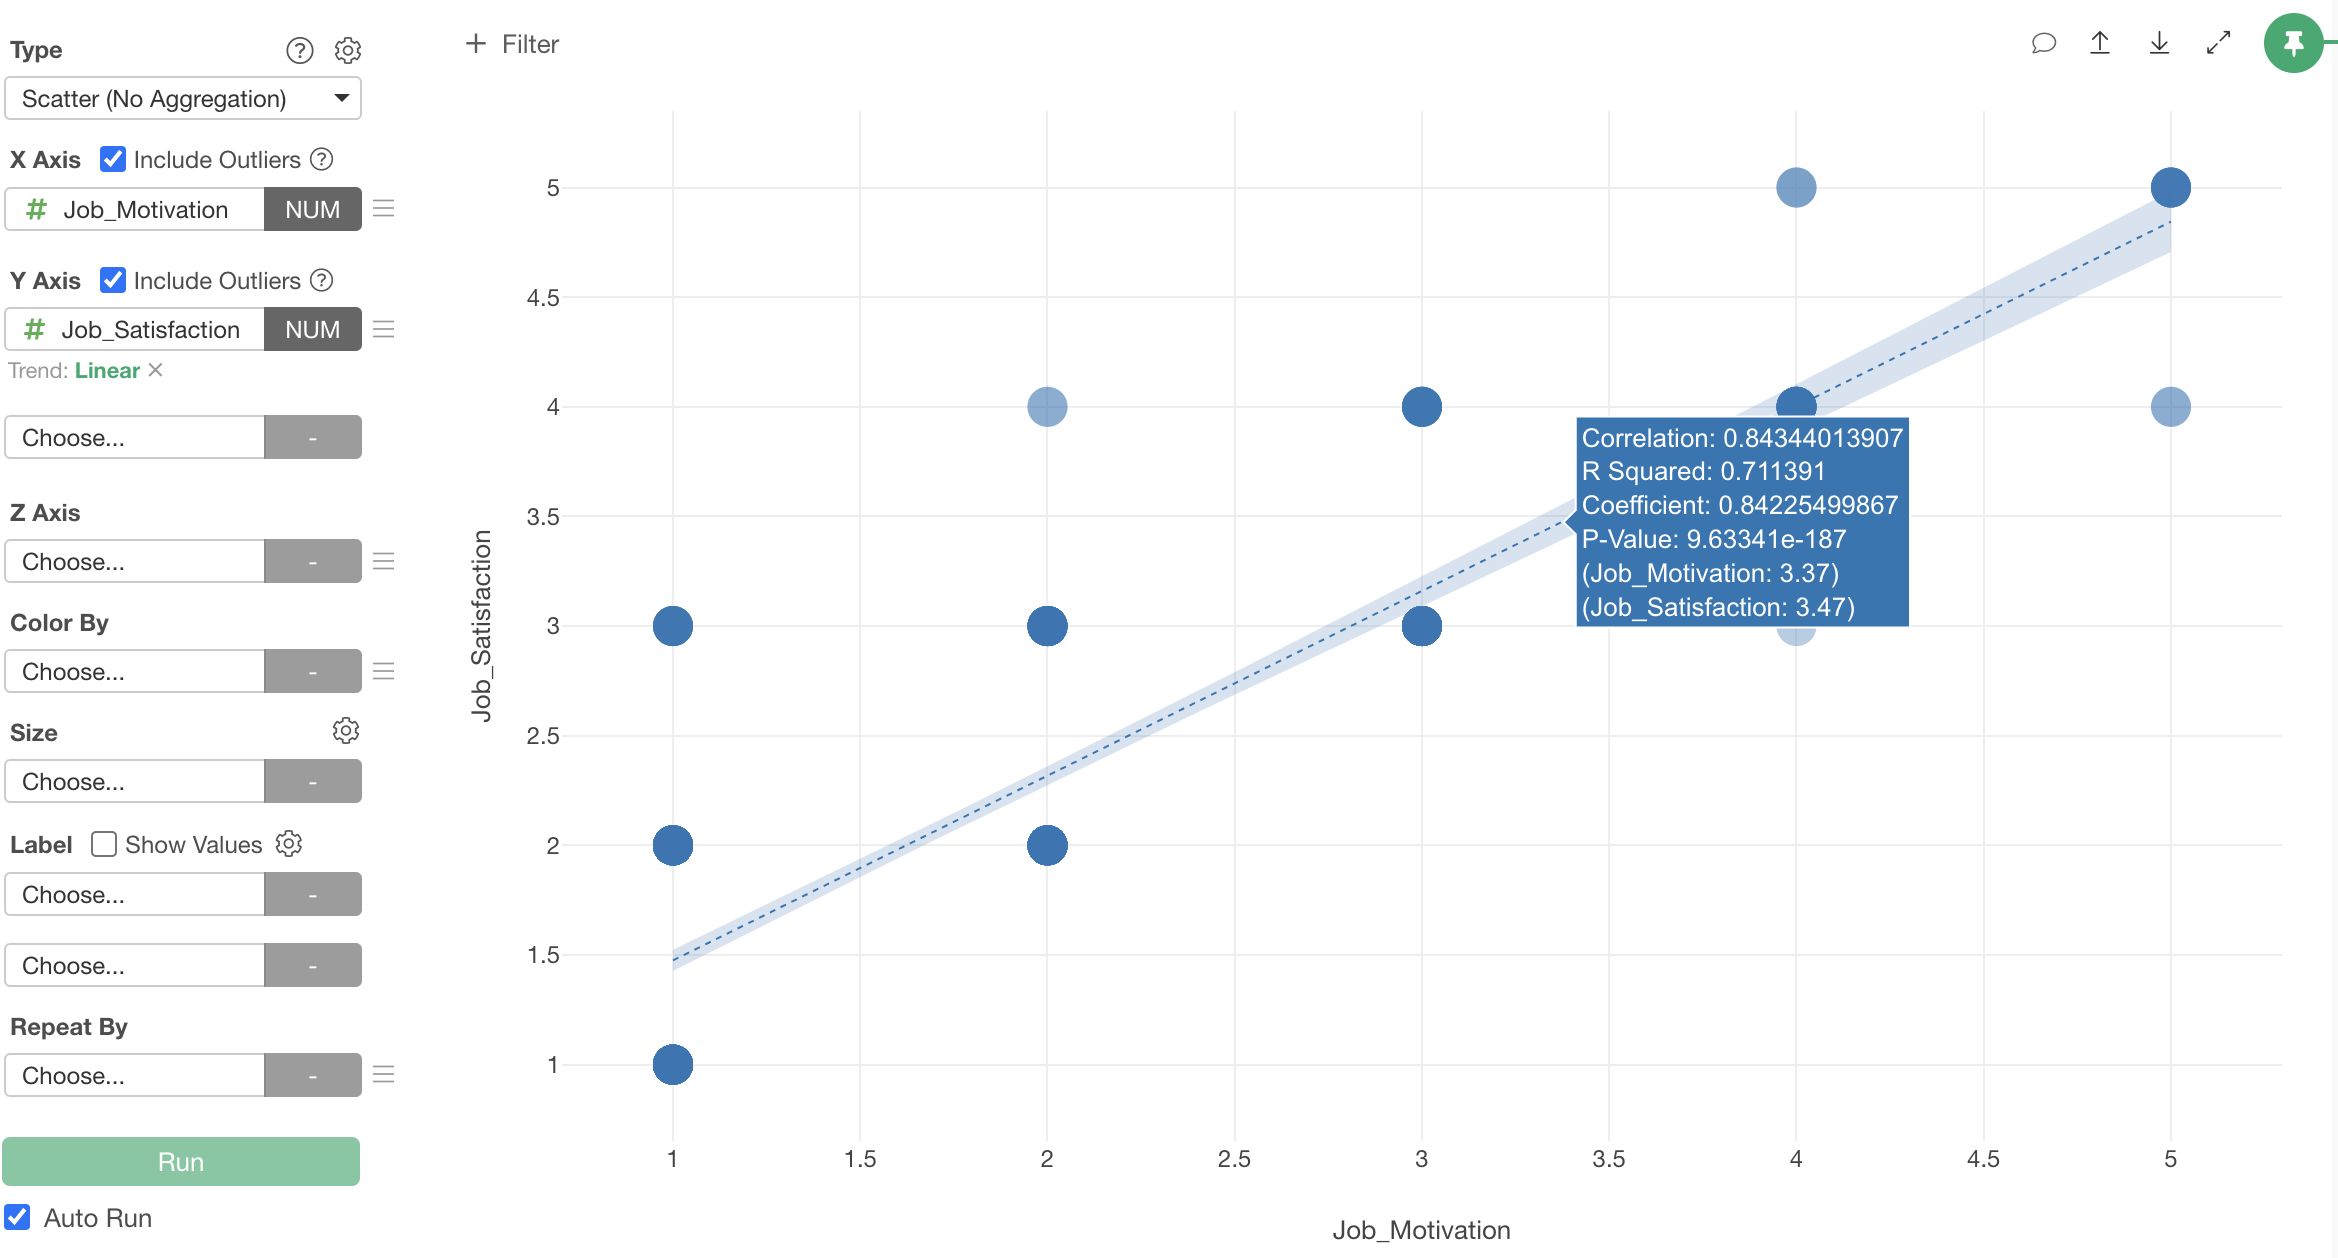
Wide format data is convenient for certain analyses, such as using scatter plots to examine correlations between two questions.
Other analytics commonly used when analyzing survey data that assume wide format data include:
- Correlation analysis
- Clustering
- Factor analysis
- Principal component analysis
- Predictive modeling
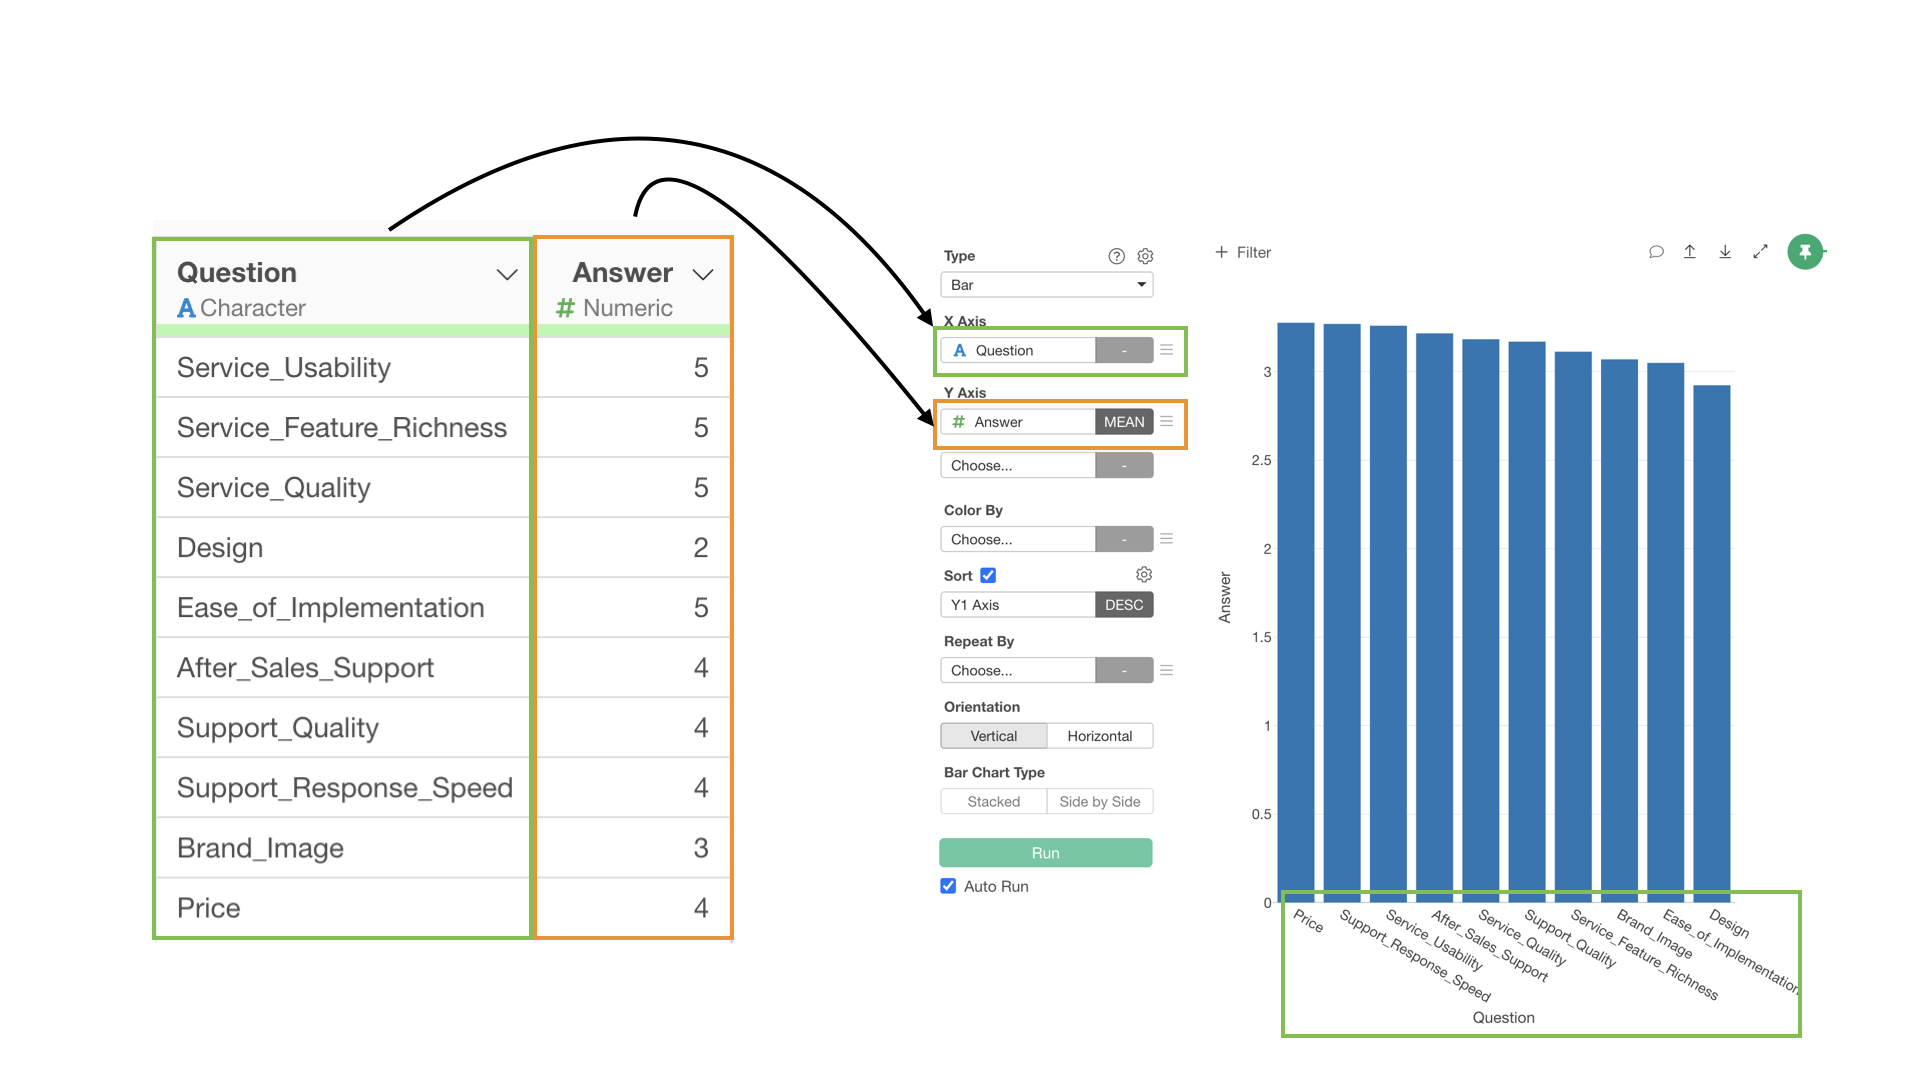
On the other hand, when aggregating or visualizing survey results, the “long format” data, where rows increase as the number of questions increases, is more convenient in terms of work efficiency and flexibility than the “wide format” data.
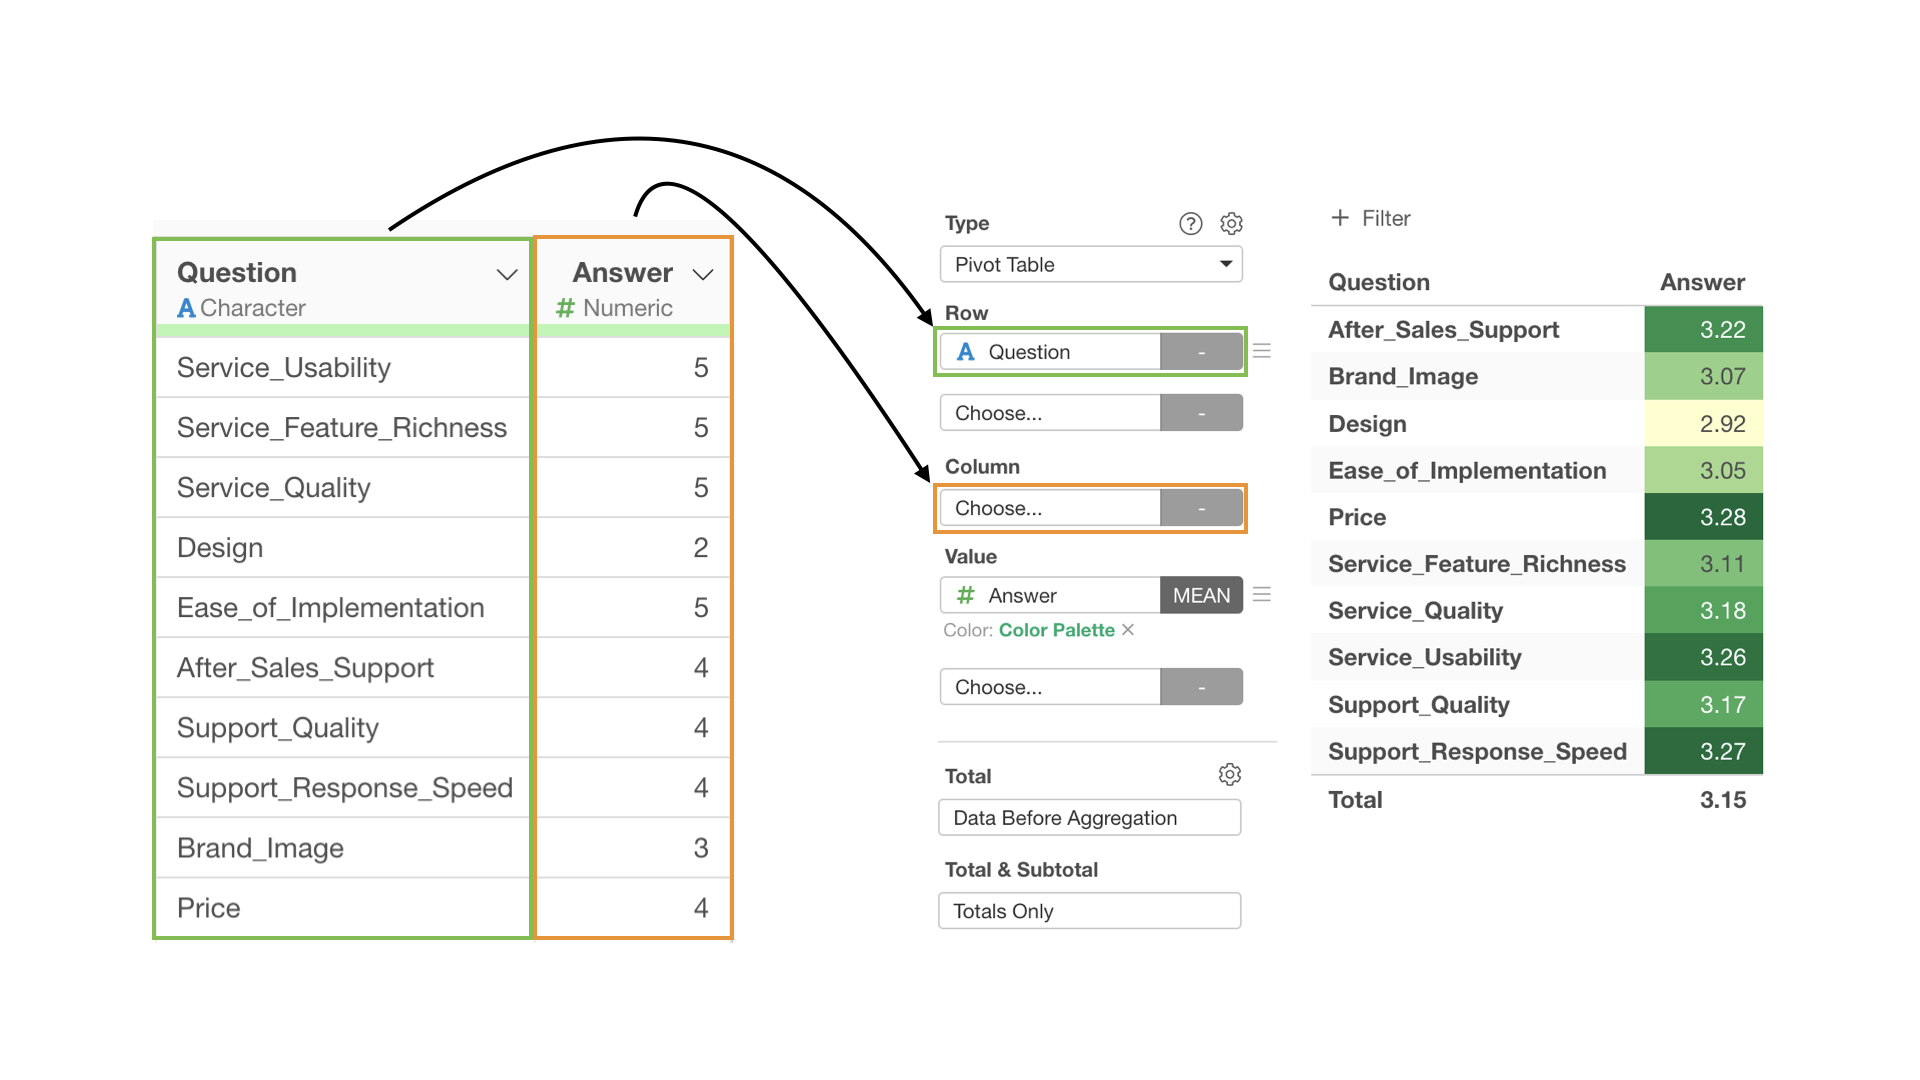
 This
is because with long format data, questions and answers are consolidated
in single columns, making it easy to aggregate all questions by simply
selecting the “question” column for rows and the “answer” numeric column
for values.
This
is because with long format data, questions and answers are consolidated
in single columns, making it easy to aggregate all questions by simply
selecting the “question” column for rows and the “answer” numeric column
for values.
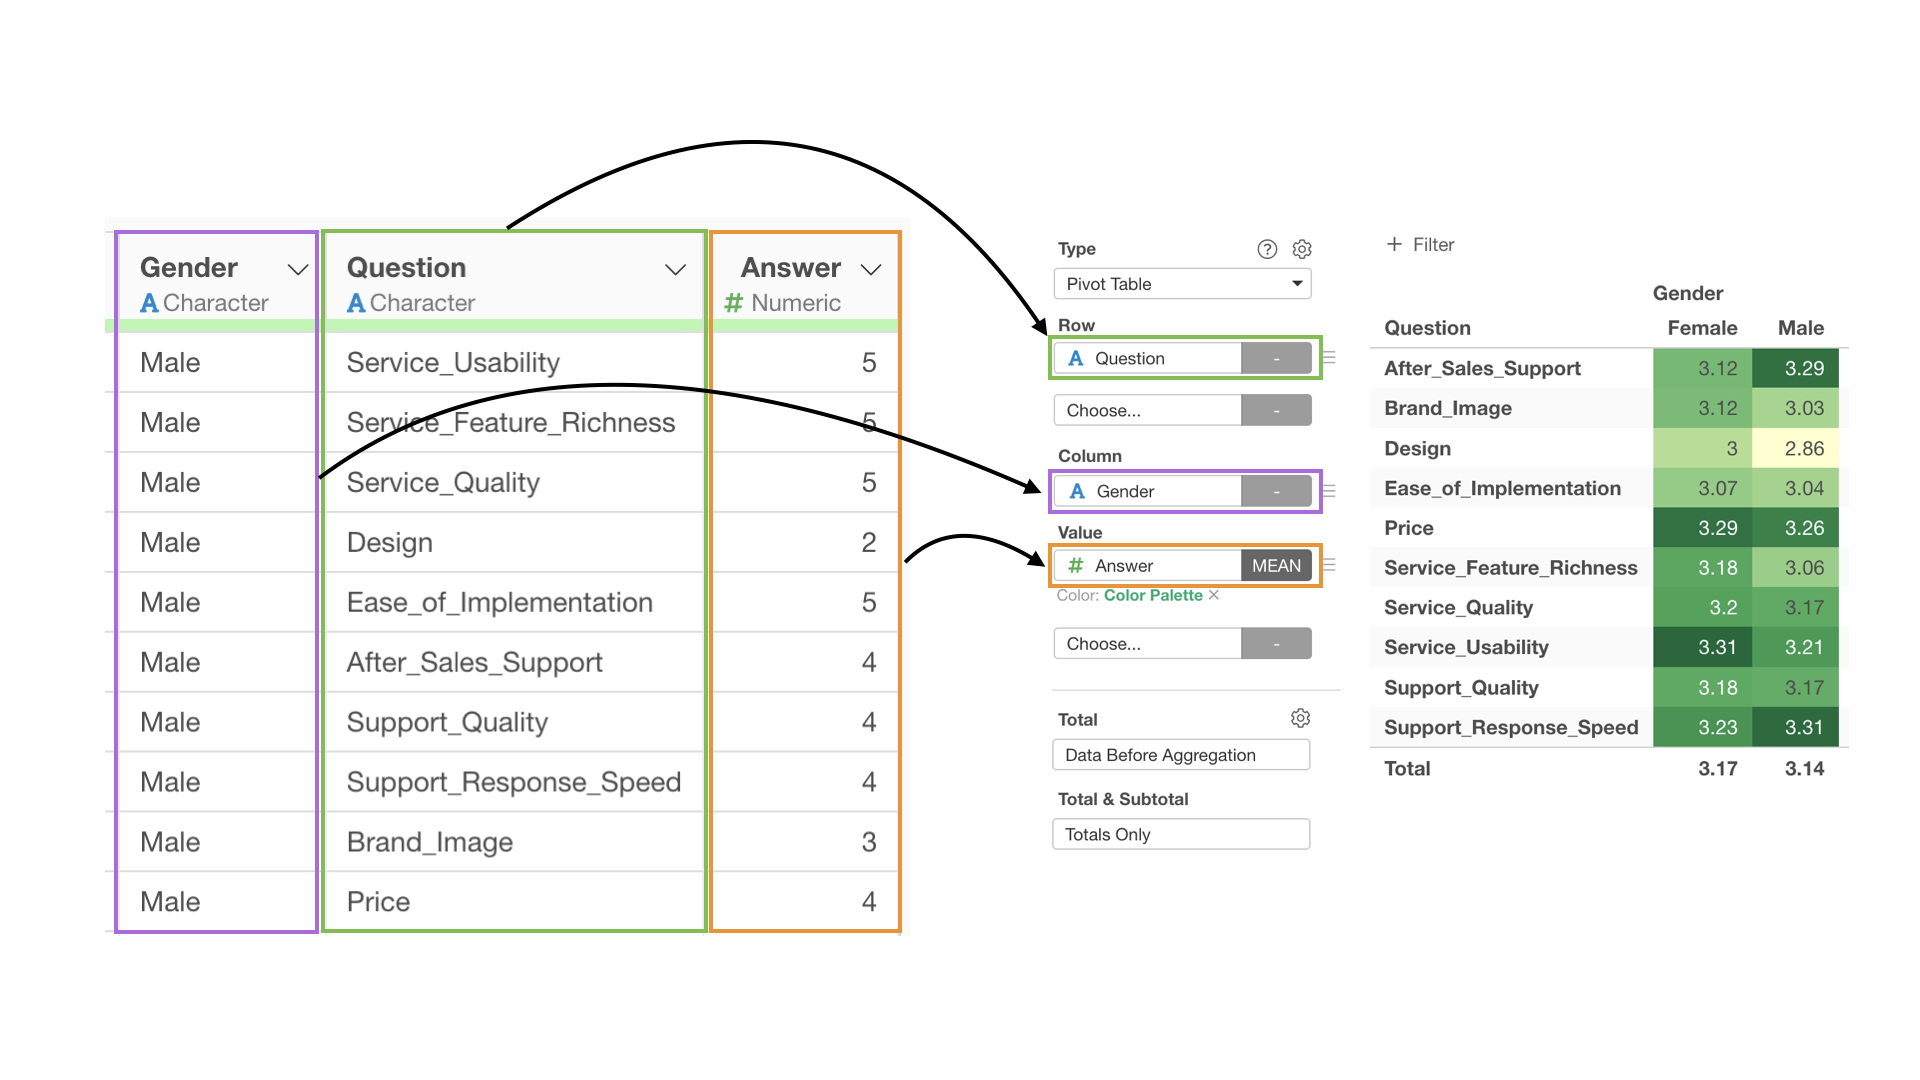
 Furthermore,
you can create cross-tabulation tables by selecting columns.
Furthermore,
you can create cross-tabulation tables by selecting columns.
 Or
you can easily visualize the distribution of responses for each
question.
Or
you can easily visualize the distribution of responses for each
question.
 From
here, we’ll convert wide format data to long format data to aggregate
and visualize survey responses.
From
here, we’ll convert wide format data to long format data to aggregate
and visualize survey responses.
1. Import Data
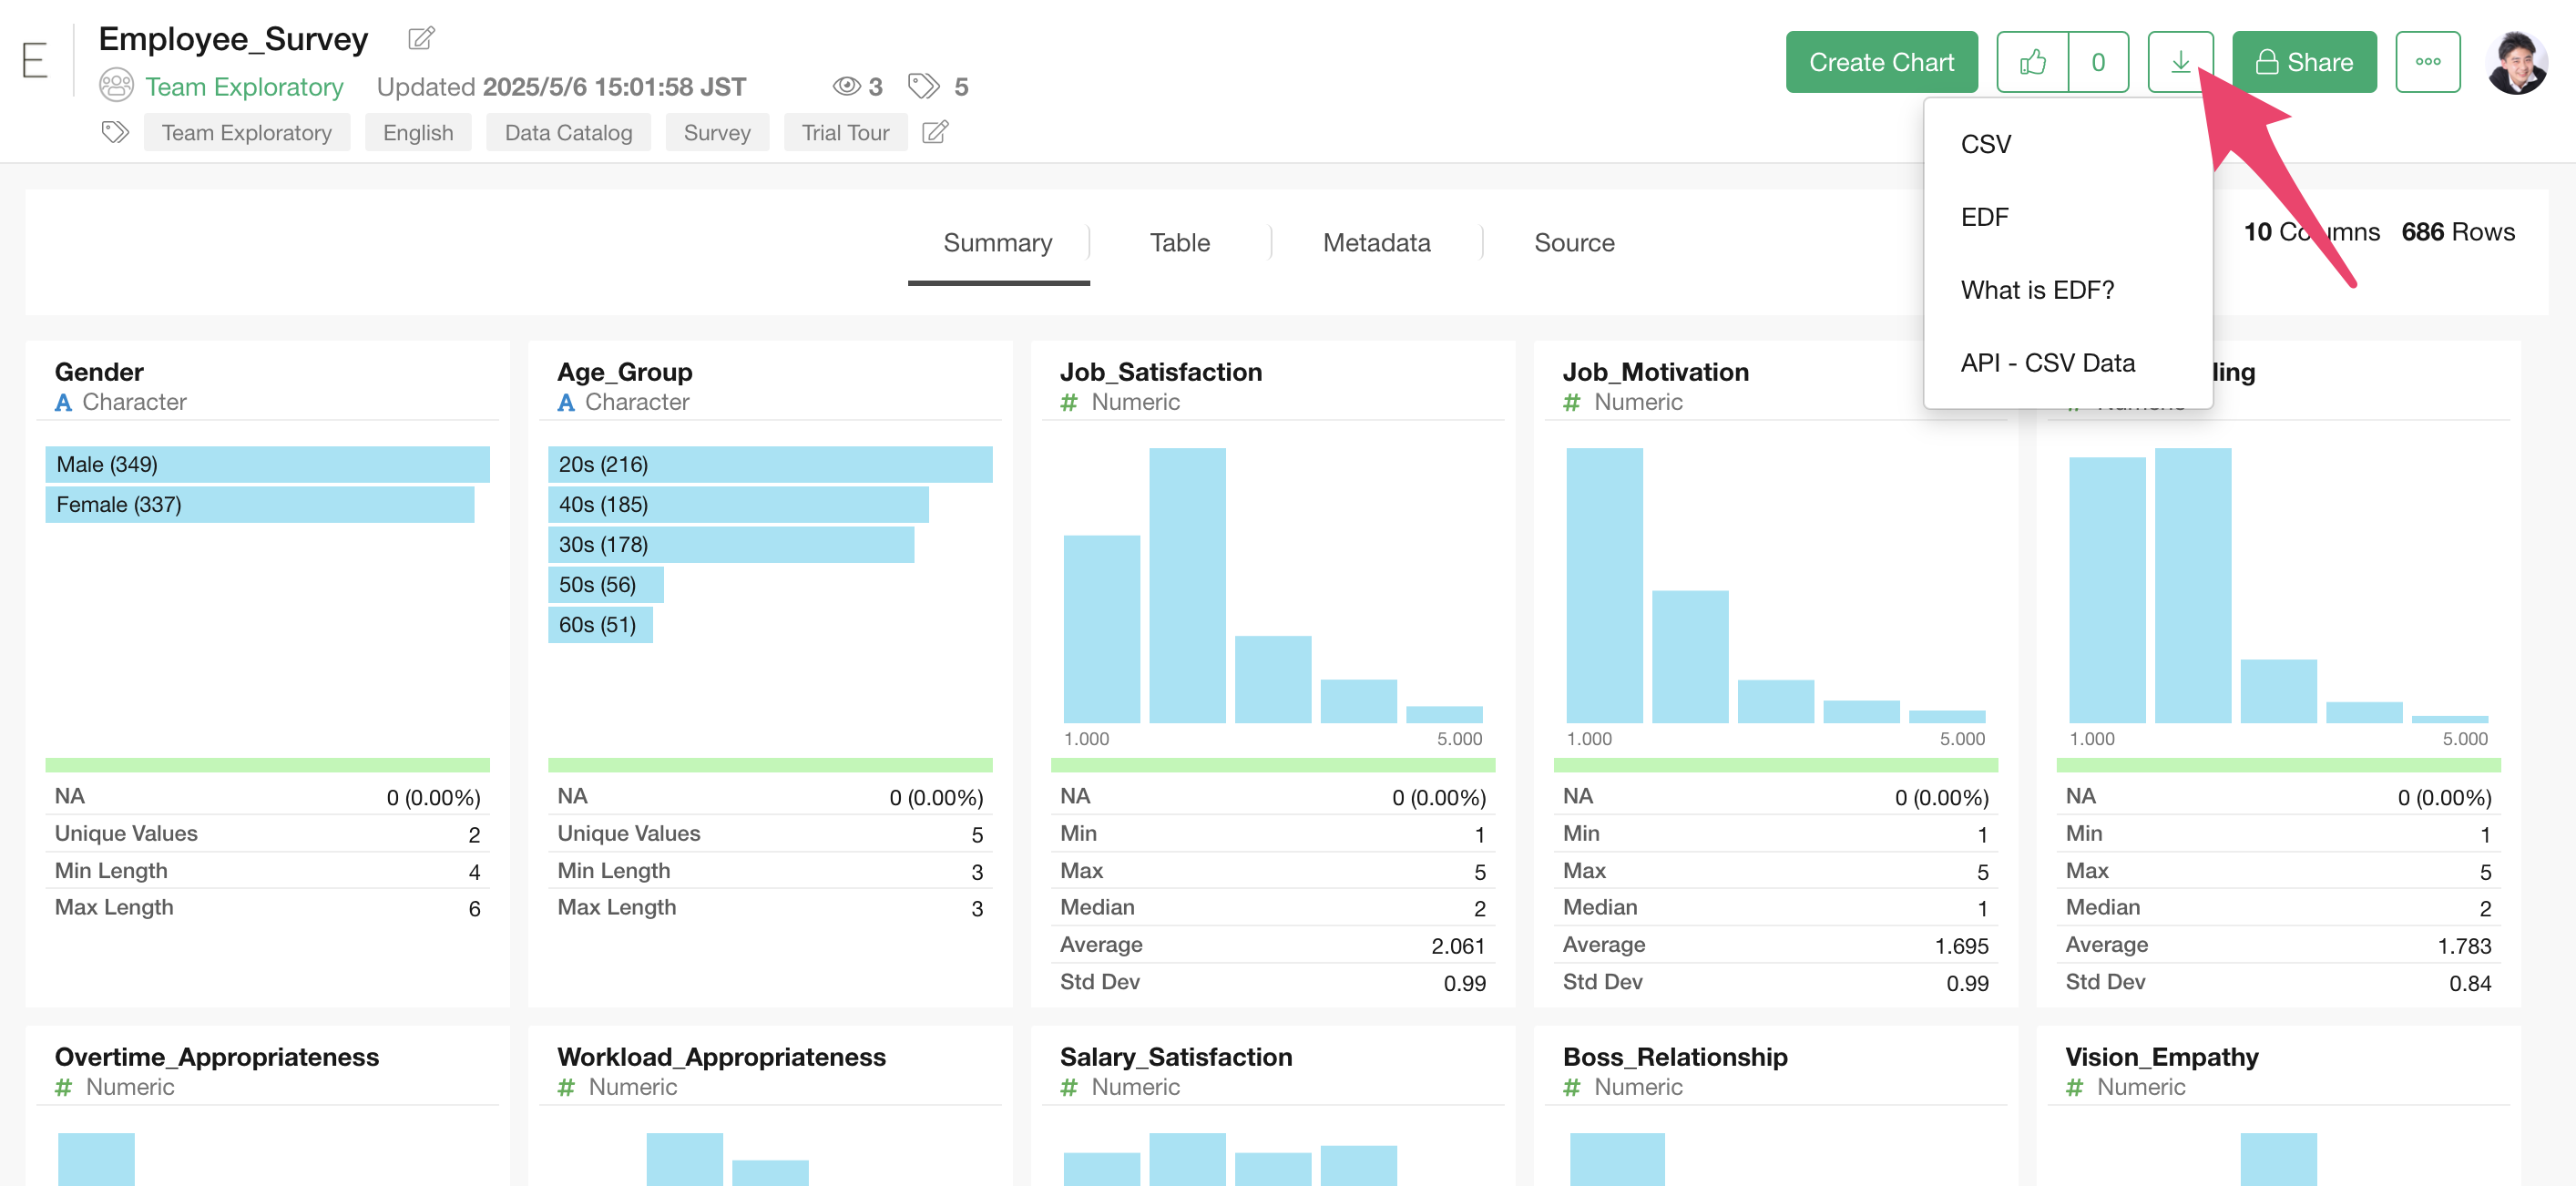
For this exercise, we’ll use “Employee Survey” sample data. This data has one row per employee response, with columns containing information about employee gender, age group, and survey responses.
You can download the data from this page.
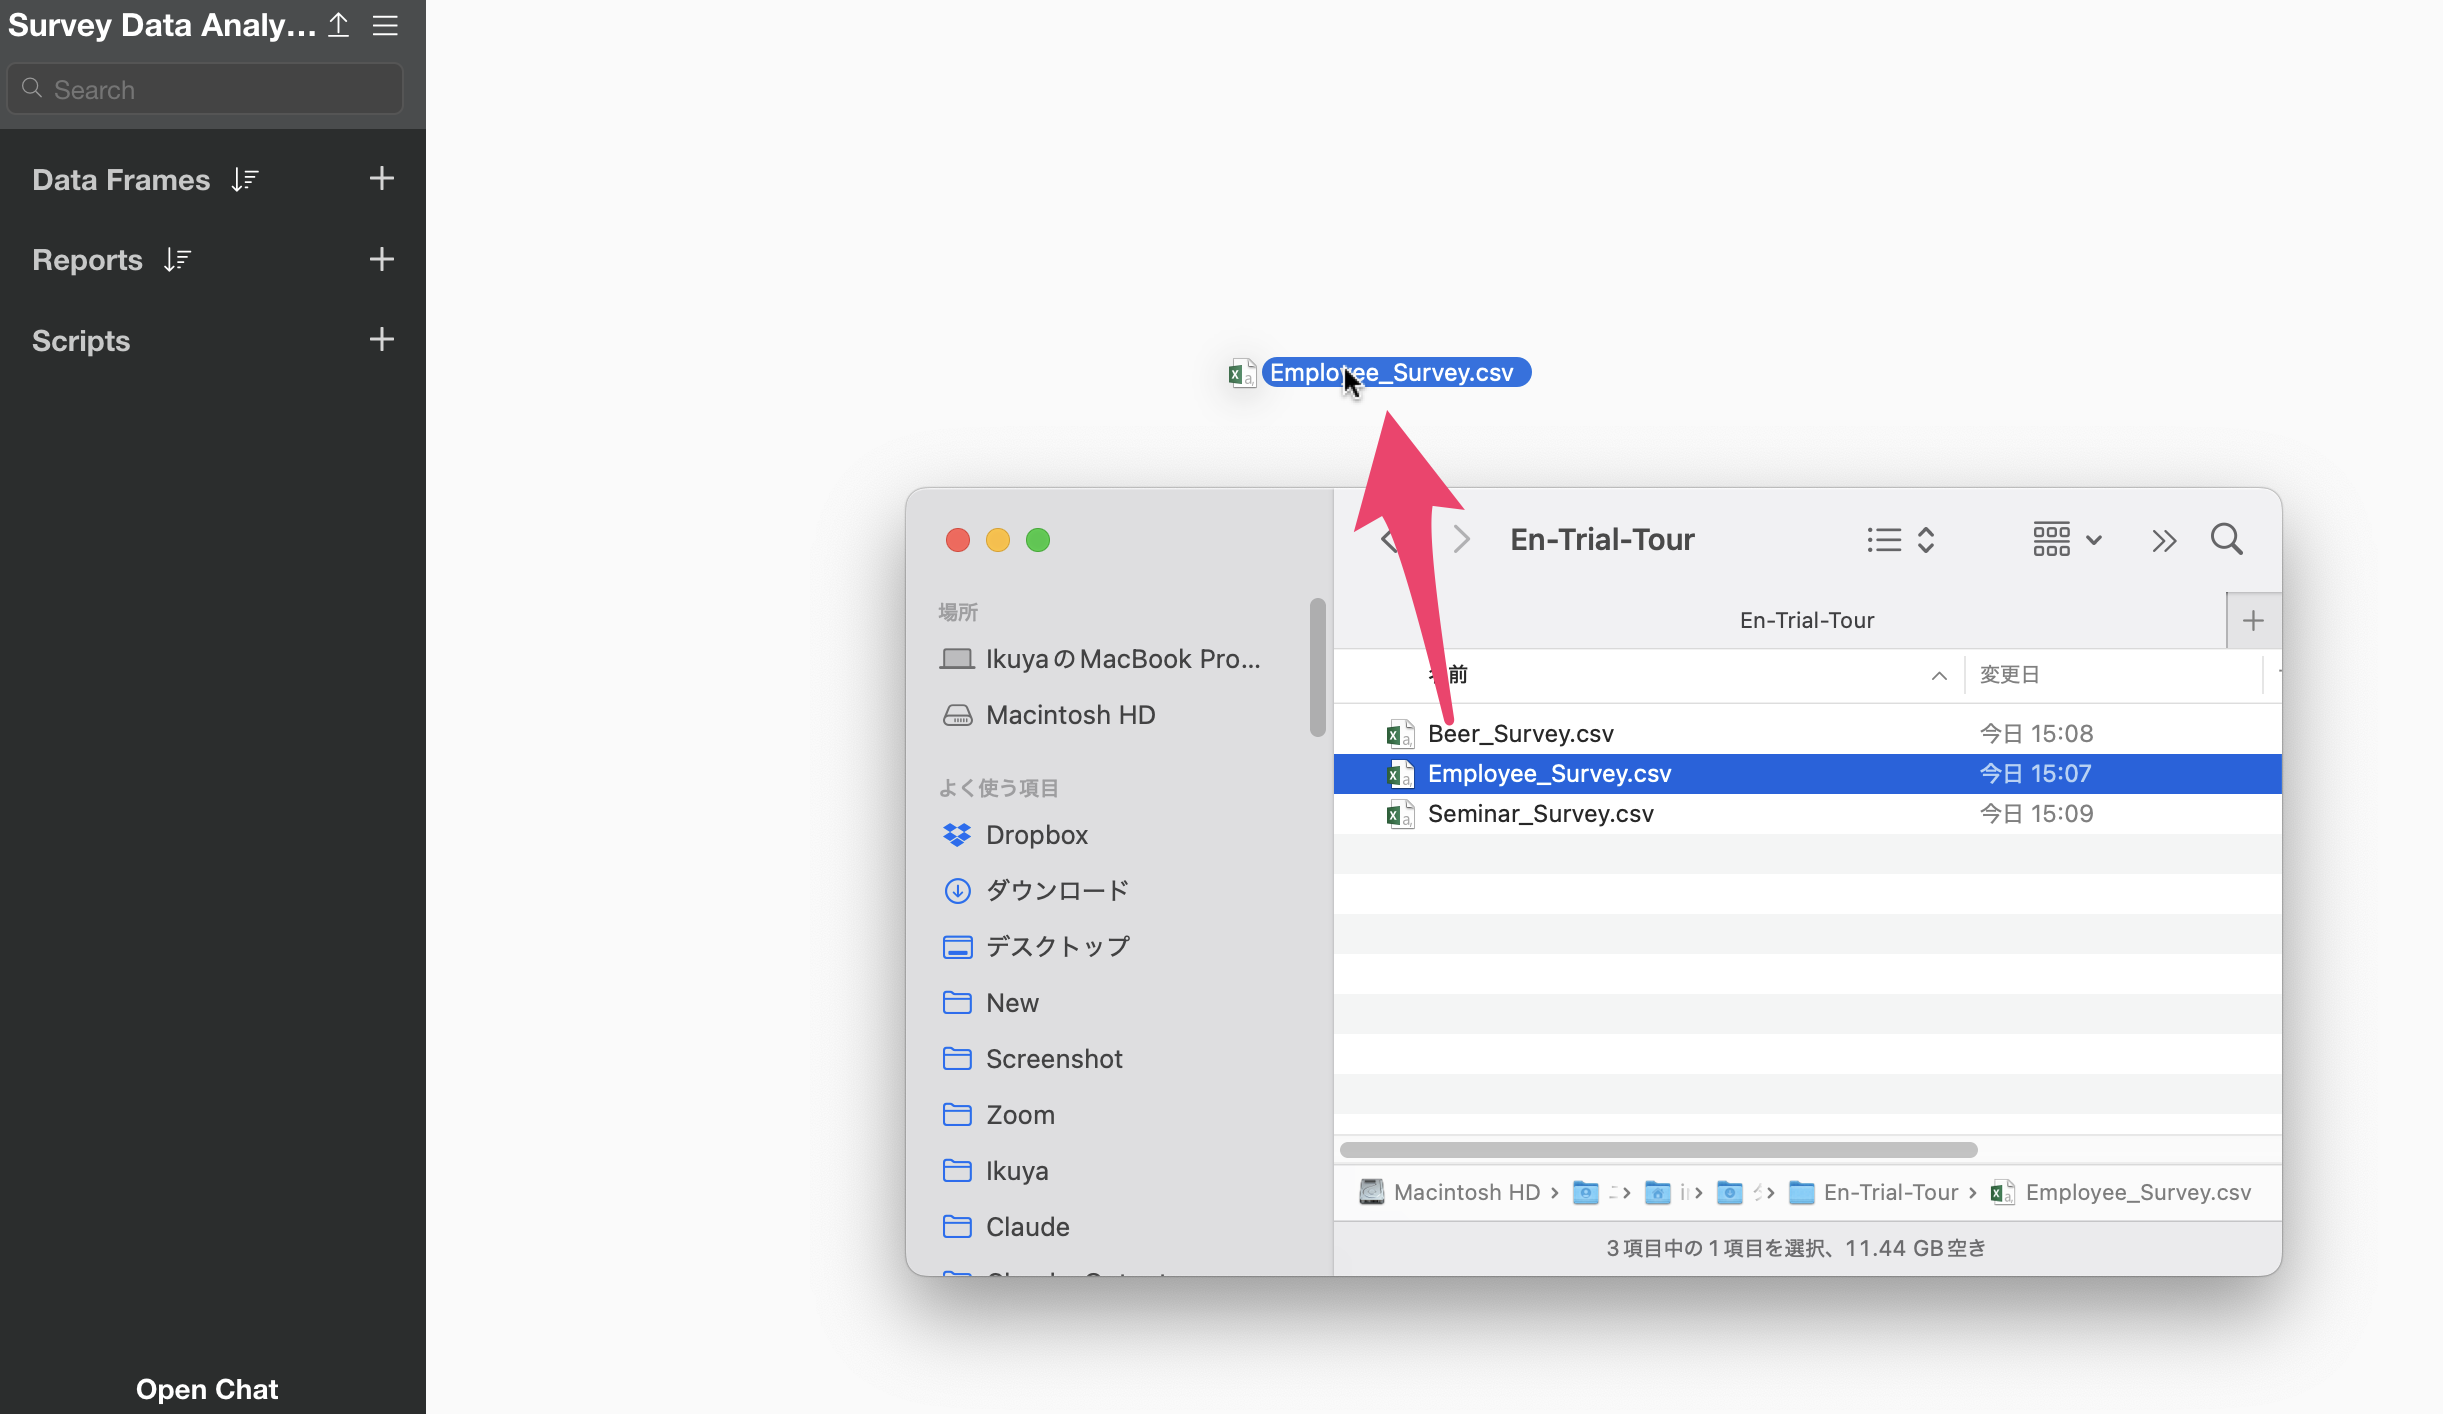
Once you’ve downloaded the employee survey data, open the download folder and drag and drop it onto the Exploratory screen.
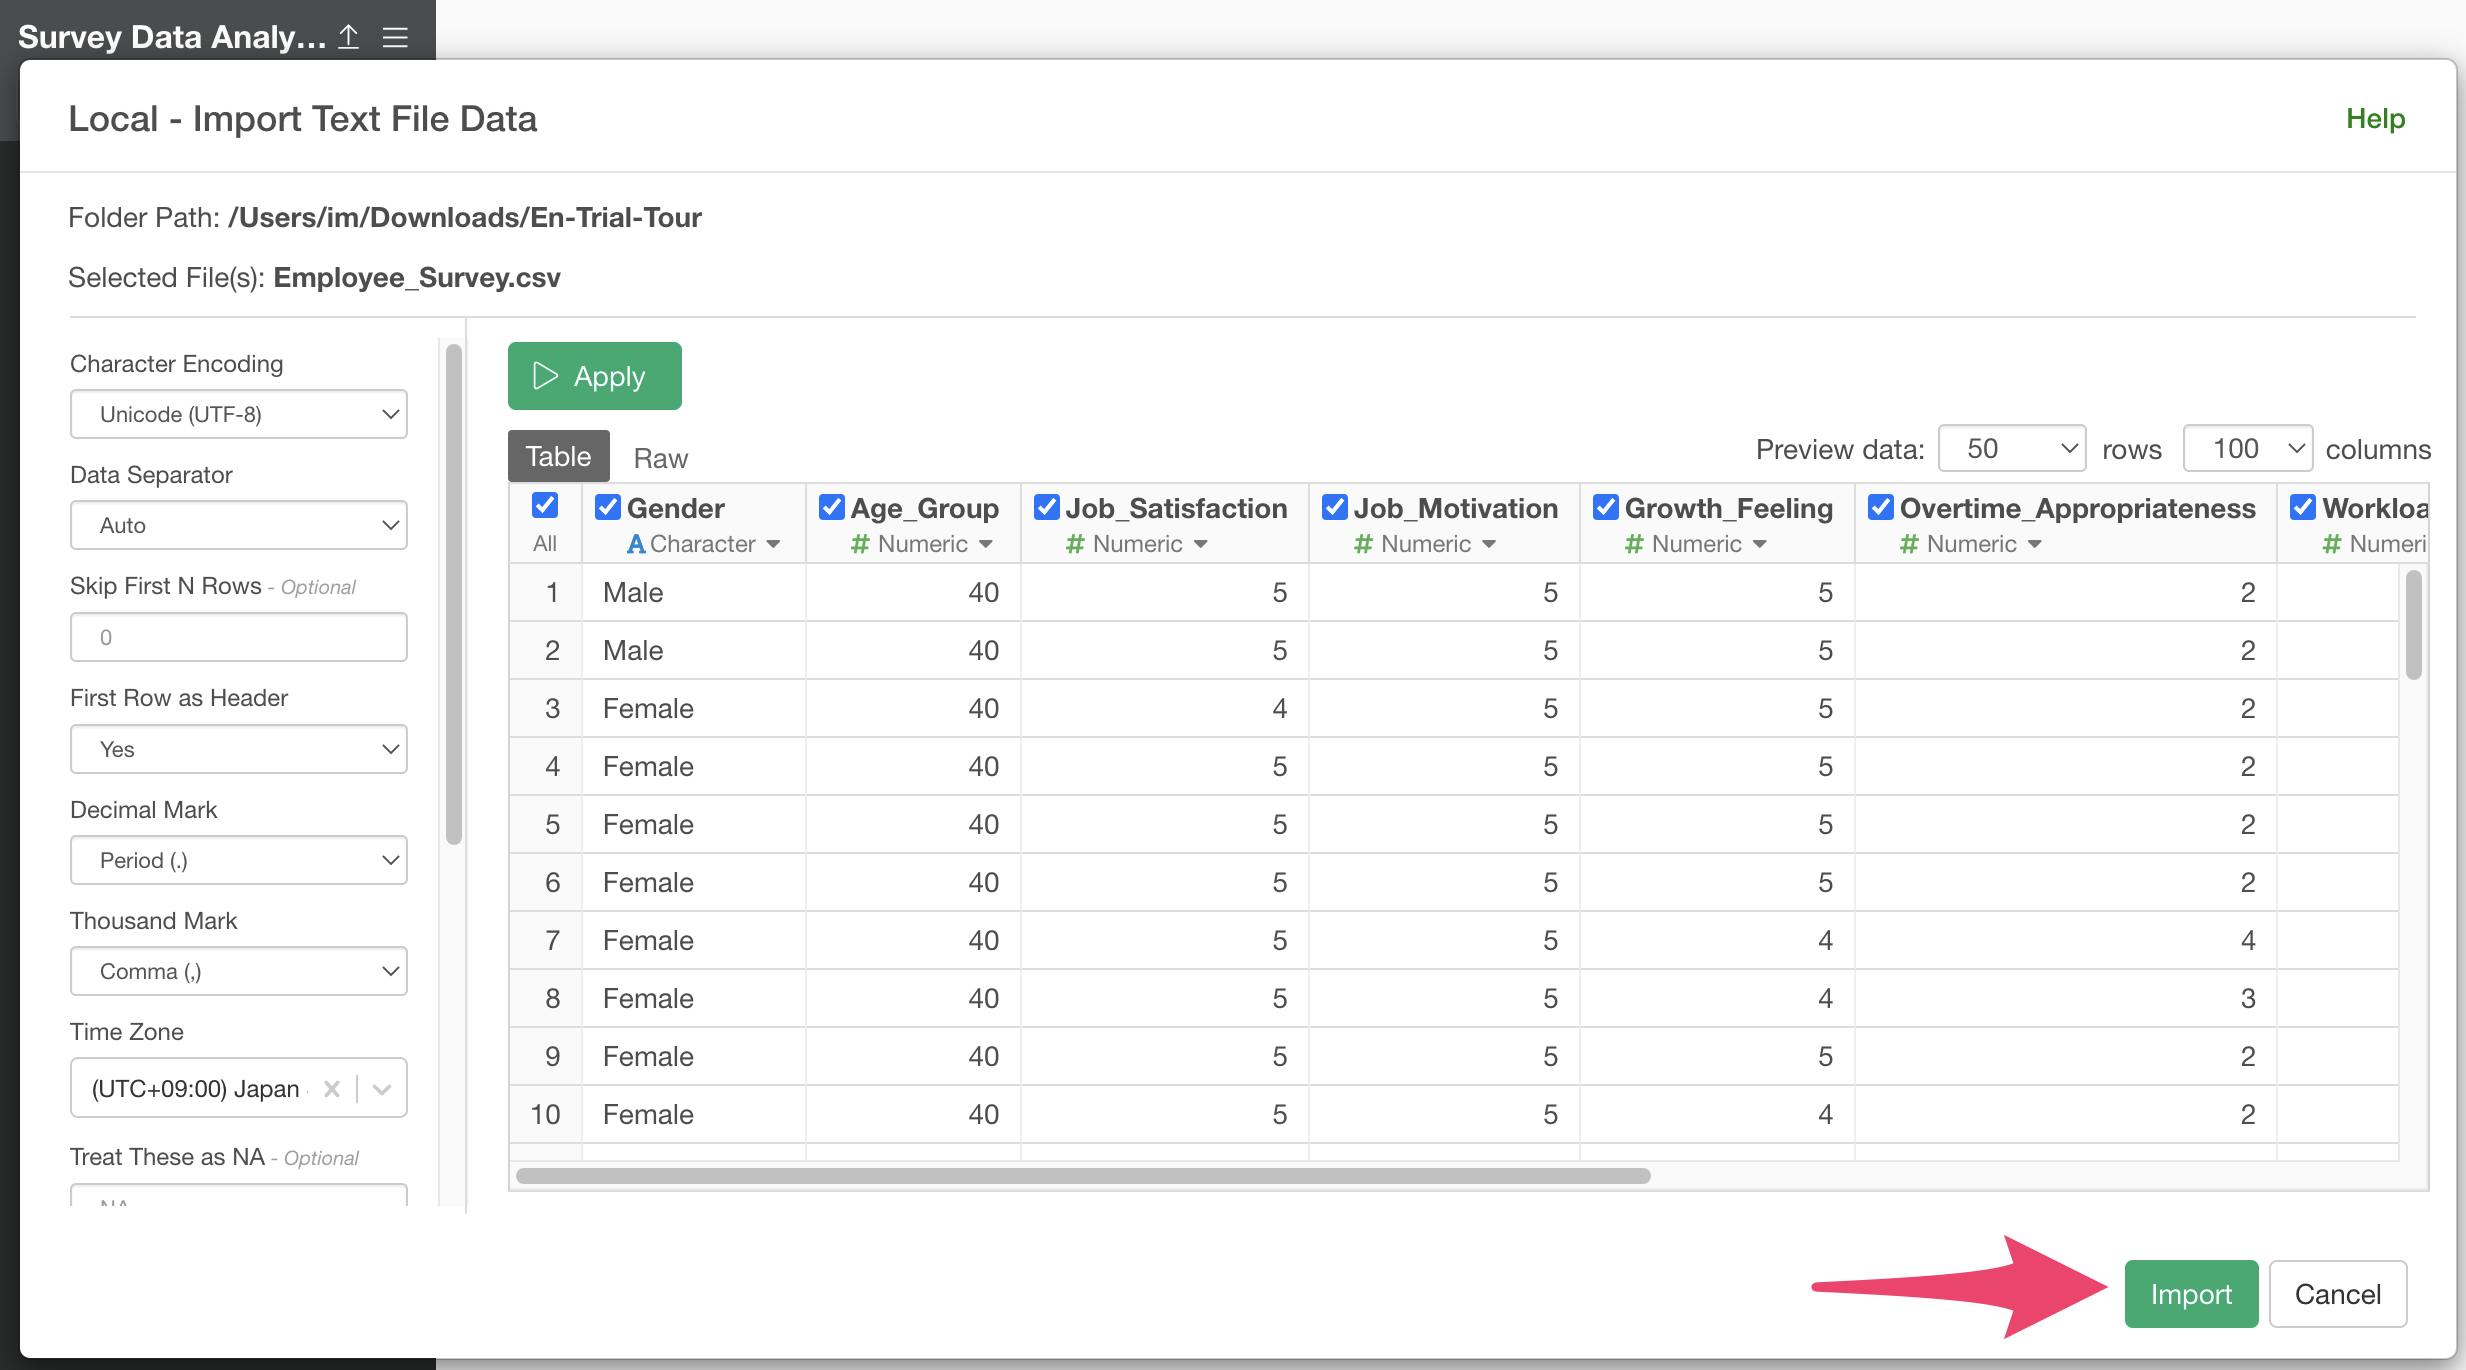
When the import dialog appears, no settings are needed for this exercise, so click the “Import” button.
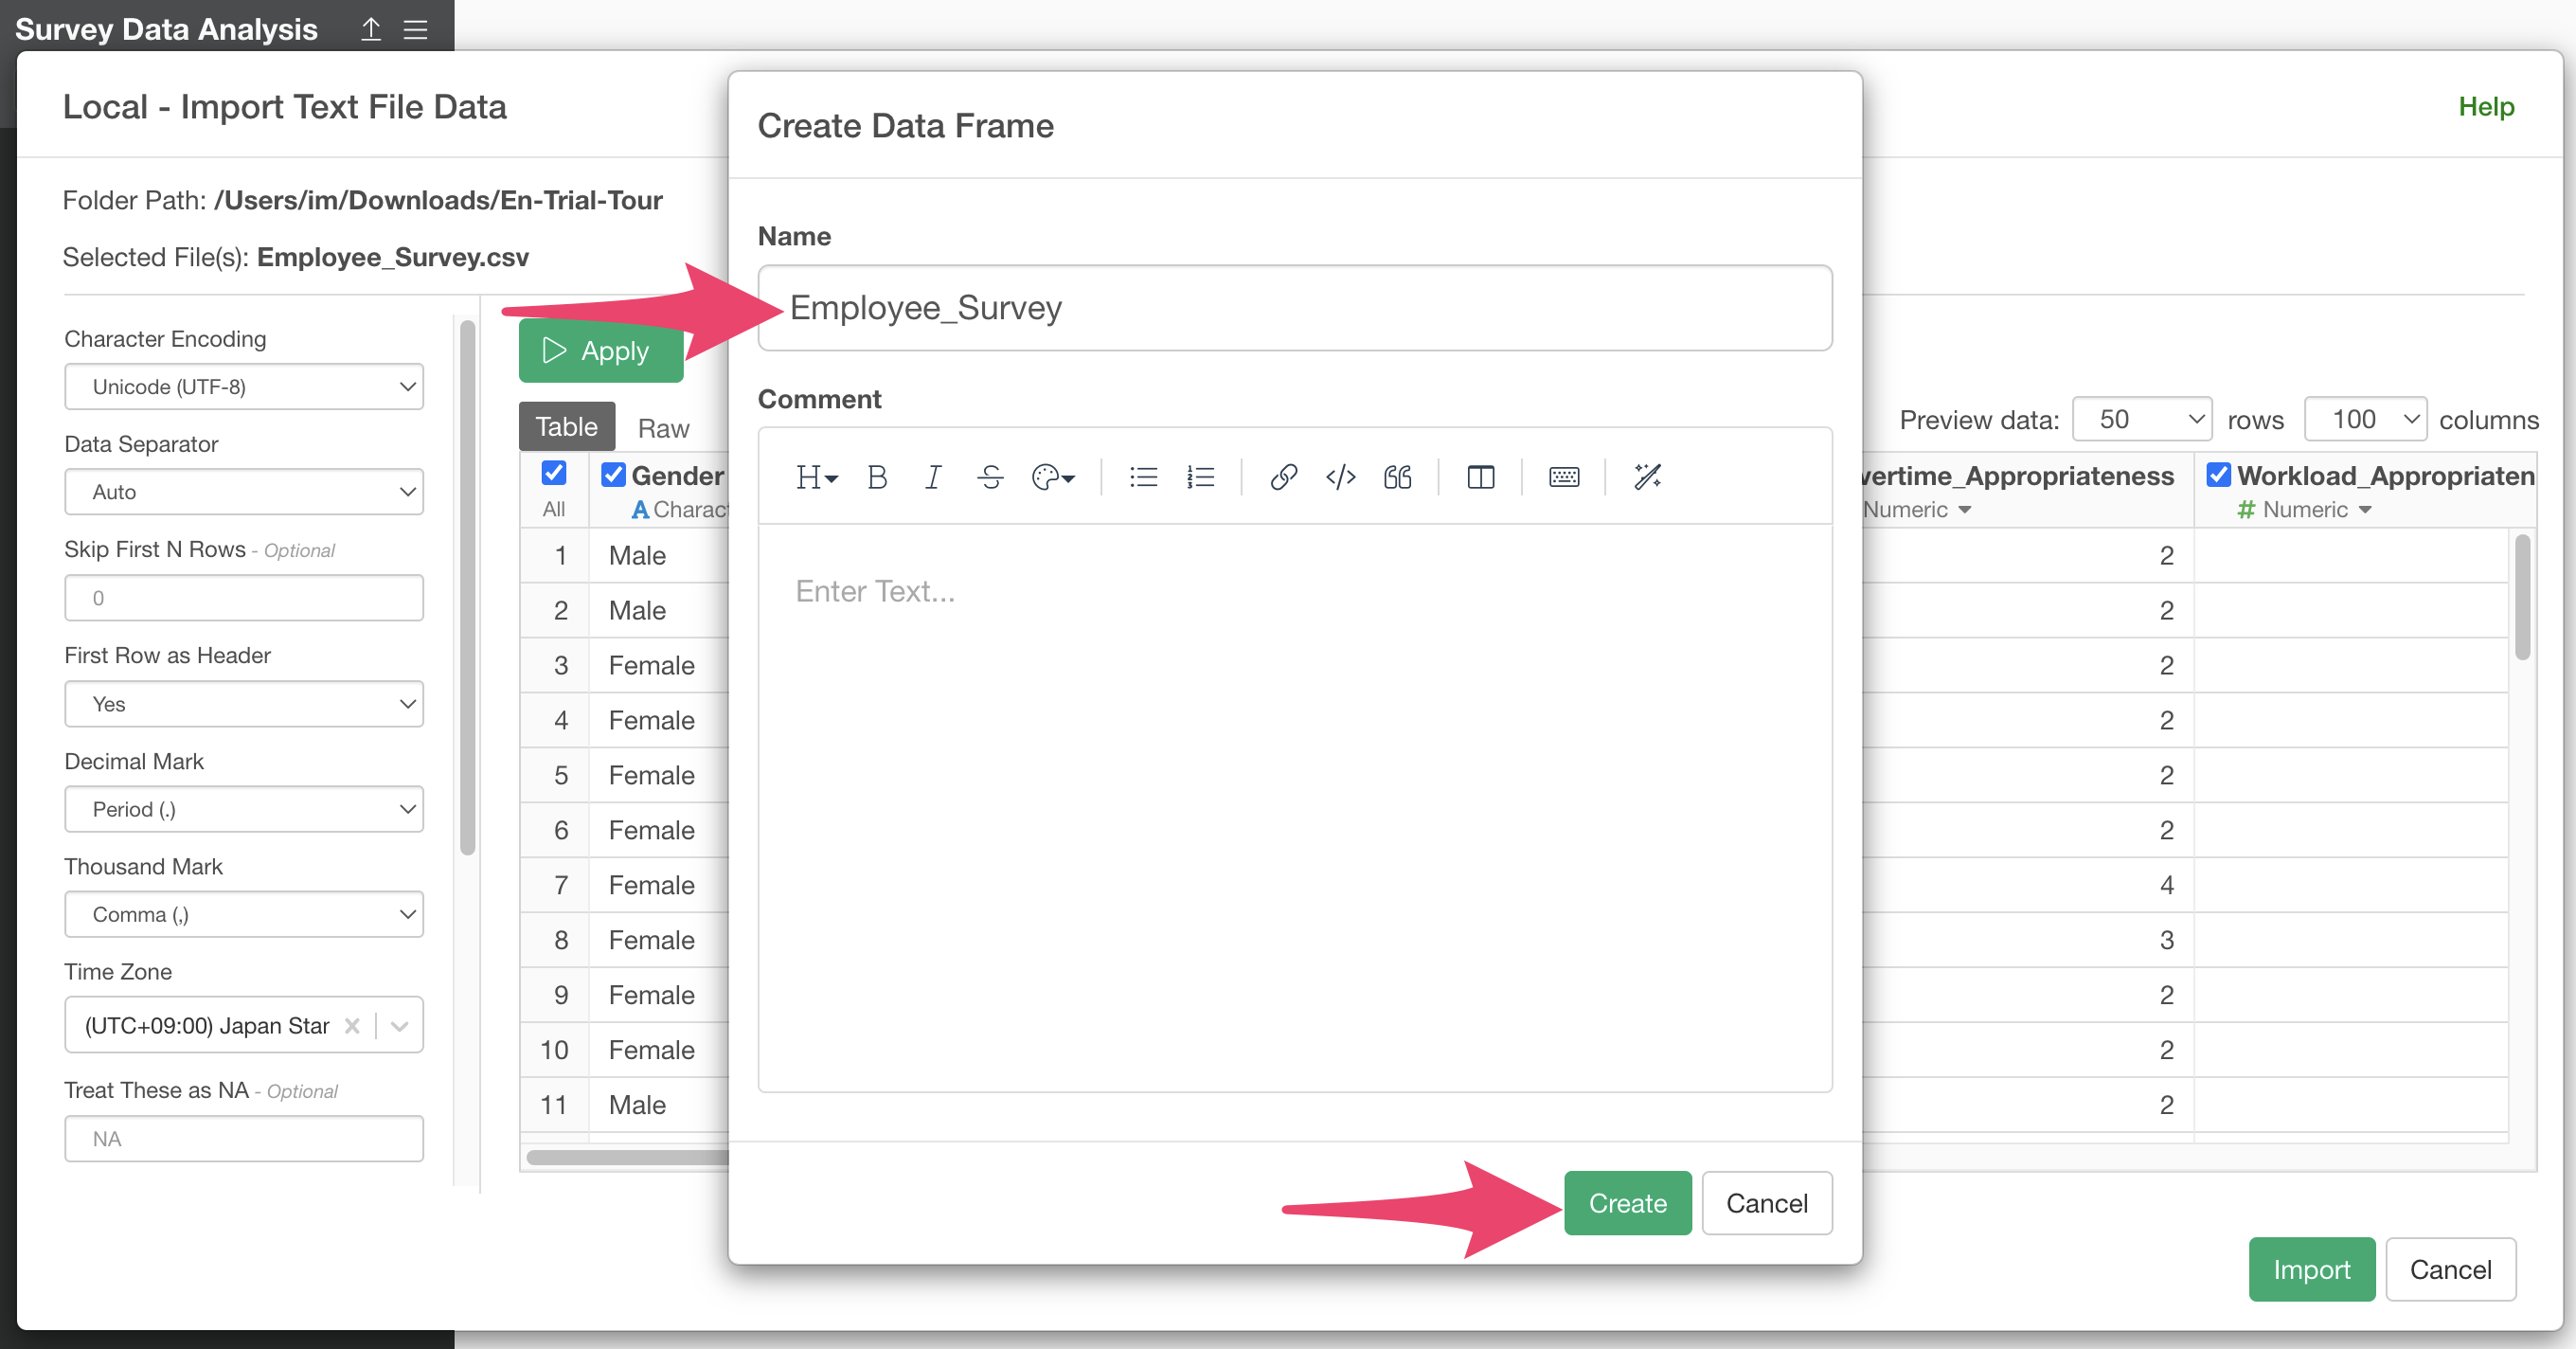
Specify any data frame name and click the “Create” button.
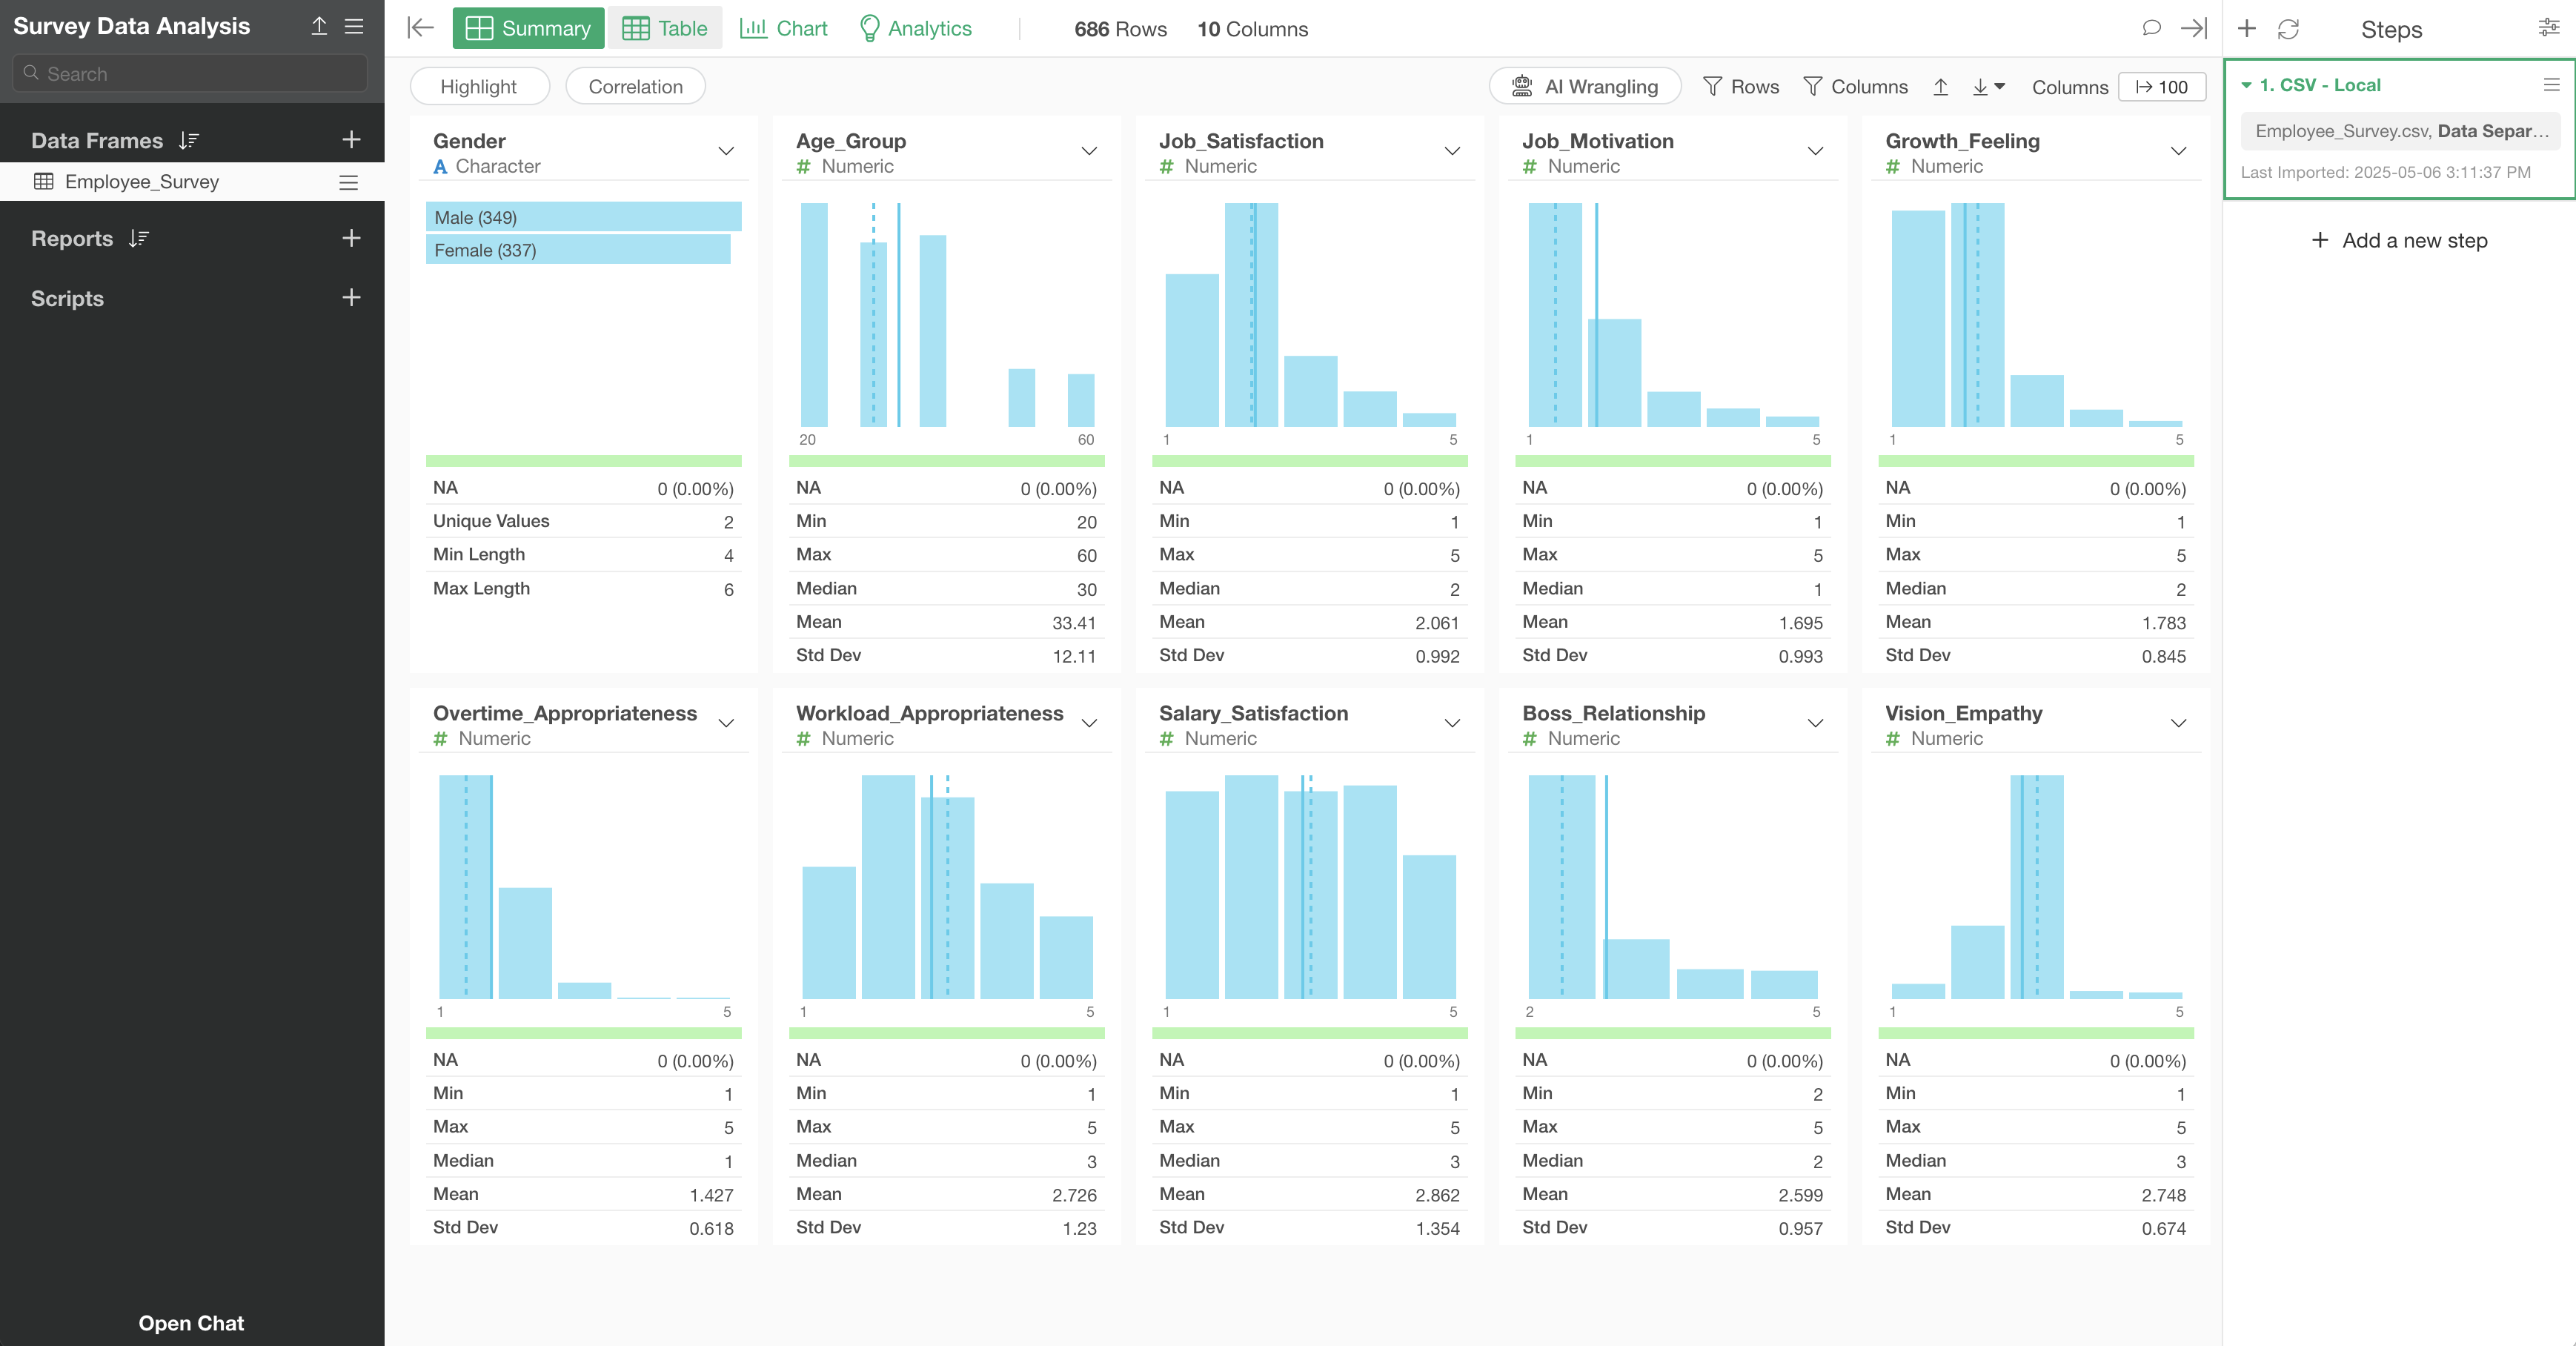
The employee survey data has been successfully imported.
2. Convert Wide Format Data to Long Format
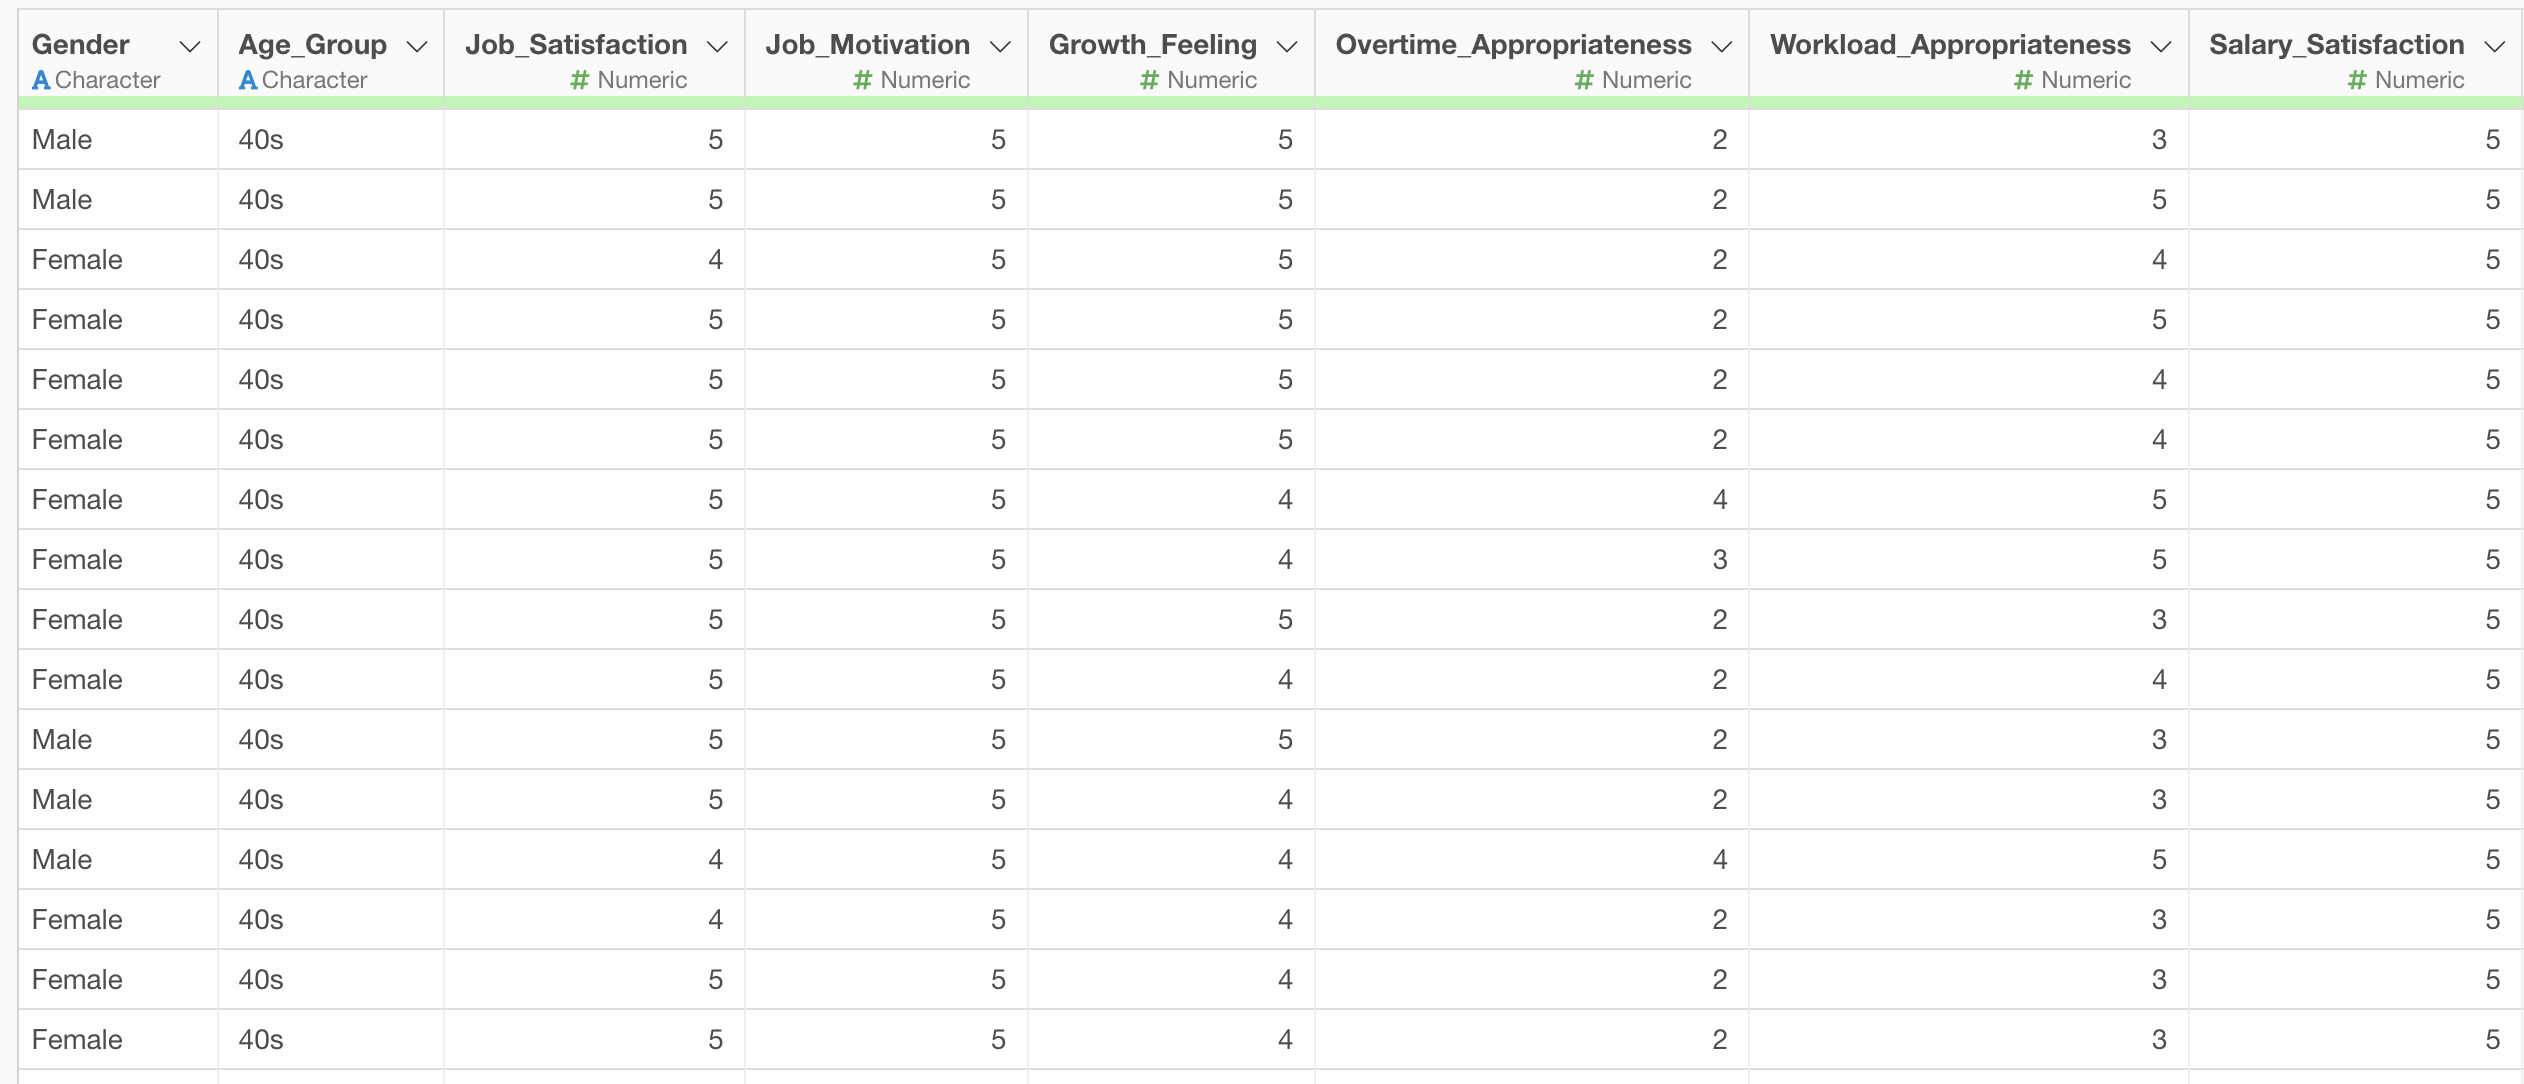
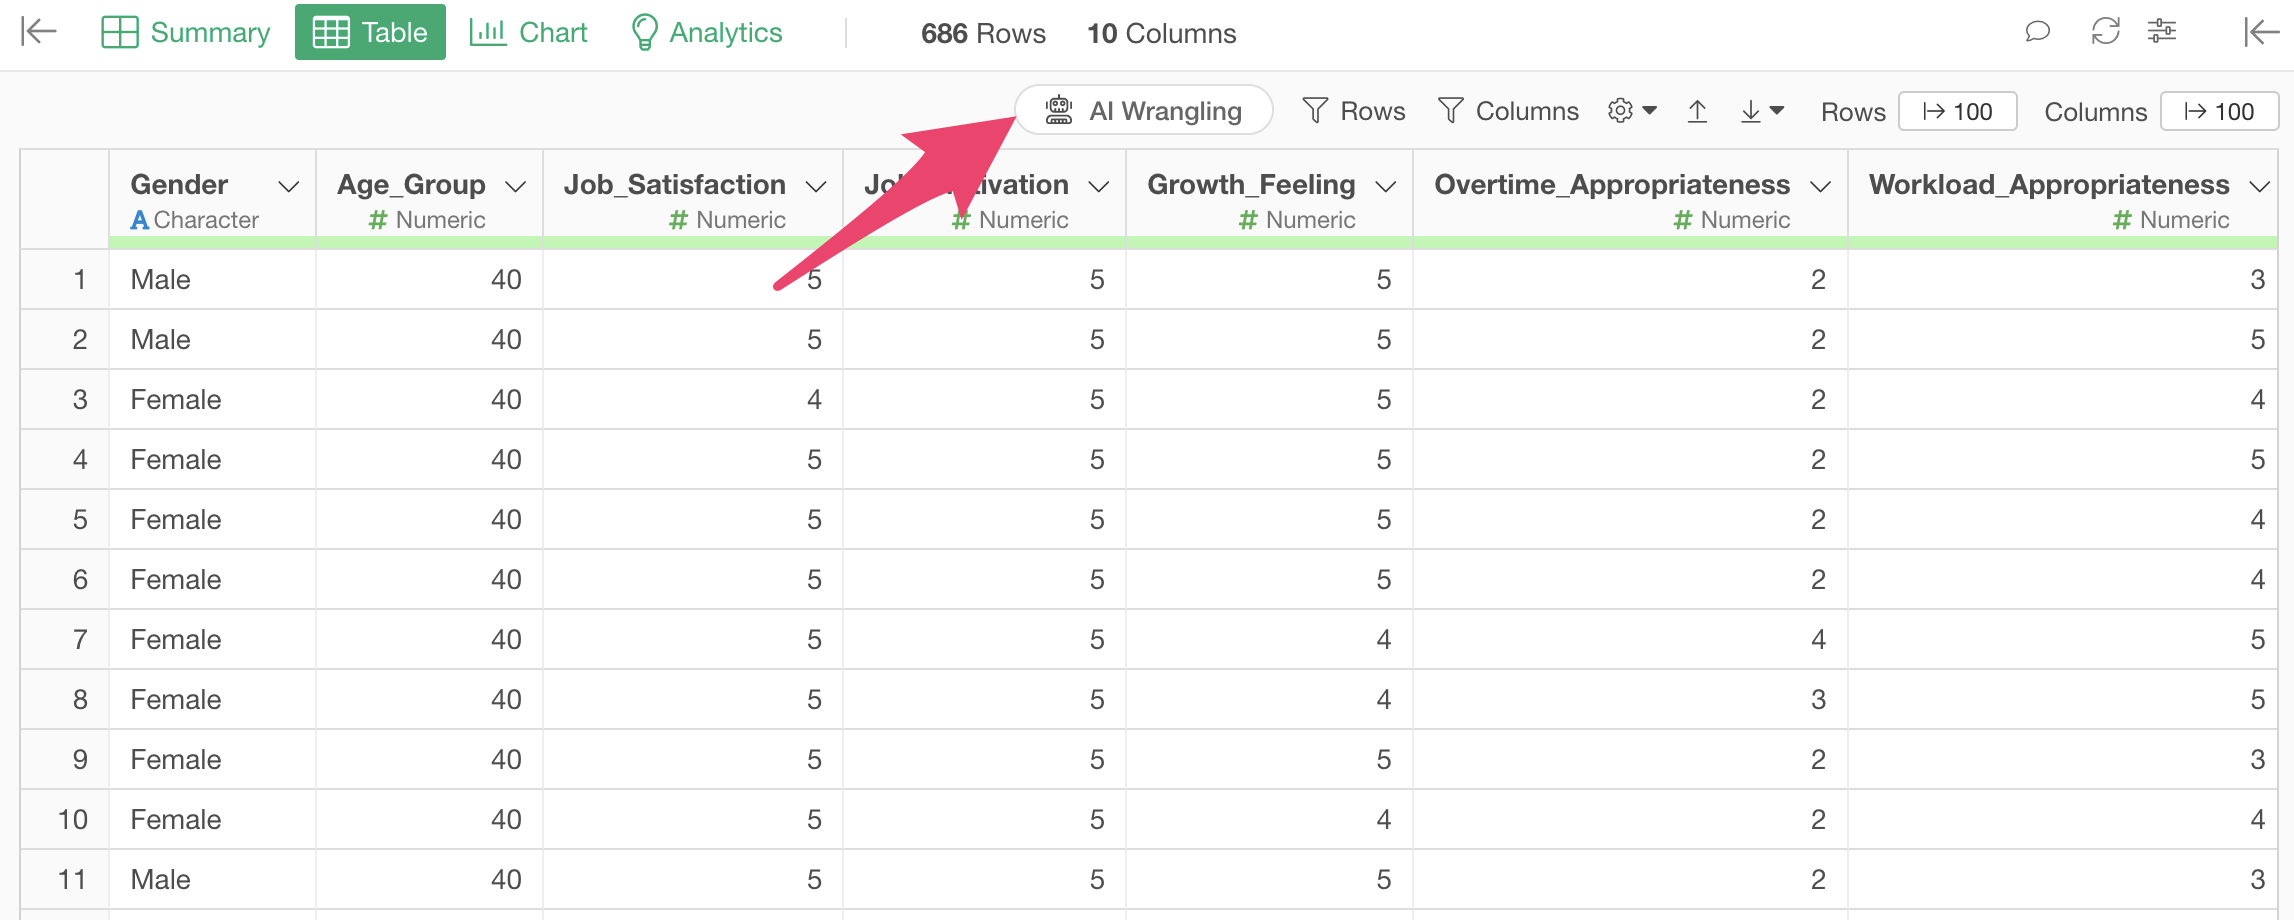
Moving to the Table view, you can see that this data is in wide format, with one row representing one respondent.
Now, we’ll convert this wide format data to long format to make it easier to aggregate the survey data.
We’ll introduce two methods: using “AI Prompt” for natural language data processing and using the UI which is available to all users.
Convert Wide Format Data to Long Format Using AI Prompt
AI Prompt is a feature available only to users with paid licenses such as Business Plan or Personal Plan, and trial users of those plans.
If you don’t have one of these plans, please refer to the “Convert Wide Format Data to Long Format Using UI” section.
To convert wide format data to long format using AI Prompt, click the “AI Wrangling” button.
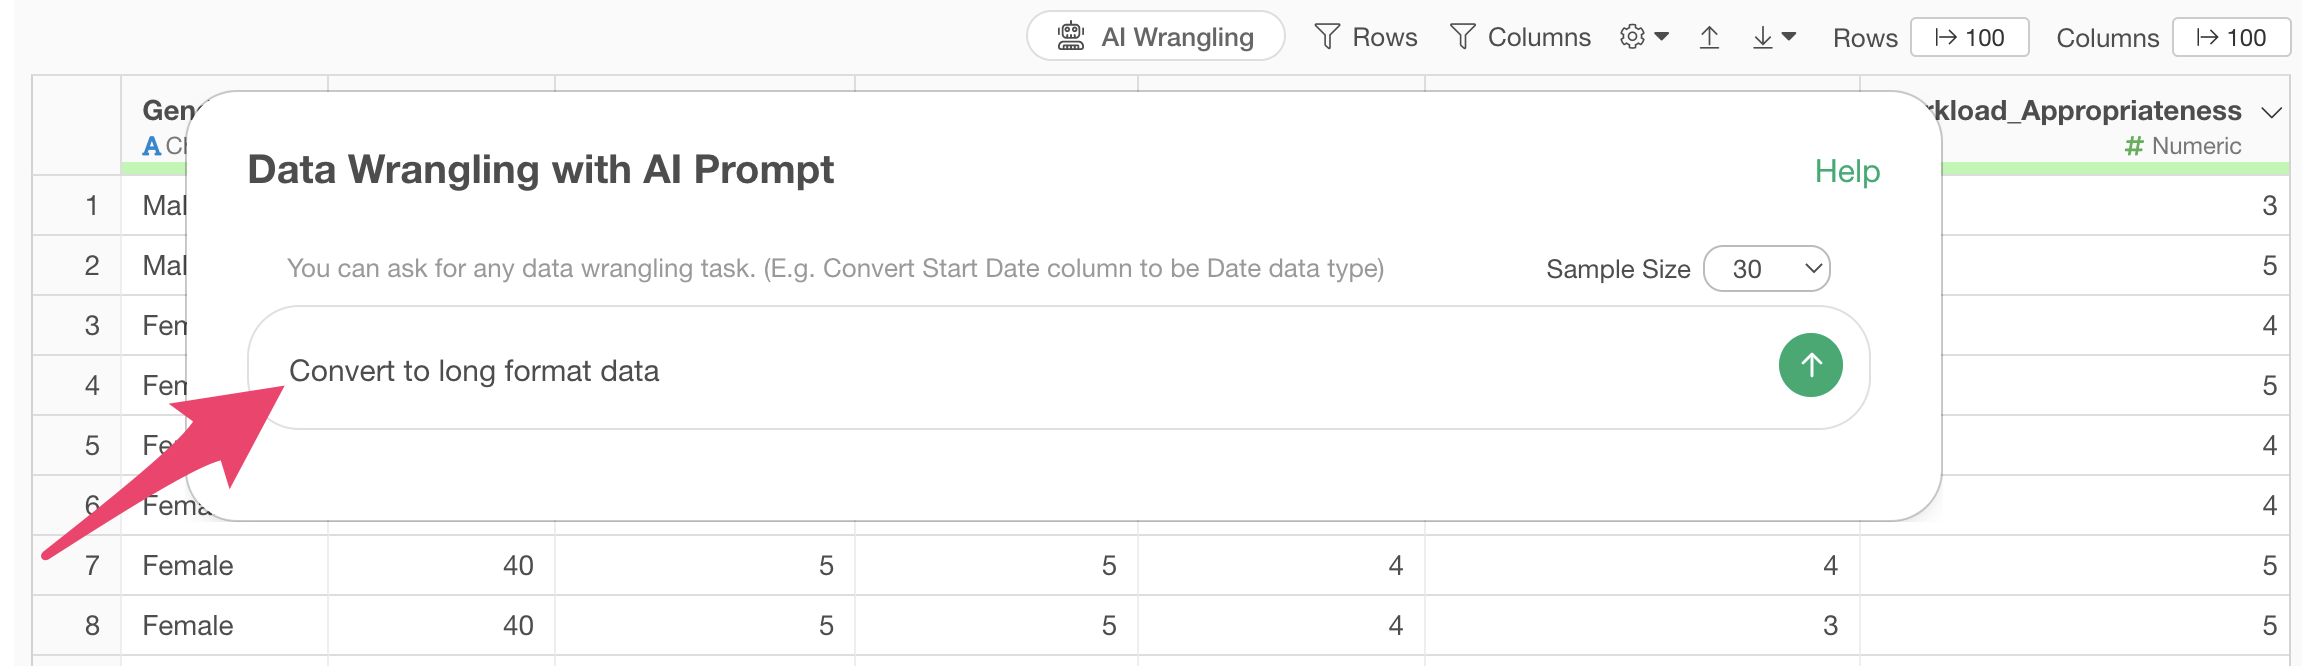
When the AI Prompt dialog appears, enter text like the following and execute:
Convert to long format data
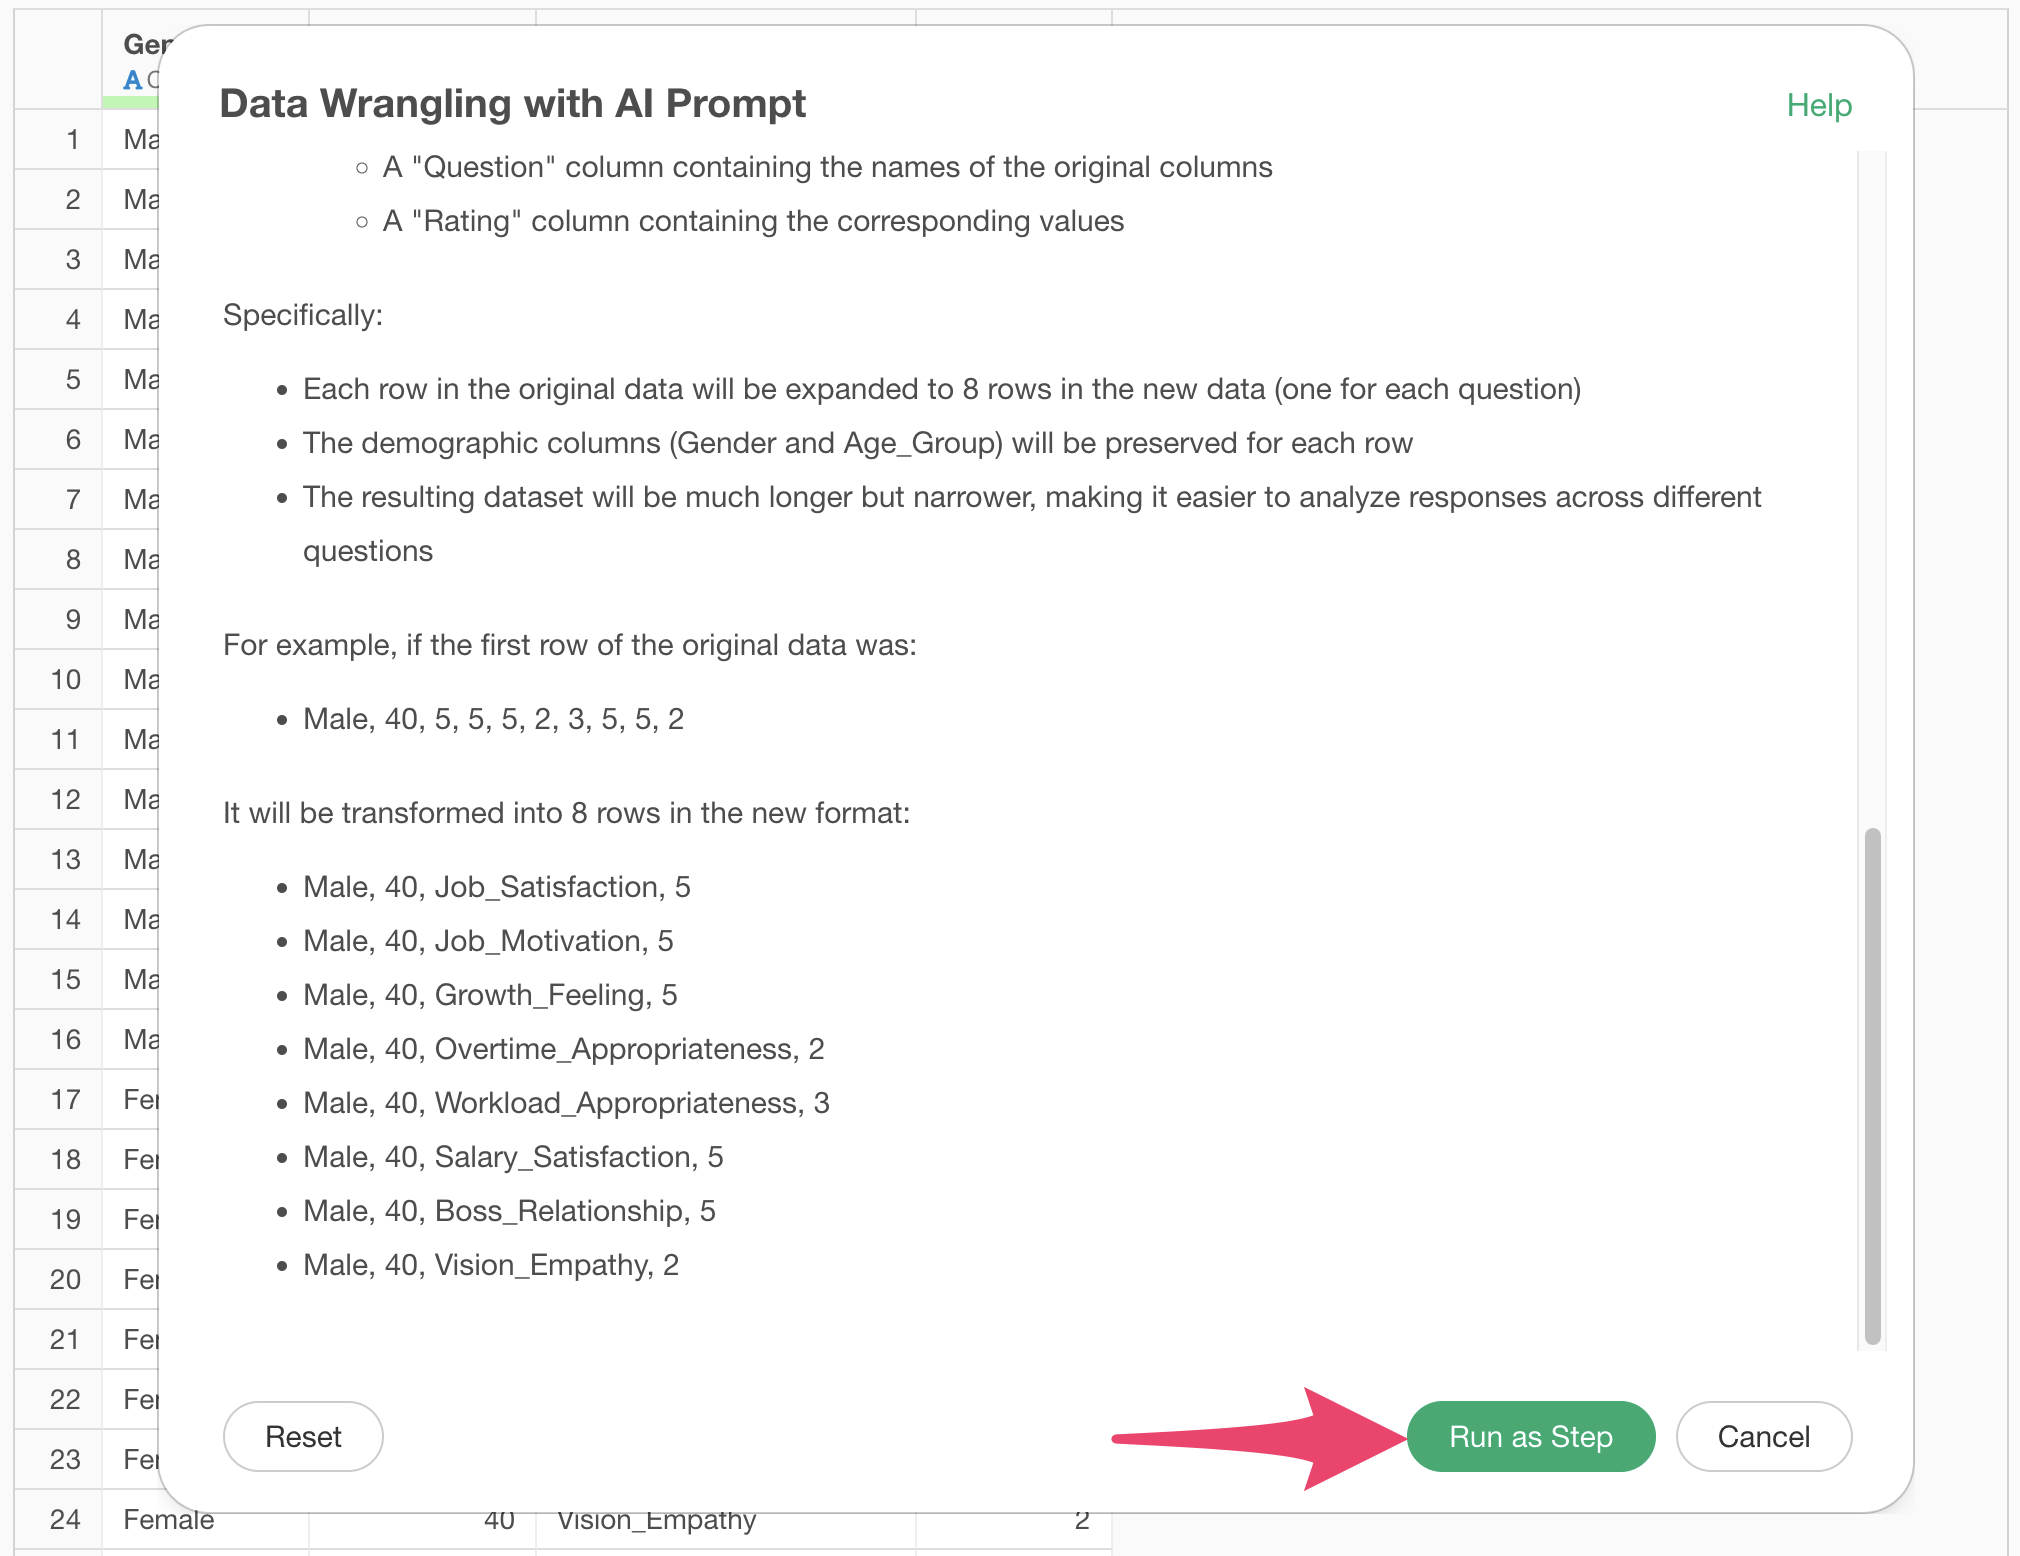
This will generate code to convert the data to wide format.

Check the explanation of the functions used and the expected results, then click the “Run as Step” button.
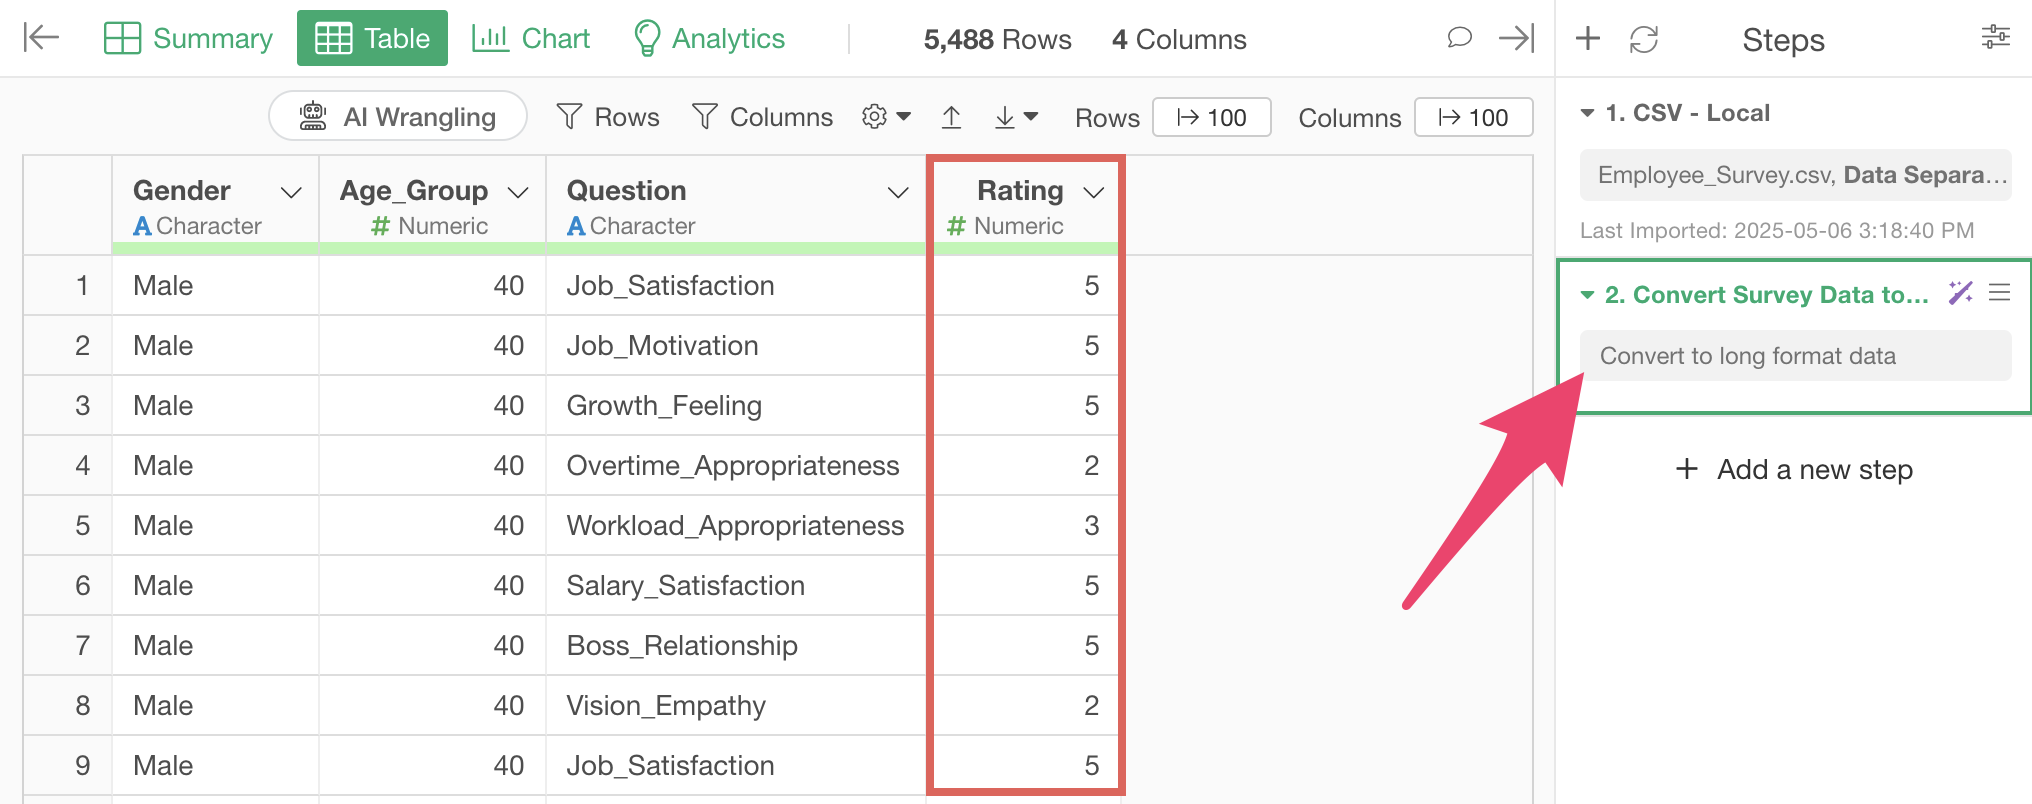
The step is added, and the data has been converted to wide format.
Convert Wide Format Data to Long Format Using UI
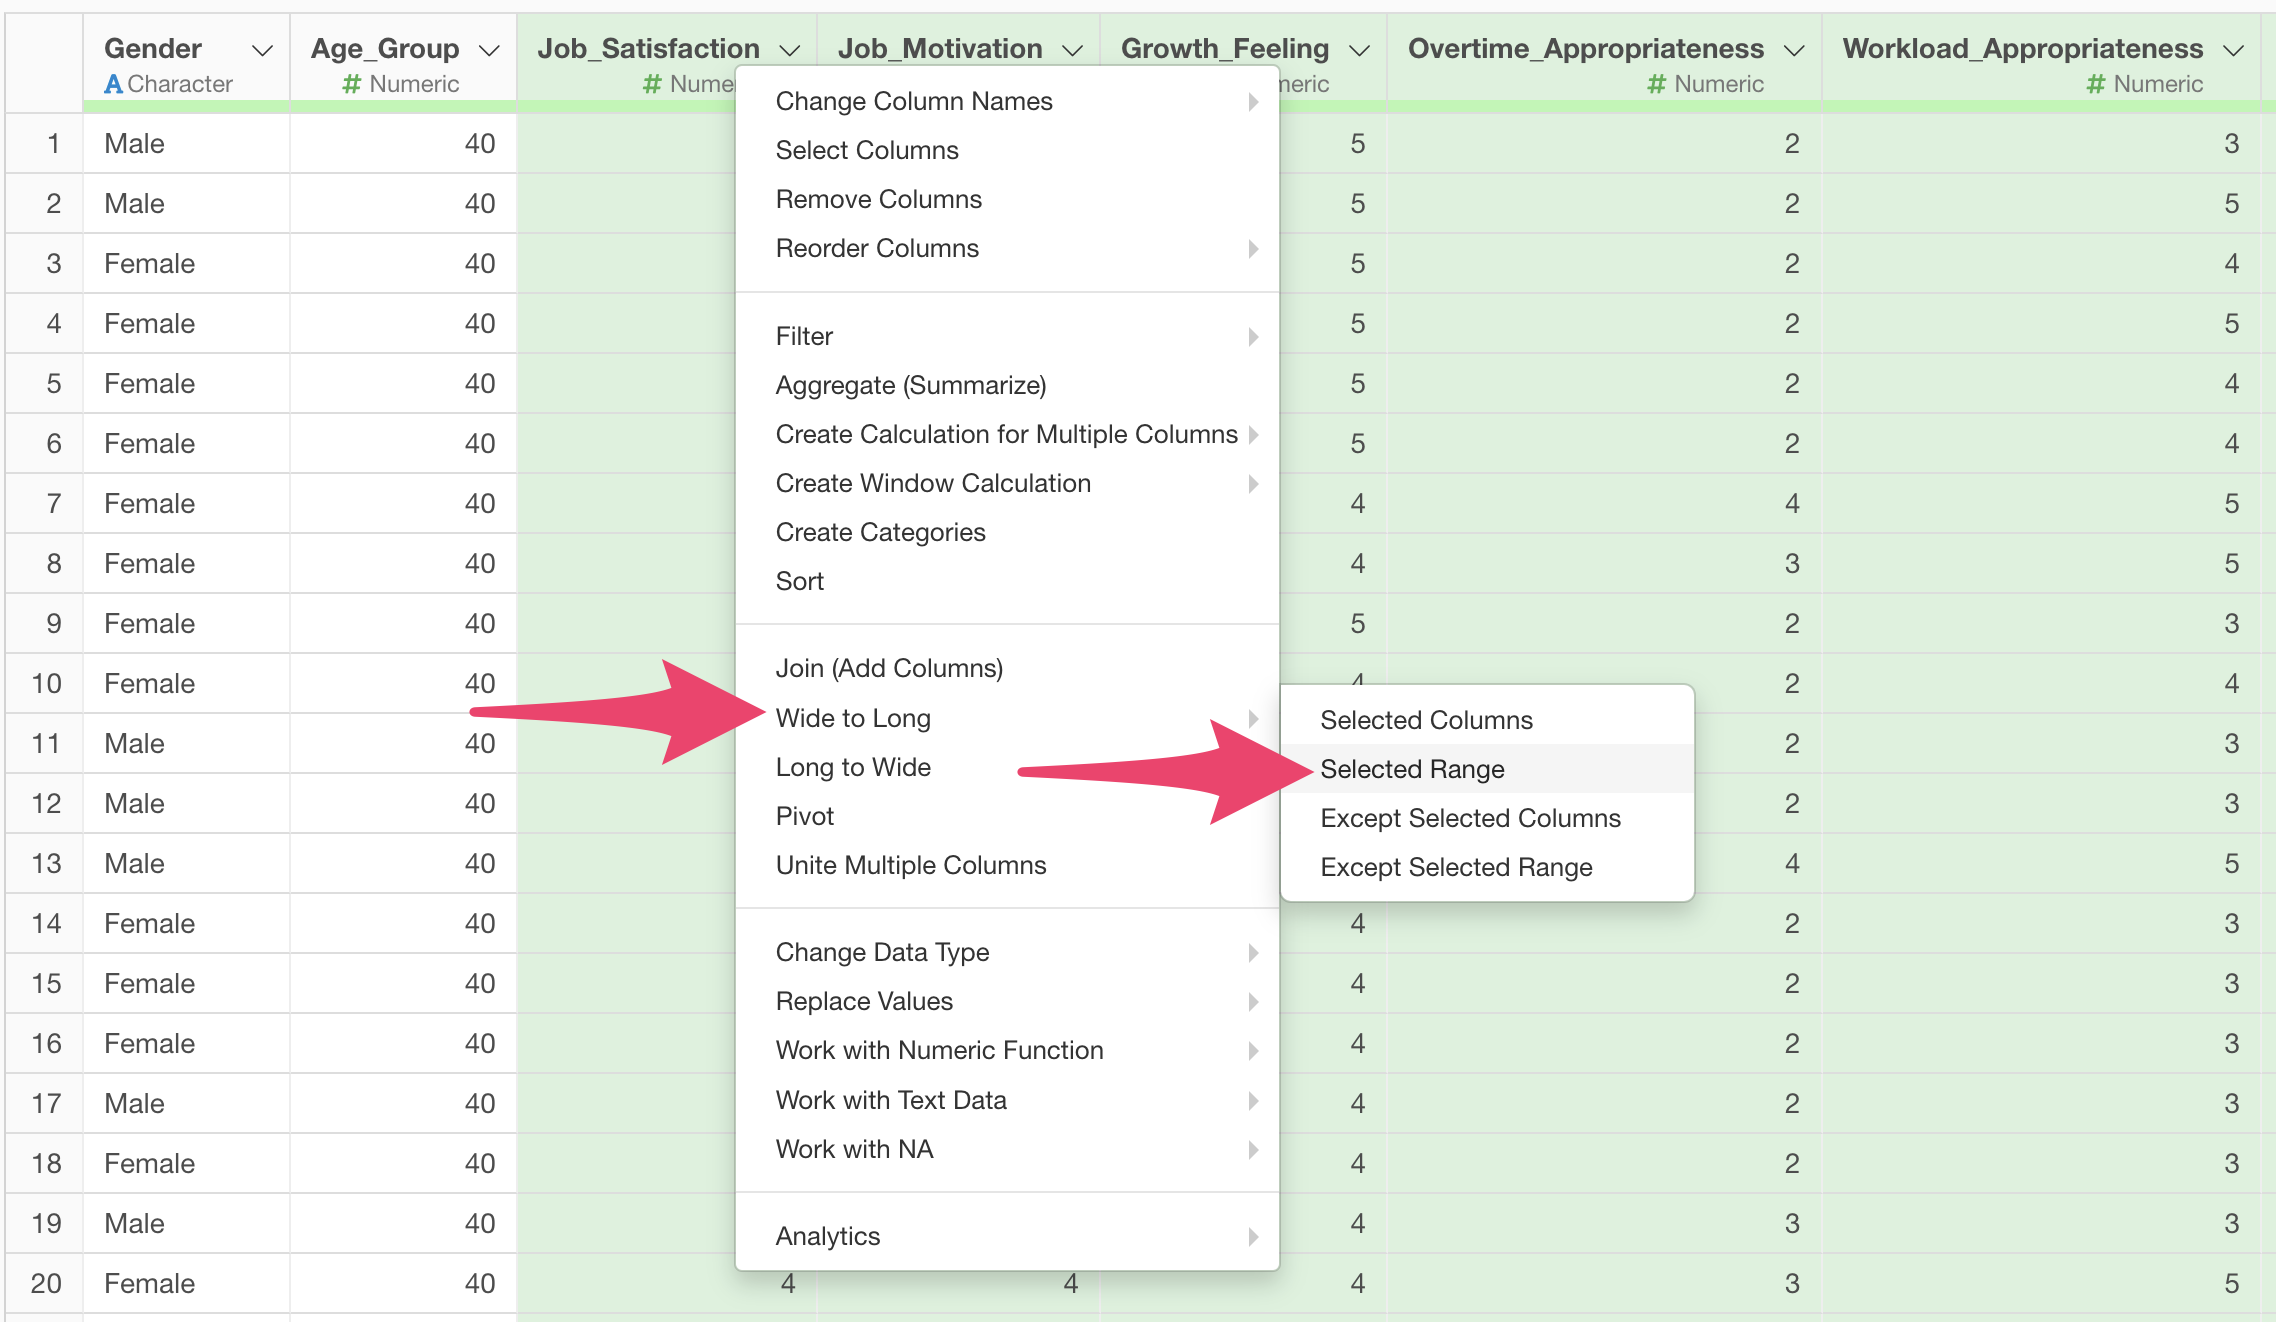
To convert wide format data to long format using the UI, hold down the Shift key and select the answer columns from “Job_Satisfaction” to “Vison_Empathy”.
Then, from any column header menu, select “Wide to Long” and “Selected Range”.
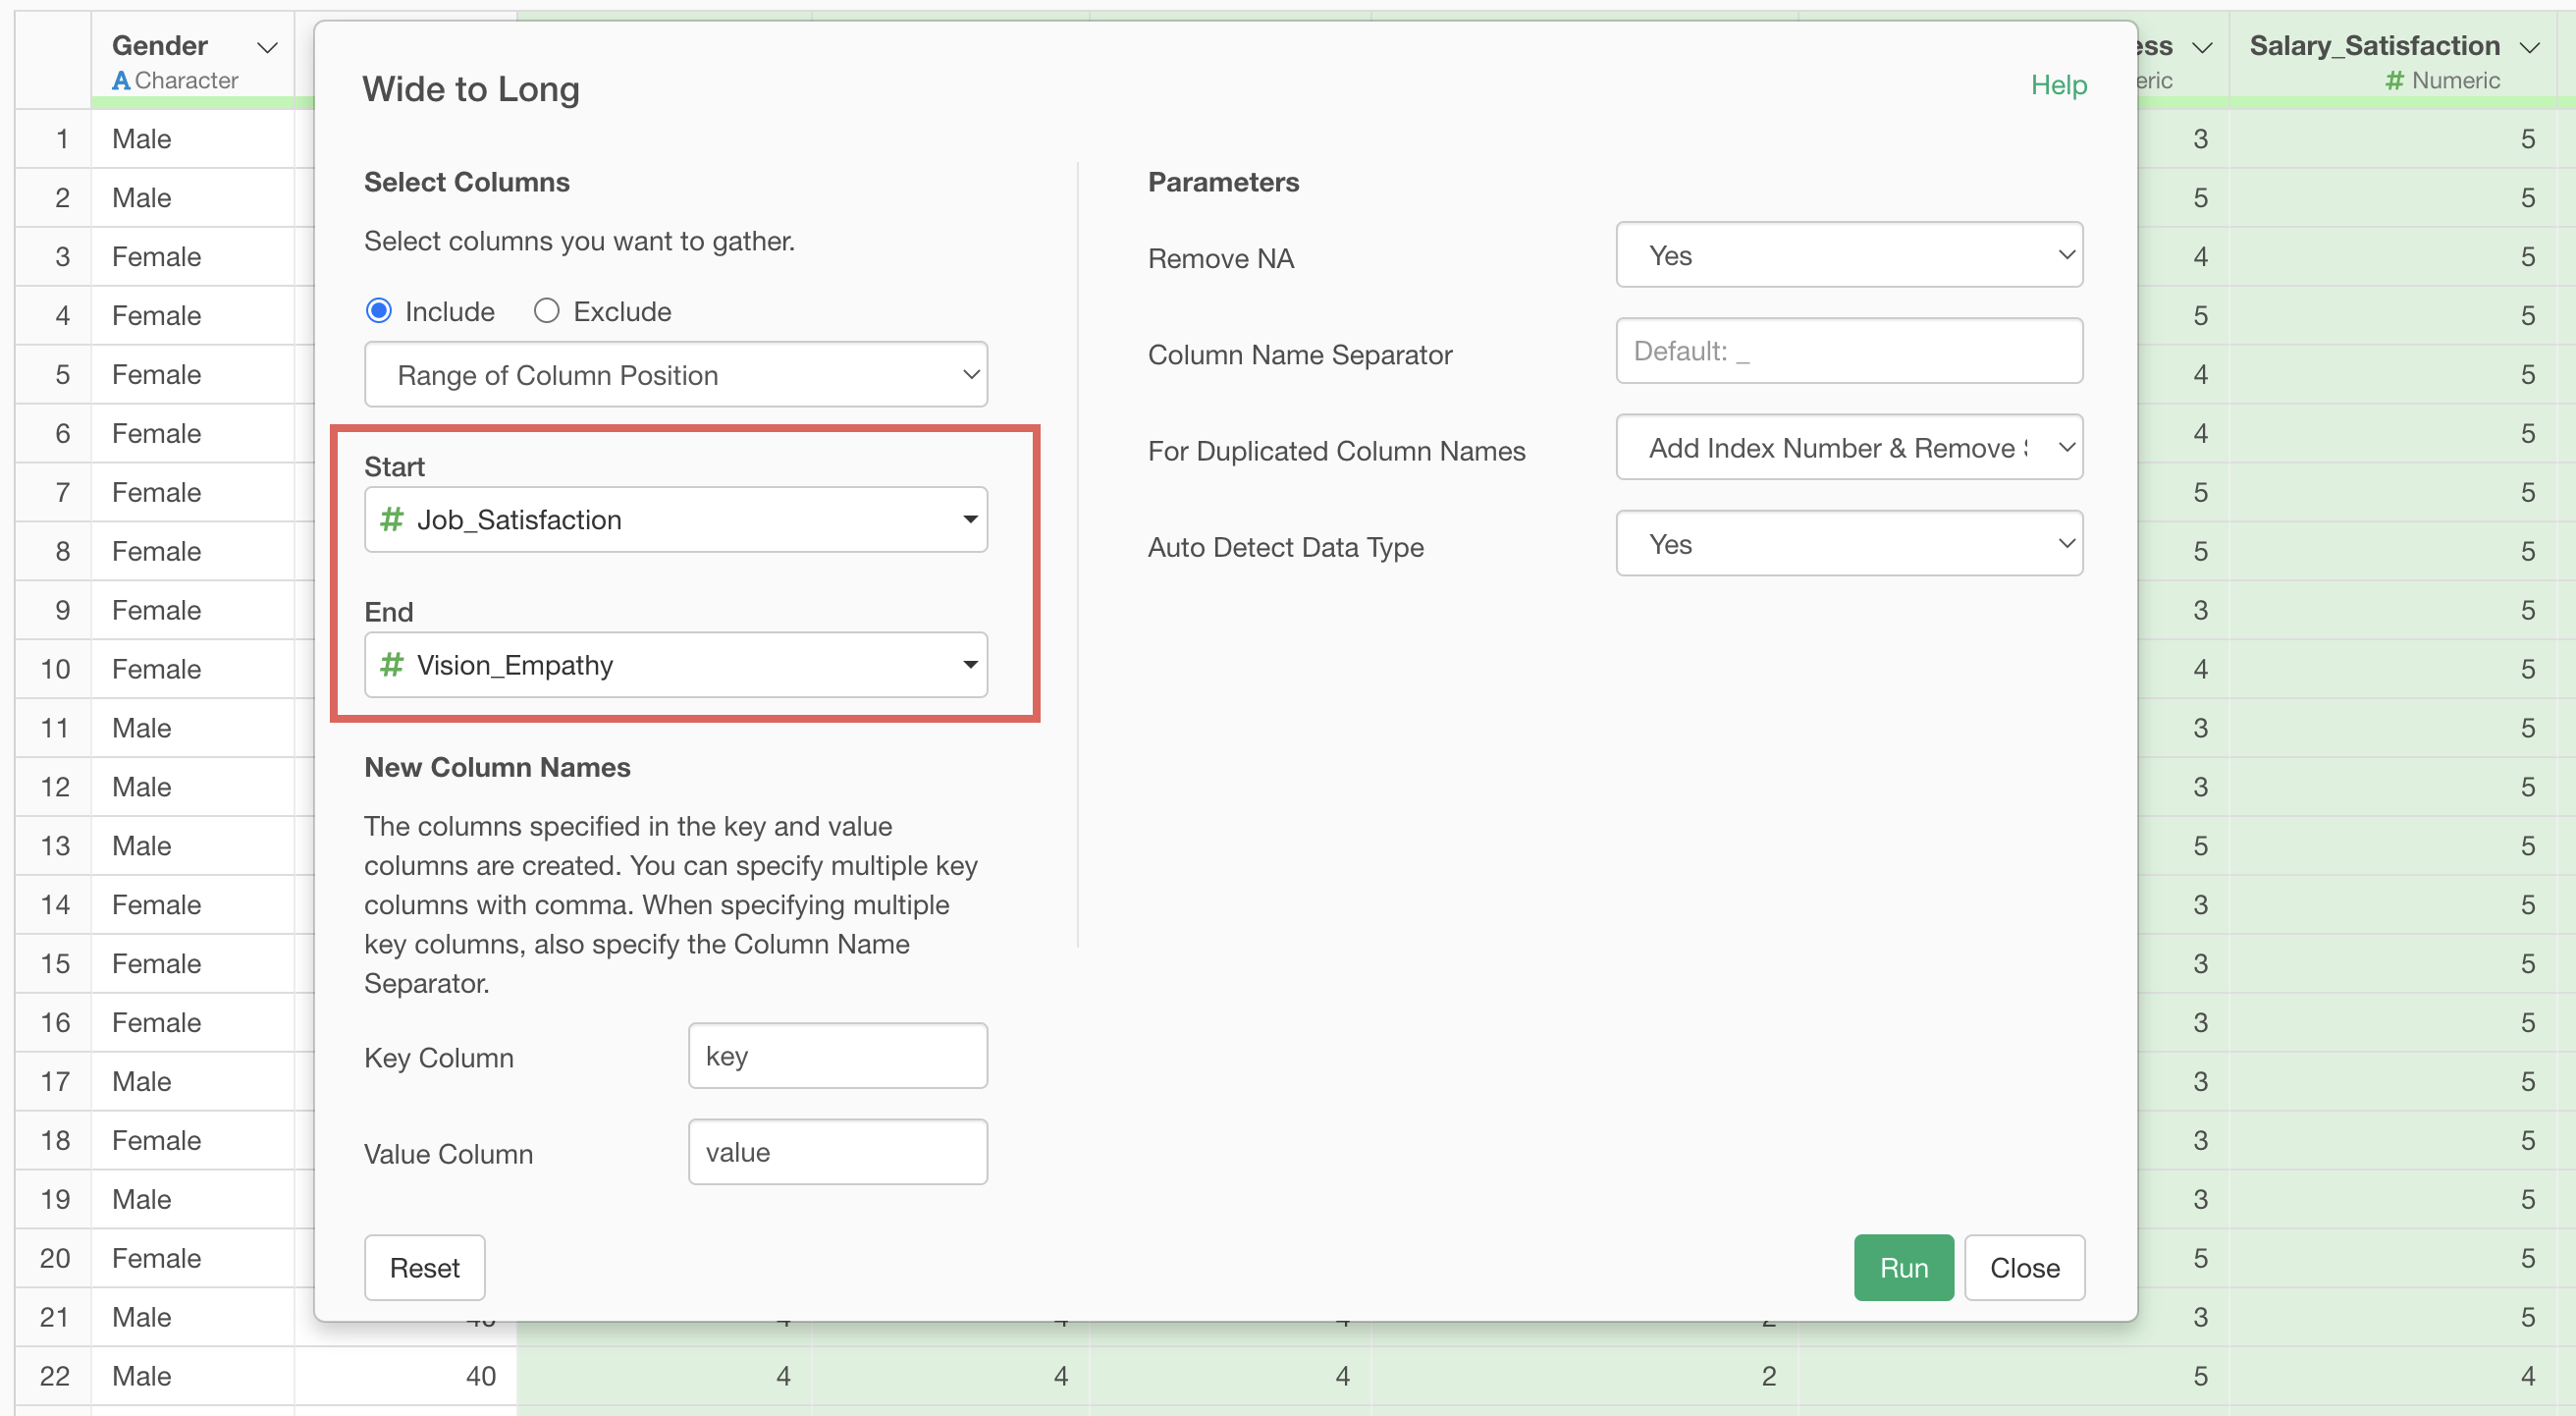
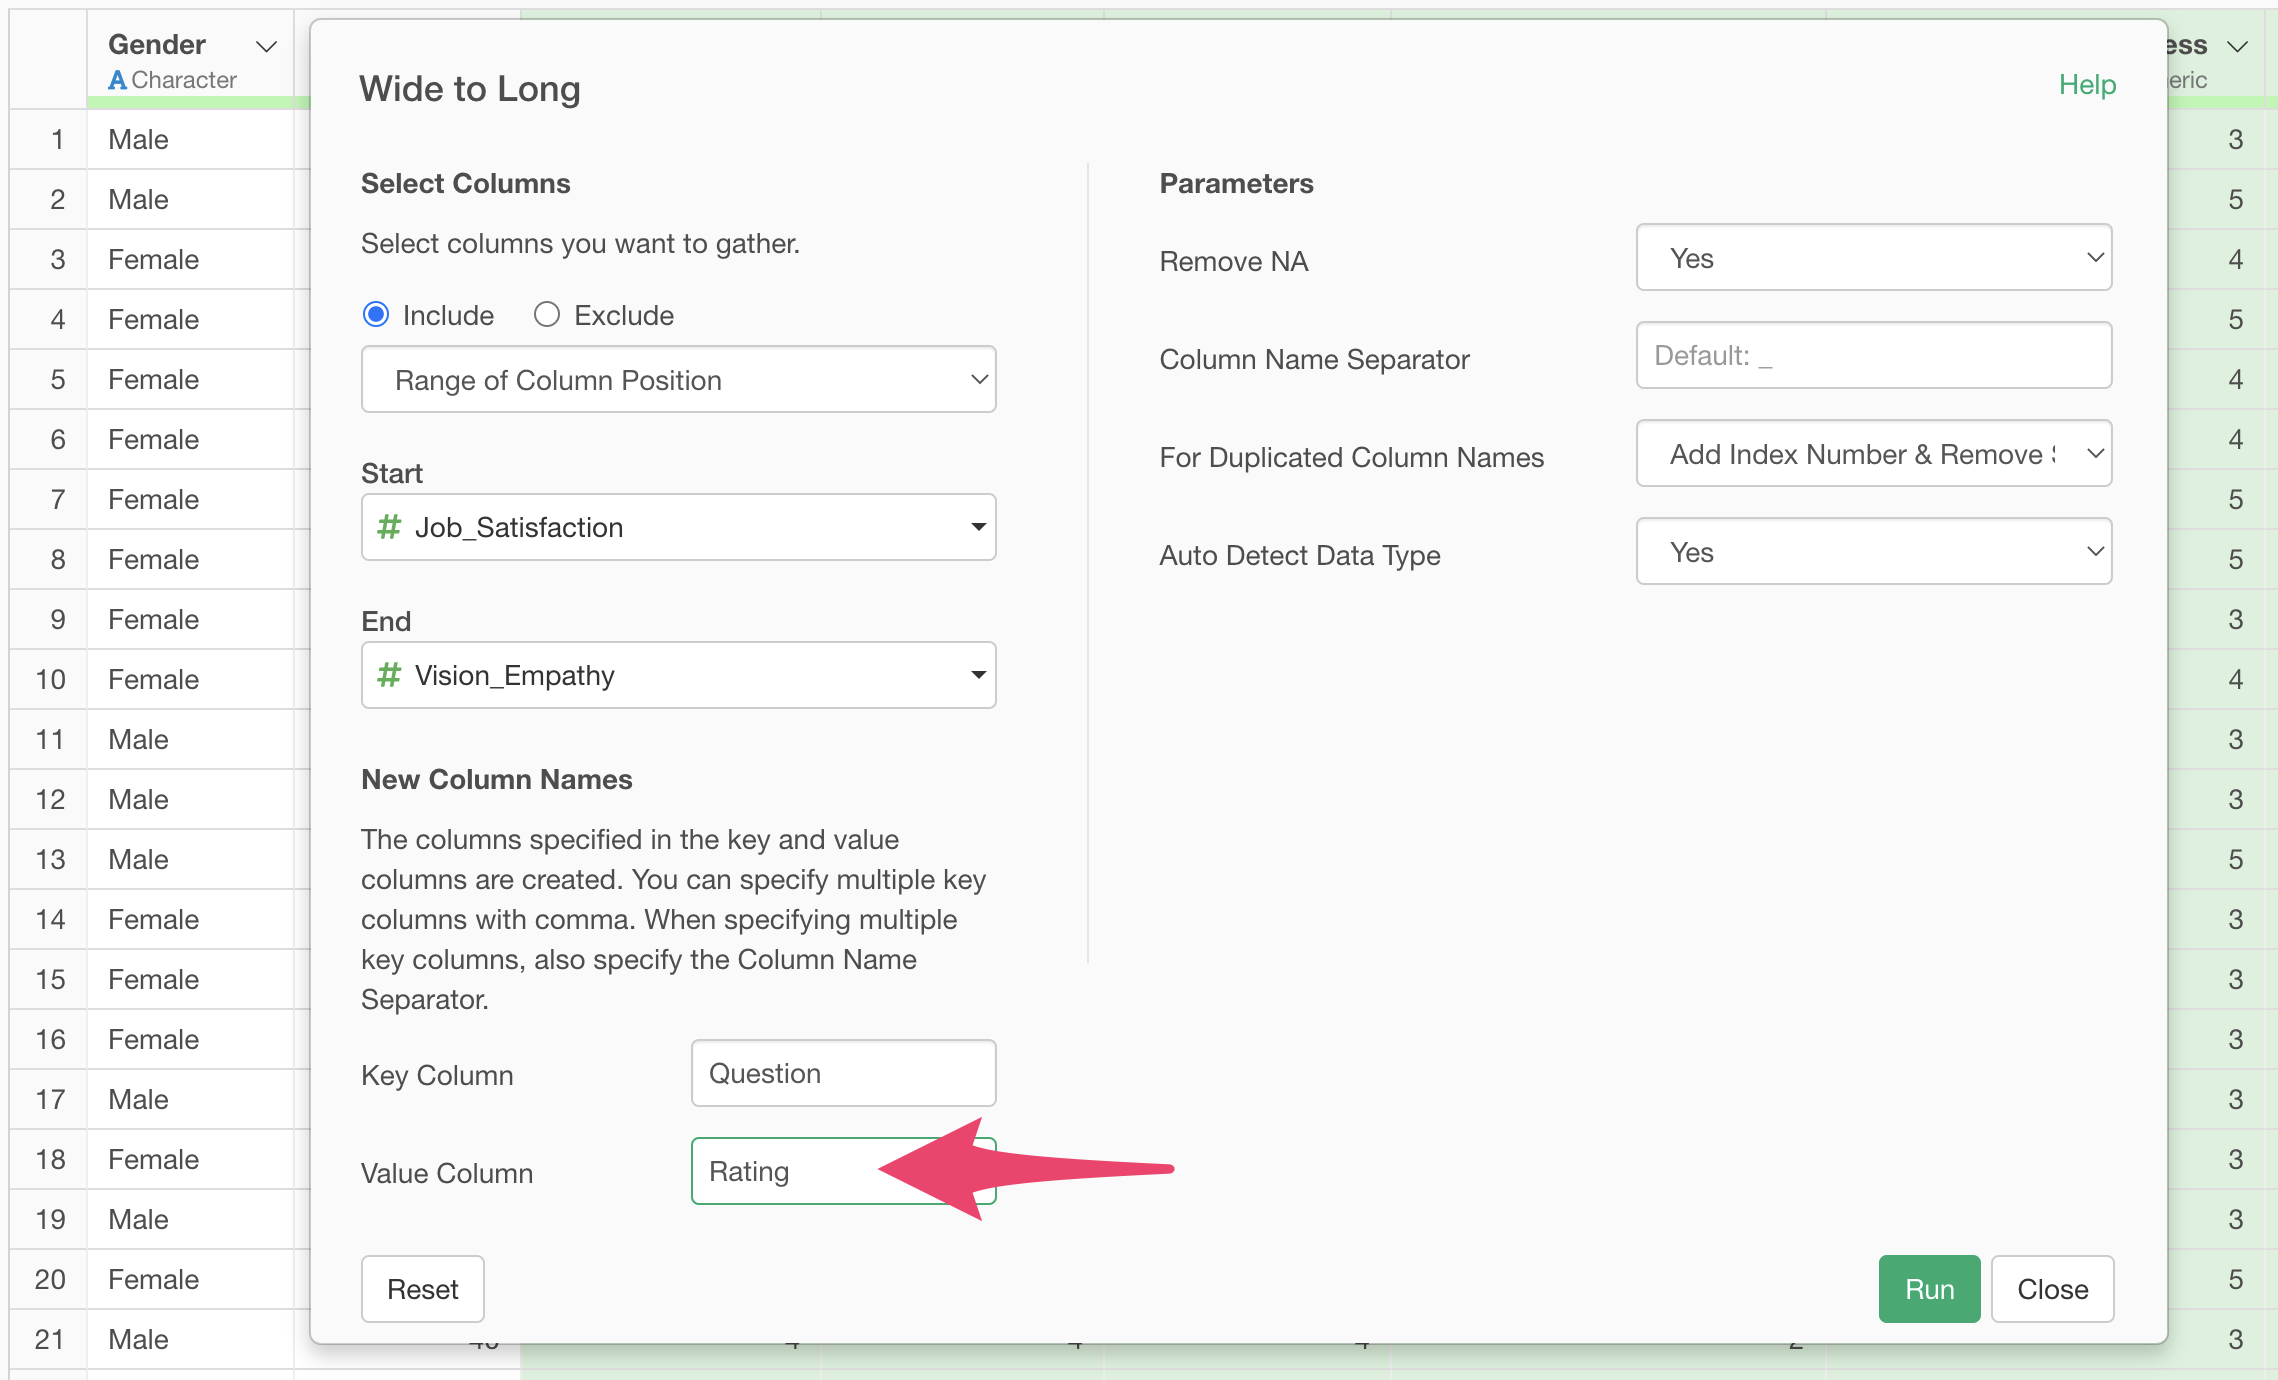
A dialog for converting data from wide format to long format will appear.

Since we want to convert columns from “Job_Satisfaction” to “Vision_Empathy” to long format, confirm that “Job_Satisfaction” is selected for the start and “Vision_Empathy” for the end.
Next, set the general term for the columns to be consolidated in long format in the “Key Column”. Type “Question” in the key column field.
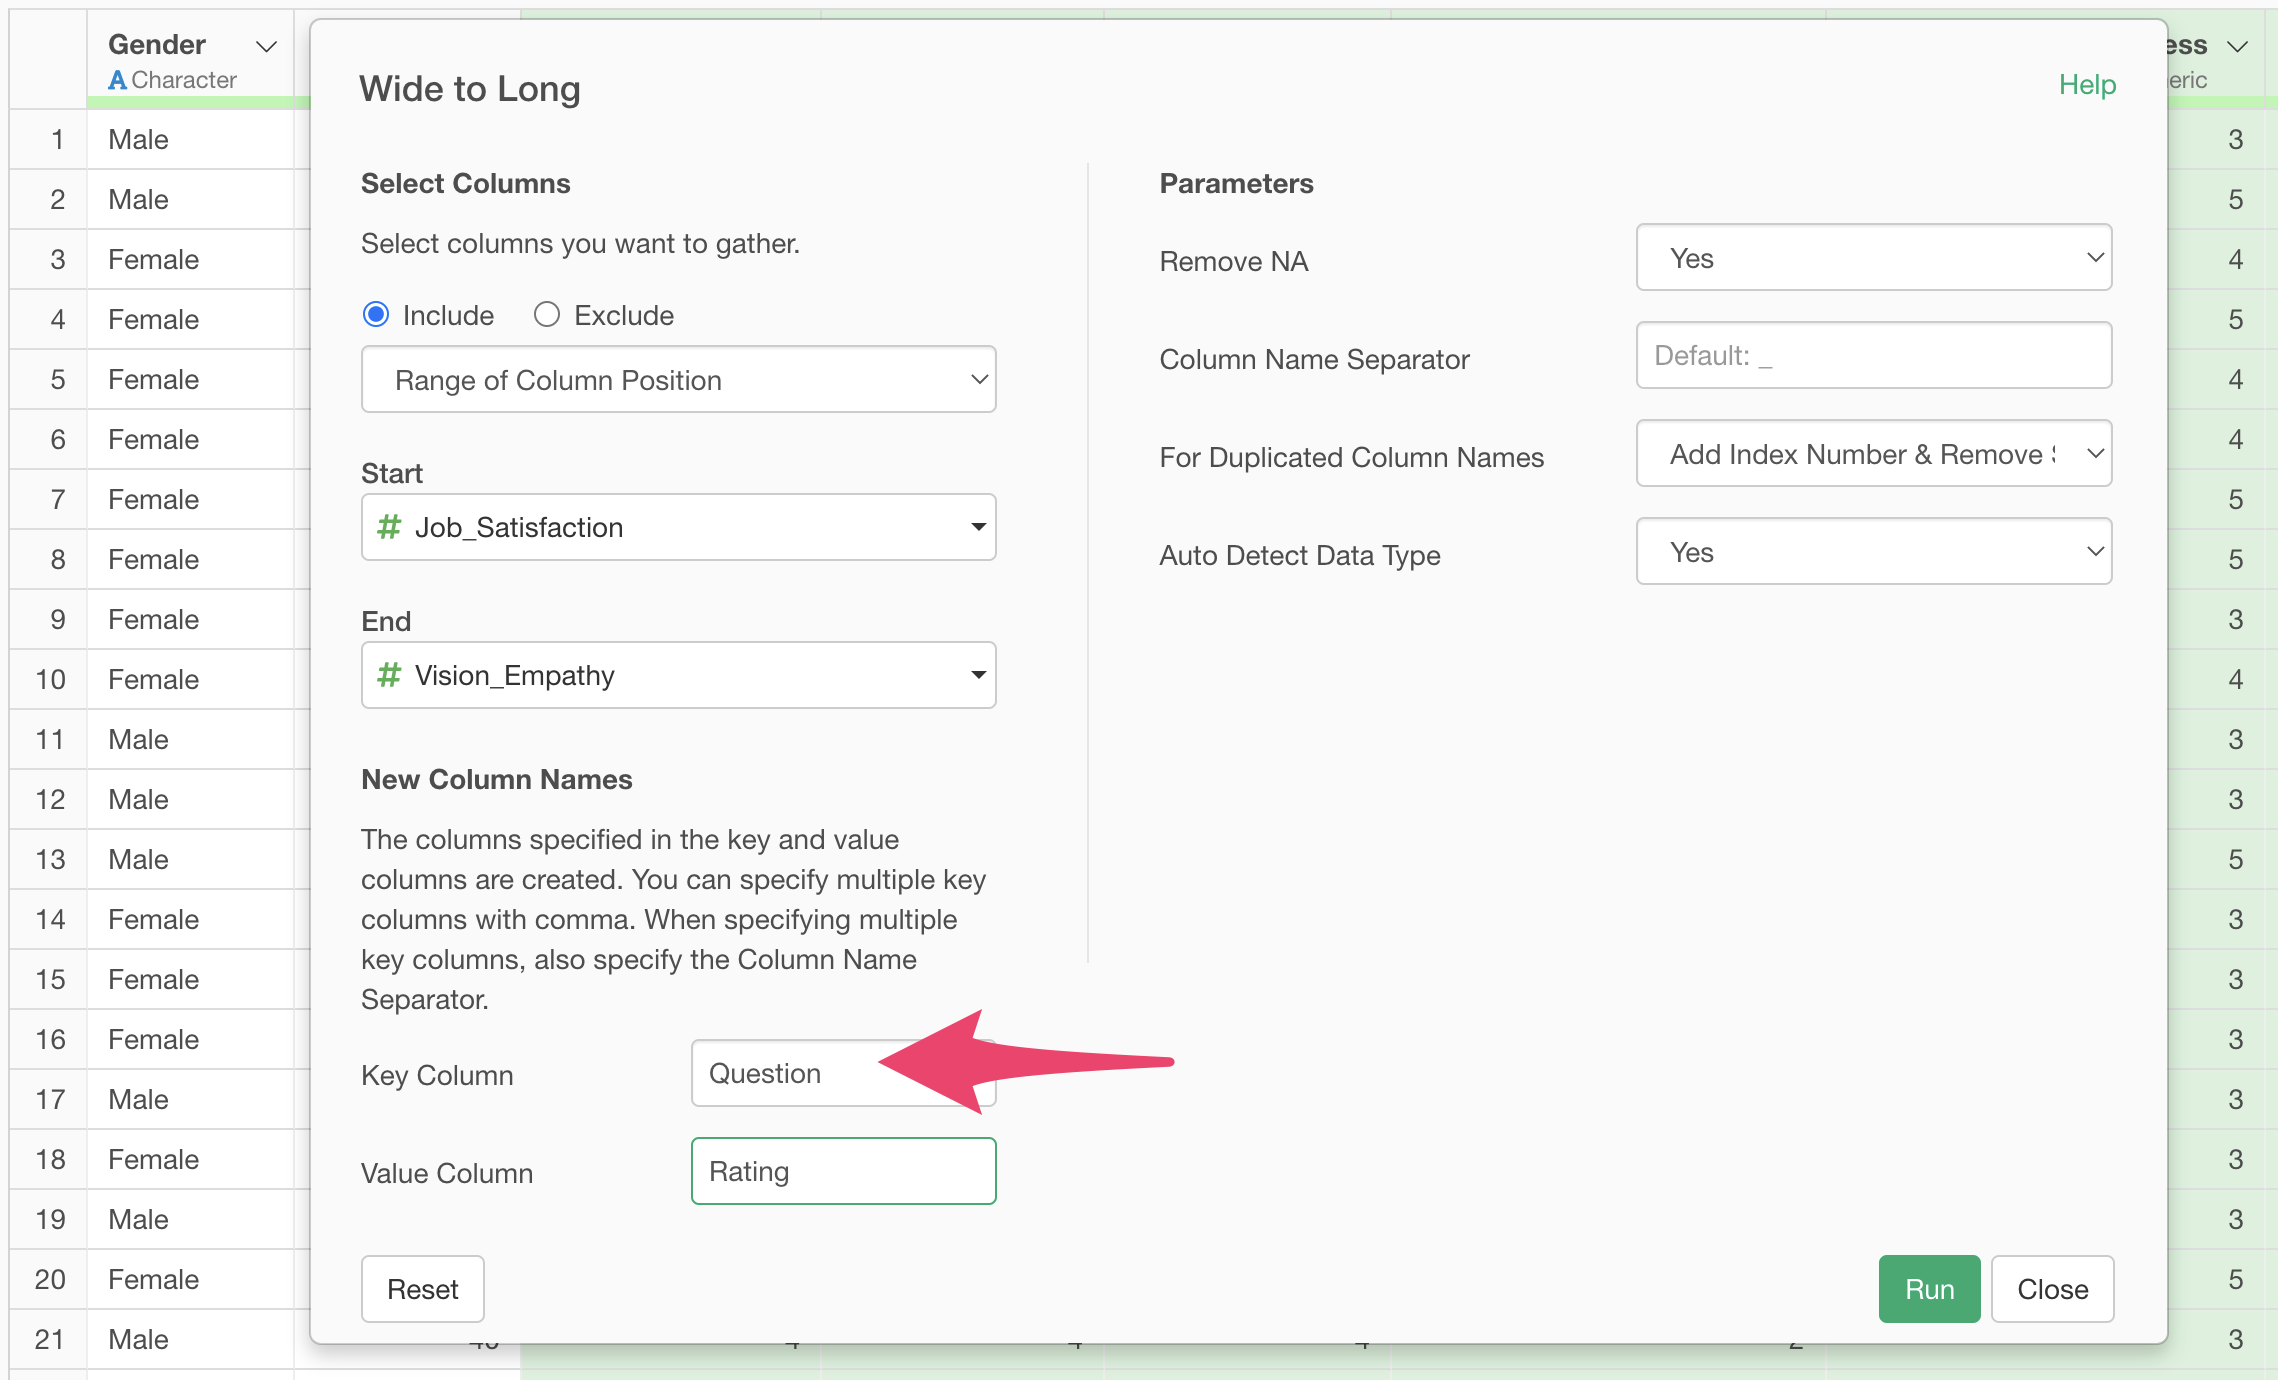
For the value, enter “Rating” and run it.
A step to convert wide format data to long format is added, and the data is converted to long format.

3. Aggregate and Visualize Responses
Now that we’ve converted the data to long format, let’s create a cross-tabulation table like the one below.
Move to the Chart view and select “Pivot Table” as the chart type.
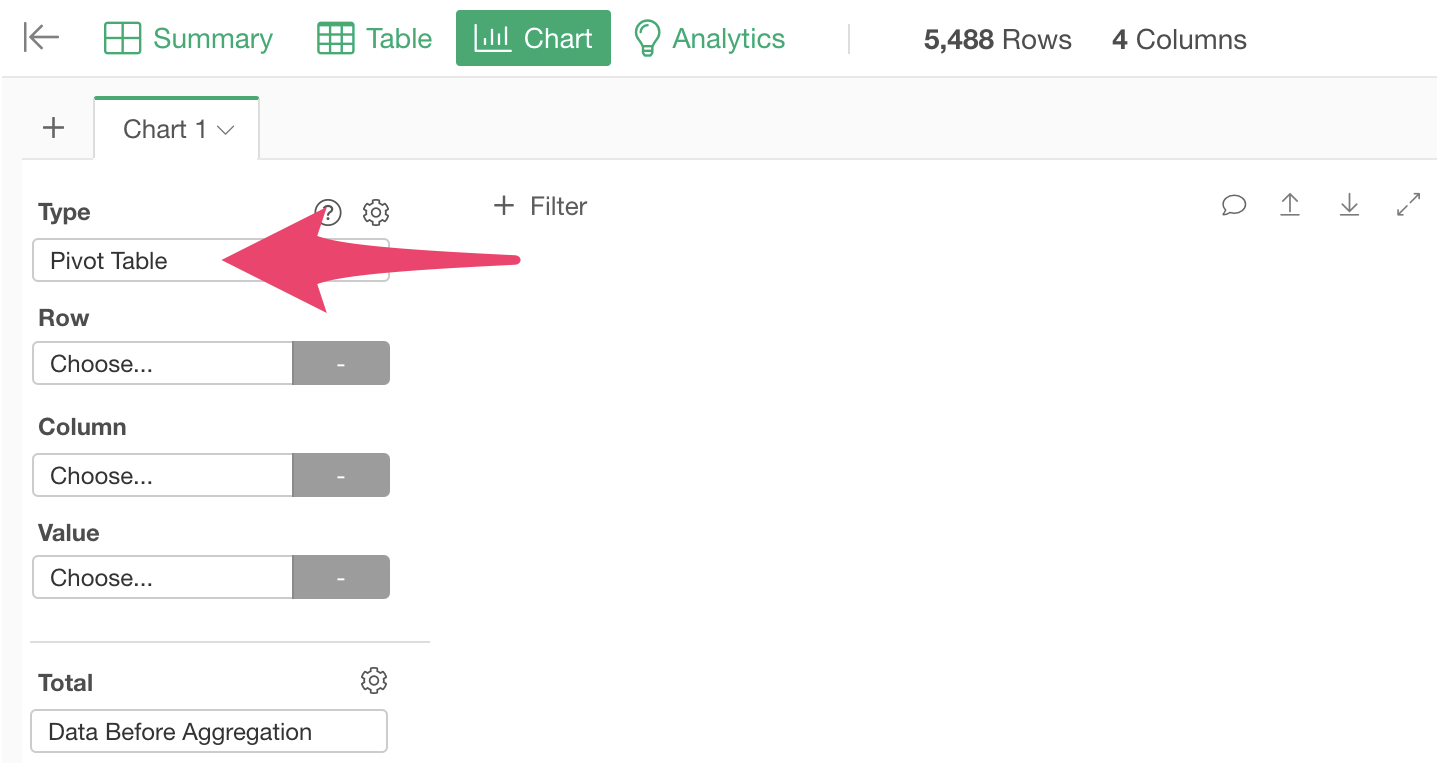
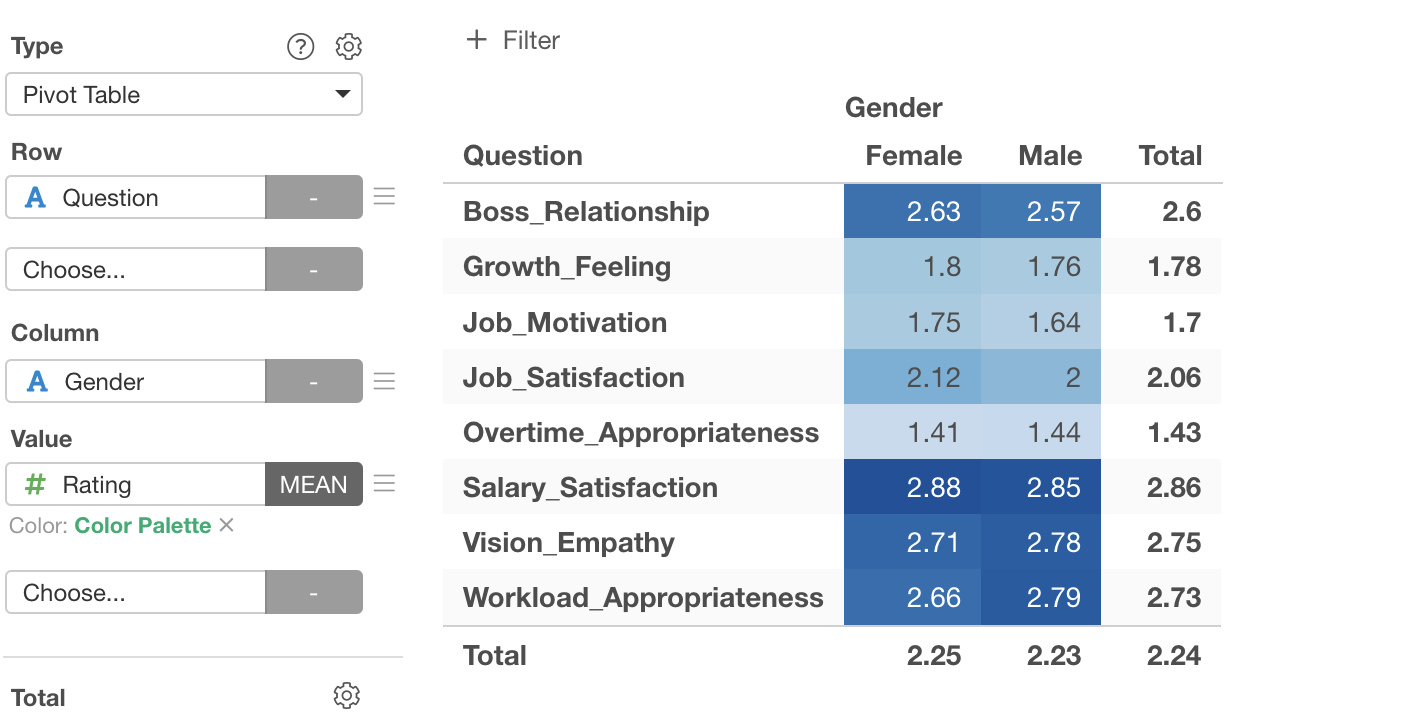
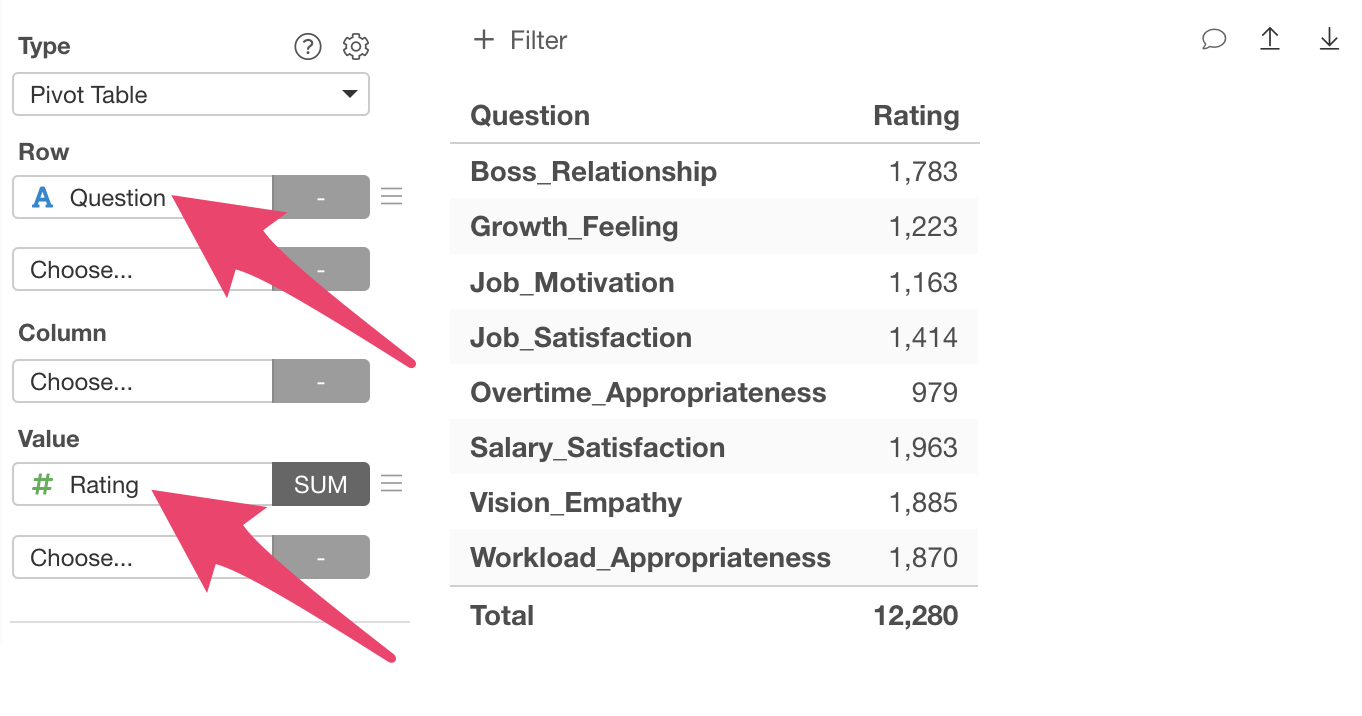
Next, select “Question” for rows and “Rating” for values.
 After
selecting “Rating” for values, change the value aggregation function to
“Mean”.
After
selecting “Rating” for values, change the value aggregation function to
“Mean”.
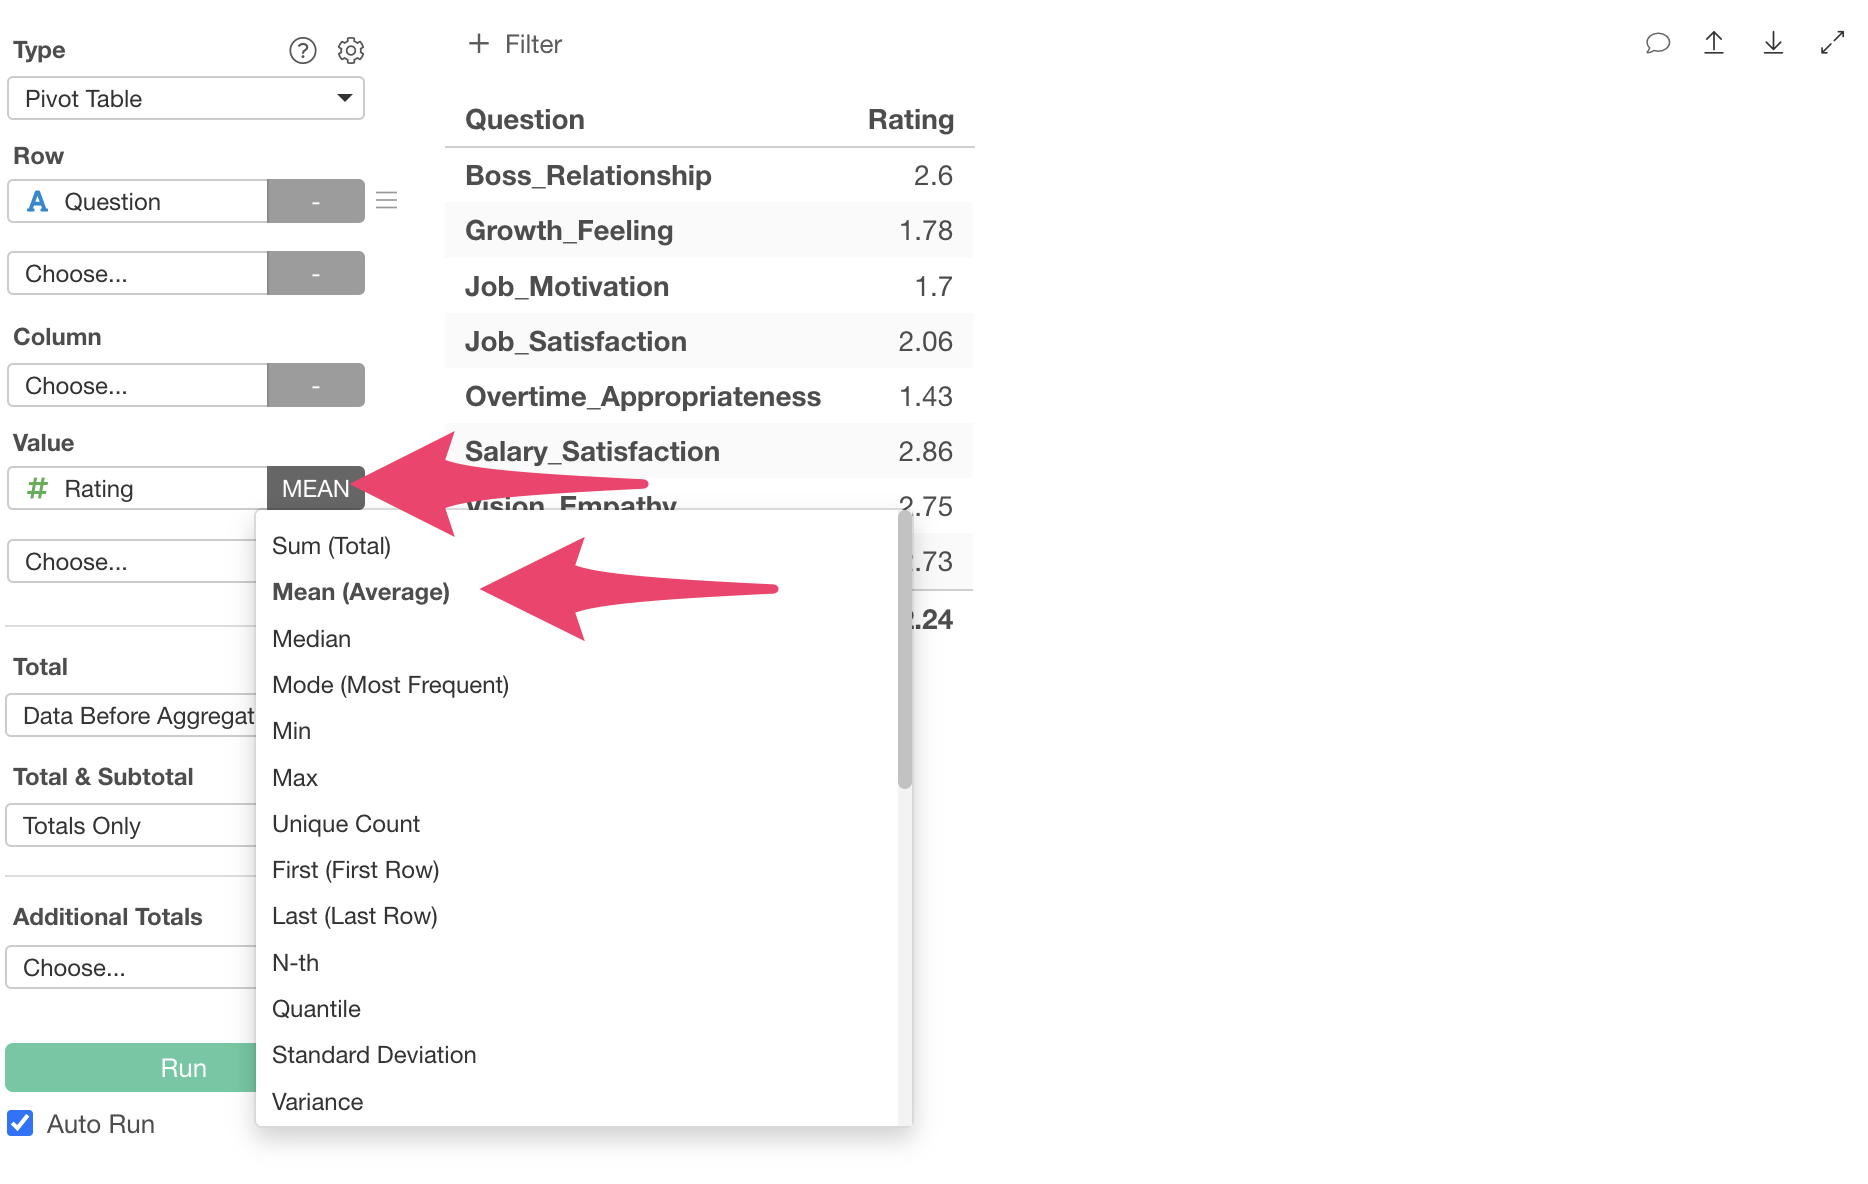 Now
we’ve aggregated the average score for each question.
Now
we’ve aggregated the average score for each question.
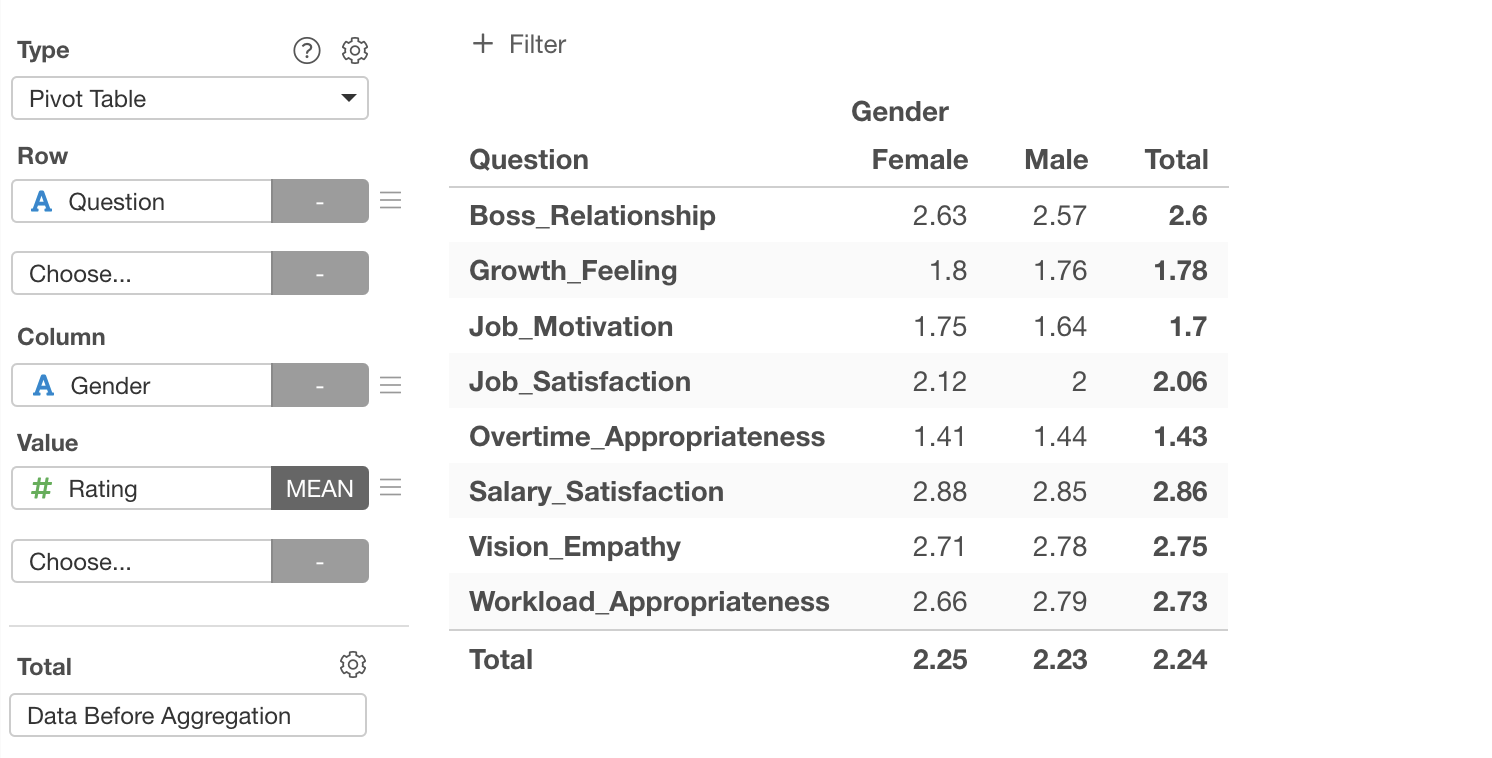
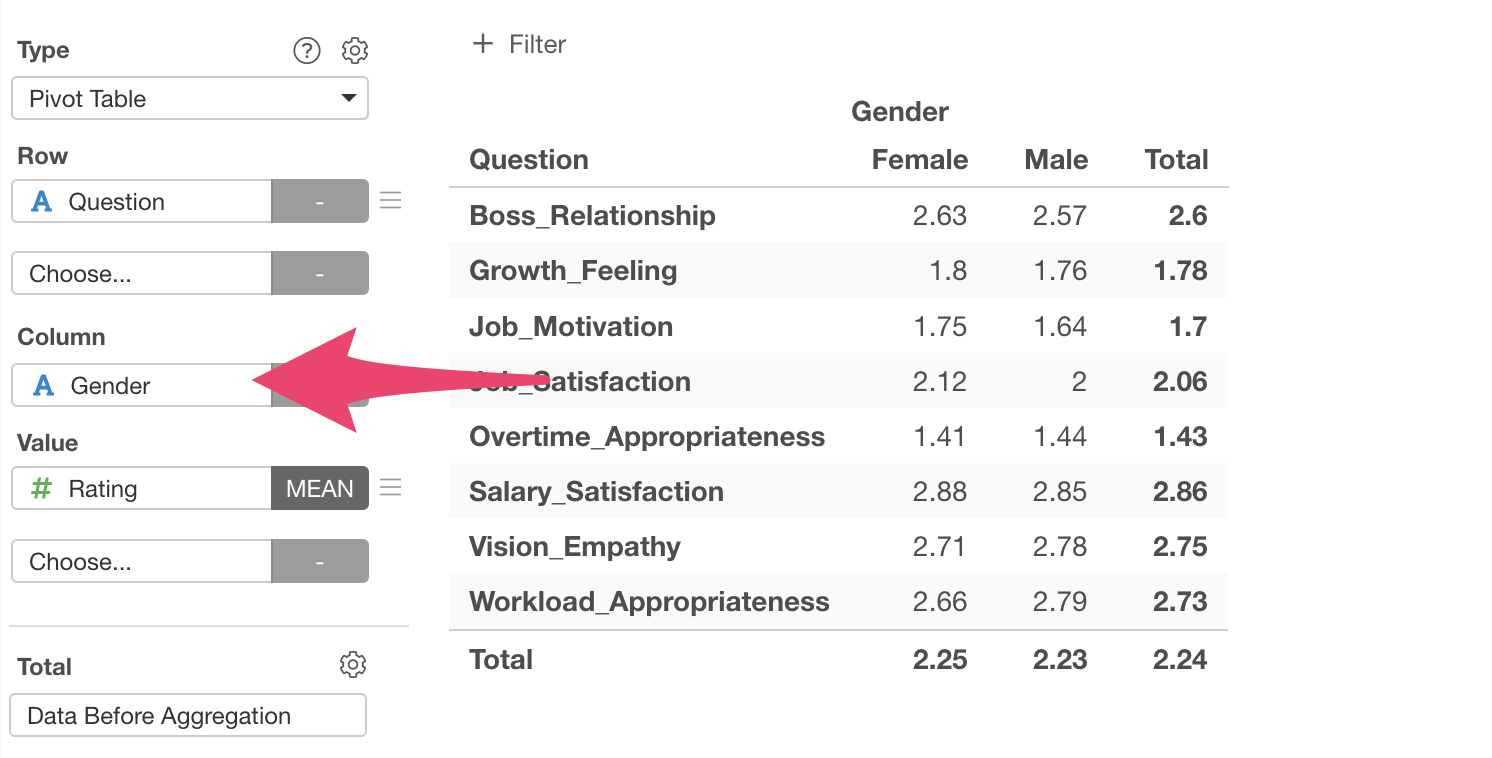
By selecting a column for the “Column” field, you can compare the average survey response scores for each question by group.
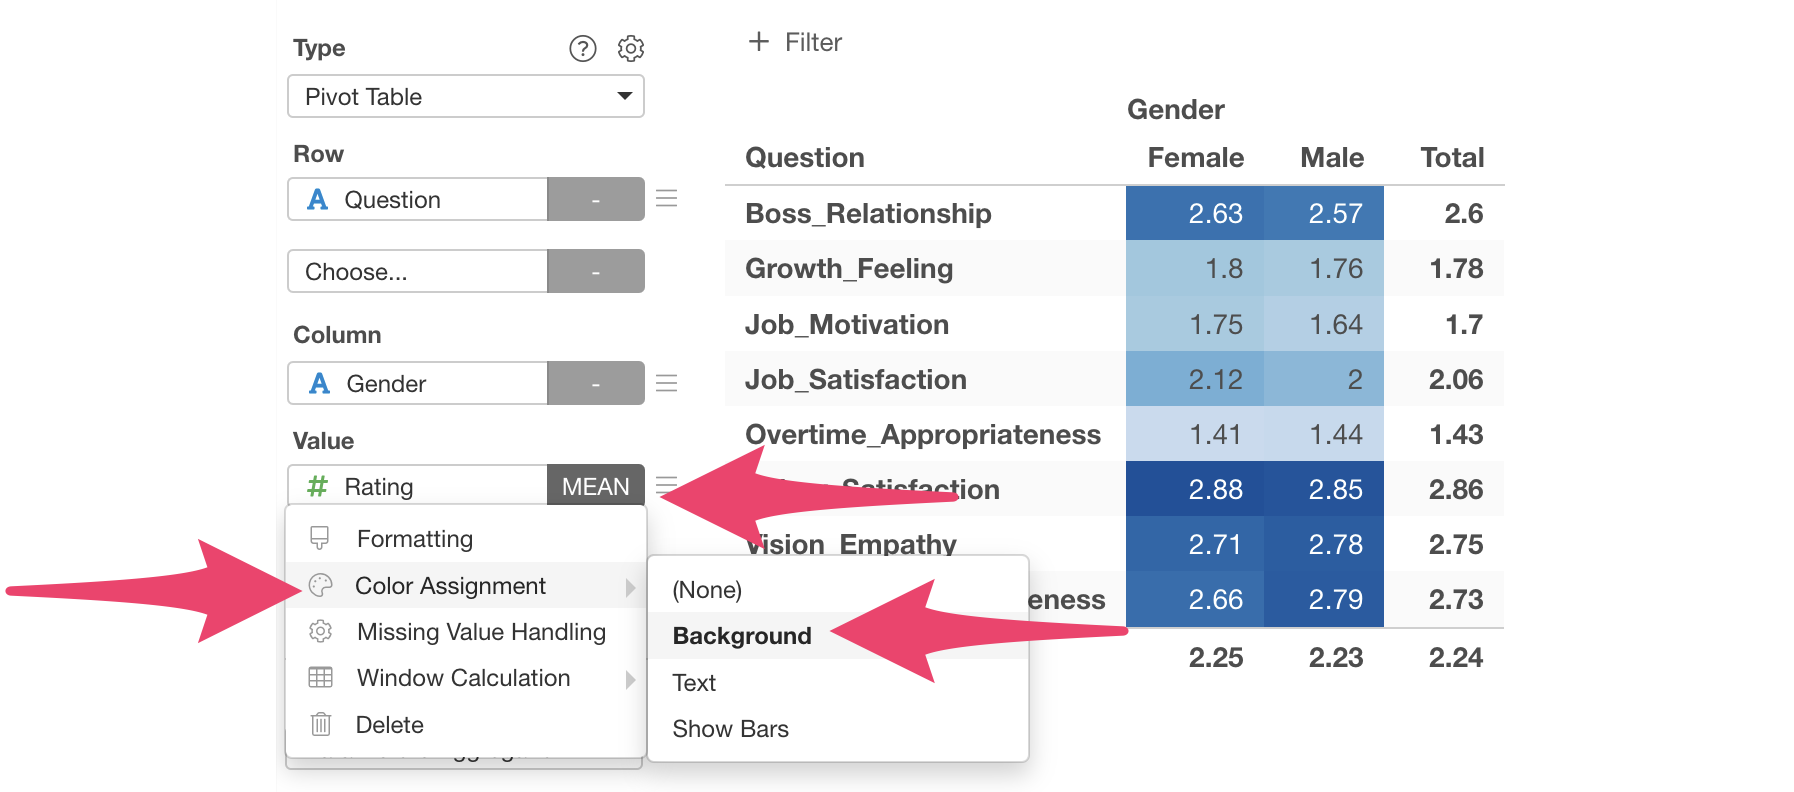
Furthermore, by selecting “Color Assignment” from the values menu, you can visually understand the magnitude relationships of values intuitively.
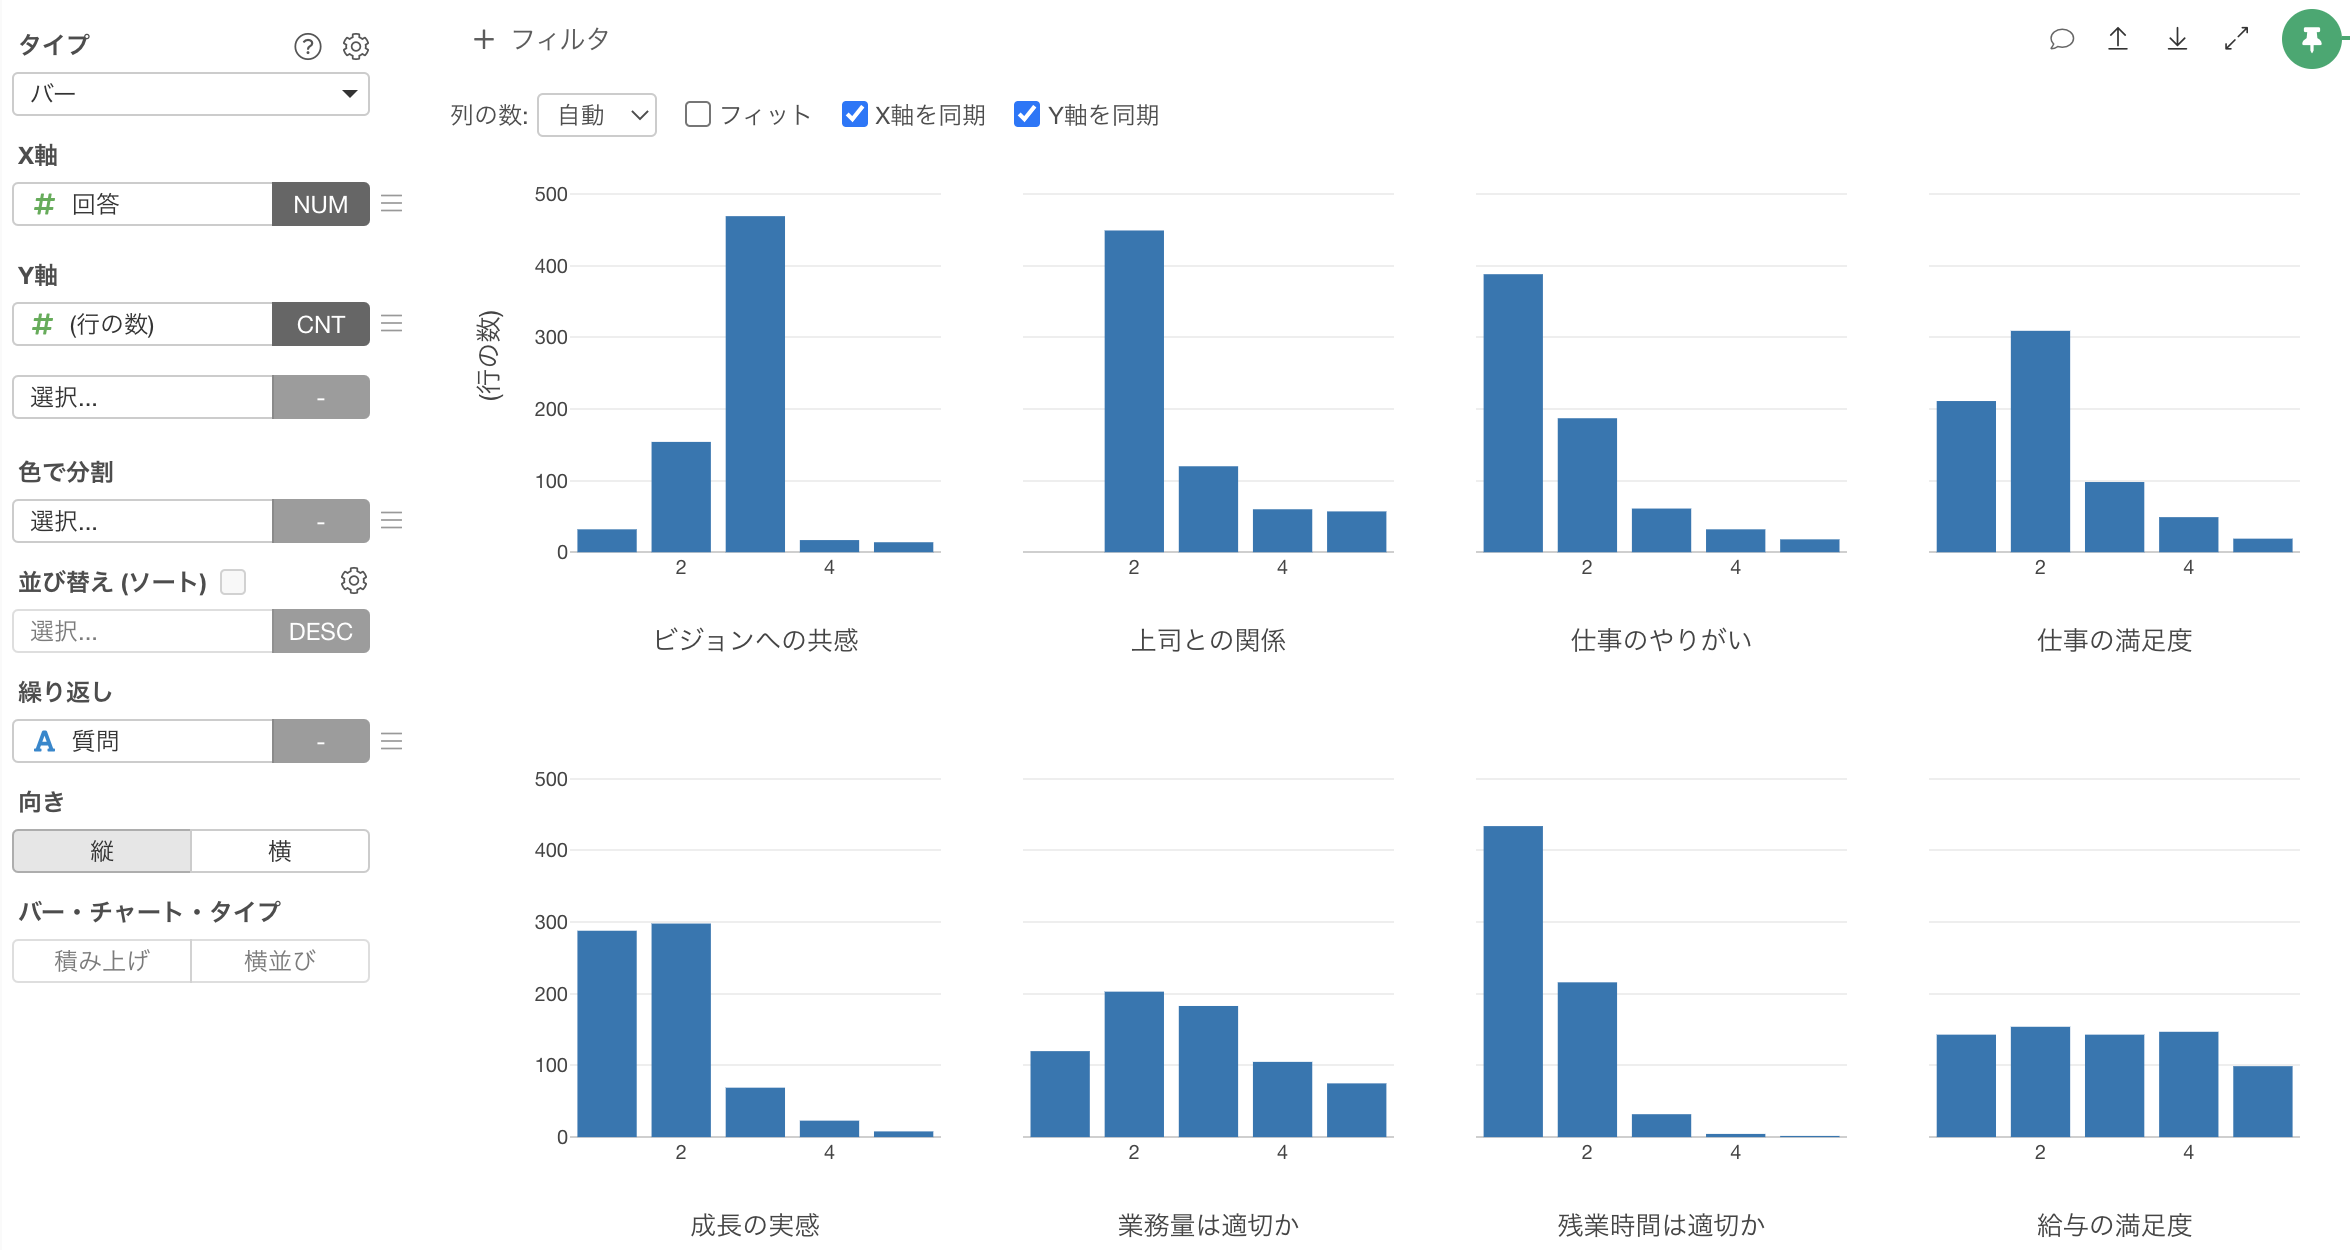
Let’s also create a chart showing the distribution of responses for each question.

Click the + (plus) button on the chart tab to add a new tab.
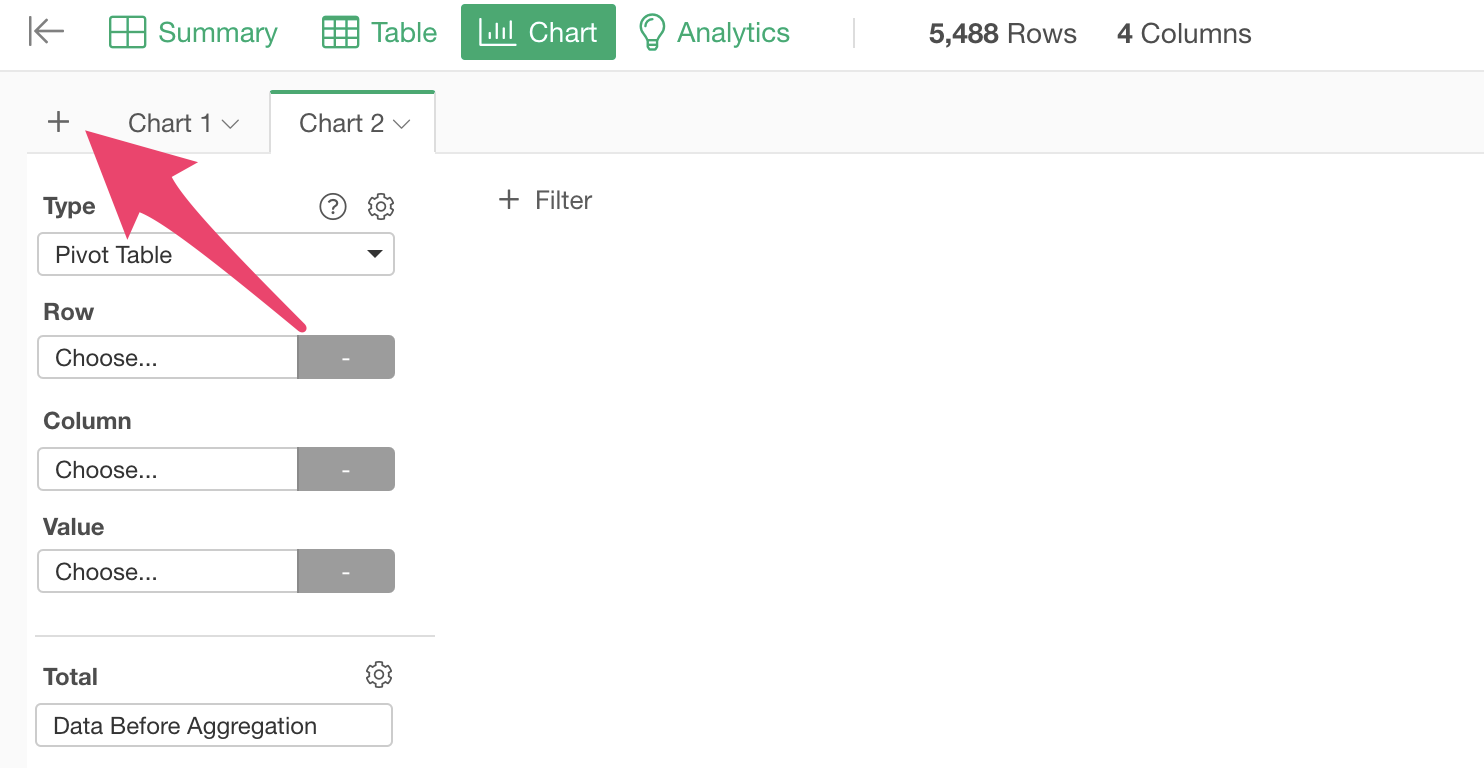
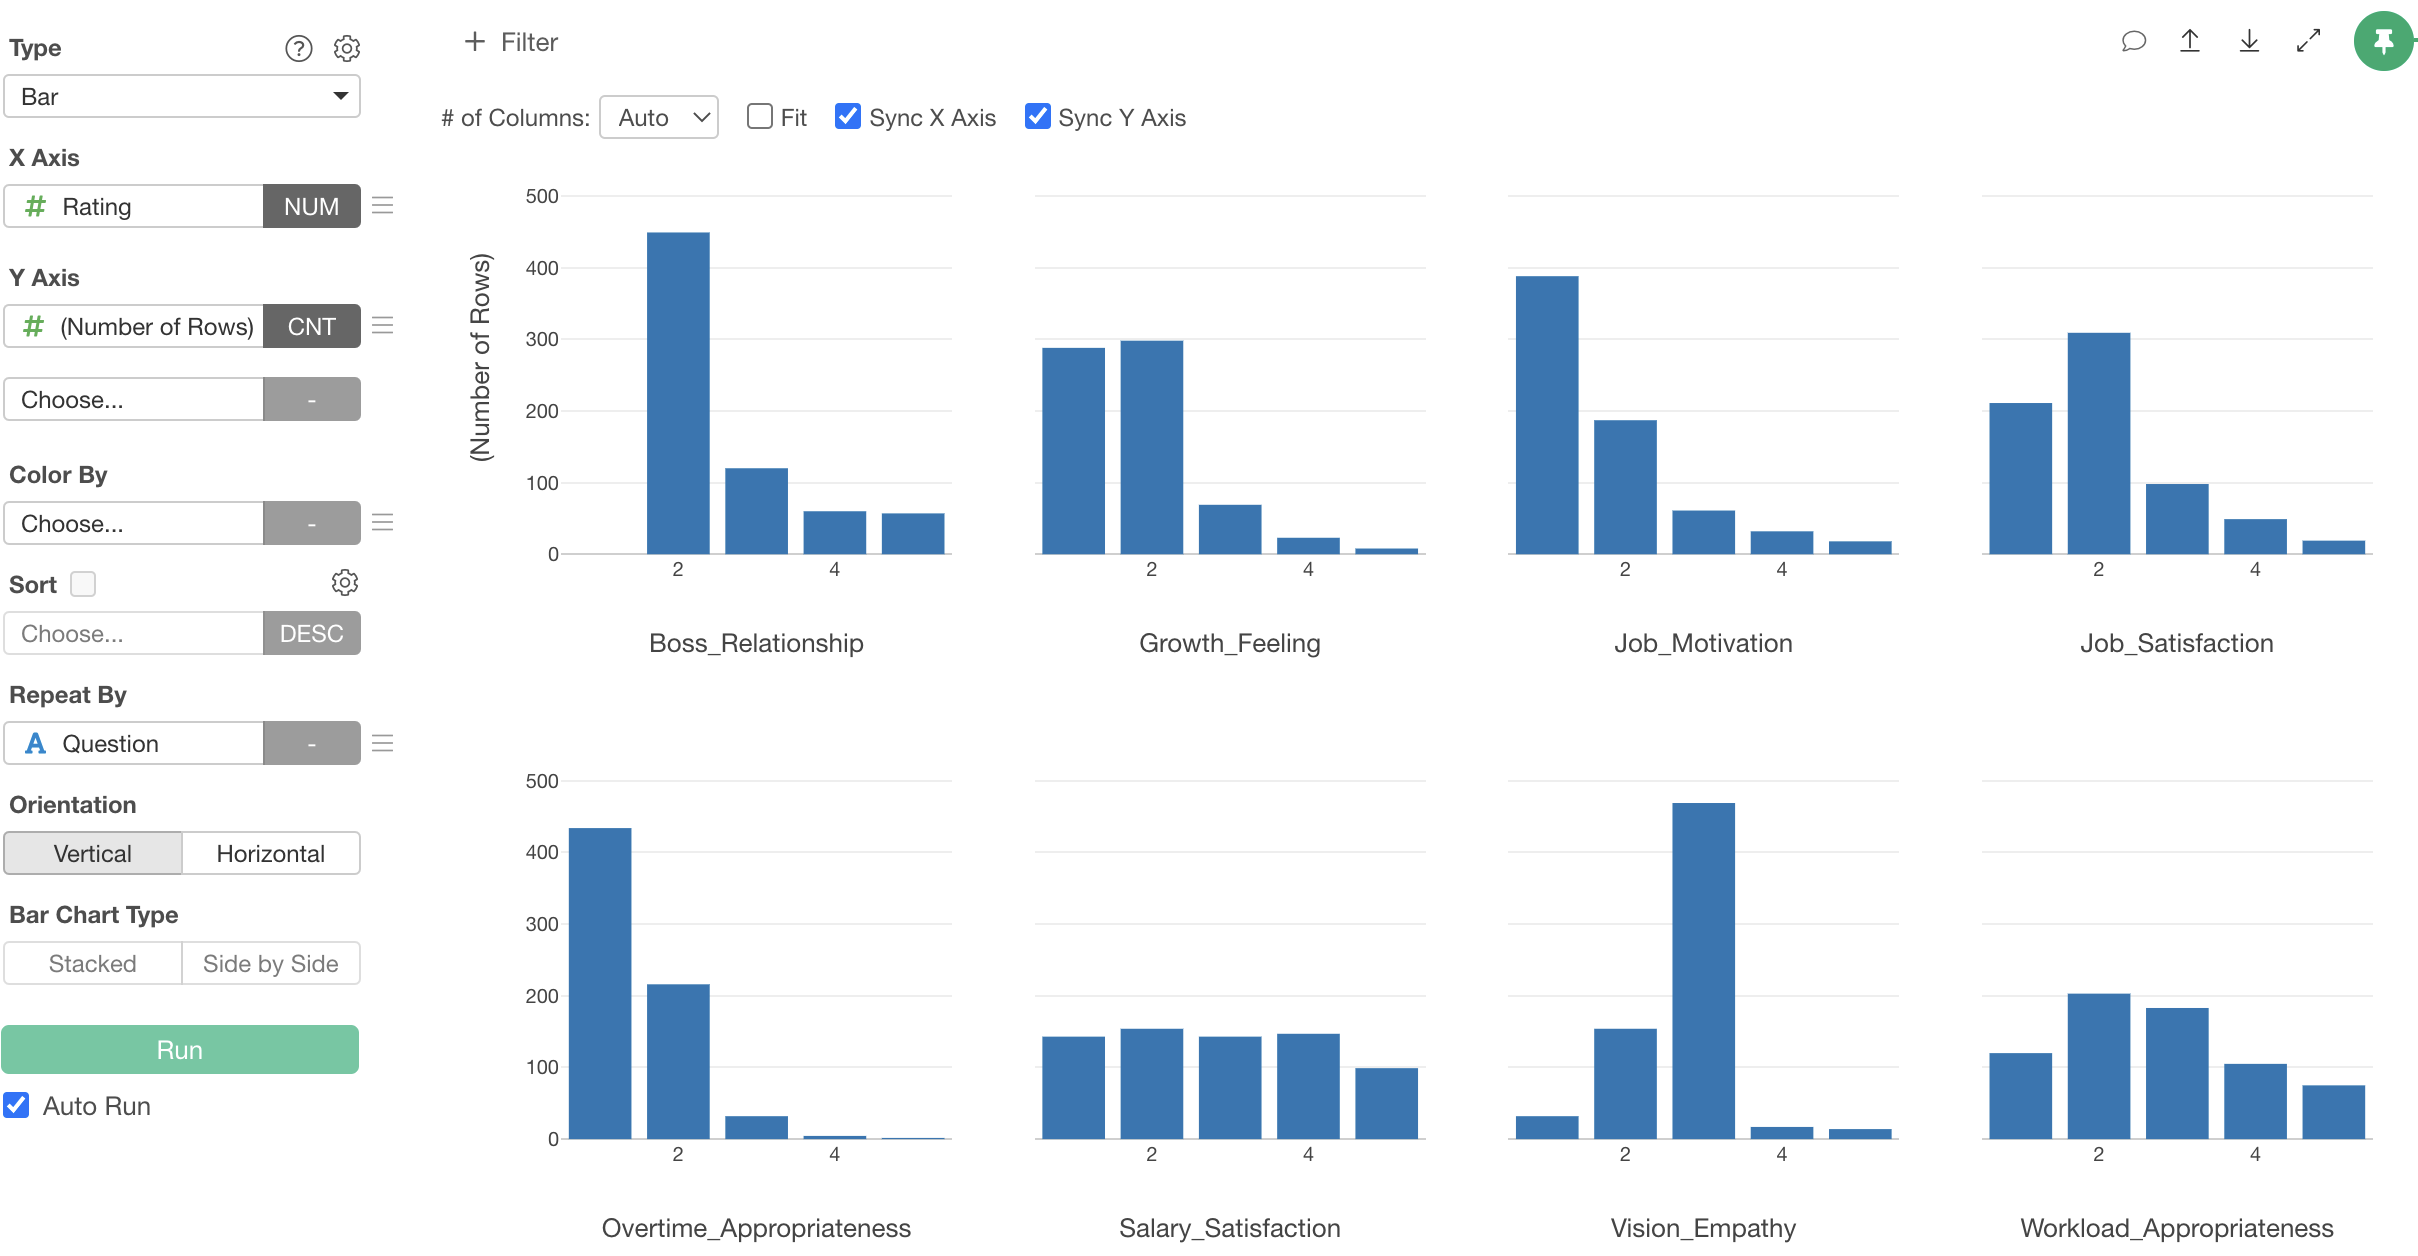
Once a new chart tab is added, select “Bar” as the chart type and select “Rating” for the X-axis.
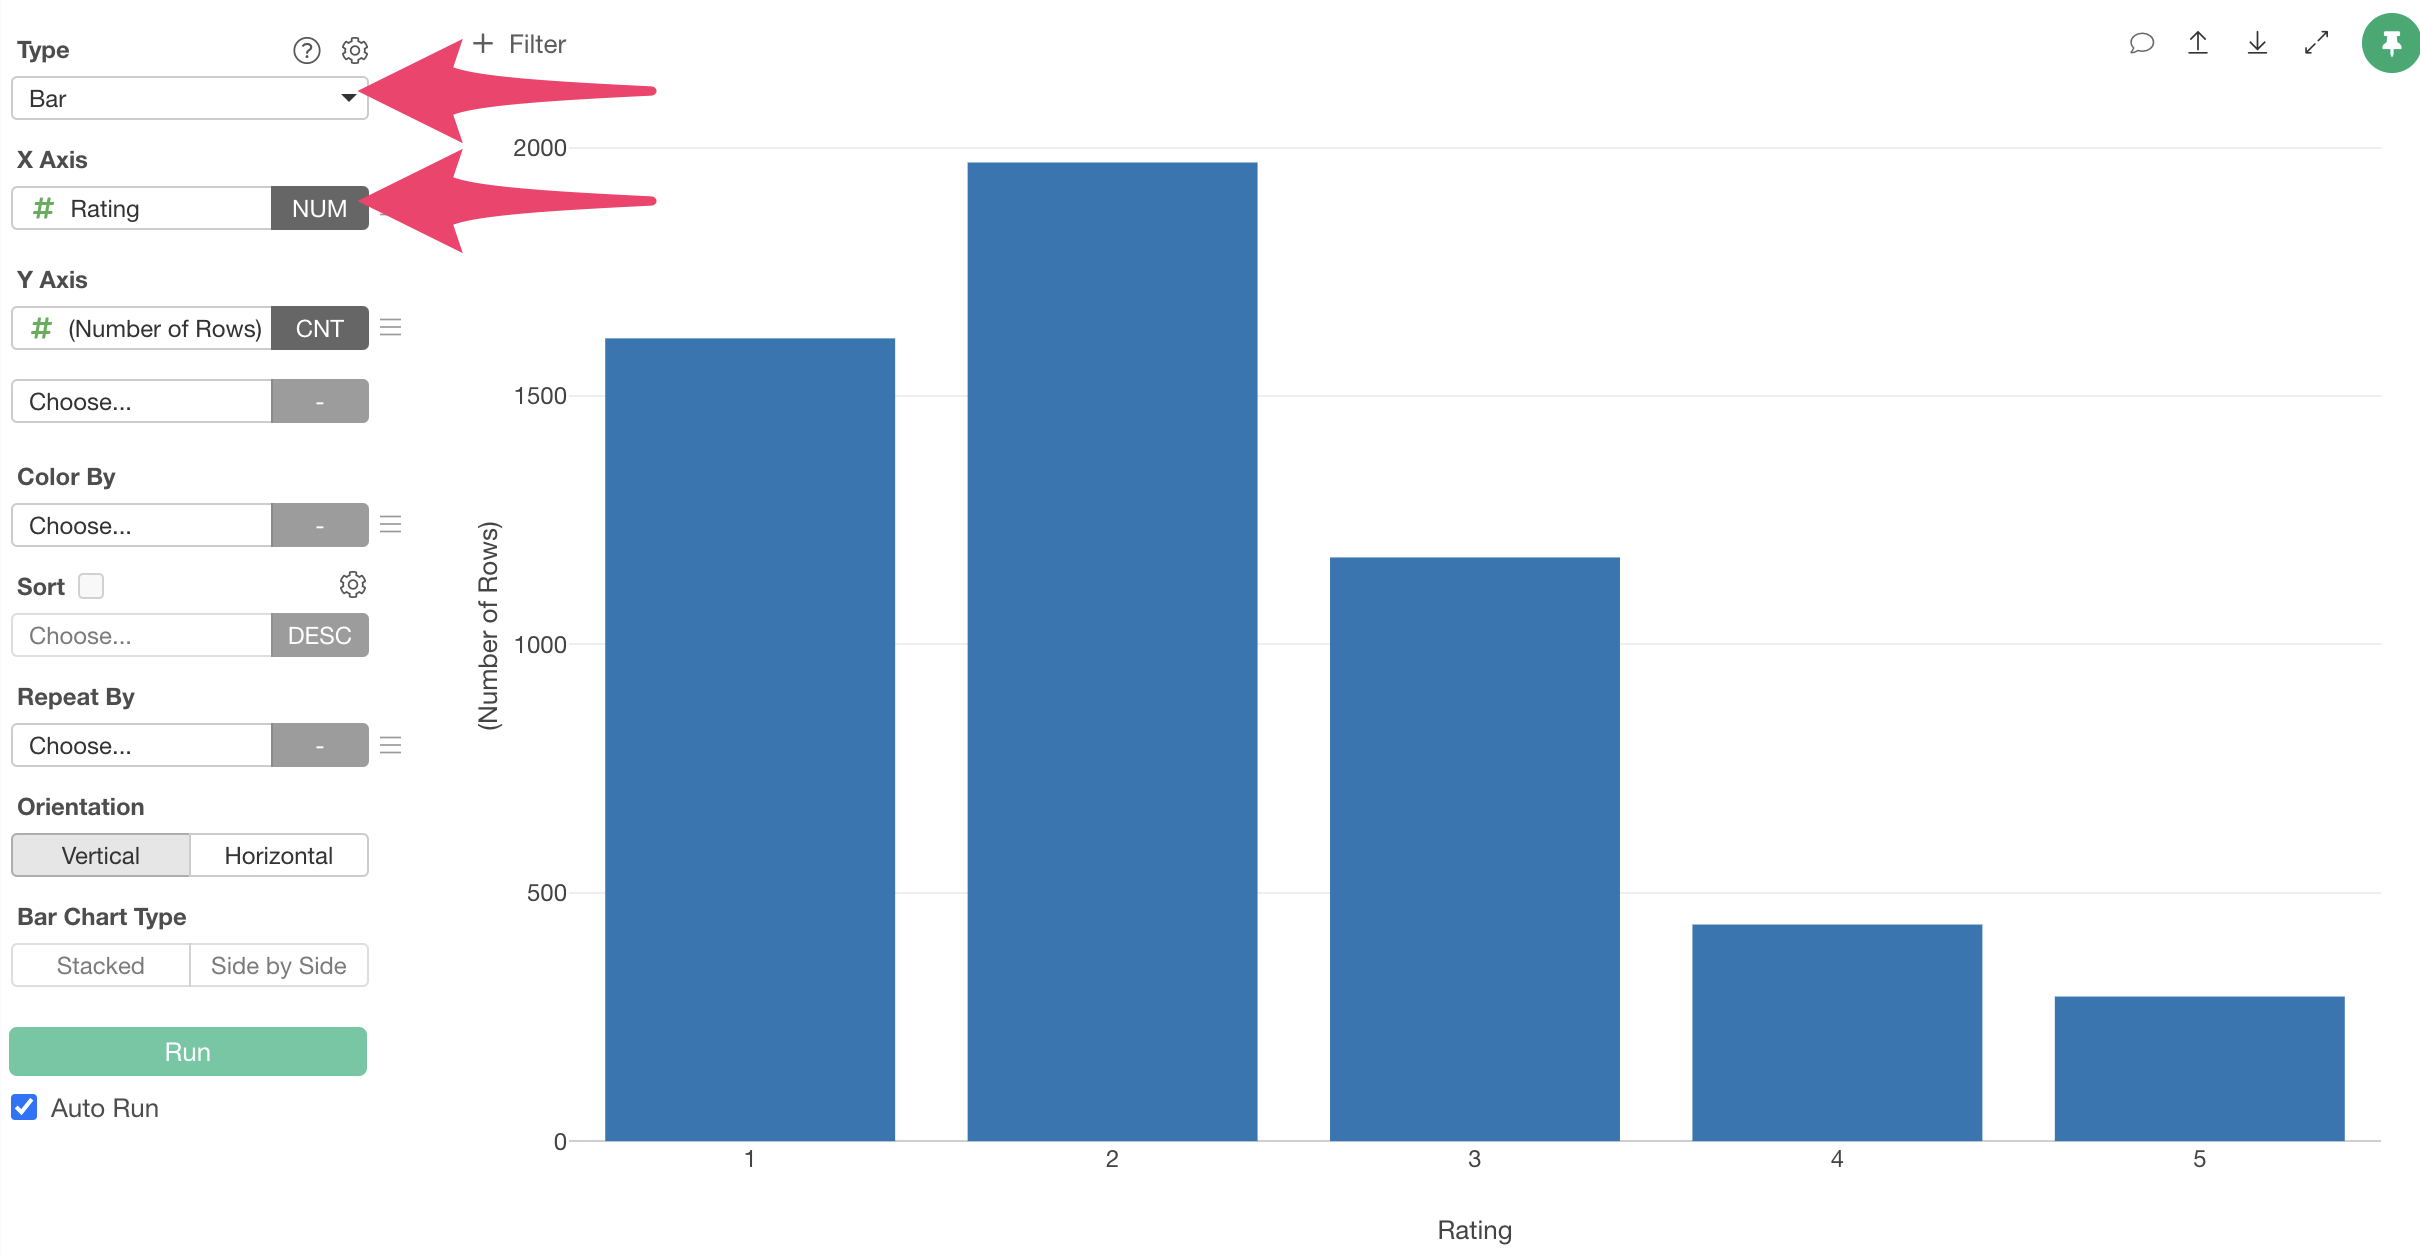
This will aggregate the number of rows (responses) for each score.
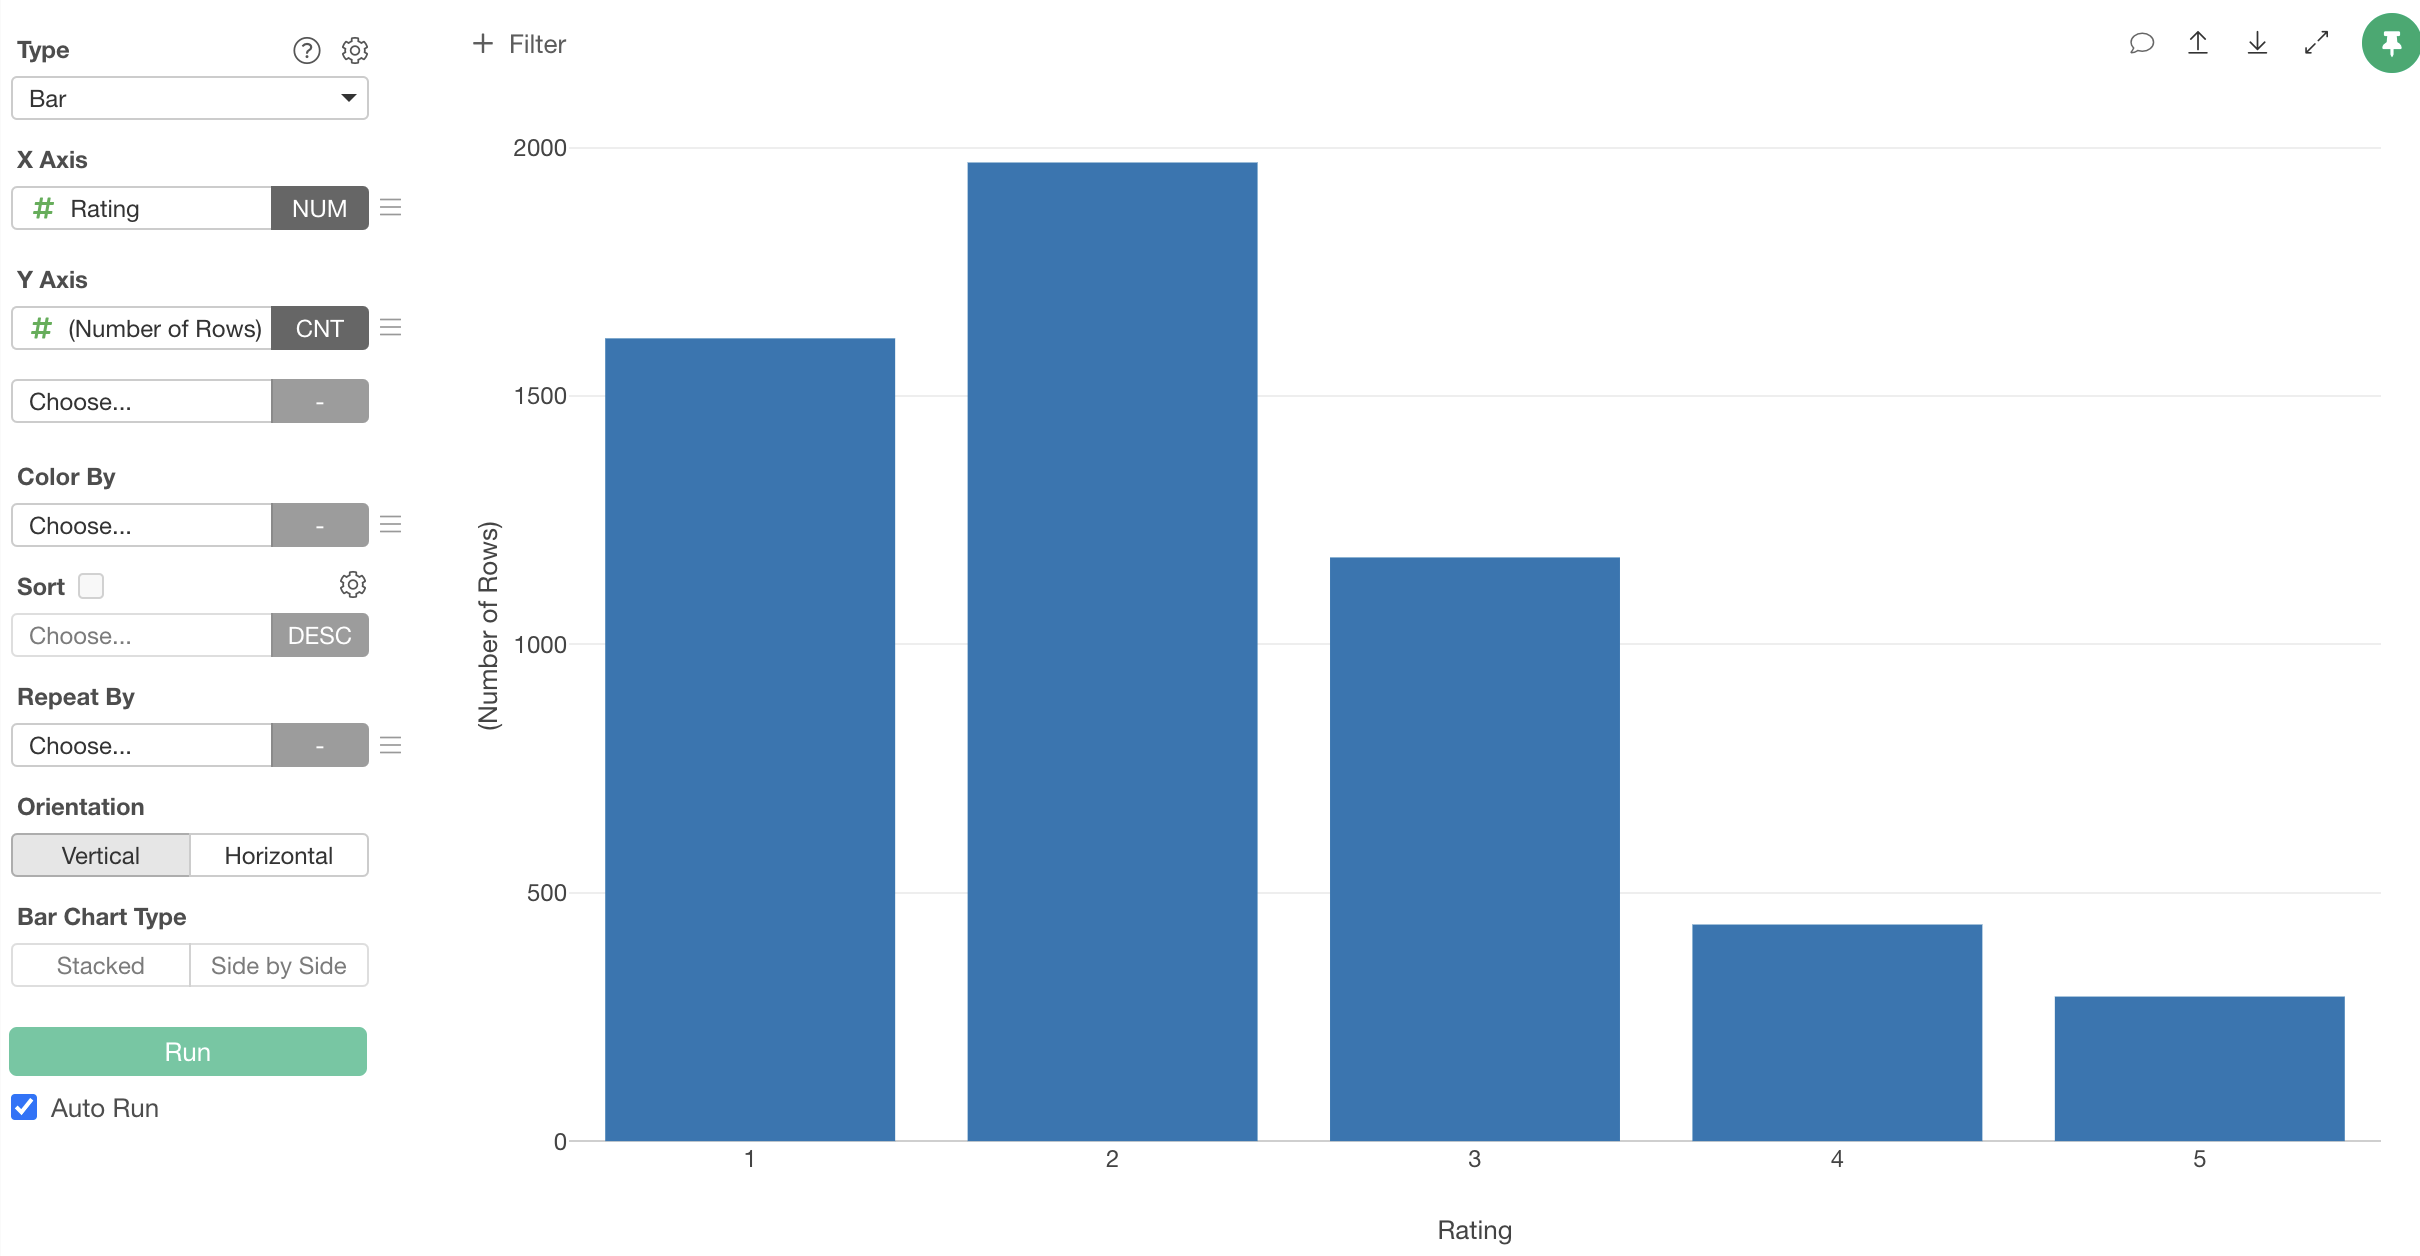
However, since the current data is in long format, this chart aggregates the number of rows for scores across all responses.
To visualize the distribution of responses for each question, select “Question” for “Repeat By”.
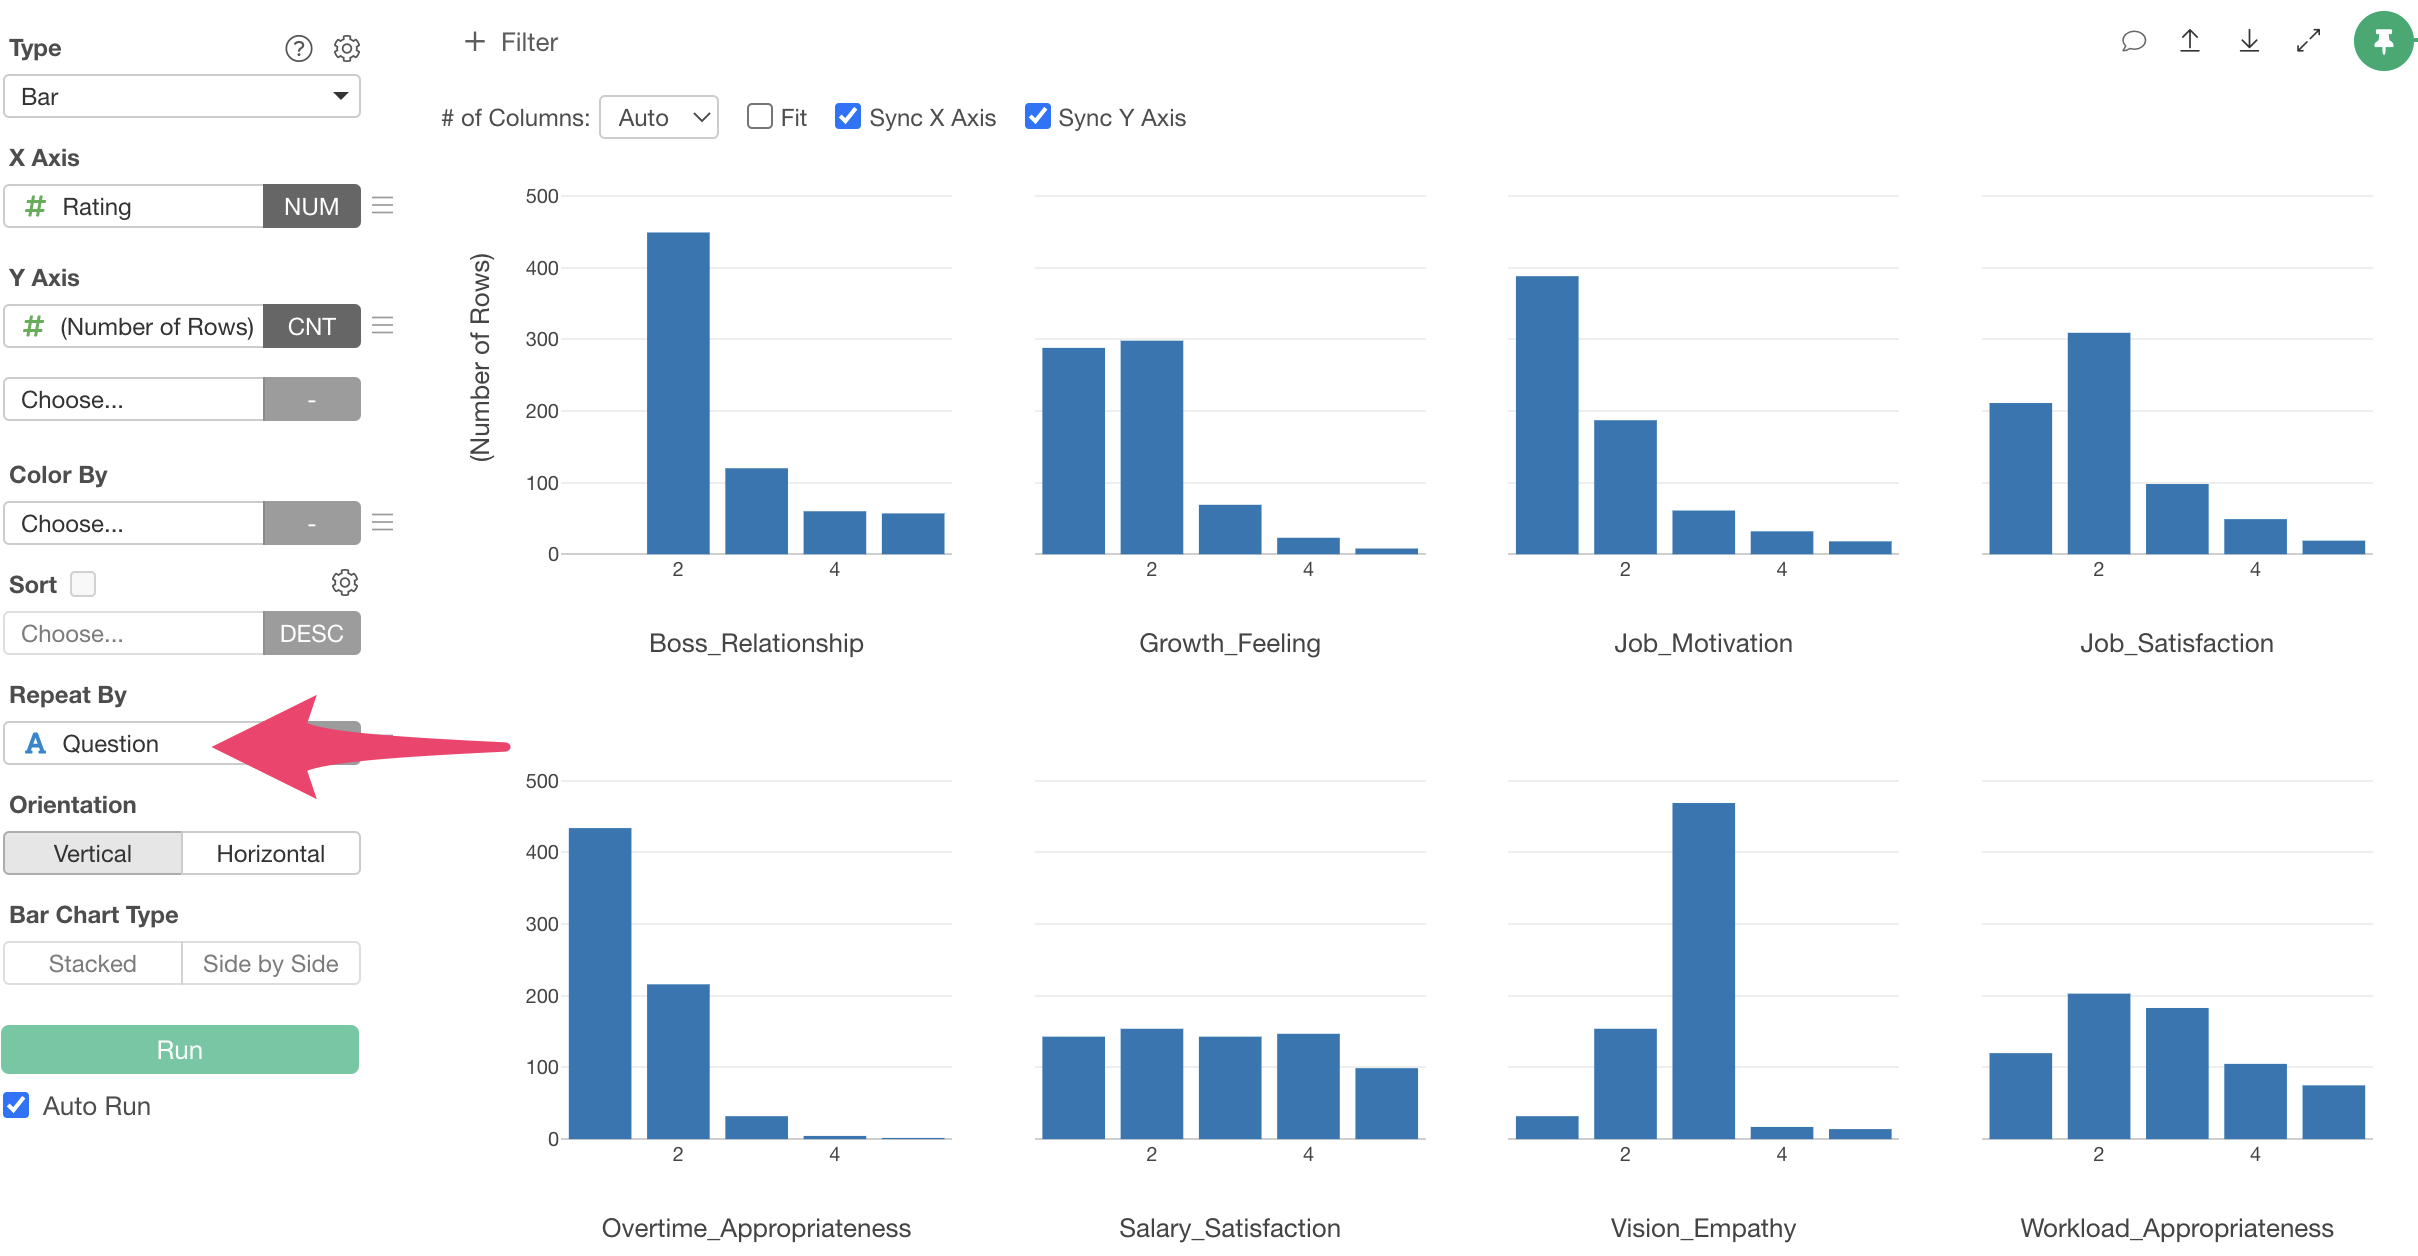
Now you can visualize the distribution of responses for each question.