Prediction of Survival by Cox Regression Model
In this post, I’m explaining how to predict probability of whether certain event happens to subjects (user, patient, etc.) in the data, within certain period of time, using Cox Regression Model.
Build a Cox Regression Model
Let’s say you run a web service like SNS. You want to build a model that predicts how the probability of survival of a user goes down as time goes by, based on which functionality the user used in the first week. We can build such a model as a Cox Regression Model.
In Exploratory, building Cox Regression Model can be done easily with Analytics View, but this time, so that we can make predictions with the model we build here, let’s build Cox Regression model as one of the data wrangling steps.
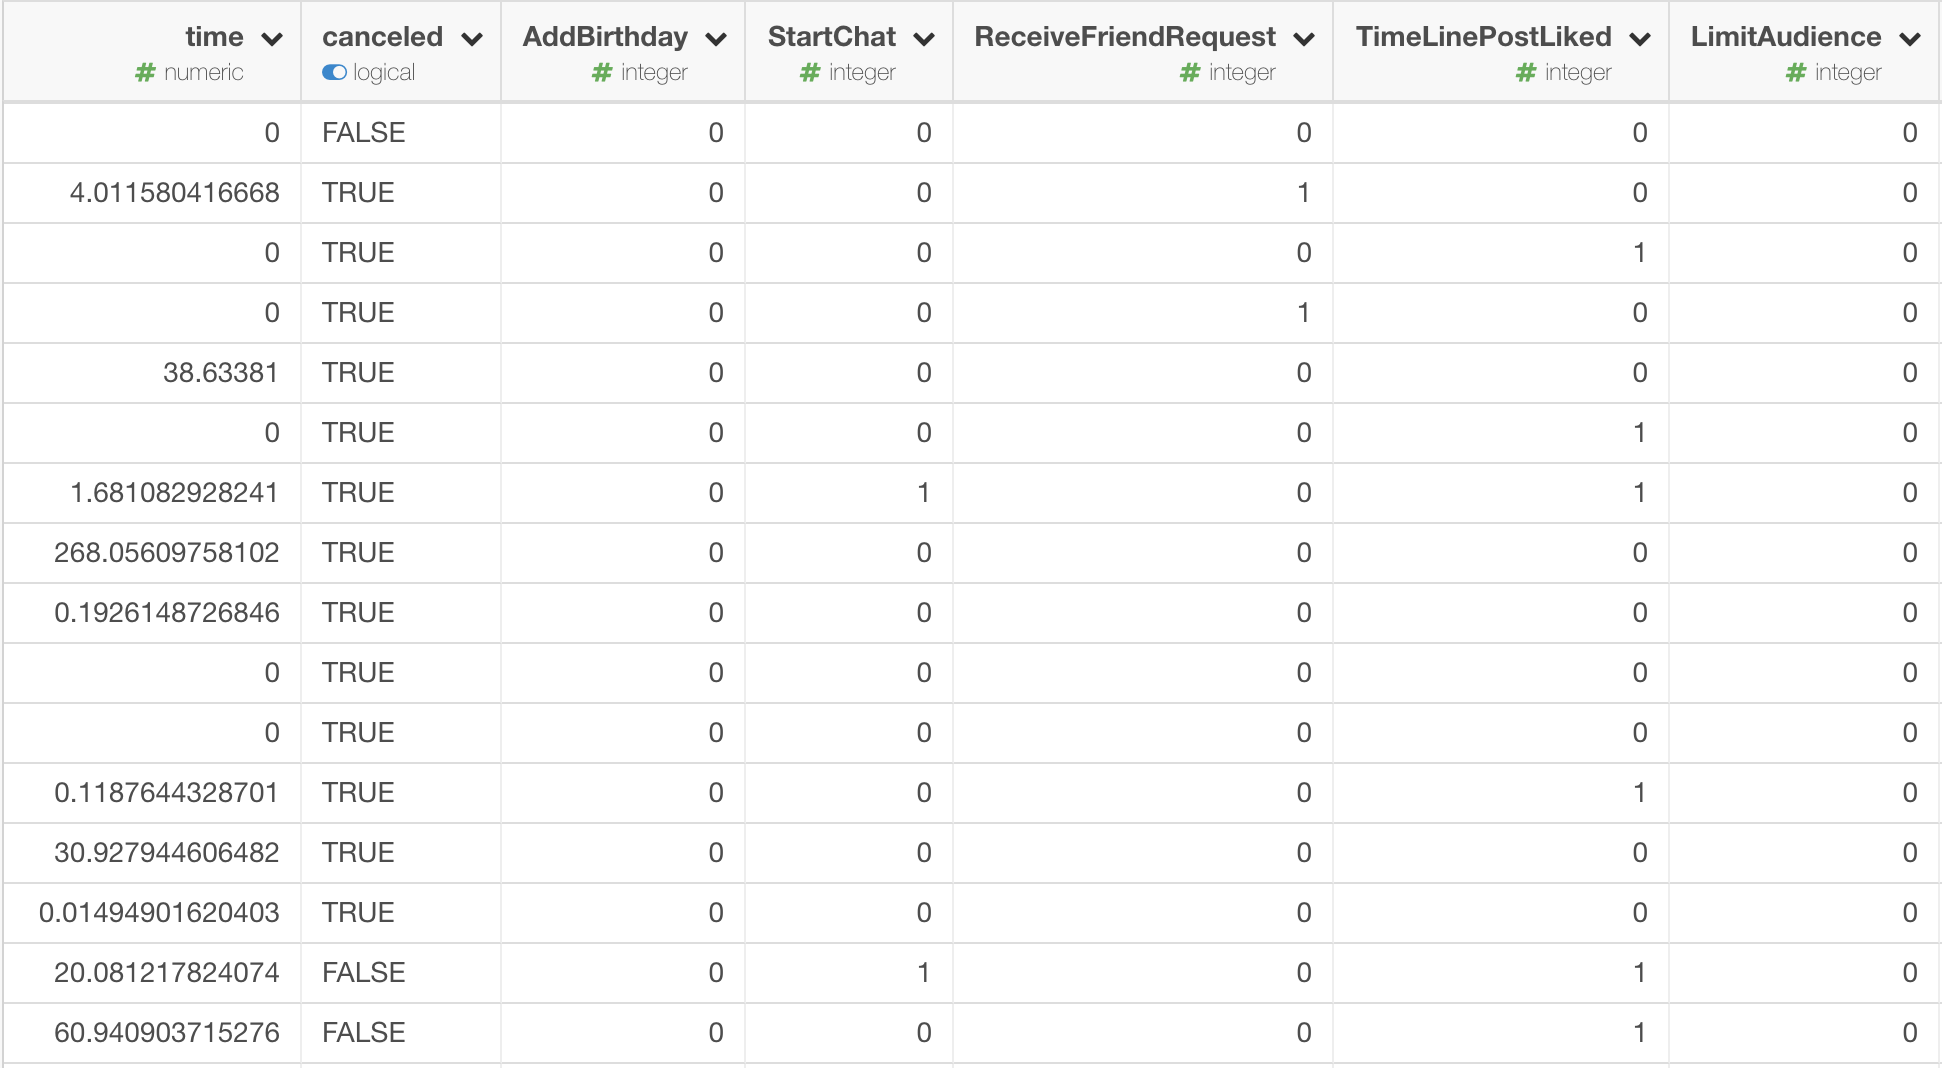
One row of the data we have here represents one user. time colum represents the length of time between when the user signed up and when the user canceled the service, or the present, if the user never canceled the service. cancel column represents whether the user canceled the service. Other columns represent whether the user used particular feature in her first week of using the service.
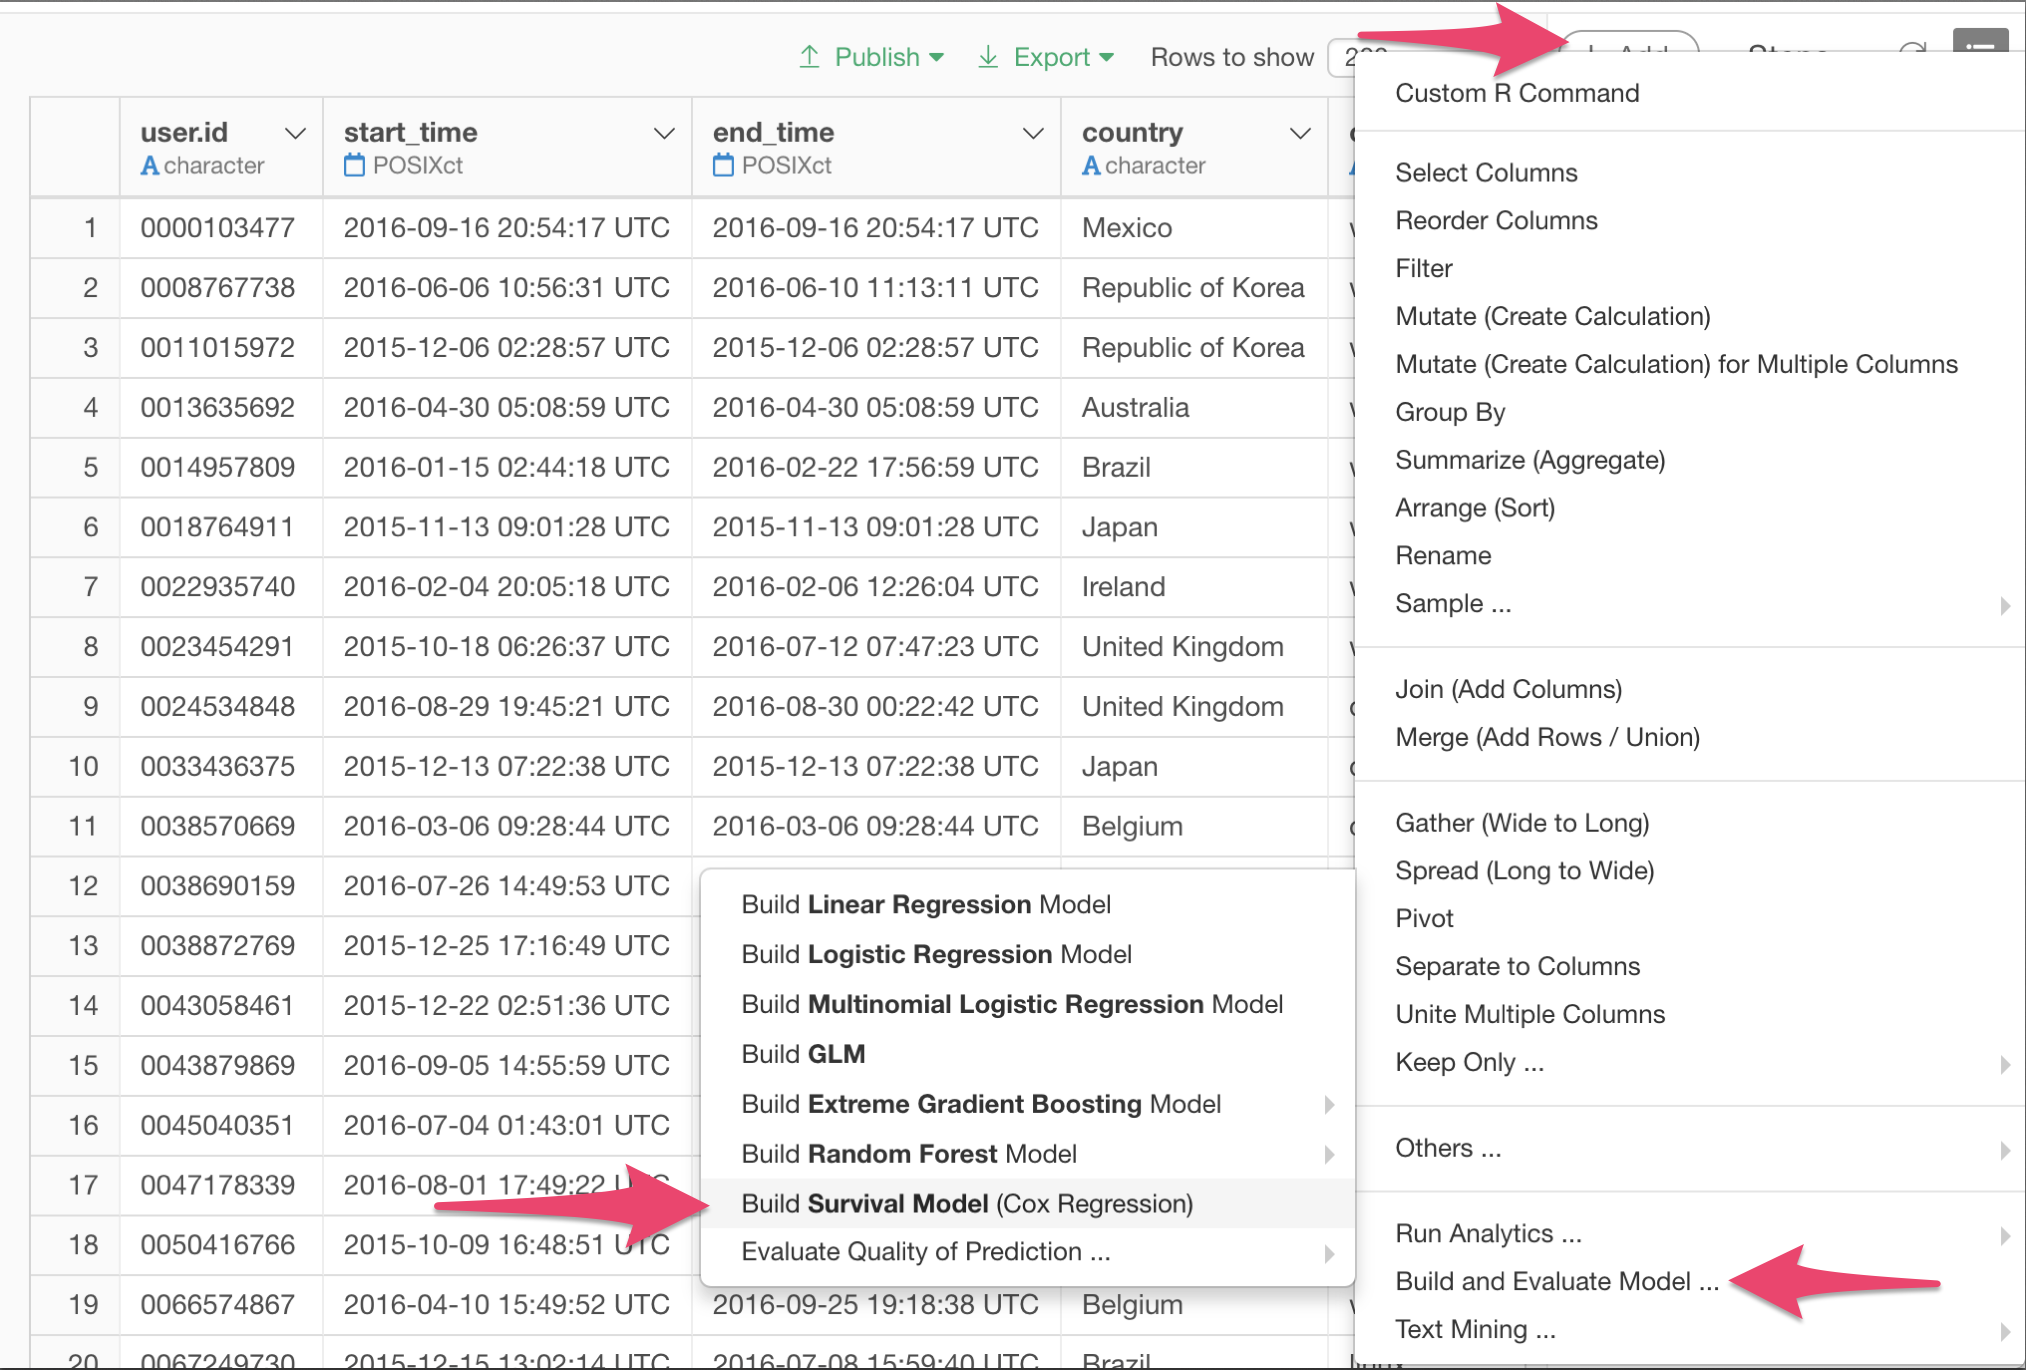
Click Add button, and select Build Survival Model (Cox Regression) menu like the following screenshot.
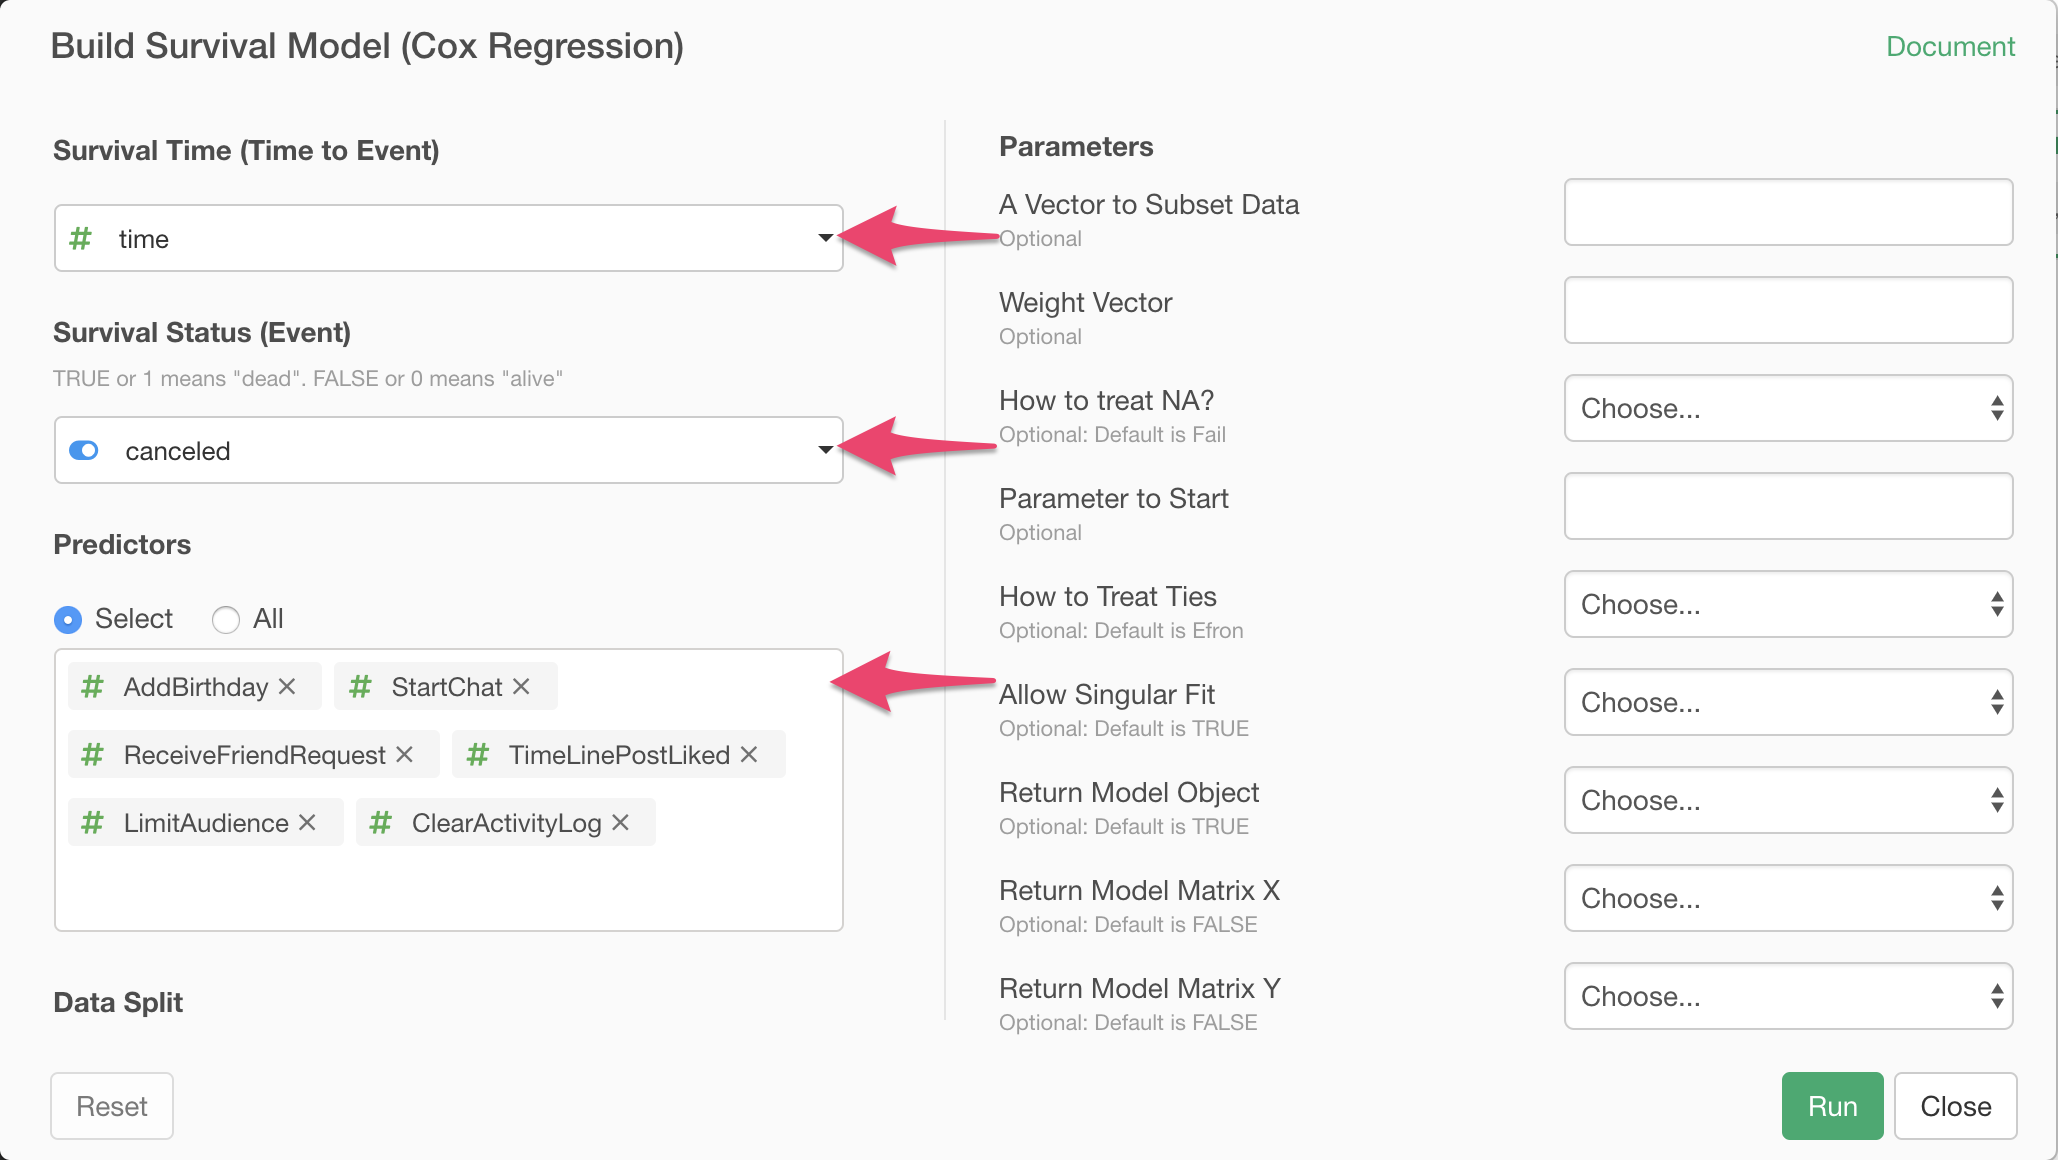
In the dialog, specify the colums for Survival Time, Survival Status, and Predictors.
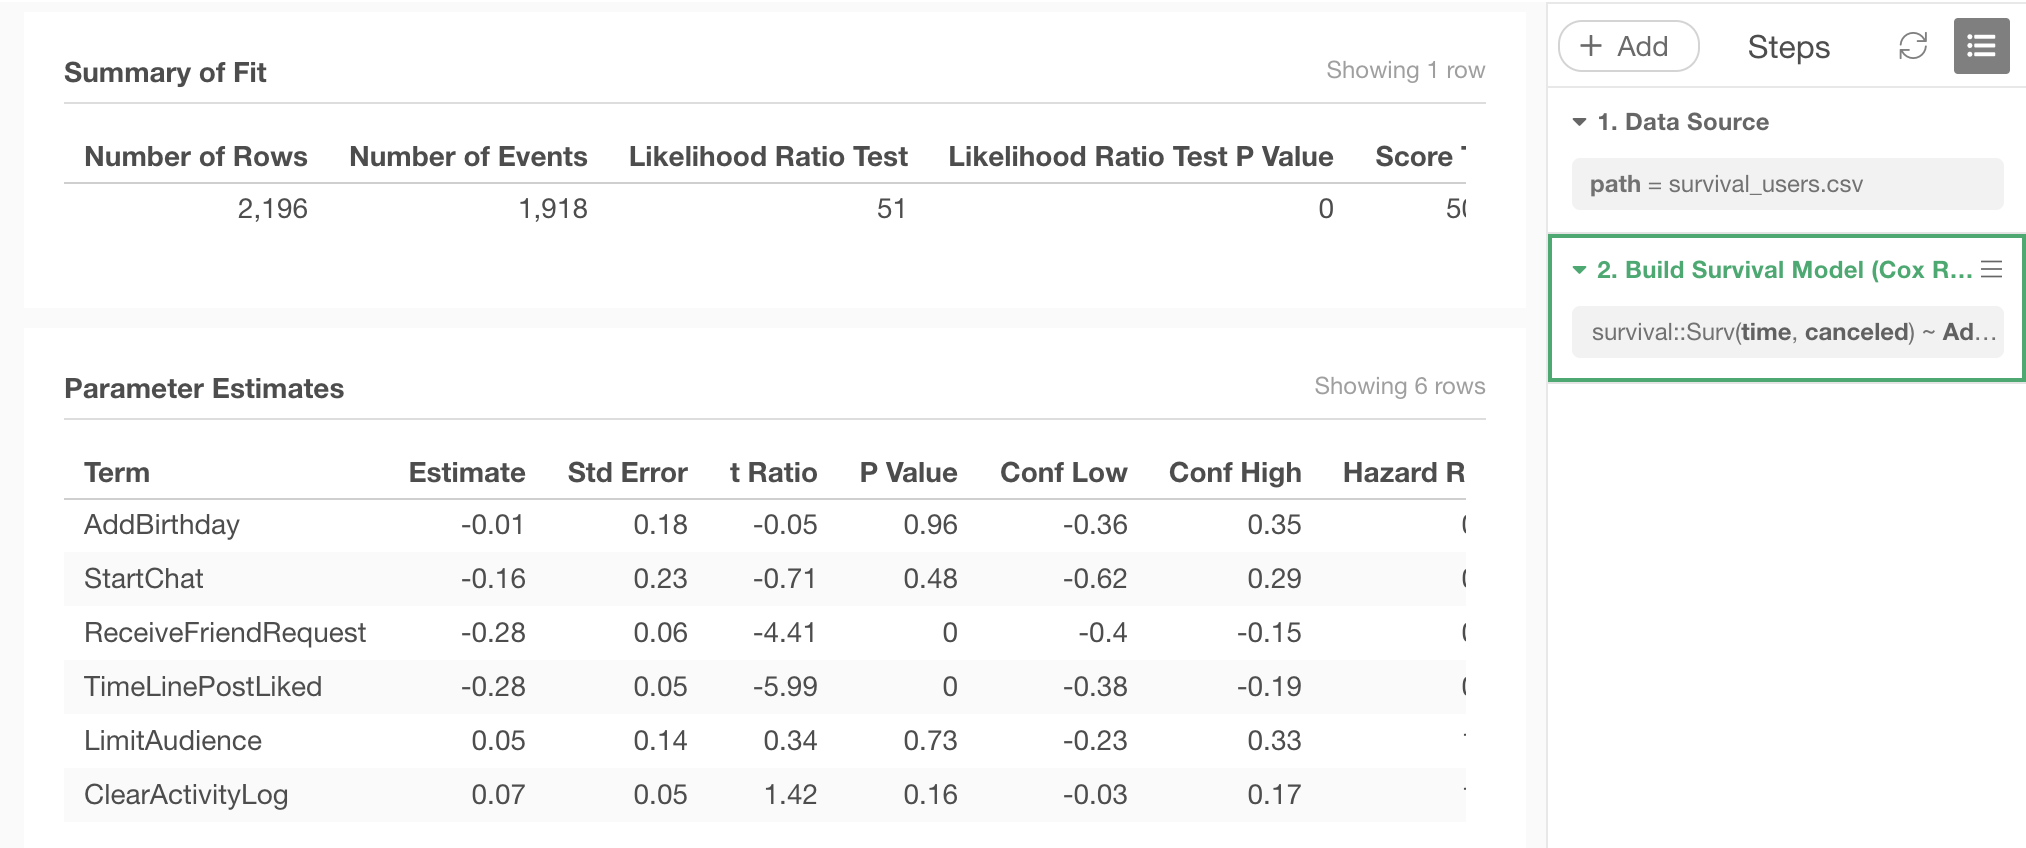
Click Run button. The model is built and the summary of the model is displayed like the following screenshot.
Predict with the Cox Regression Model
Let’s predict the probability for each user in the data to cancel within certain length of time.
In Exploratory, you can automatically split the data into training data, which you use to build the model, and test data, which you use to check how well the resulting model can predict, and you can run prediction with the model for both portion of the data.
In real application, you may want to feed new data to the model you built on past data as training data, to make prediction on new subjects, which are new users in this case.
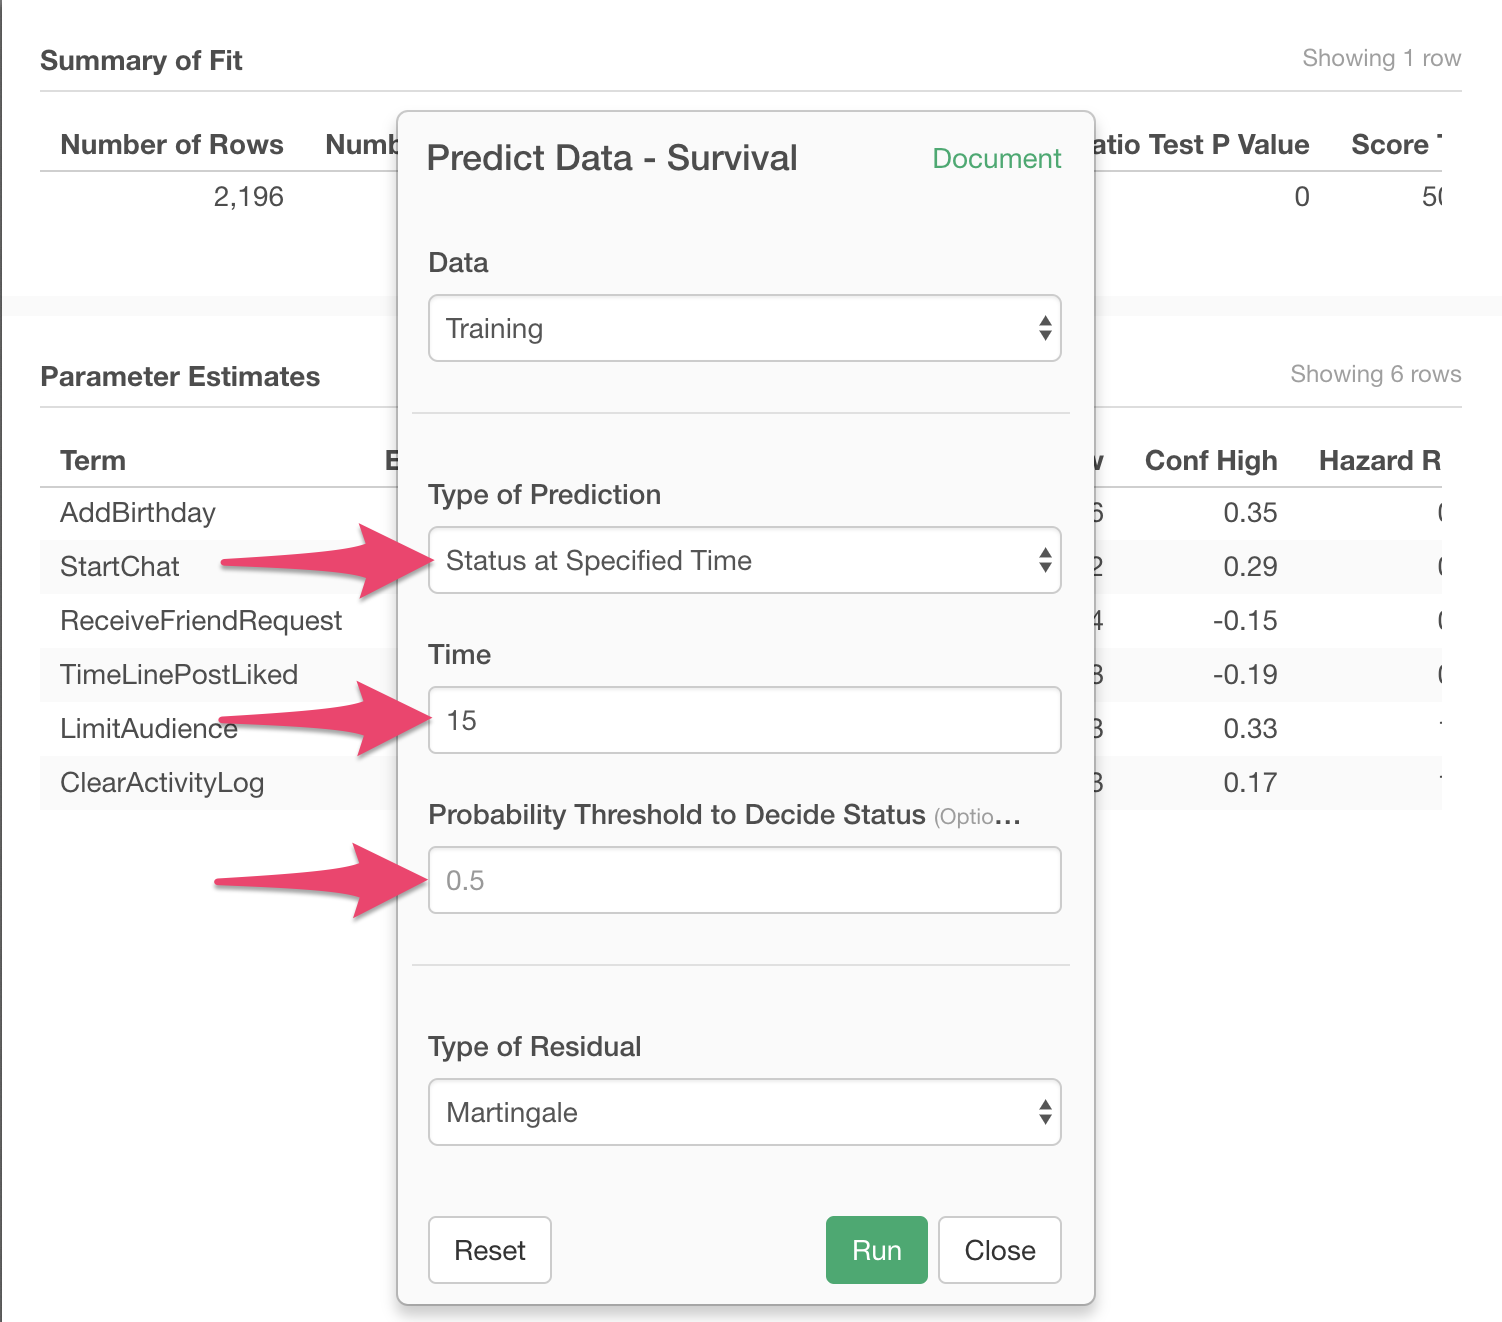
But this time, for the simplicity, let’s just use whole data for the training of the model, and predict what the model thinks on the probability of those users canceling within 15 weeks, based on the features they used in their first week.
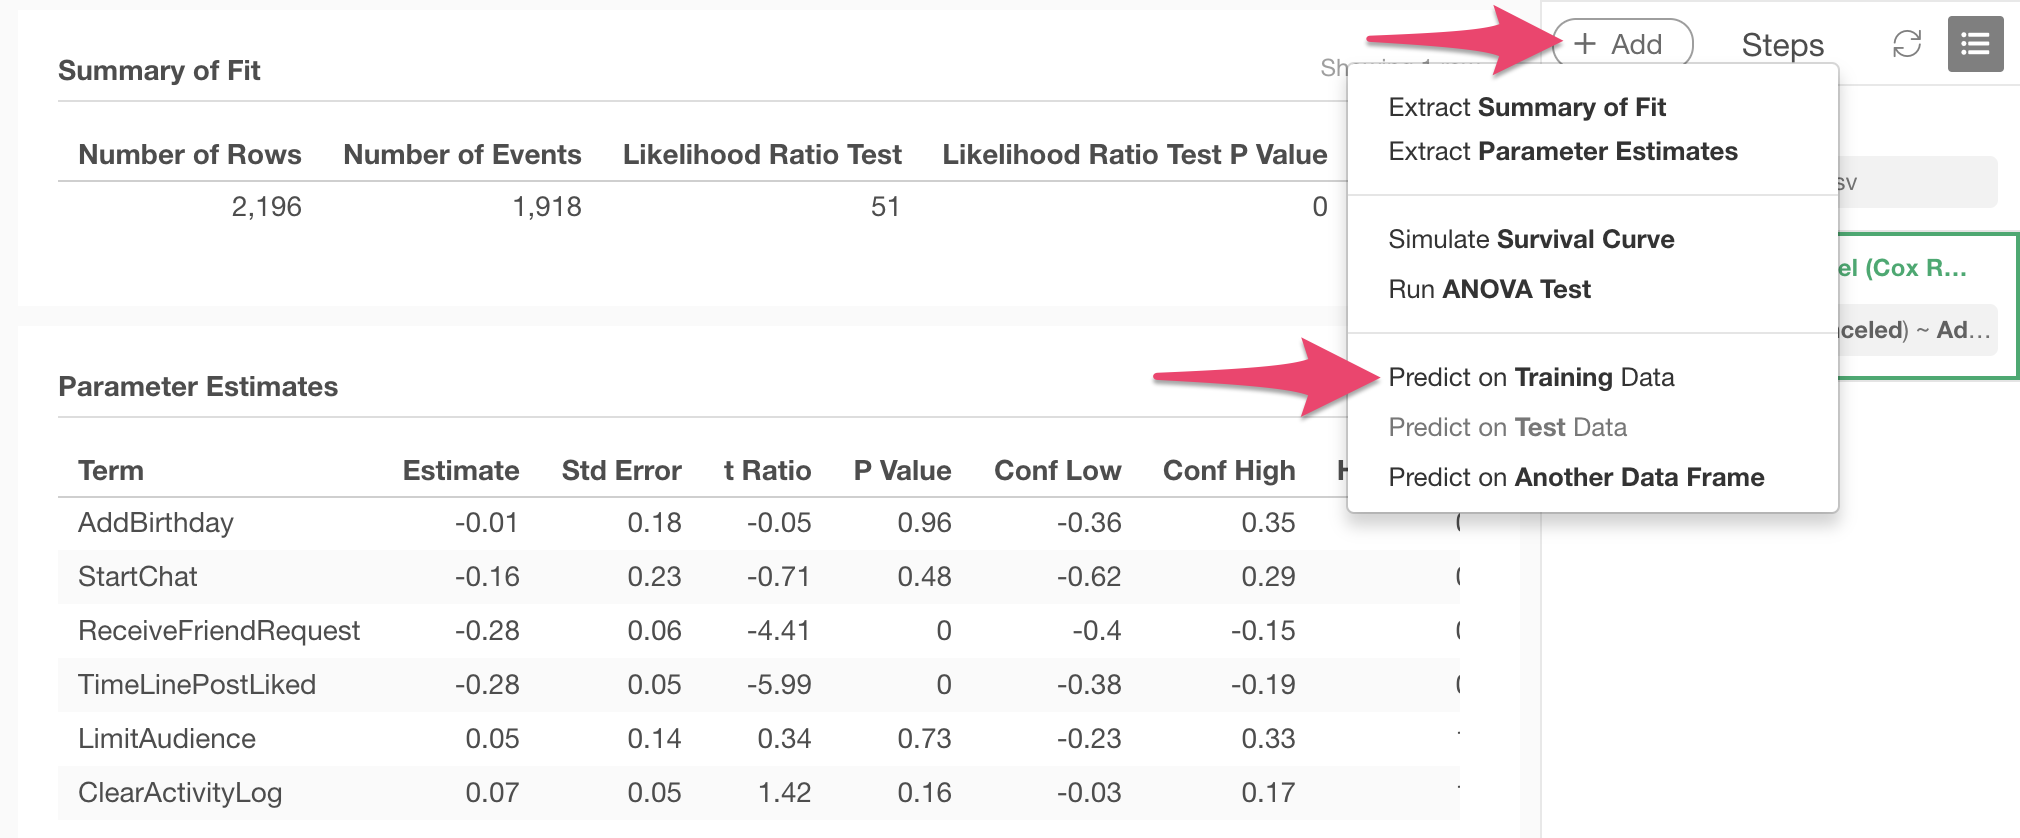
Click Add menu, and select Predict on Training Data menu.
In the dialog, select Status at Specific Time as type of prediction, and specify the time and threshold of the probability.
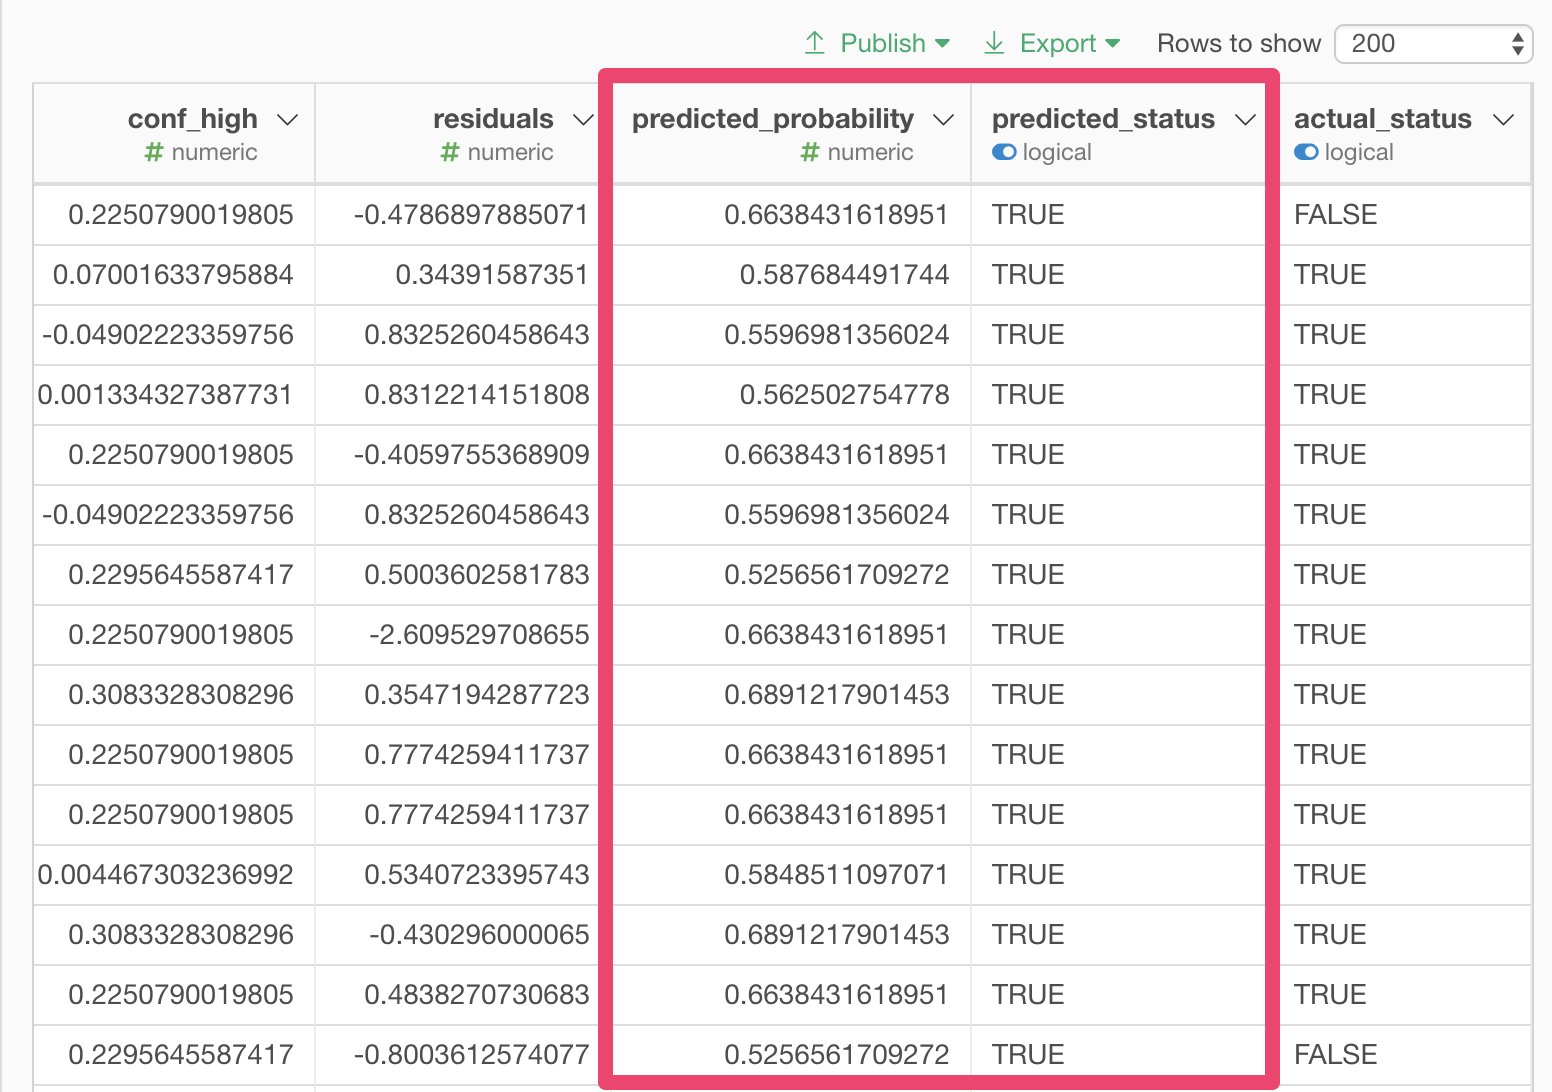
One row of the resulting data frame represents one user. predicted_probability column has the probability for each user to have the event within the specified length of time, predicted by the model.
predicted_status column is the model’s prediction, which is made by comparing the threshold and the predicted probability. TRUE means the prediction that the event will happen within the specified length of time, and FALSE means it will not.
Once you have the result of prediction as data, you can export this data in various formats, or visualize it in different types of charts. You can also create Note or Dashboard that explains or keeps track of the data with prediction, and share with other members of your team.