Running Factor Analysis with Exploratory
In this Note, I will explain how to run factor analysis in Exploratory, using R's standard factanal function.
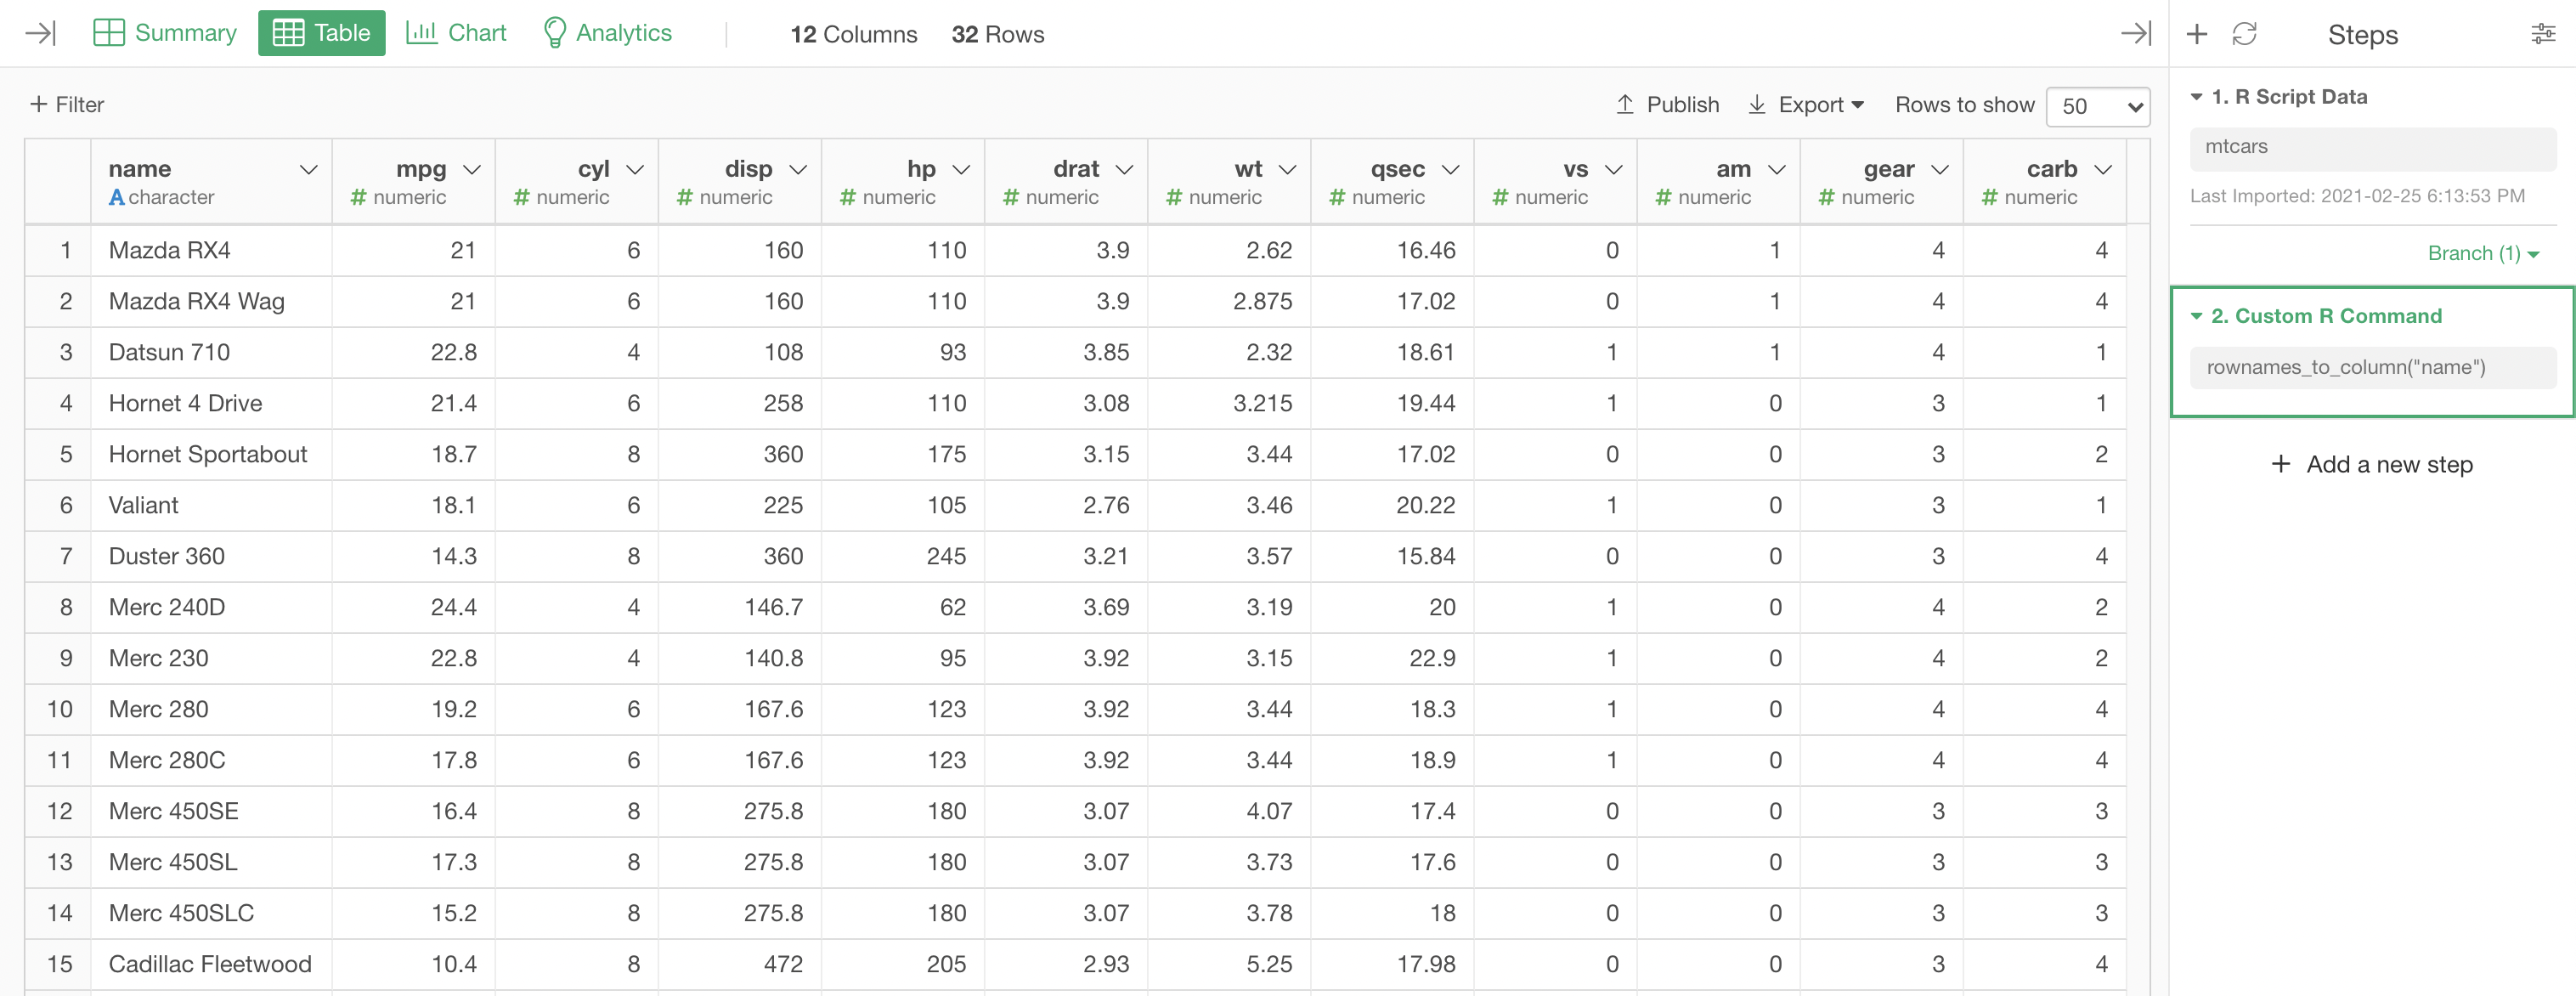
Data
As the example data, let's use R's standard mtcars data, which is data about cars. Each row represents one model of car, and it has columns like miles per galon (mpg), number of cylinders (cyl), etc.
Create a Factor Analysis Model
Here, we will assume that there are 2 hidden factors that dictates all of those qualities of cars in the data, and run functor analysis to see what those factors would look like.
Let's run the following Custom R Step to create a step with the factor analysis model.
do(model=factanal(., factors=2, scores="regression"))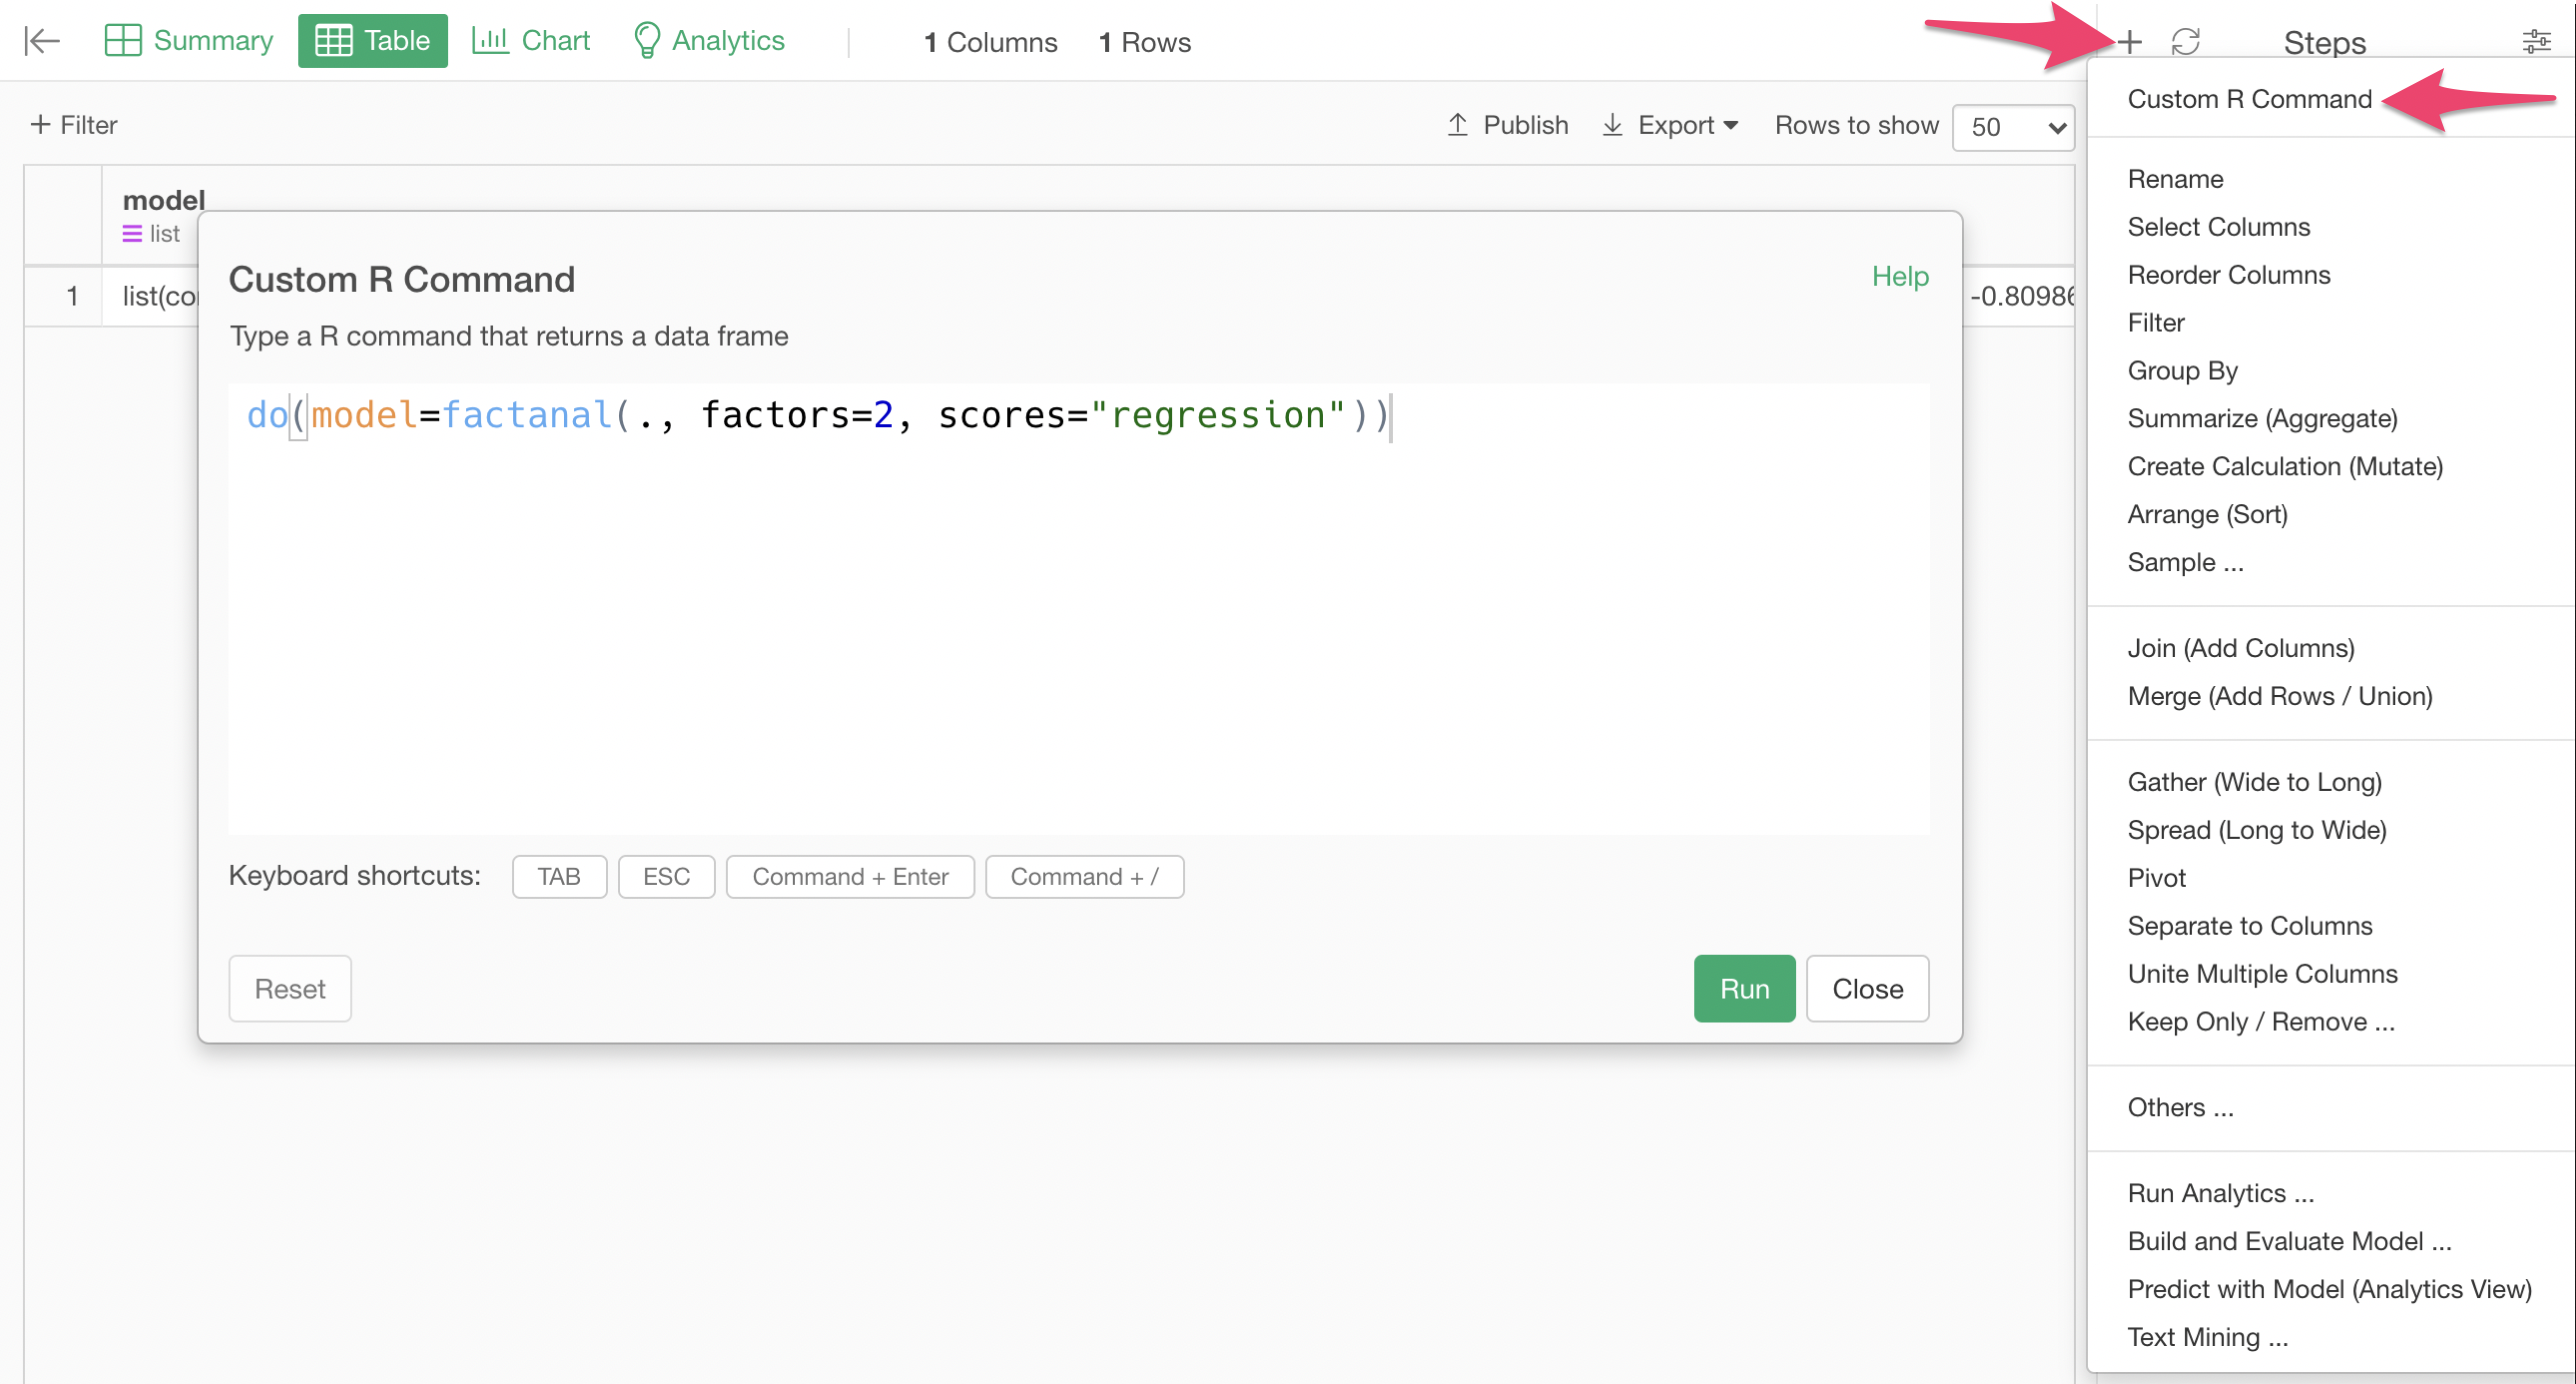
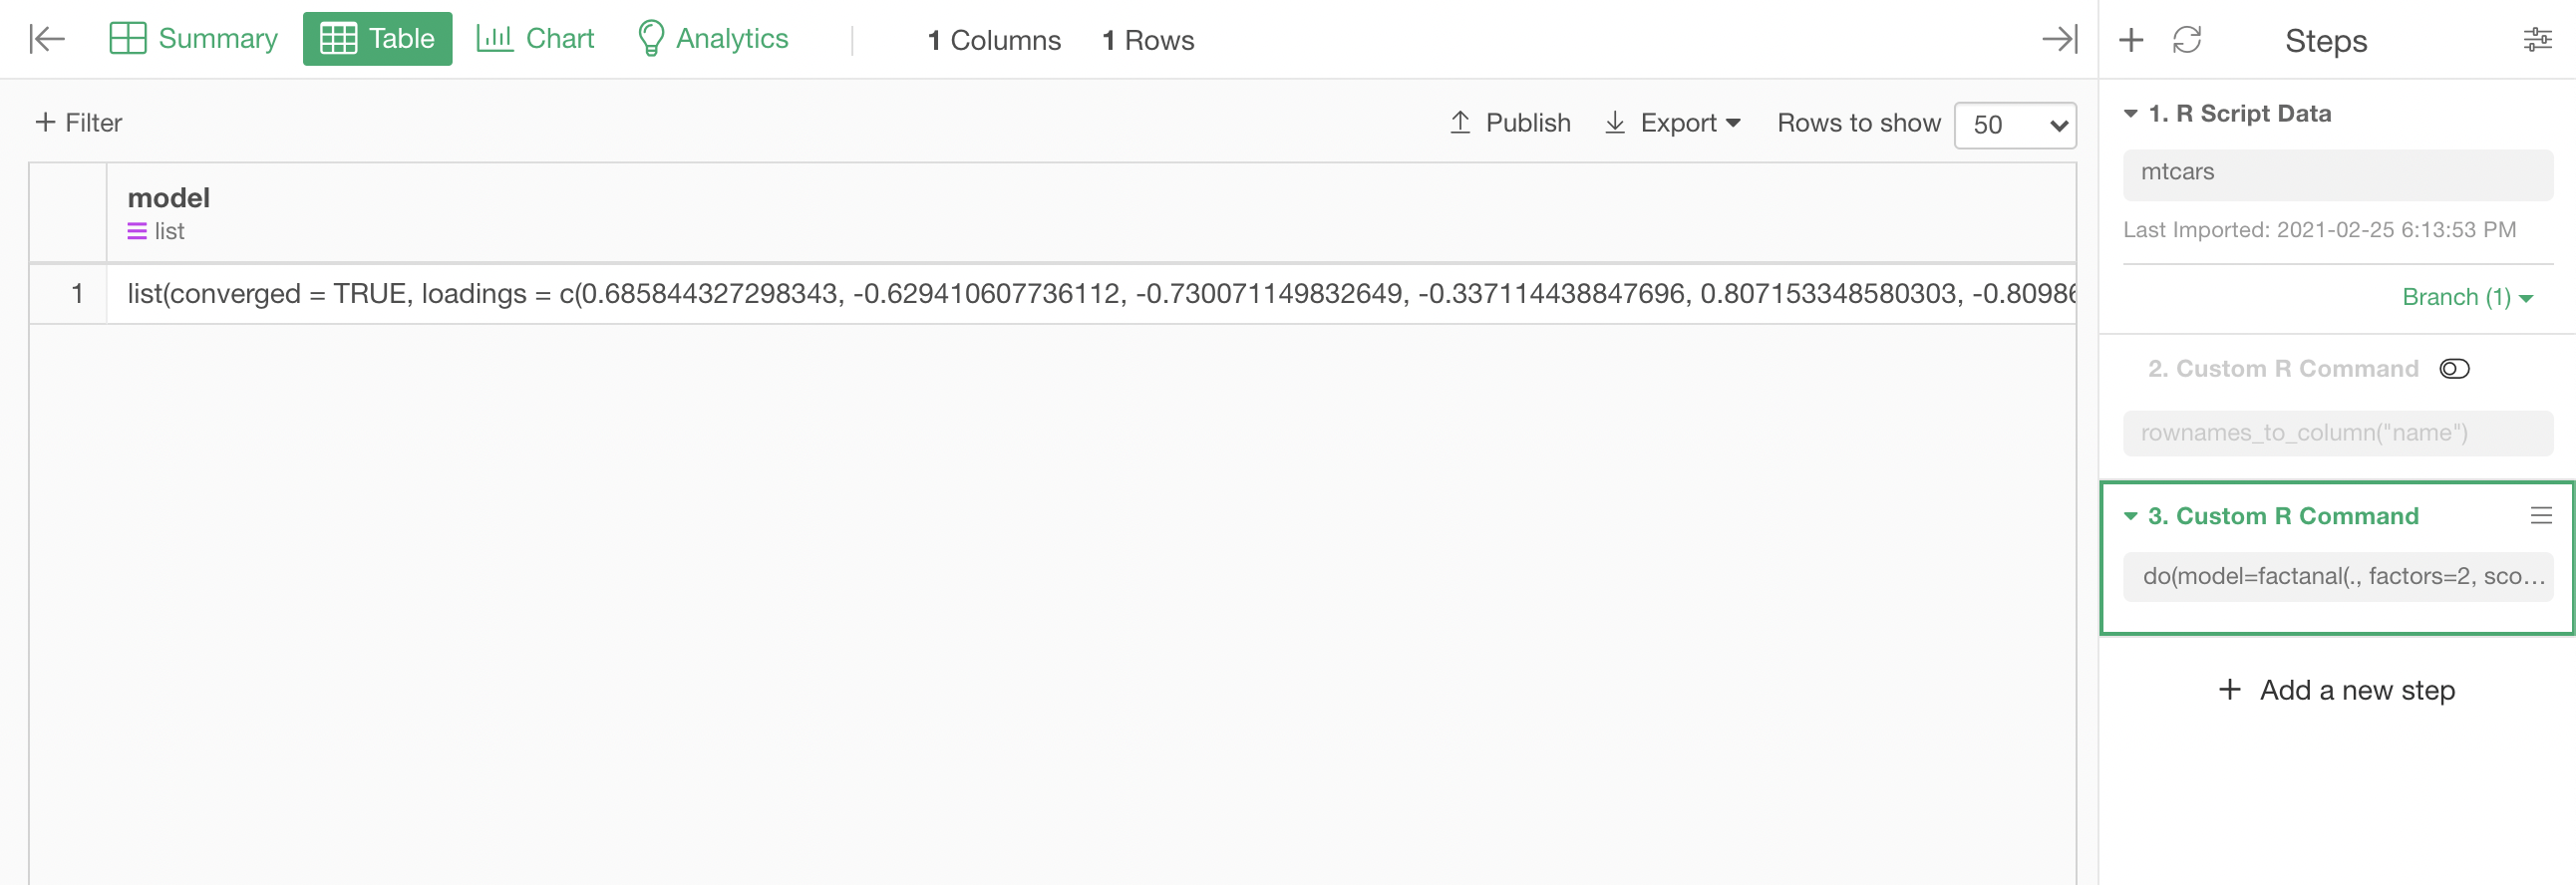
This will create a step that looks like this, which holds the resulting factor analysis model as its model column.
Retrieve Results from the Model
Now let's retrieve the results of the analysis from the created model step. There are a few types of the results, and we will go over them one by one.
Express Each Row with the Factors
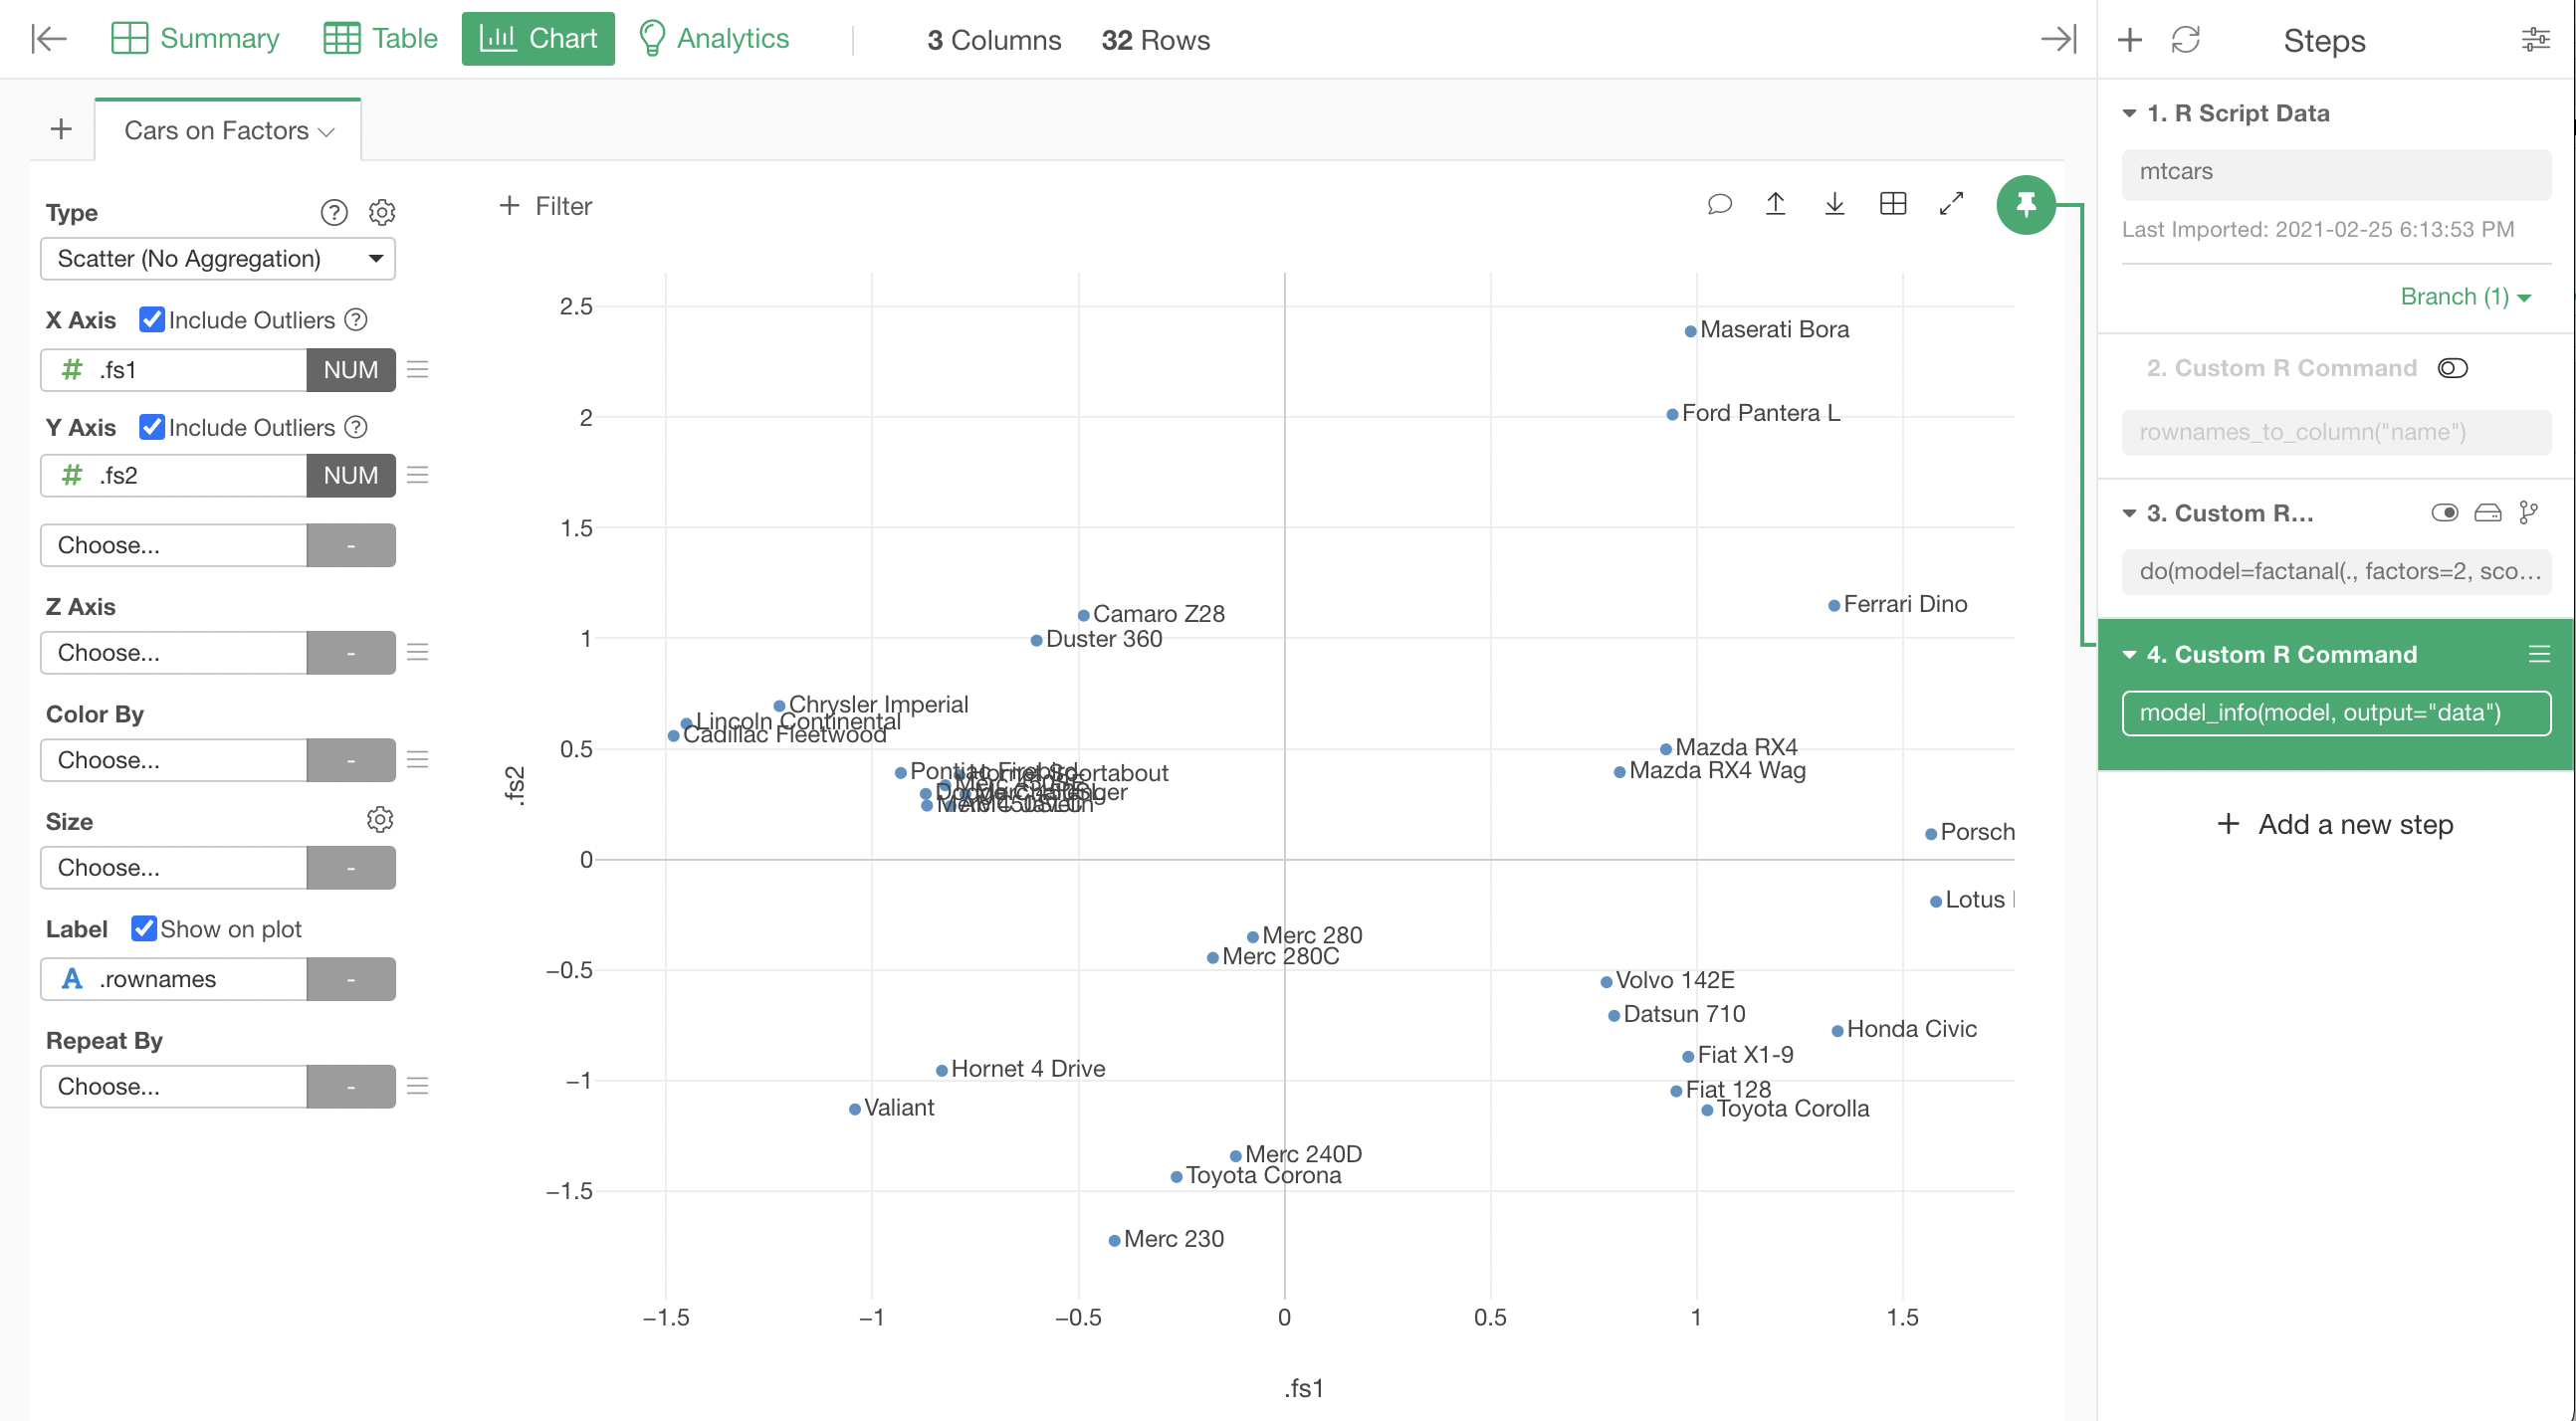
First, let's see how each car is expressed when looked through the 2 factors the factor analysis came up with.
Let's add a Custom R Step after the model step with the following command.
model_info(model, output="data")The result should look like the following.
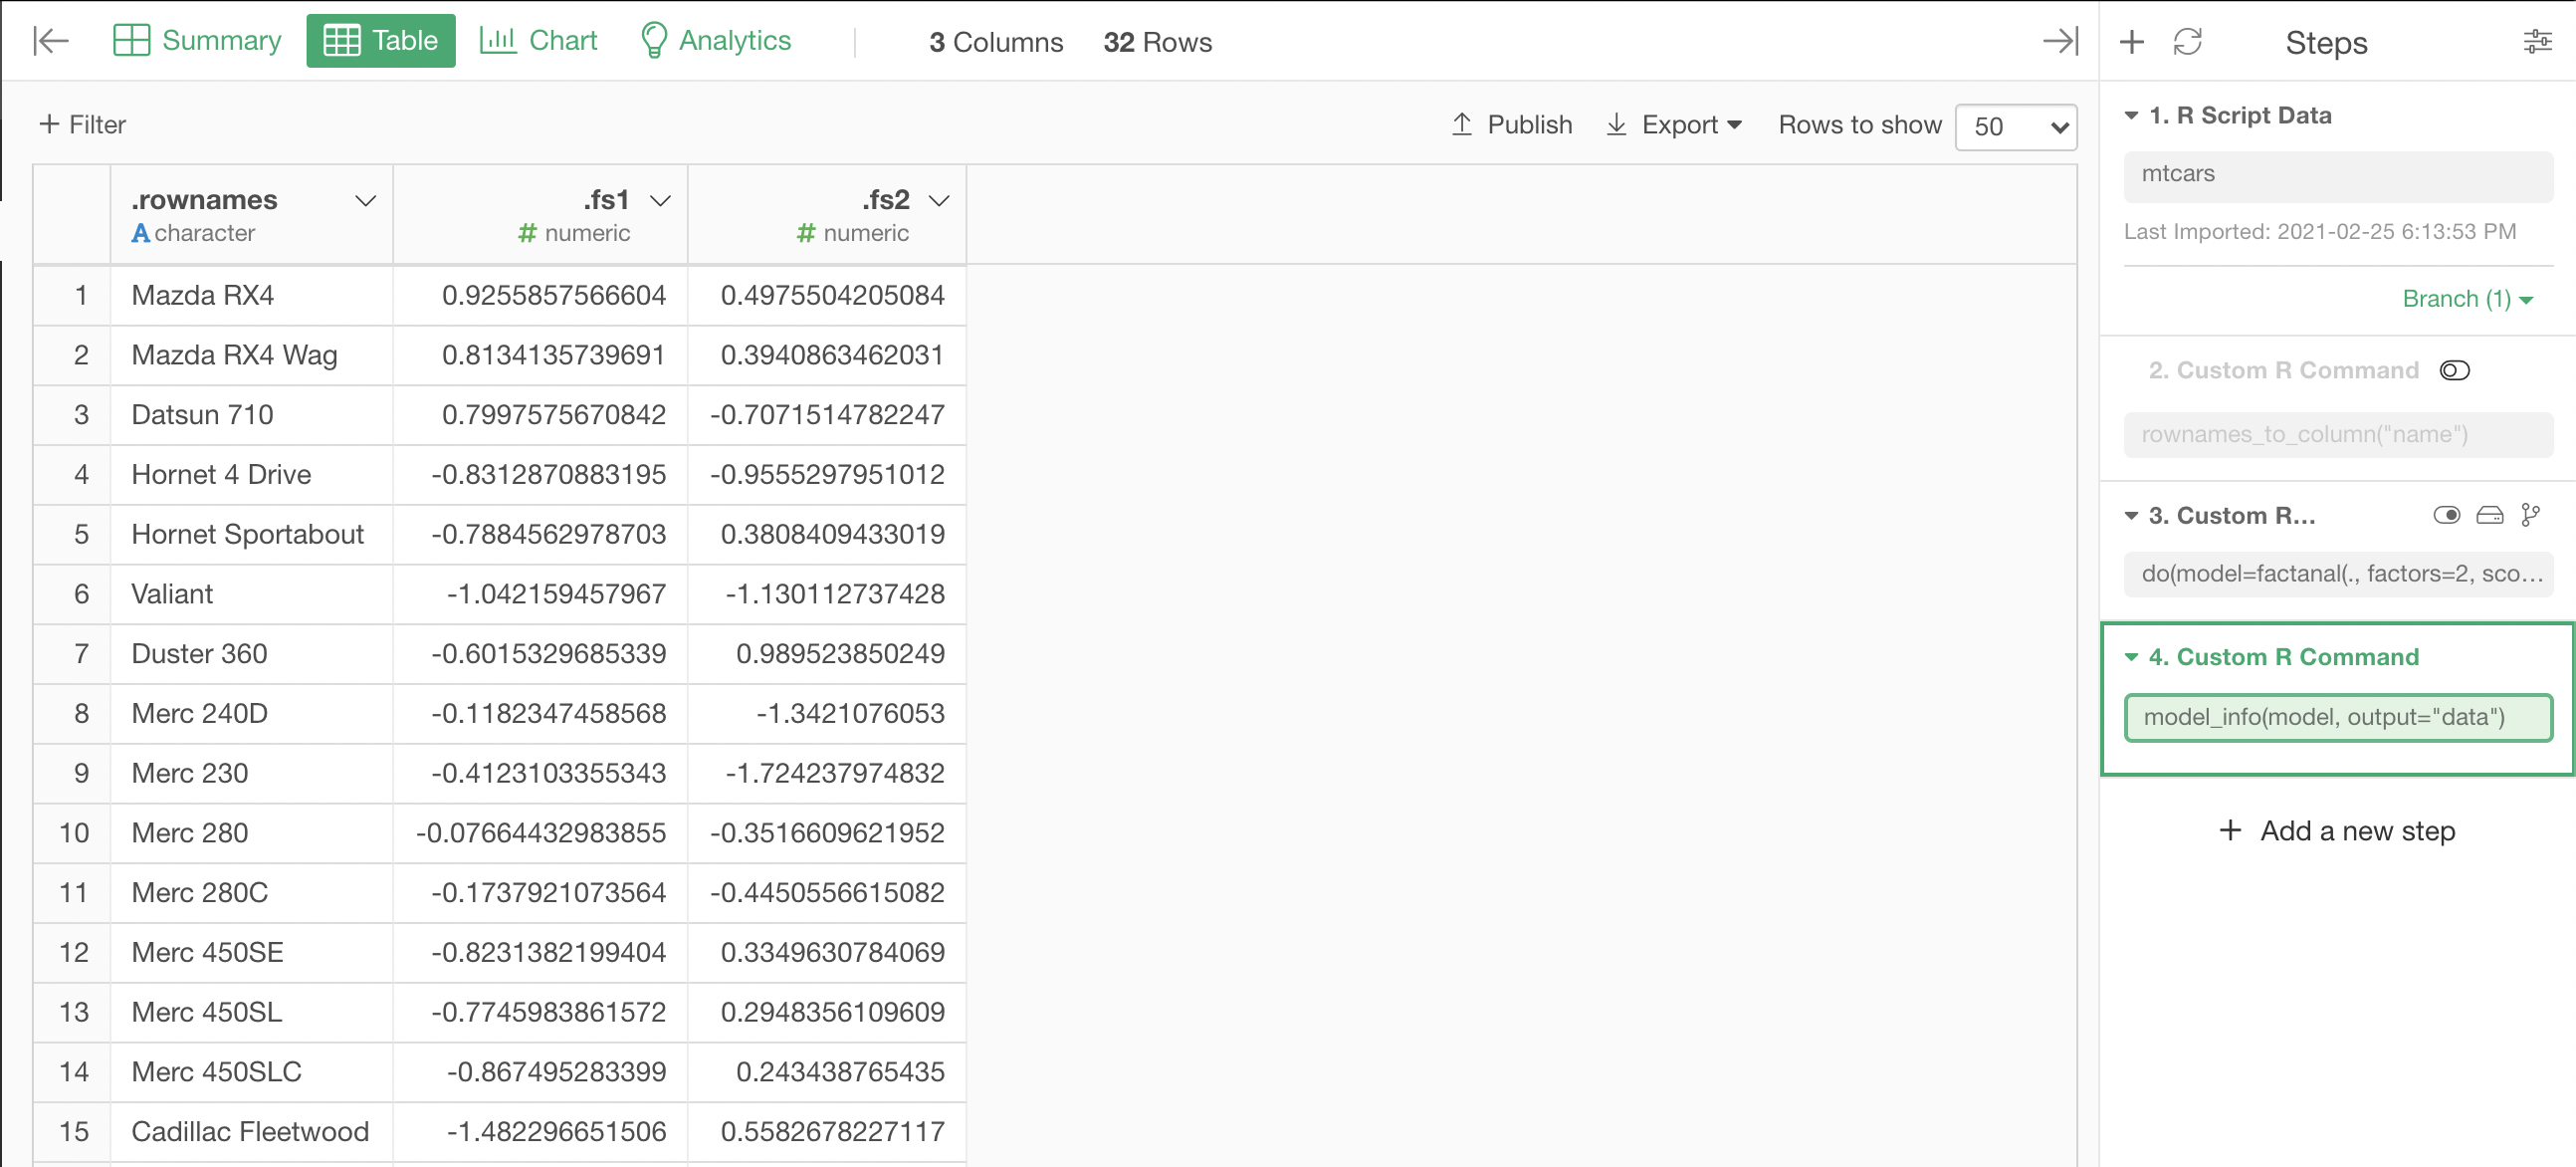
.fs1, .fs2 are the values of the 2 factors given to express each car.
If we plot the cars on a scatter plot based on those factors, it looks like this.
Here is interactive version of the chart.
How Each Column Values are Expressed with the Factors
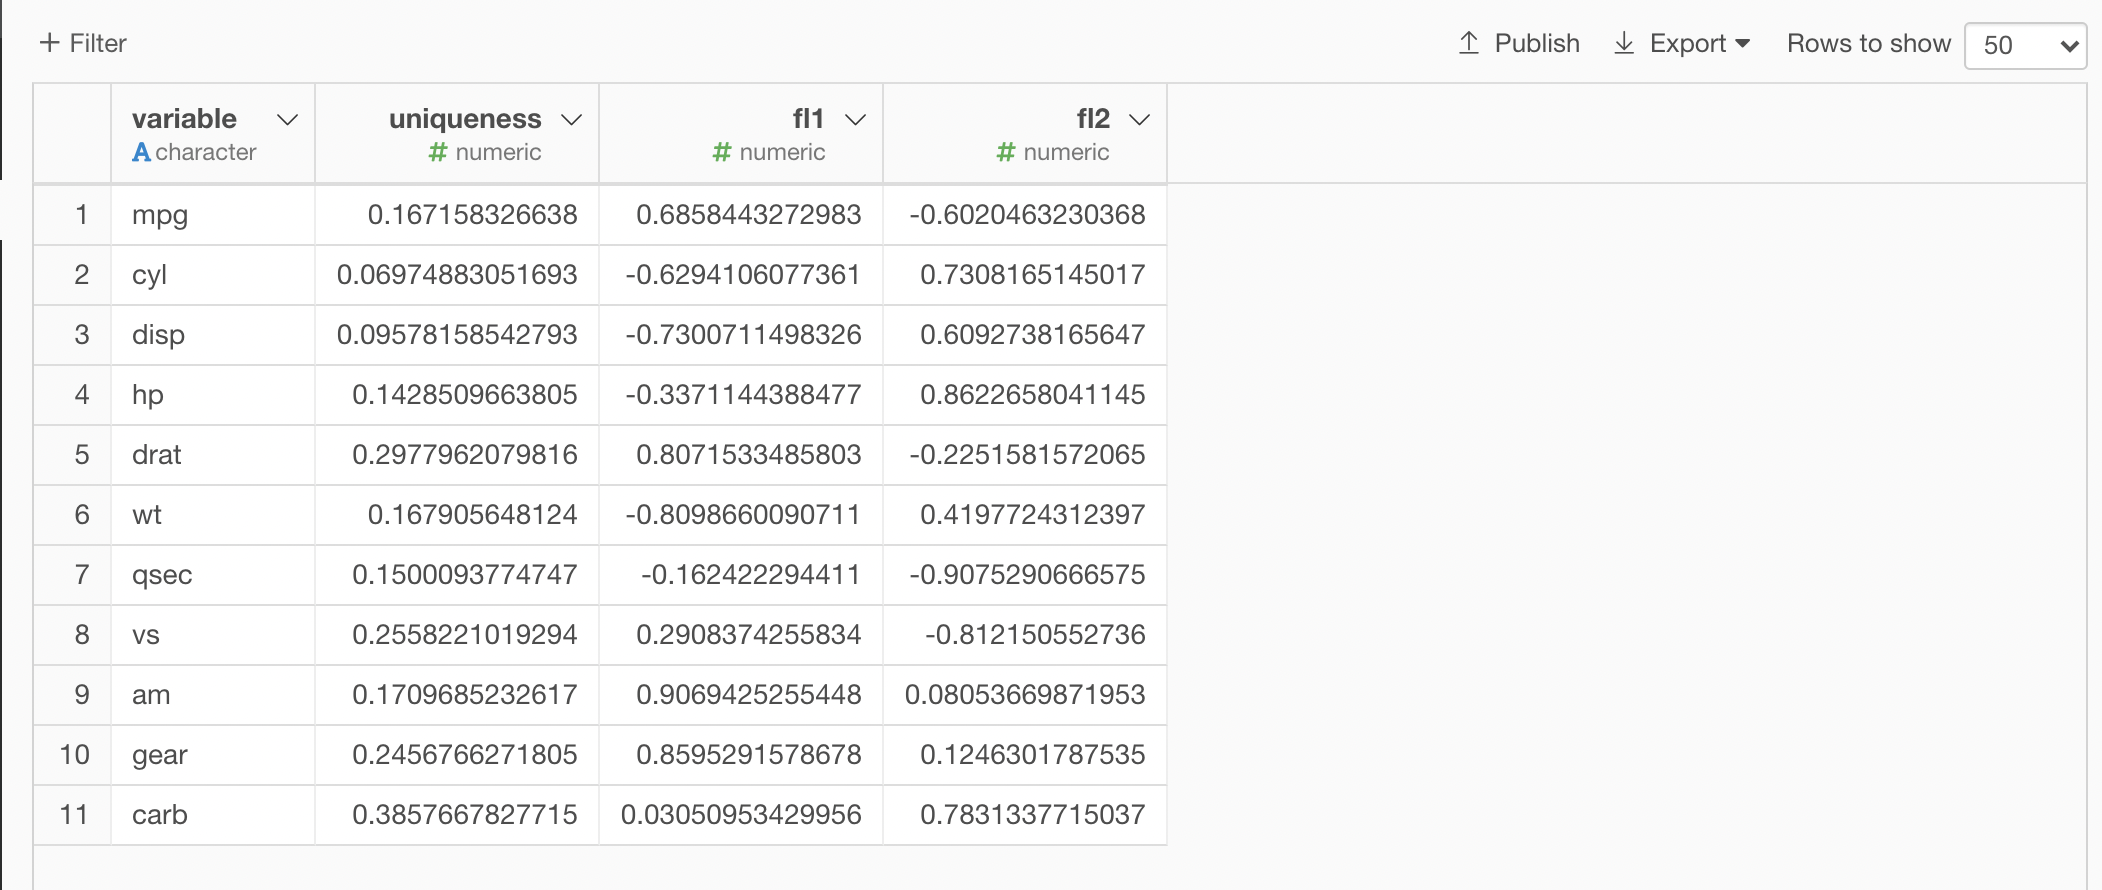
Now, let's see the relationship between the factors and the actual column values in the data.
To see that, change the output argument of the model_info function to "variables"
model_info(model, output="variables")The result looks like this. This shows how much of the 2 factors makes up each variable like mpg.
"uniqueness" is the part unique to each variable, which can't be explained with those 2 factors.
Statistical Test on the Validity of the Analysis
factanal model also gives statistical test results on how valid our initial assumption of 2 factor can sufficiently express all the qualities of the cars in the data.
To see the result, you can replace output argument to "summary".
model_info(model, output="summary")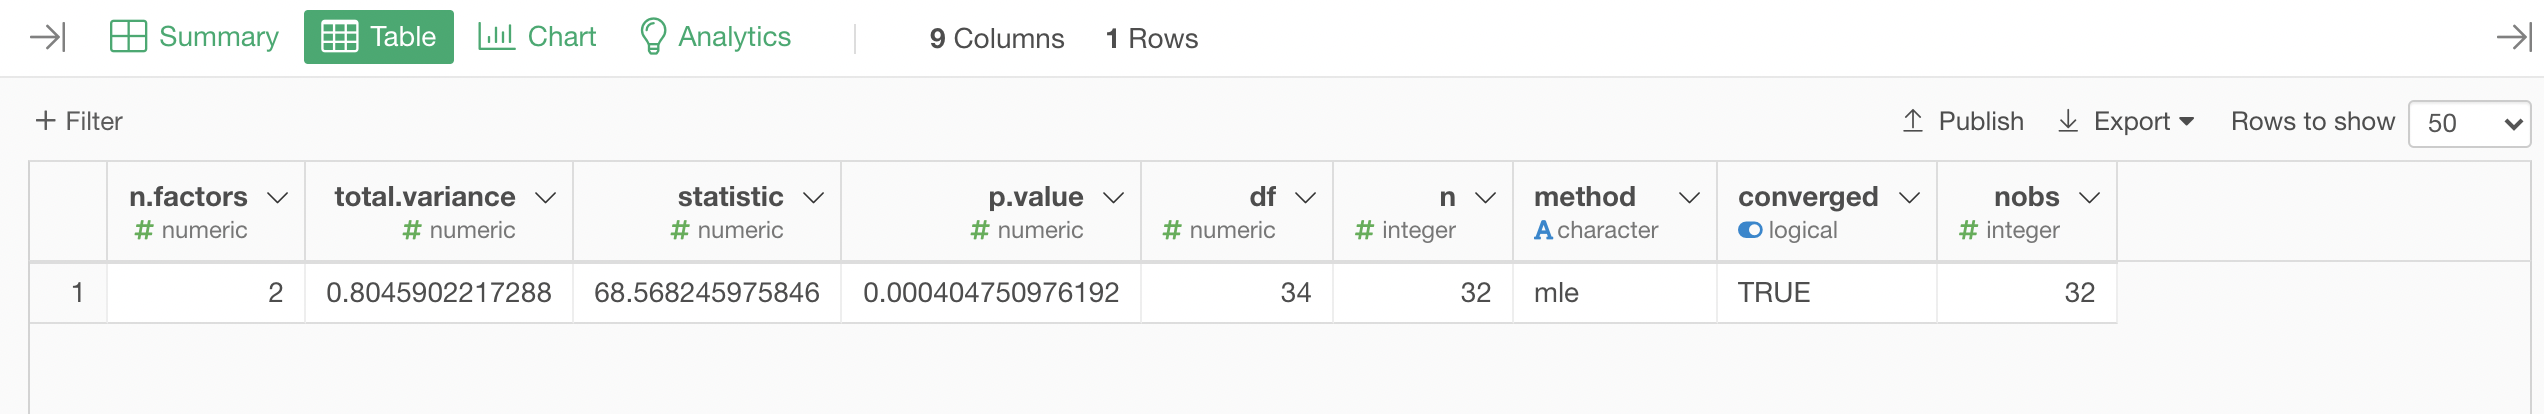
Here the P value of the test looks low enough to say that our 2 factors express the data well enough.