1. Loading and Understanding the Data
Q1. Explore the descriptive summary of both datasets and contrast them with the metadata. List at least 2 things that you find noteworthy in the distribution of values in the different columns.
- In both subjects, the average and median studytime is 2 hours.
- In the colum "falure" most students have never failed.
2. Prediction of Final Grade based on first and second evaluation
G3 vs. predicted_value, G3~G1, Math:
G3 vs. predicted_value, G3~G2, Math
G3 vs. predicted value, G3~G1+G2, Math
G3 vs. predicted_value, G3~All, Math
Question and Answer:
Q1. Reflect about if we could predict the final grade based on the previous two grades.
The R square for G3~G1, G3~G2, G3~G1+G2 and G3~All Mathematics are 0.6, 0.79, 0.8, 0.84.
Q2. Reflect about what of the created models (G3~G1, G3~G2, G3~G1+G2 or G3~All variables) is more accurate? The R square for G3~G1, G3~G2, G3~G1+G2 and G3~All Portuguese are 0.69, 0.83, 0.84, 0.85. The previous two grades seem to be predictor for the final grades.
Q3. Reflect about what of the created models is more useful and why? I believe that G3~G1+G2 are more accurate than G3~G2 because it used both G1 and G2. G3~All is the most accurate because it integrates everything.
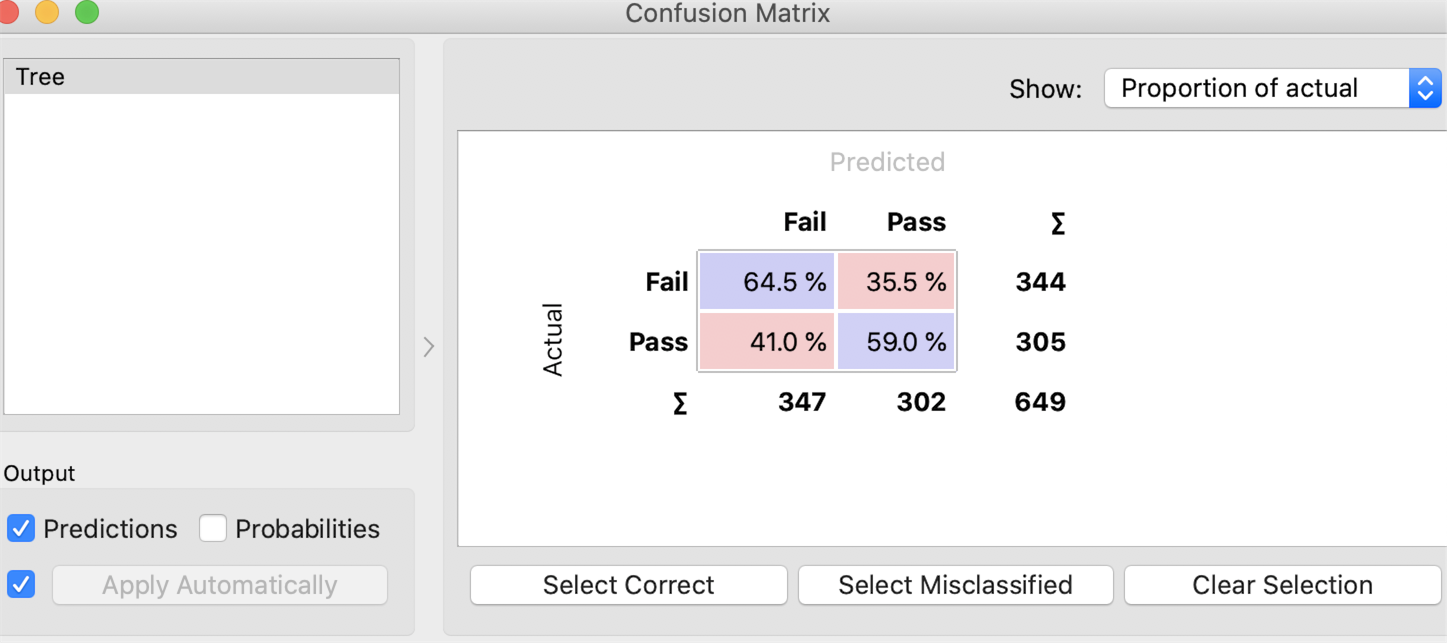
3. Prediction of risk of Failing (Logistic Regression)
Confusion Matrix
Q1:How good is the model?
The model is pretty good, nearly perfectly predicts every student’s result.
Q2: Is there any problem with the model?
The model used all the information to build the model (it's like using itself to predict itself), which makes the model meaningless.
Q3: If there is a problem with the model, create a new model without the problem and check its confusion matrix.
New model:
Confusion Matrix
Q4:What is your conclusion?
The new model is more accurate because it reflect the reality better.
4. Decision Tree
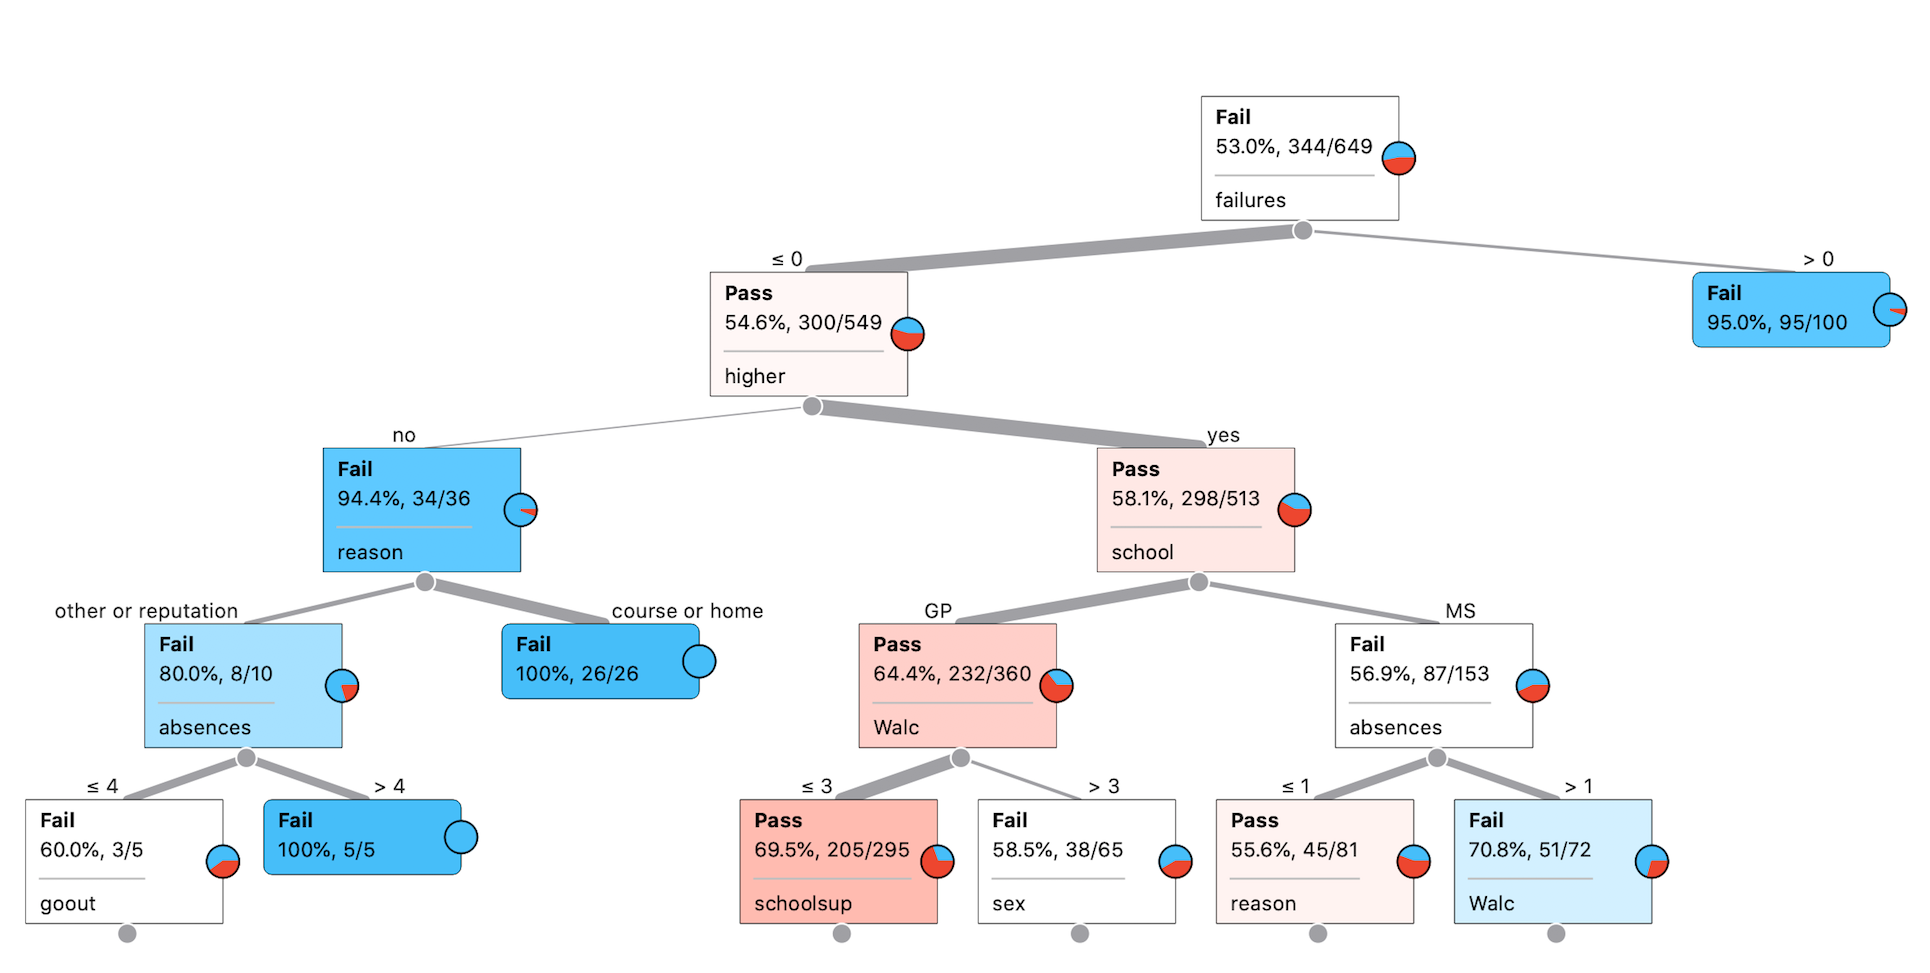
Q1: What are the most important variables according to the decision tree?
The most important variables are “failure”, “higher” and “school”.
Q2: What are some patterns/rules that appear to be present in the data?
If a student has failed previously, he/she has a 95% chance of failing.
Q3: Do these rules make sense to you or are they just coincidence?
It makes sense that previous failure hitory would be a great predictor of future failure/pass. In our educational system, later knowledge often builds earlier one, without a solid foundation, future performance is likely undermined.
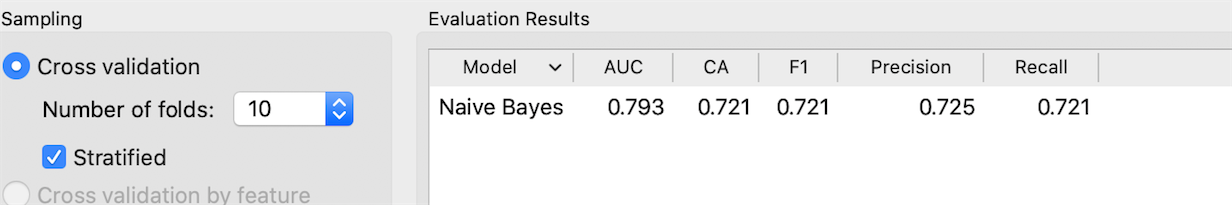
5. Test other models
1. Navie Bayers 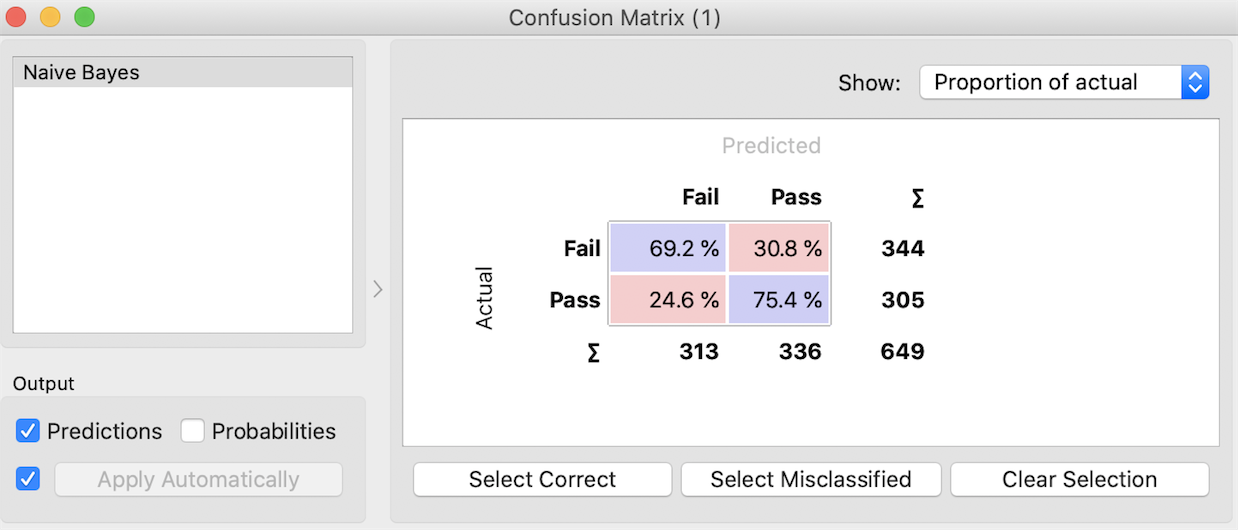
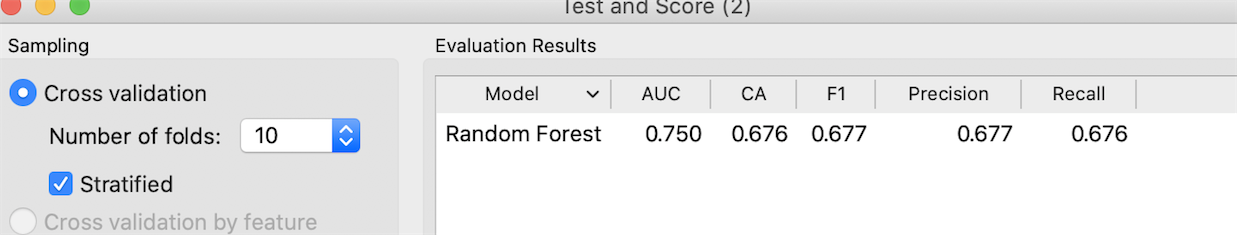
 2. Random Forest
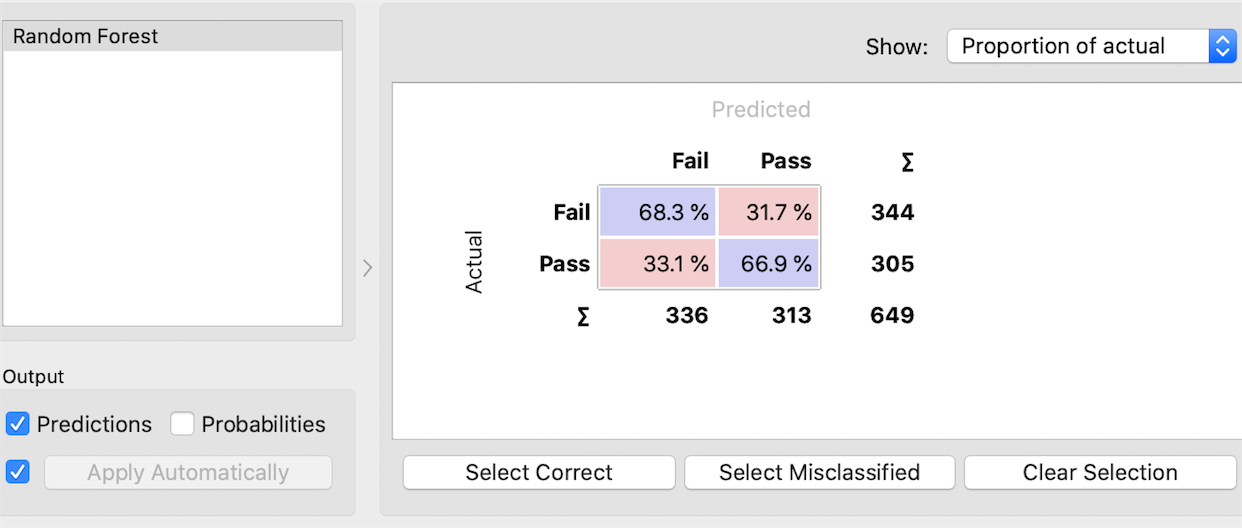
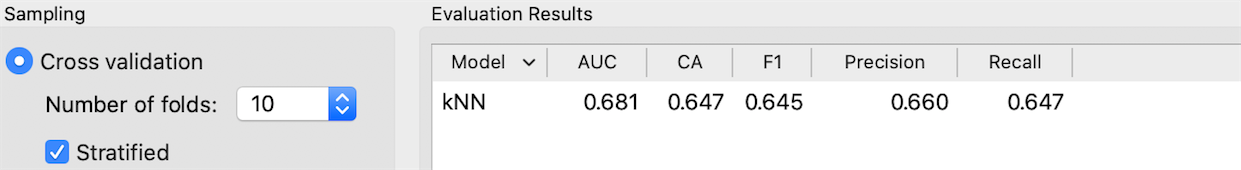
 3. kNN
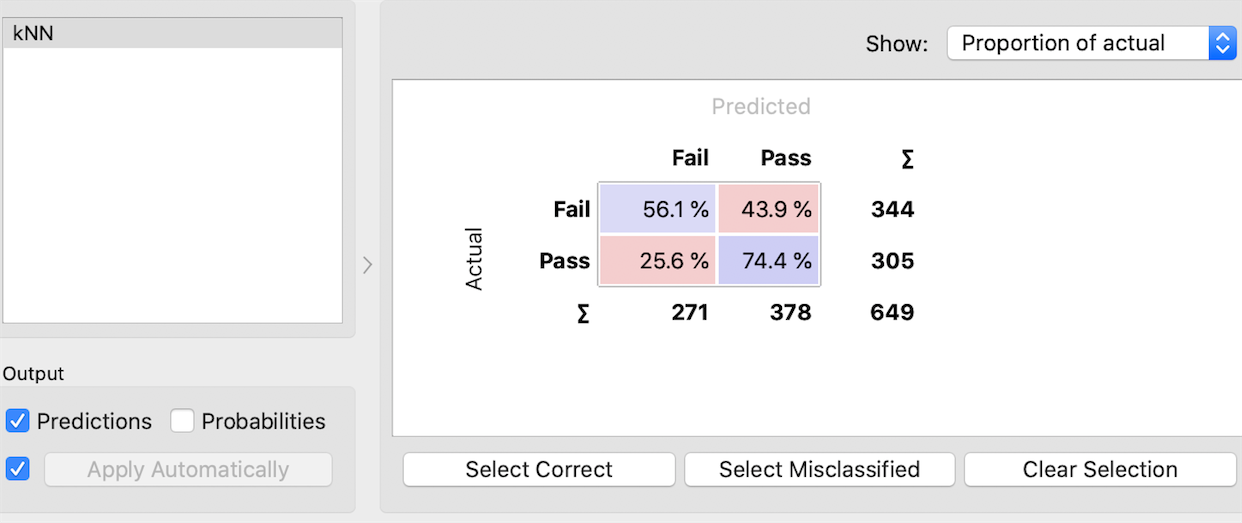
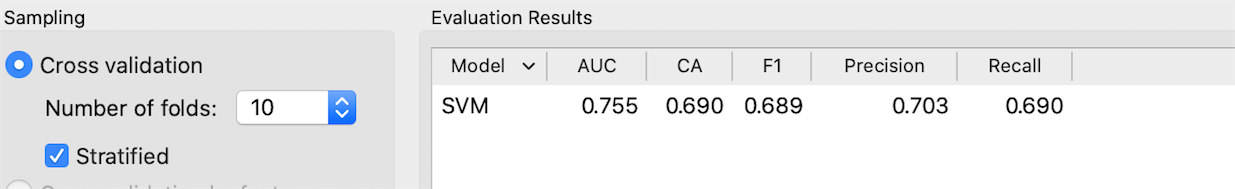
 4. Support Vector Machine
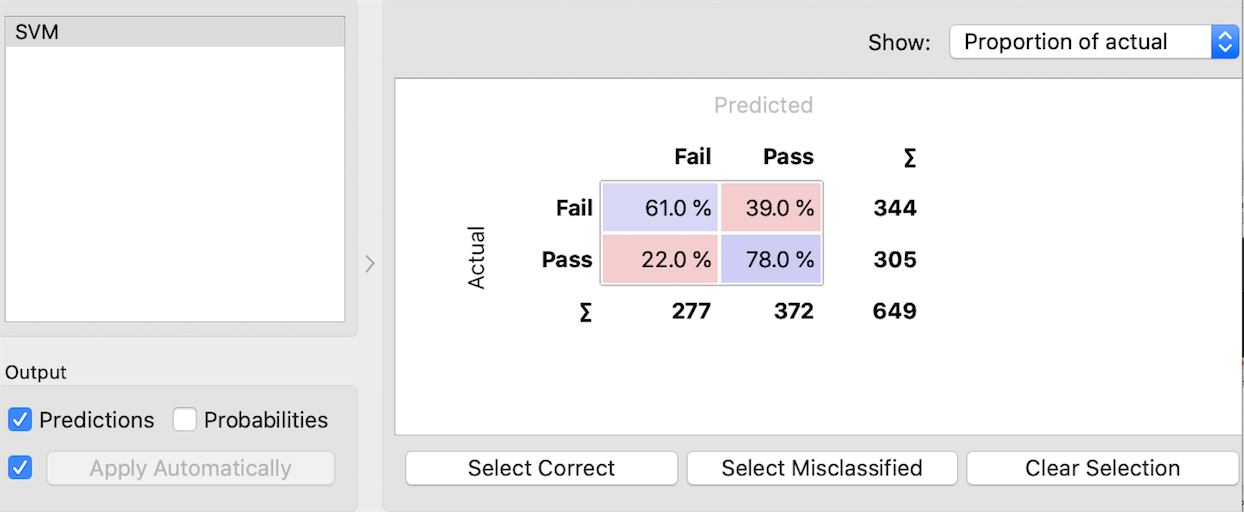
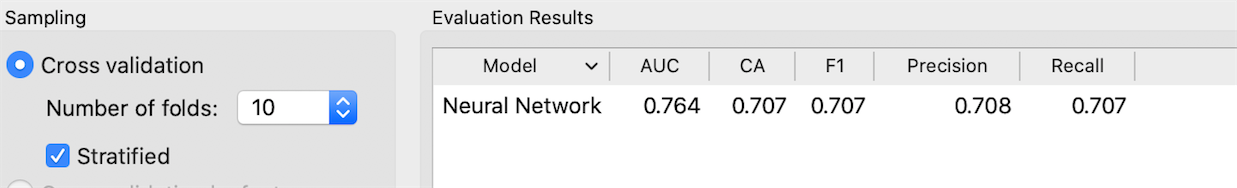
 5. Neural Network
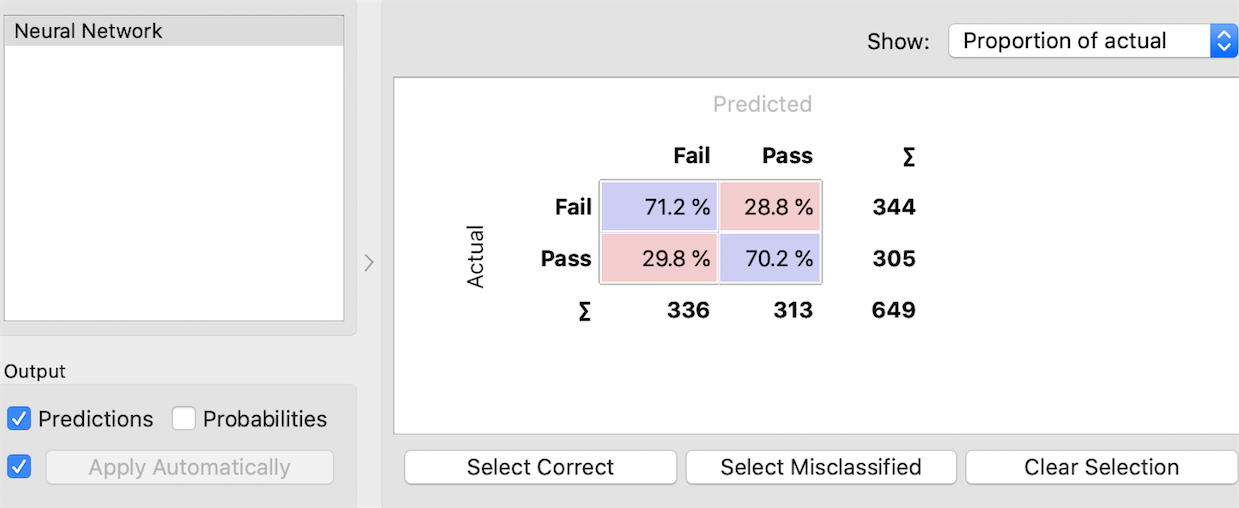
 Q1: What is the best model? Why?
Naive Bayers seems to be the best model because it has the highest AUC among the five models.
Q2: Which one would you use to create an application guide instructor-led intervention for students at risk of failing the course?
I would prefer to use Neural Network model because it provides a 71.2% accuracy rate of predicting fail.