
This is a weekly update of what we have seen in Data Science, interesting public data, and what we are working on.
Hi there!
It’s Kan from Exploratory.
It’s been super nicely hot weather here in Bay Area, California. Perfect for hanging out at the beach, but we’re continuously working on finishing up the development of the next release, v4.1, so no beach for us for now! ;)
Anyway, here’s our weekly updates.
What We Are Reading
AI hype has peaked so what’s next? - 9/30 - URL
If you want to start building new innovative products or services combined with AI / Machine Learning, you want to consider the following four points.
- AI / Machine Learning algorithms are commoditized, so they can’t be your moat (competitive advantage) by themselves.
- However, the data only you or your organization can collect can be an important moat.
- Your domain knowledge can be the next moat.
- Your product or service needs to fit in your target users’ existing workflow nicely, and it needs to return at least 10x return.
I think this commoditization of the algorithms is really a great opportunity for many businesses and organizations even outside of Silicon Valley to embrace Data Science at the organization wide level, and I’m excited to see a lot of new products and services will come out from such organizations.
By the way, one of those who thought the algorithms were the moat and tried to capitalize on it, and now are facing the backlash is IBM, more specifically Watson.
IBM pitched its Watson supercomputer as a revolution in cancer care. It’s nowhere close - 9/5 - URL
Watson for Oncology was sold to more than a few dozen clinics and institutions as a machine to find new ways to cure cancers. However, they have faced the reality such as being hard to prepare the data so that Watson understands, cumbersome to keep feeding the data to Watson, slow to make changes, etc. And after all that effort, you end up being able to know is what doctors have already known. Ouch!
The Media Has a Probability Problem -9/21- URL
Most of the people including the medias are not good at interpreting statistics but the danger is they take actions (or not take actions) based on their own ‘understanding’ of them. As the use of AI / Machine Learning algorithms in our daily data analysis is becoming norm much more than before, we need to be careful how to communicate the findings from our data.
Interesting Data
US Internet Access by County - URL
US FCC (Federal Communication Commission) collects the information of ‘high speed’ Internet accesses for each US county and Census district and publish it here. I have published my quick analysis on the data here.
US Crime Data by FBI - URL
FBI has been publishing US crime data which ranges from 1995 to 2016. It is summarized by States, crime types, and years. You want to use ‘gather’ command to transform the wide format to the long format to make it easier for analyzing and visualizing it. I’ve published an example visualization along with the data wrangling steps including ‘gather’ for your reference here. You can download the EDF and import to your Exploratory Desktop to reproduce it.
Blog posts from Team Exploratory
Here are a few blog posts we have published recently.
- How to use H2O in Exploratory - by Hideaki - URL
- Querying Spark Data with dplyr in Exploratory - by Hide - URL
- America’s Rural Areas Defined by Internet Access - by Kan - URL
What We Are Working On
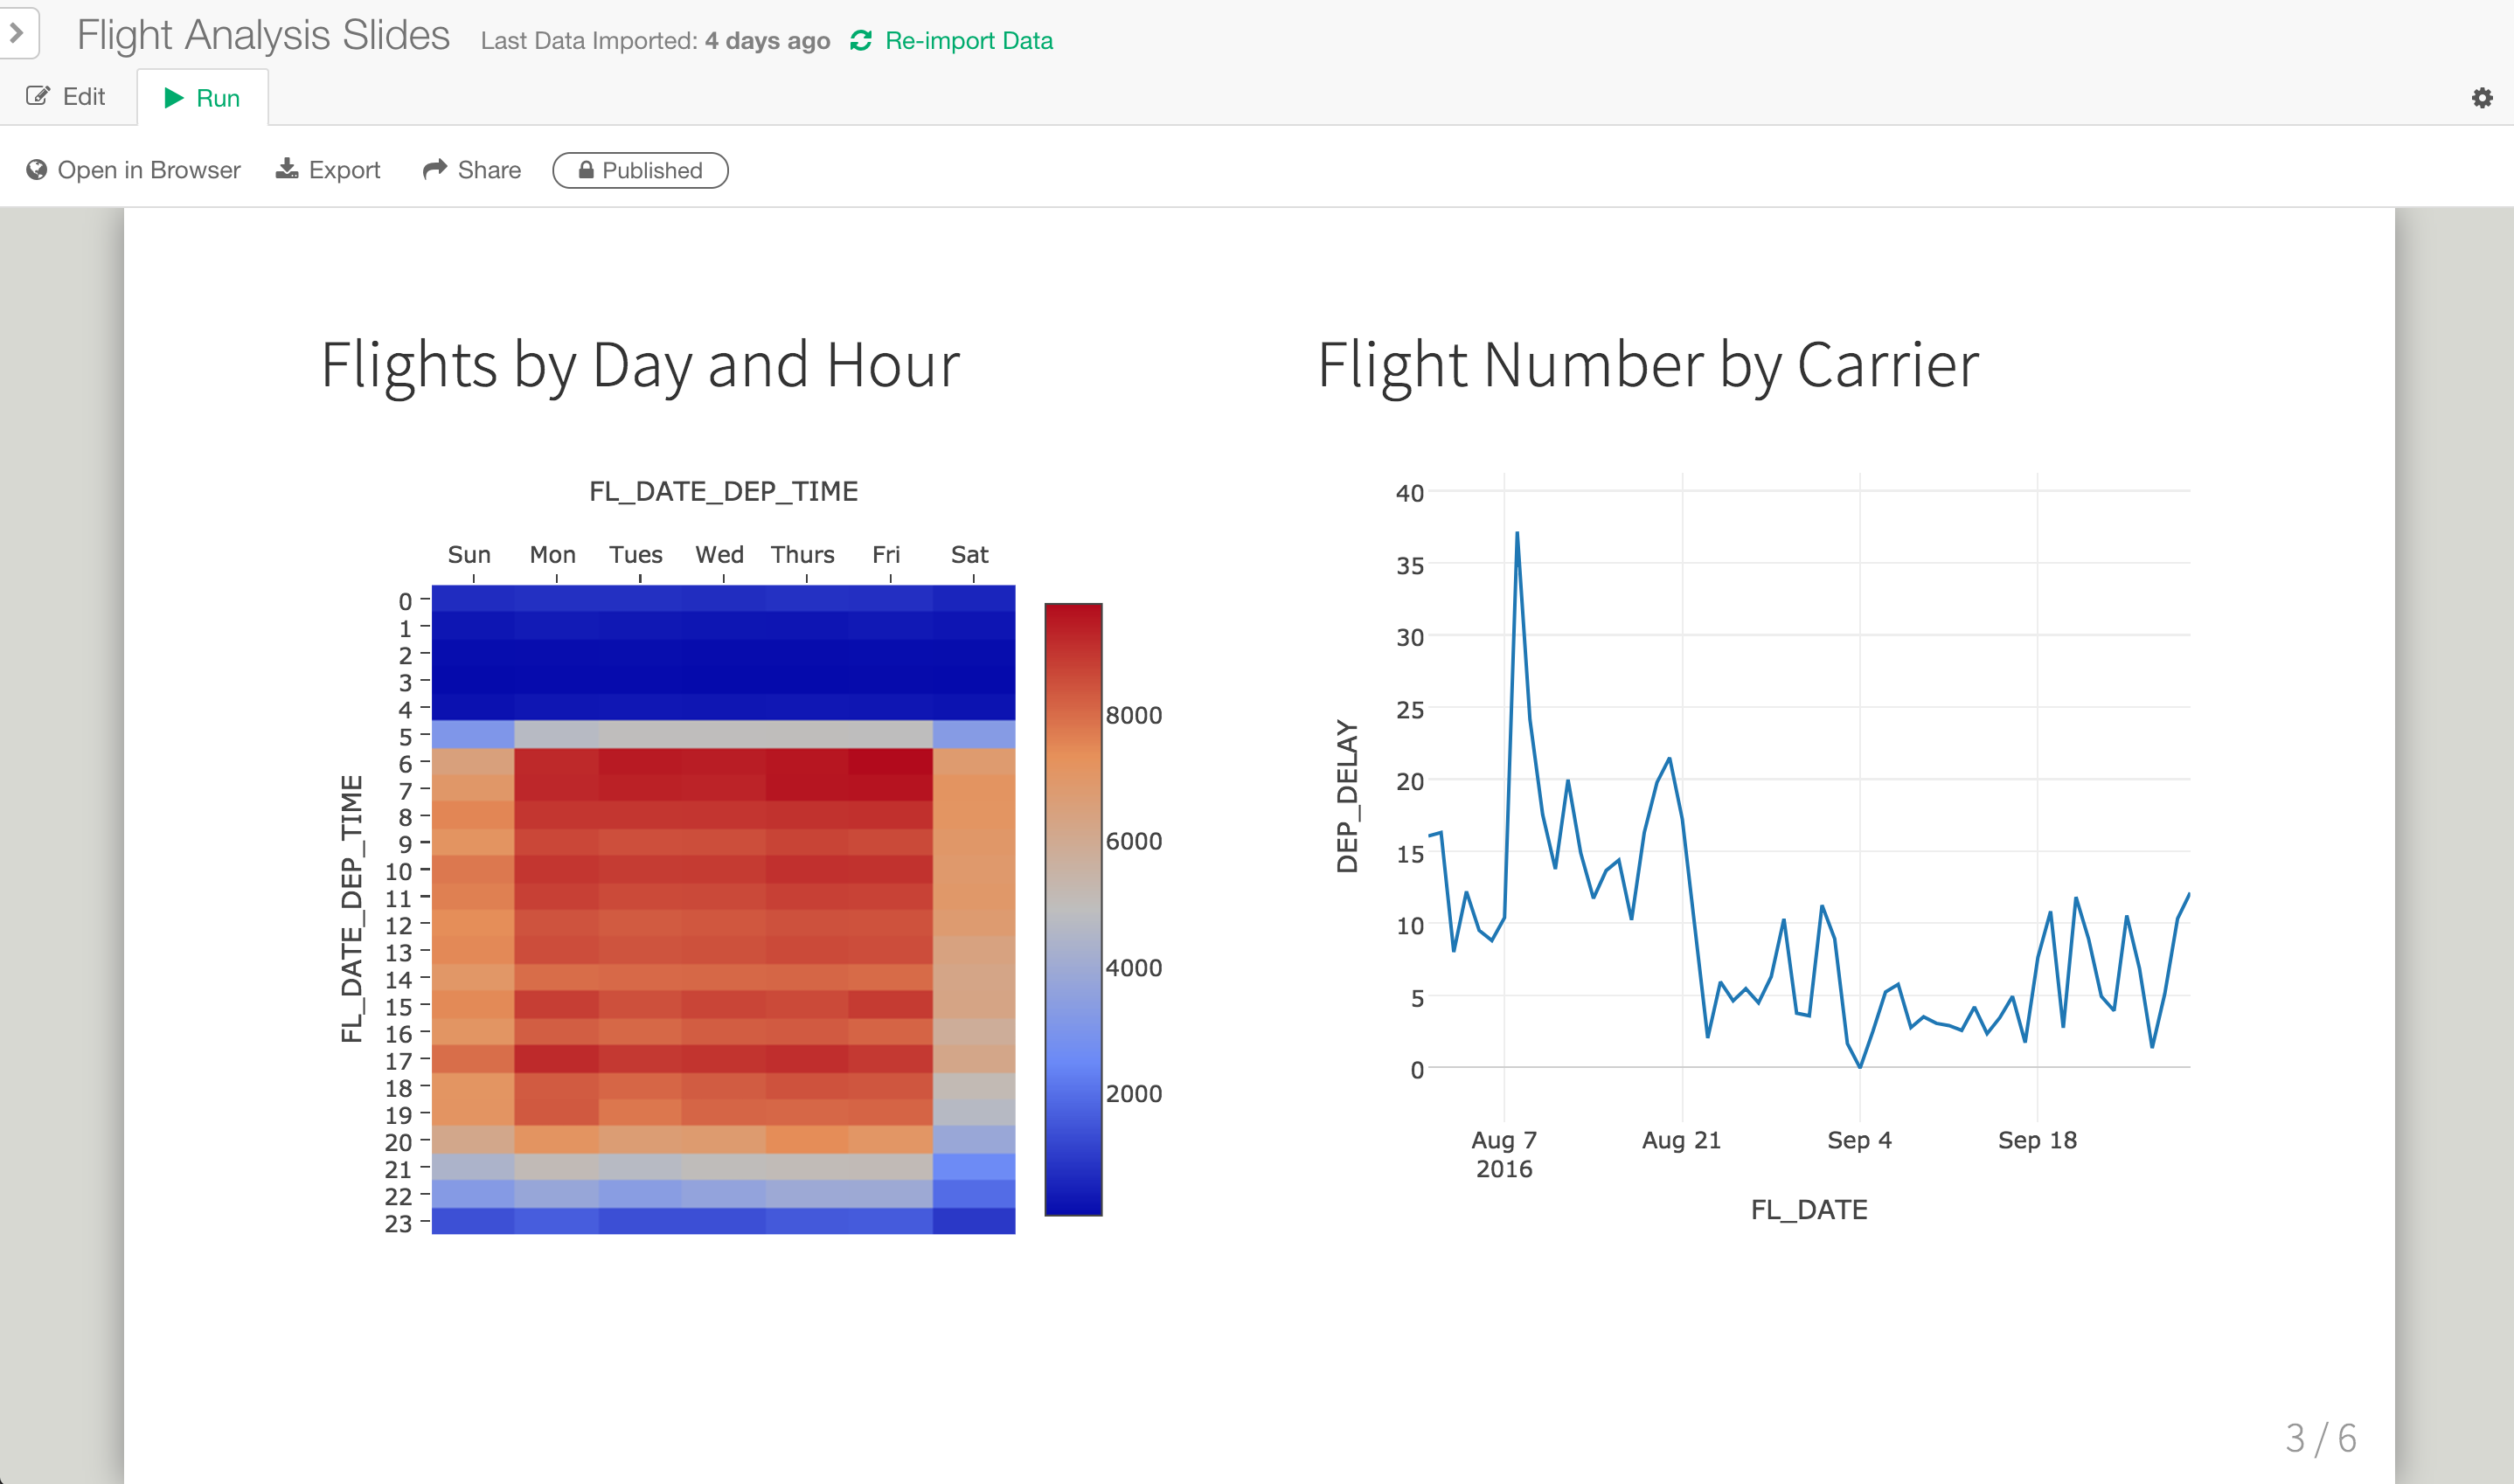
We’re enhancing Markdown note feature with many incremental improvements. The biggest thing is a new Presentation Slides output support. I have published a sample slides for your reference here.
That’s it for this week. If you like what you have read, share with your friends! If you’re not Exploratory member yet, sign up from here!
Have a beautiful week!
Kan, Exploratory/CEO