How to Get the Most Frequent Value?
Let's say you have a categorical column and you want to get the most frequent value.
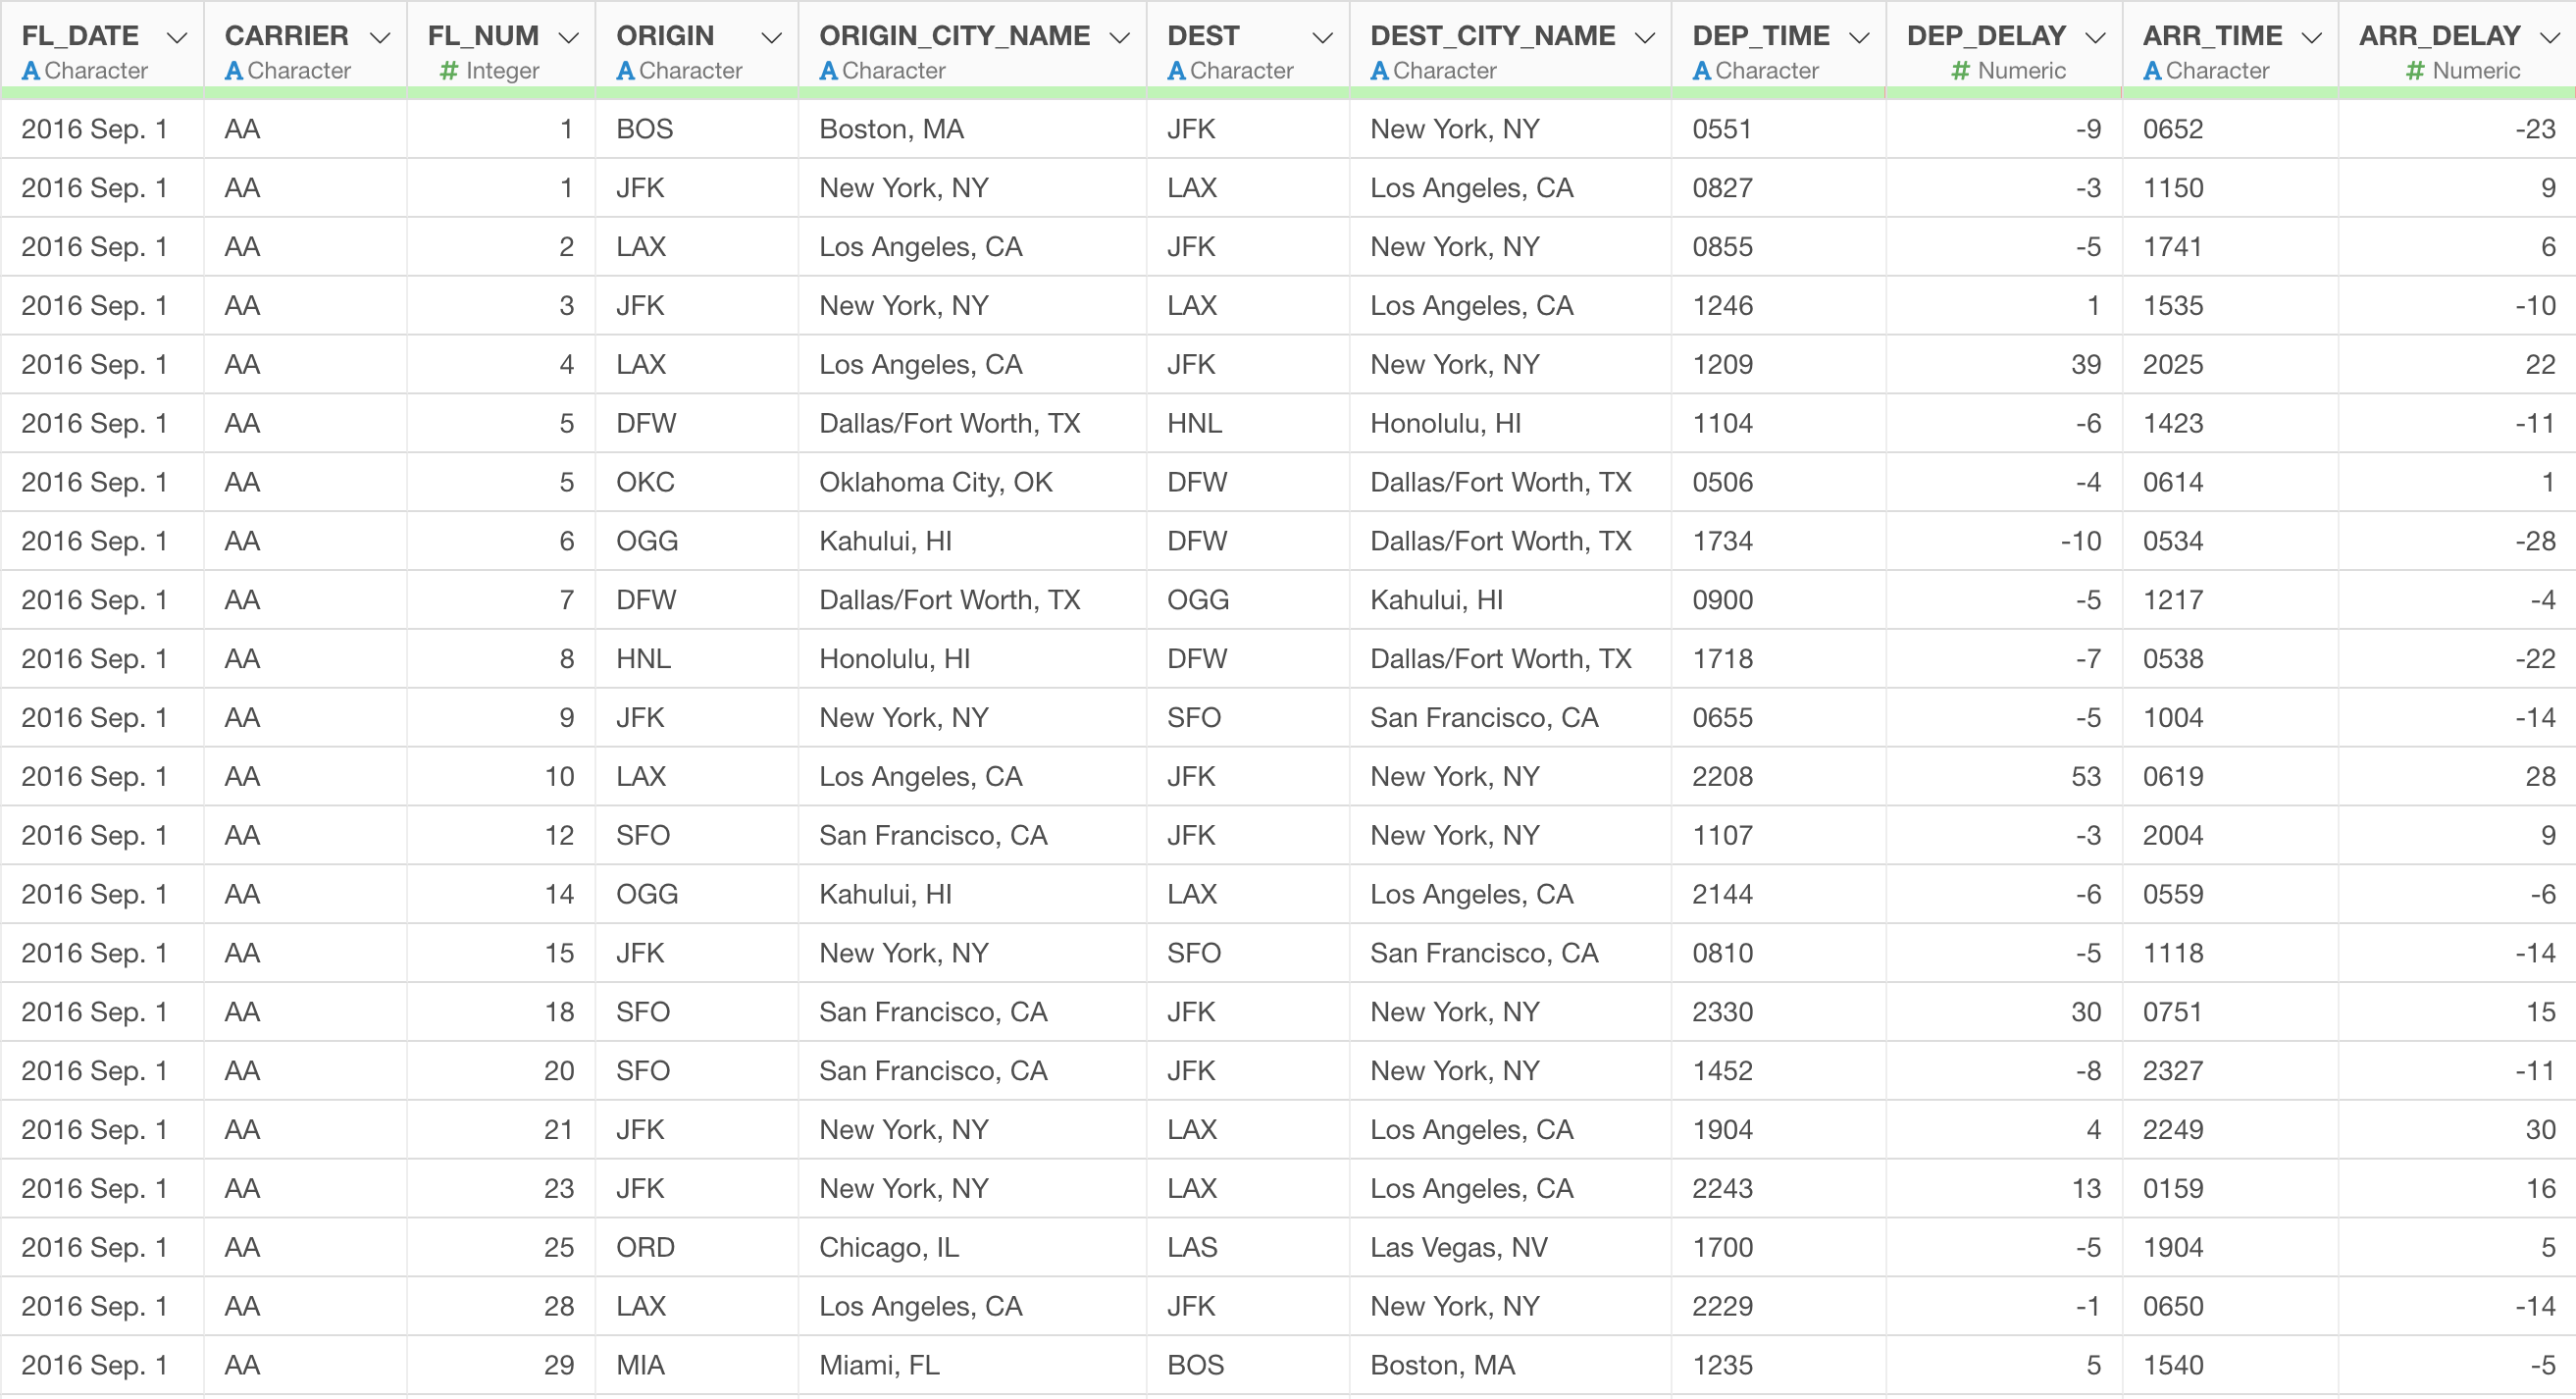
For example, here is the flight delay data.
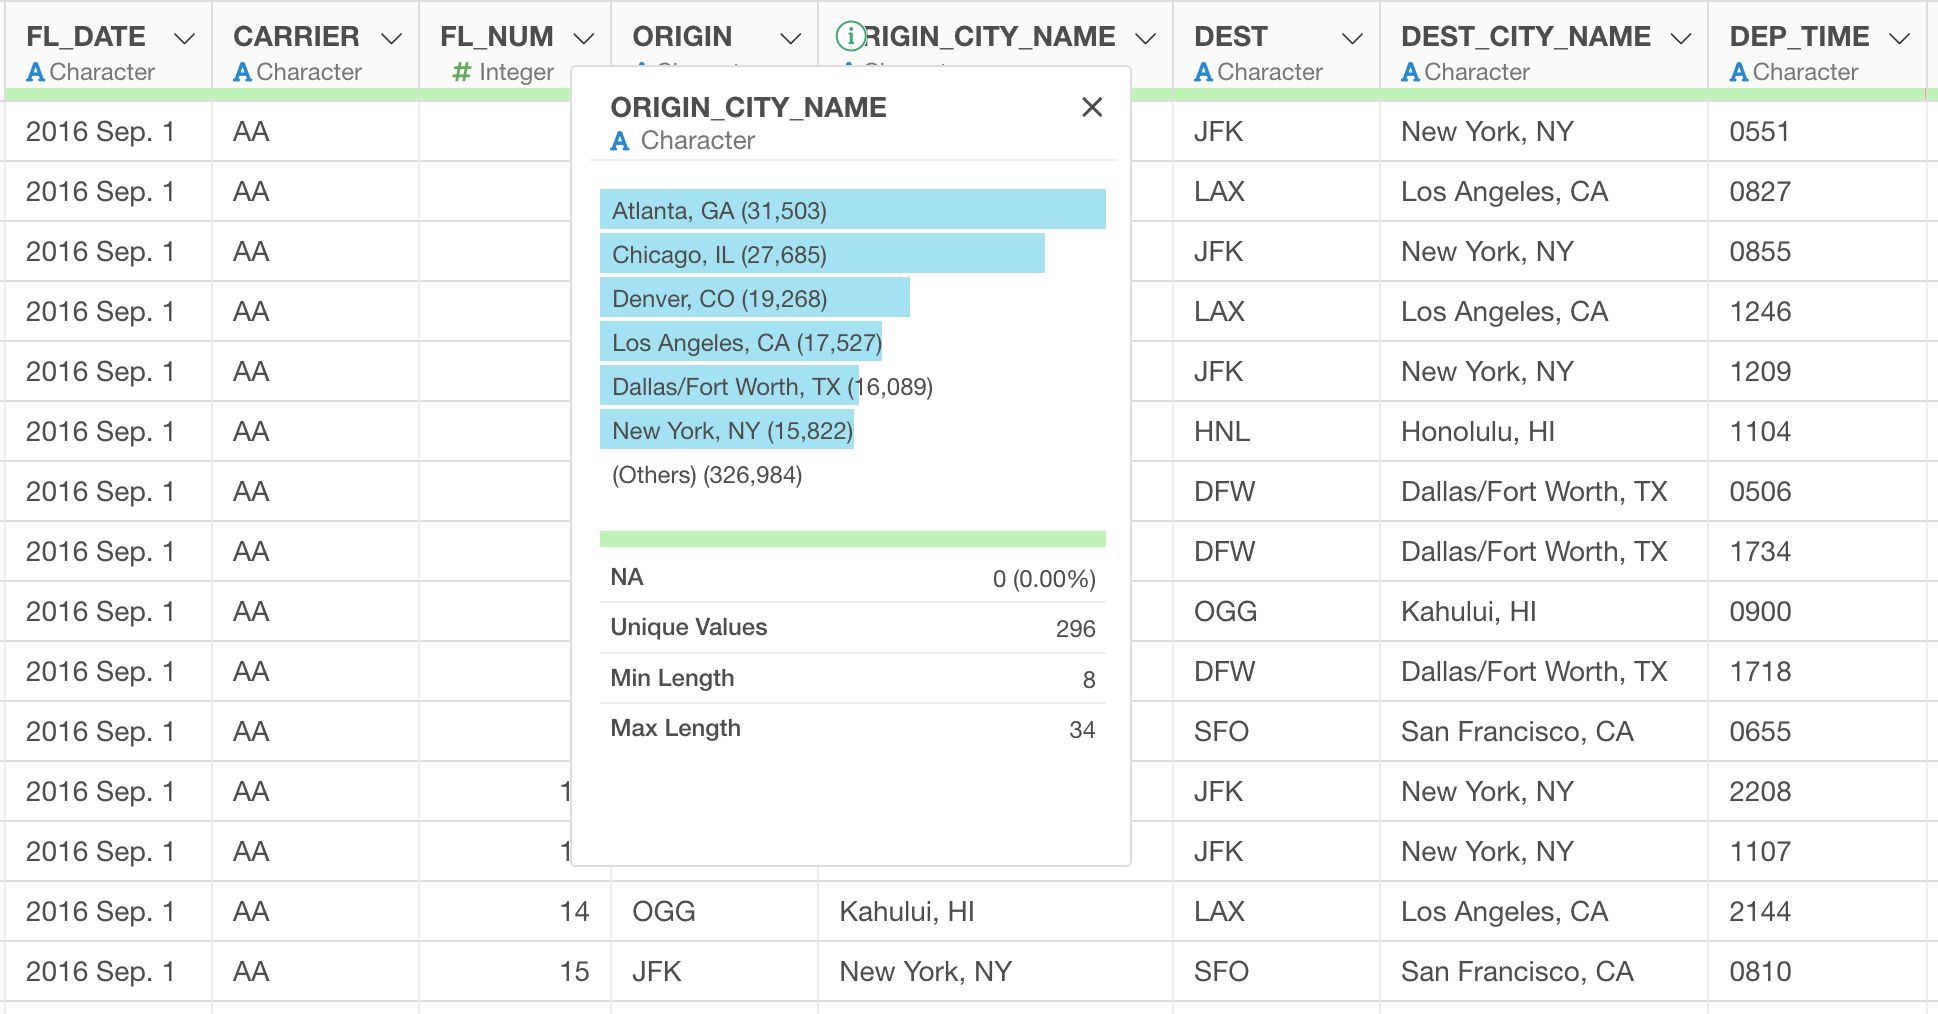
Now, which value in the ORIGIN_CITY_NAME is the most frequent?
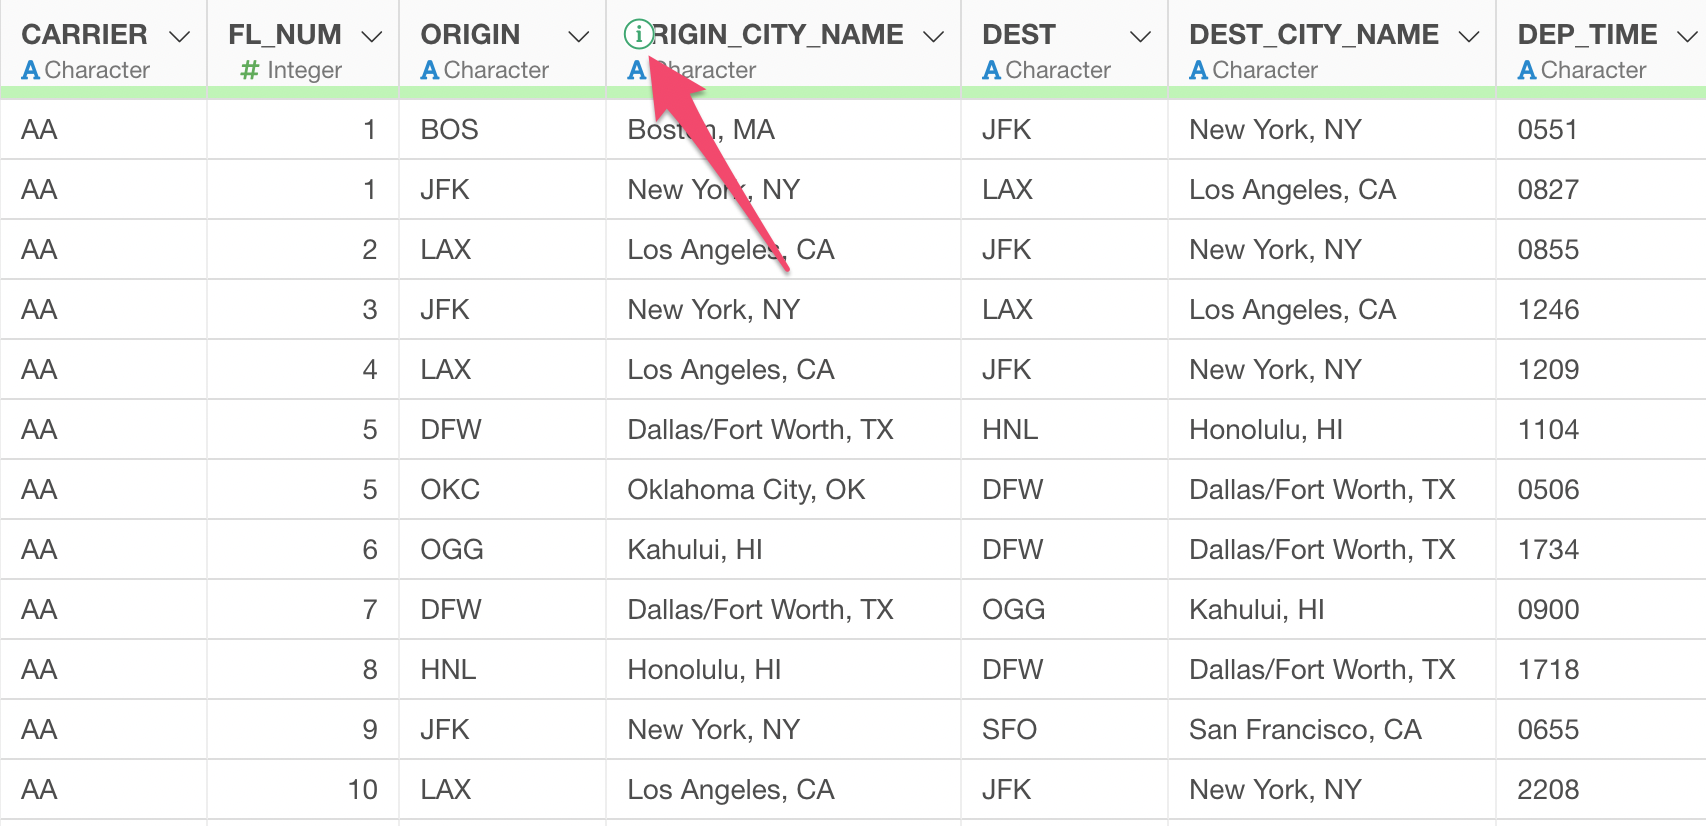
You can quickly click on the Information icon in the column header of the ORIGIN_CITY_NAME column.
And you can see that 'Atlanta, GA' is the most frequent value.
Now, how about 'which city is the most frequent for each airline company (CARRIER)?'
To answer this question, we want to get something like this.

This post is about how to get the values for 'new_column' above.
There are 2 ways to answer the question.
One is to use Summarize Table (or Pivot Table) to get the most frequent value for each group. This is the most simple way to do it.
Another is to use the Summarize Step of the Data Wrangling Step. This is useful when you want to build other data wrangling steps on top of the such summarized data.
Let's take a look at those two ways.
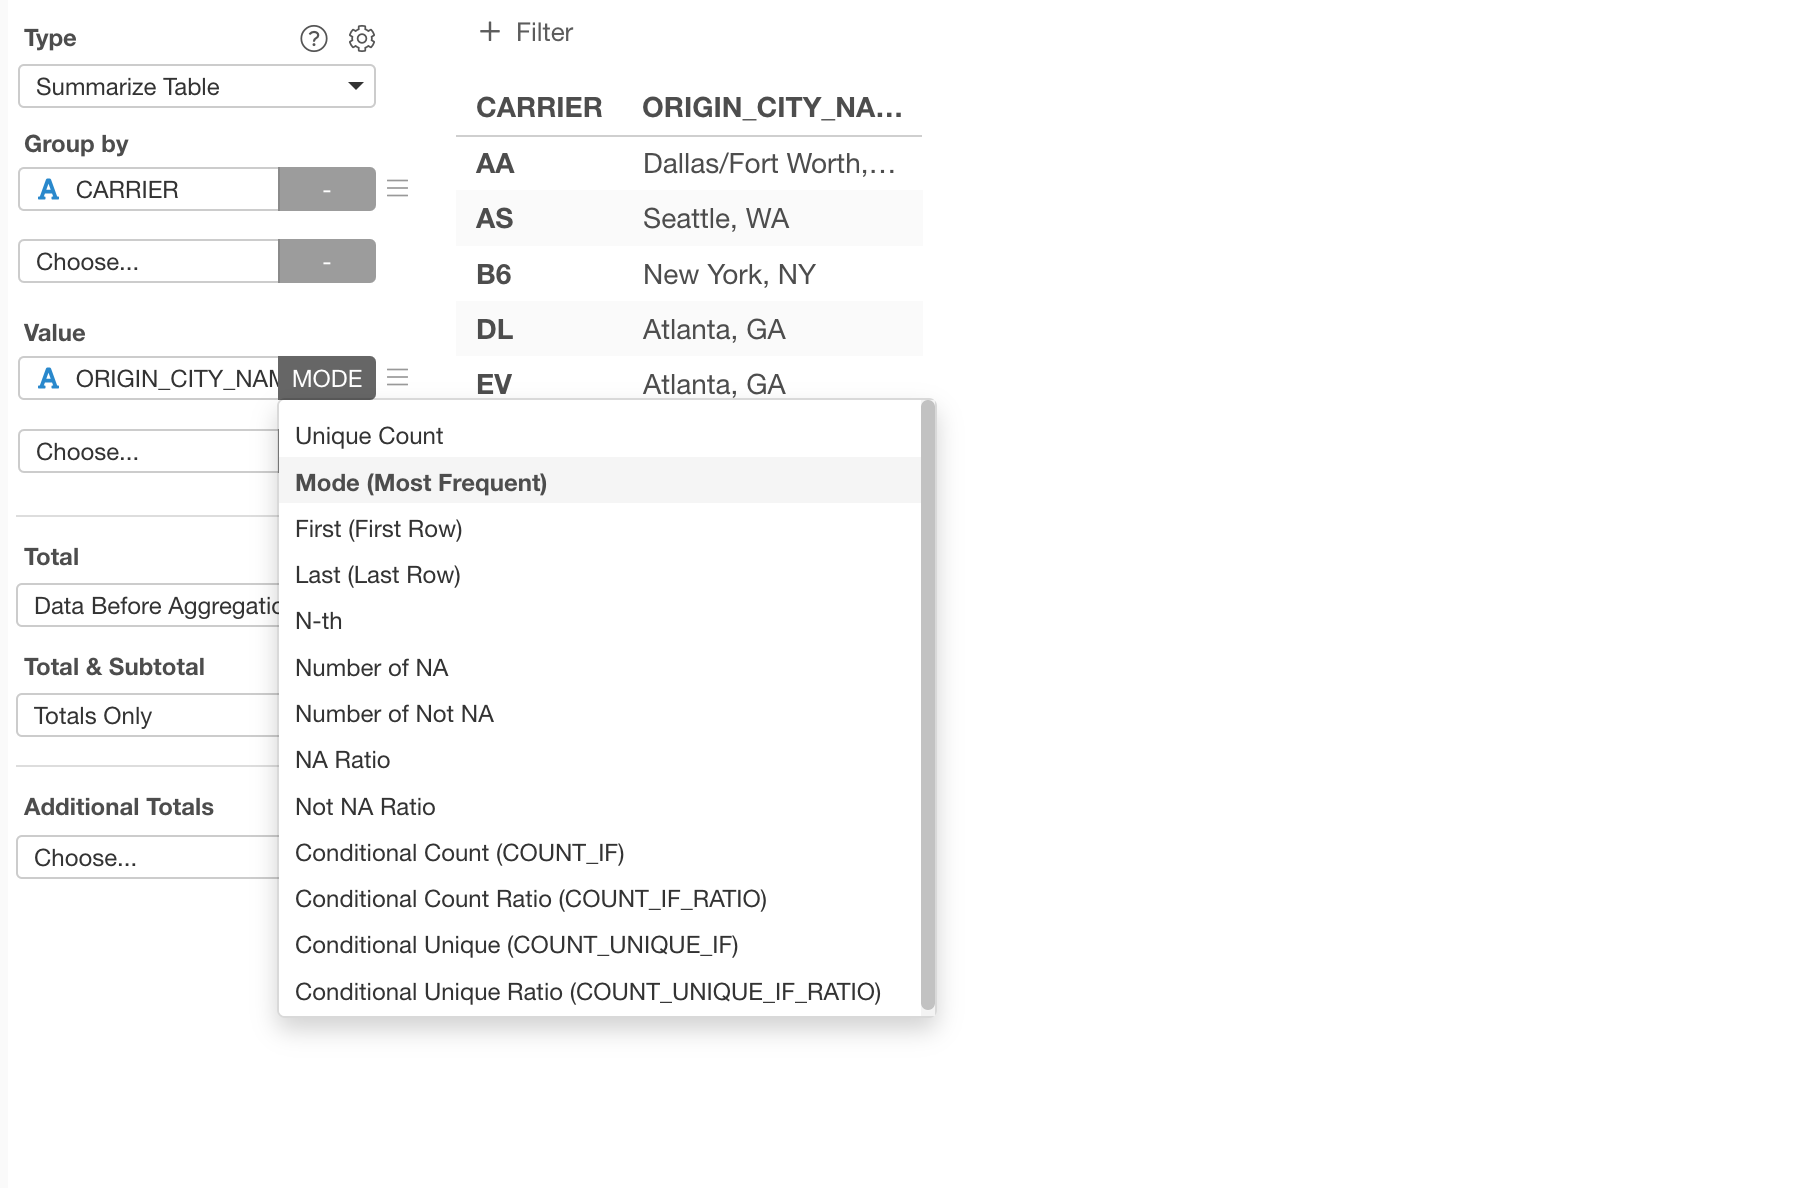
1. Use Summarize Table under Chart View
First, go to the Chart view, select 'Summarize Table' for the Chart Type, and select 'CARRIER' column for the Group By.
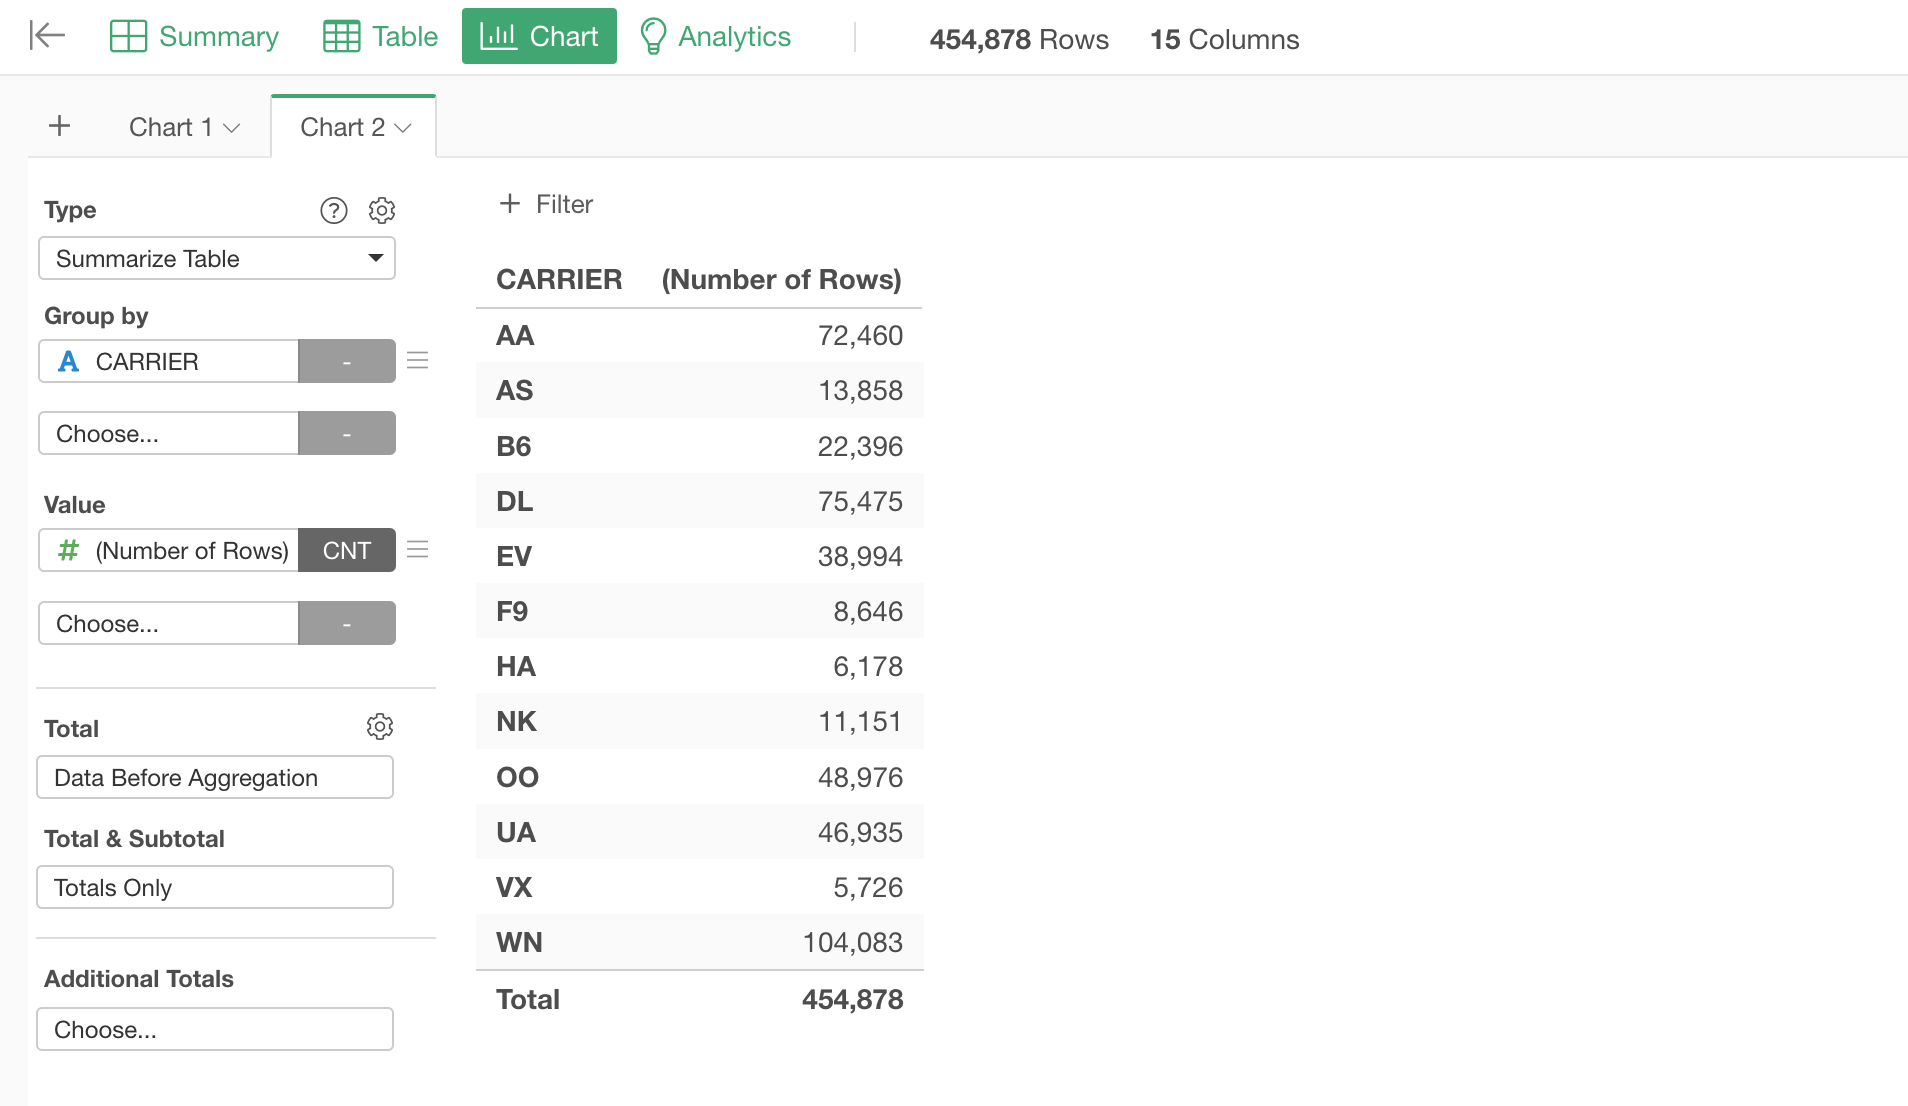
Now, you want to select the 'ORIGIN_CITY_NAME' column for the Value.
This will give you a number of unique values for each carrier.
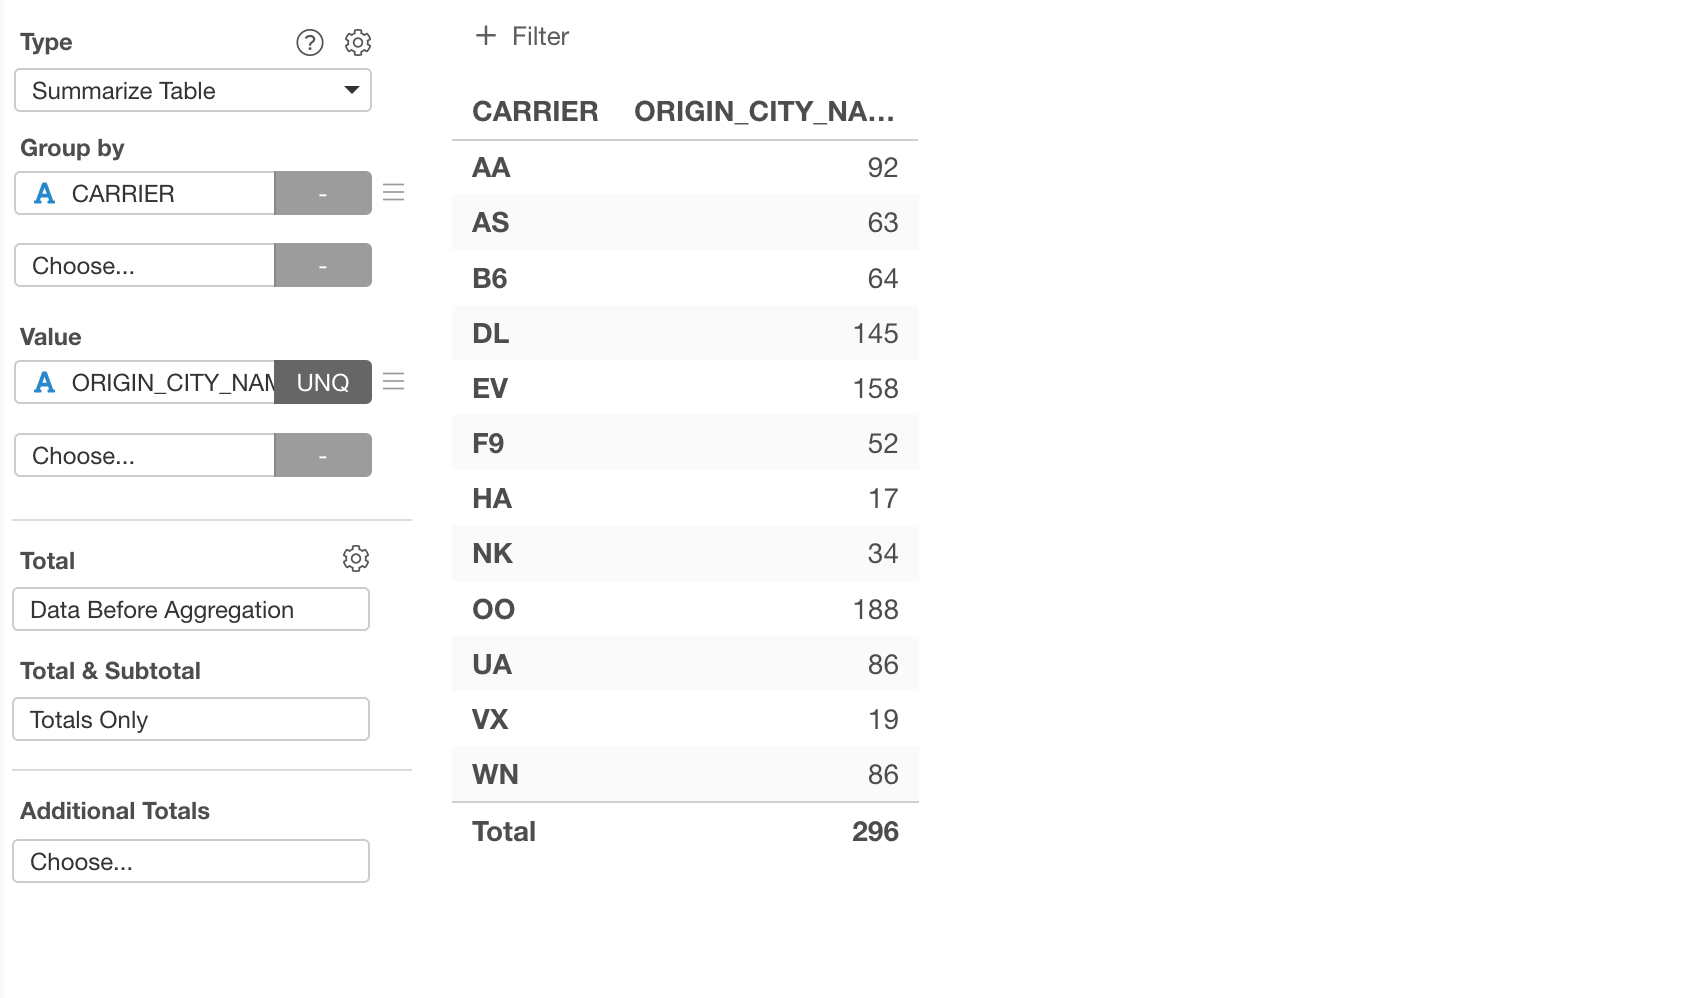
But this is not what we want, we want to see which city is the most frequent.
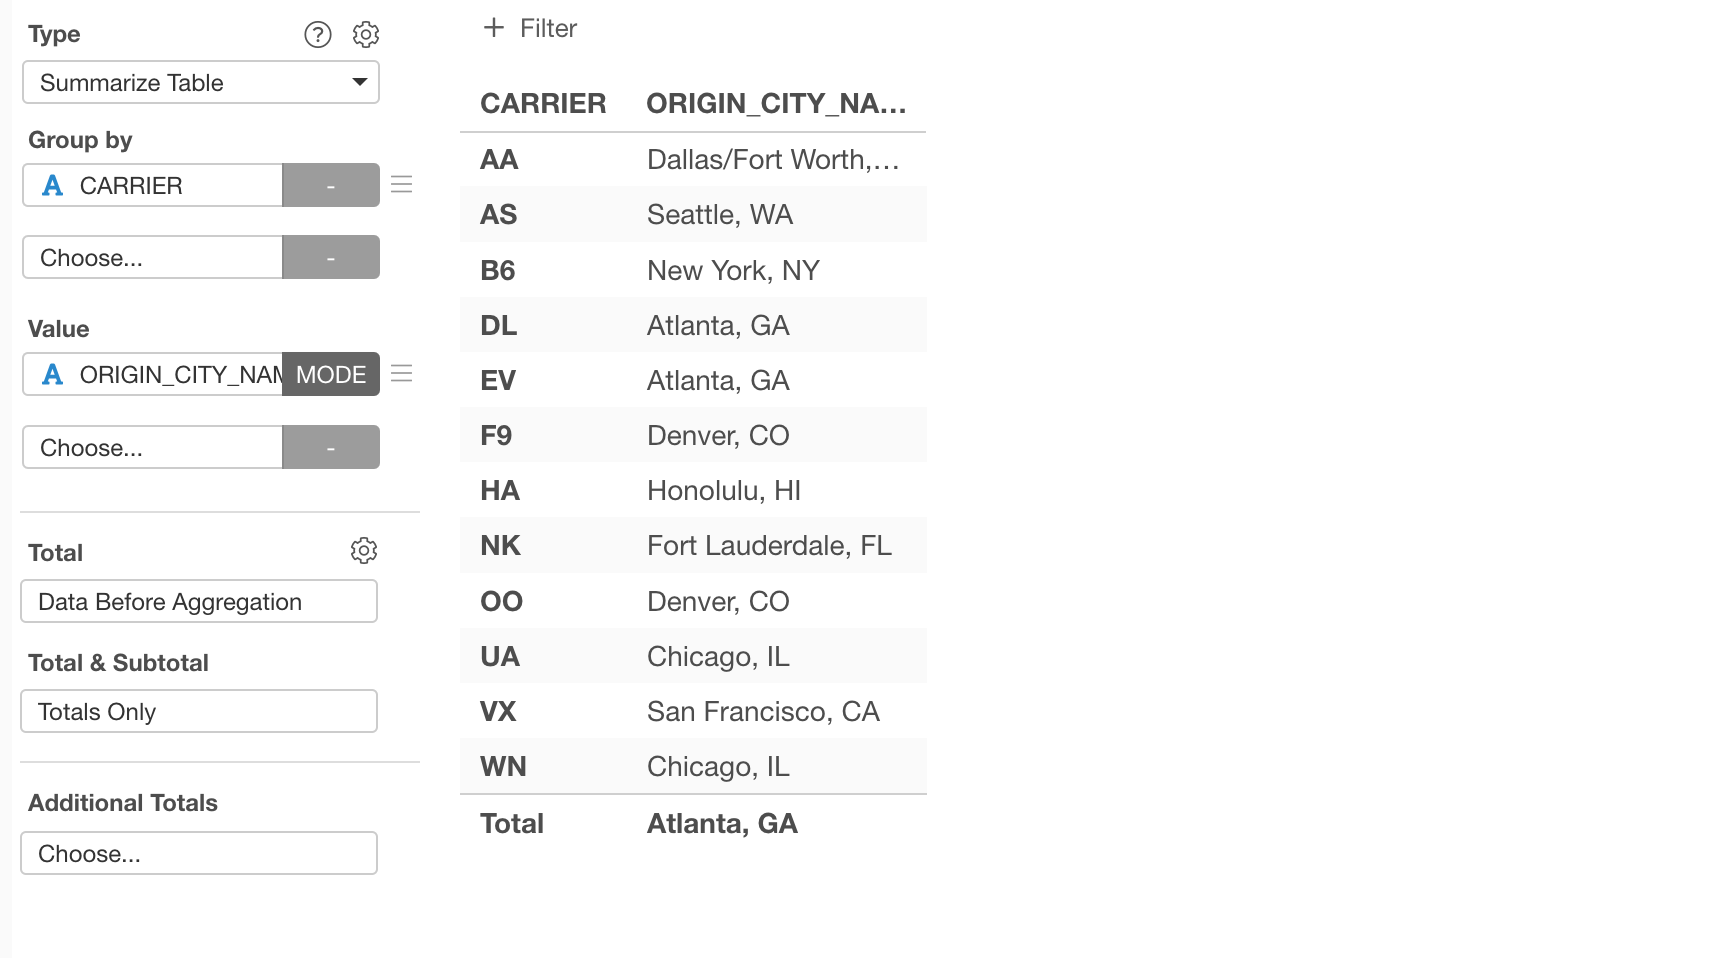
So, we can switch the 'Summarize' function to 'Mode (Most Frequent)' to return the most frequent value for each carrier.
Now we have the most frequent city for each of the corresponding carrier.
2. Use Summarize Step (Data Wrangling)
First, go to the Table view, and select 'Summarize' from the column header menu of the 'CARRIER' column.
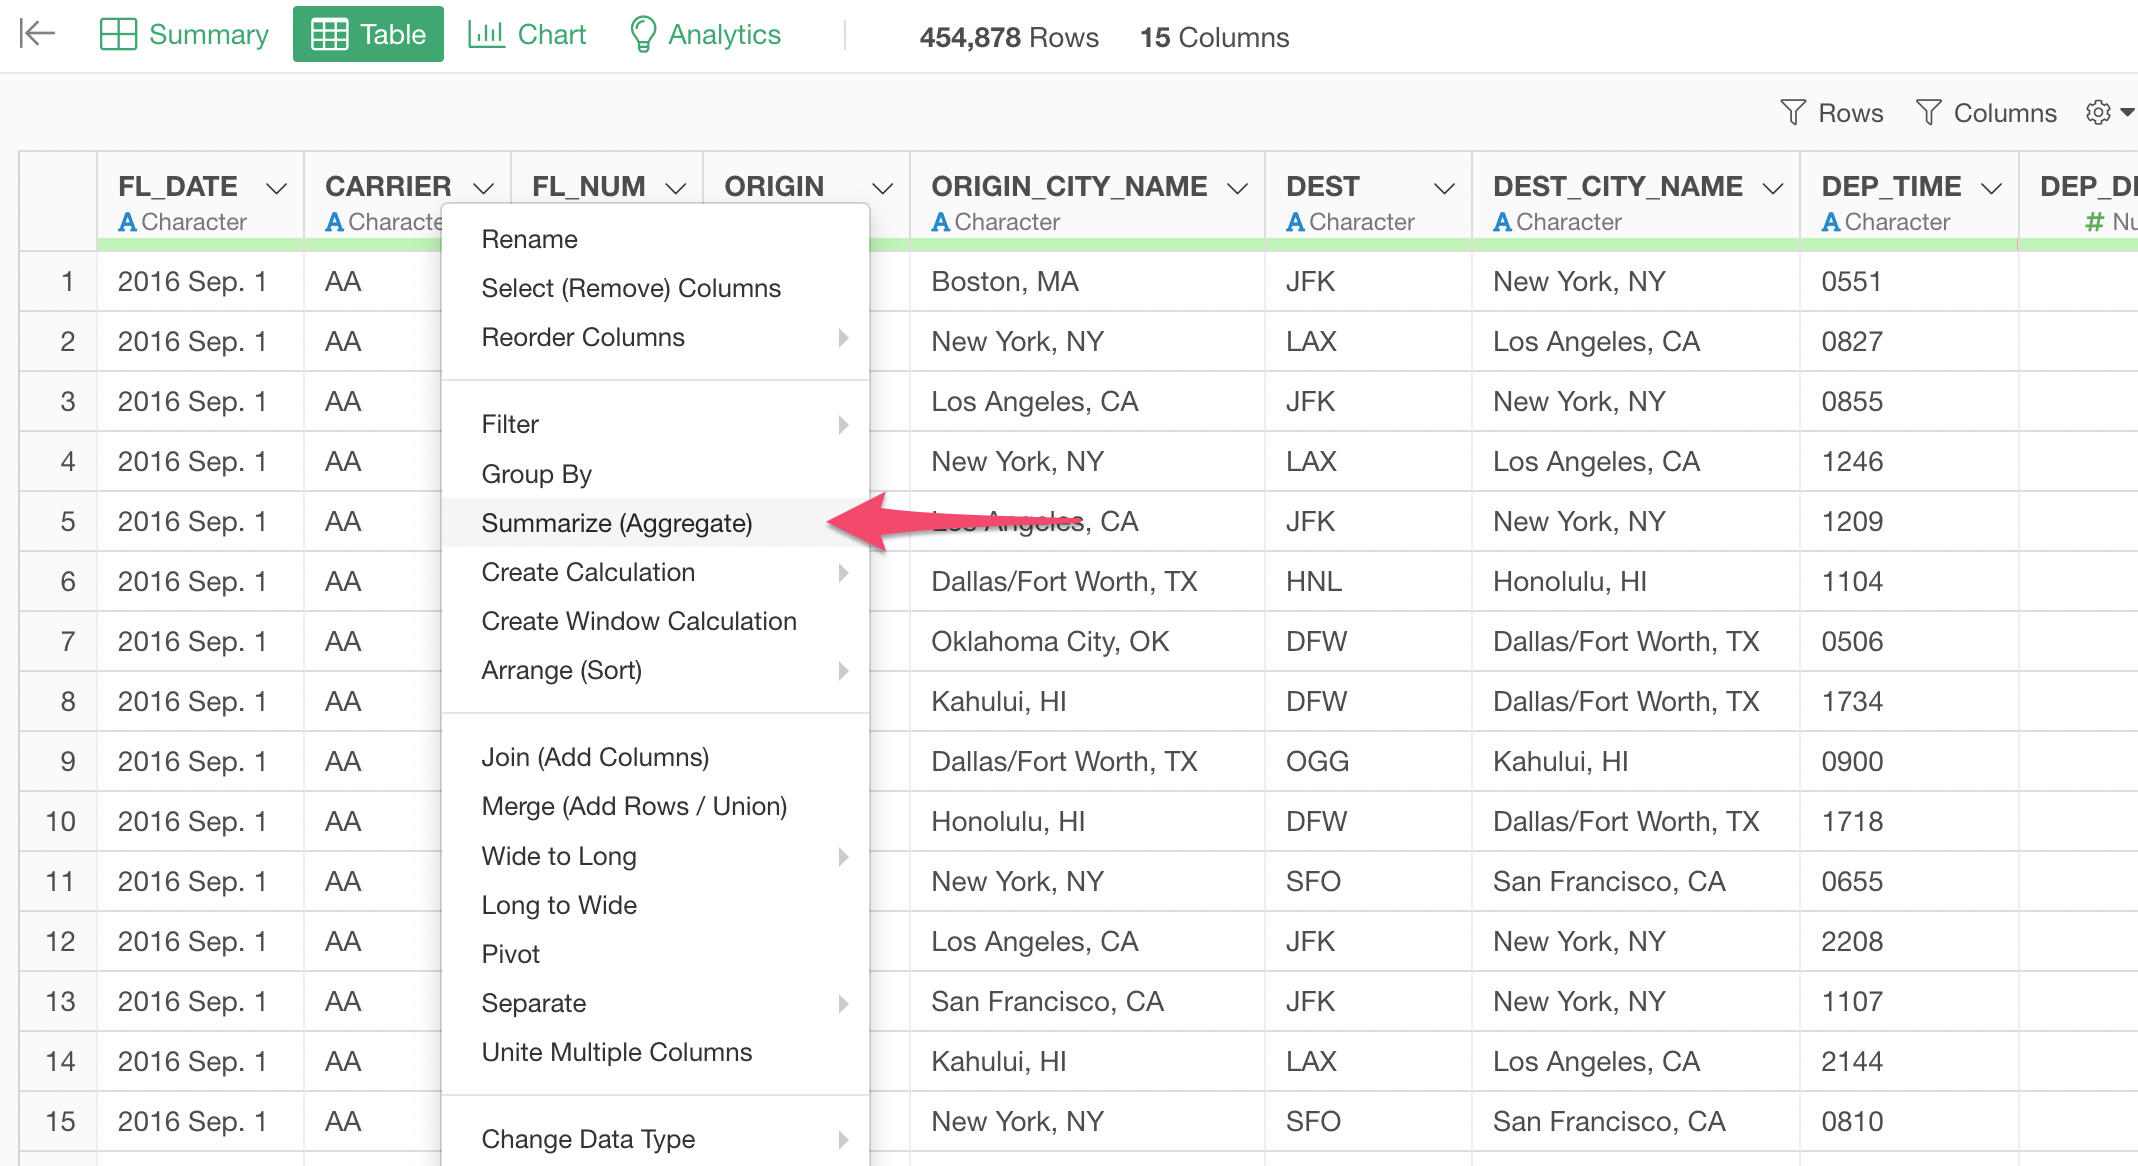
Make sure that the CARRIER column is selected for the Group By in the Summarize dialog.
Then, you want to select the 'ORIGIN_CITY_NAME' column for the Value, and select 'Mode (Most Frequent)' for the Summarize function.
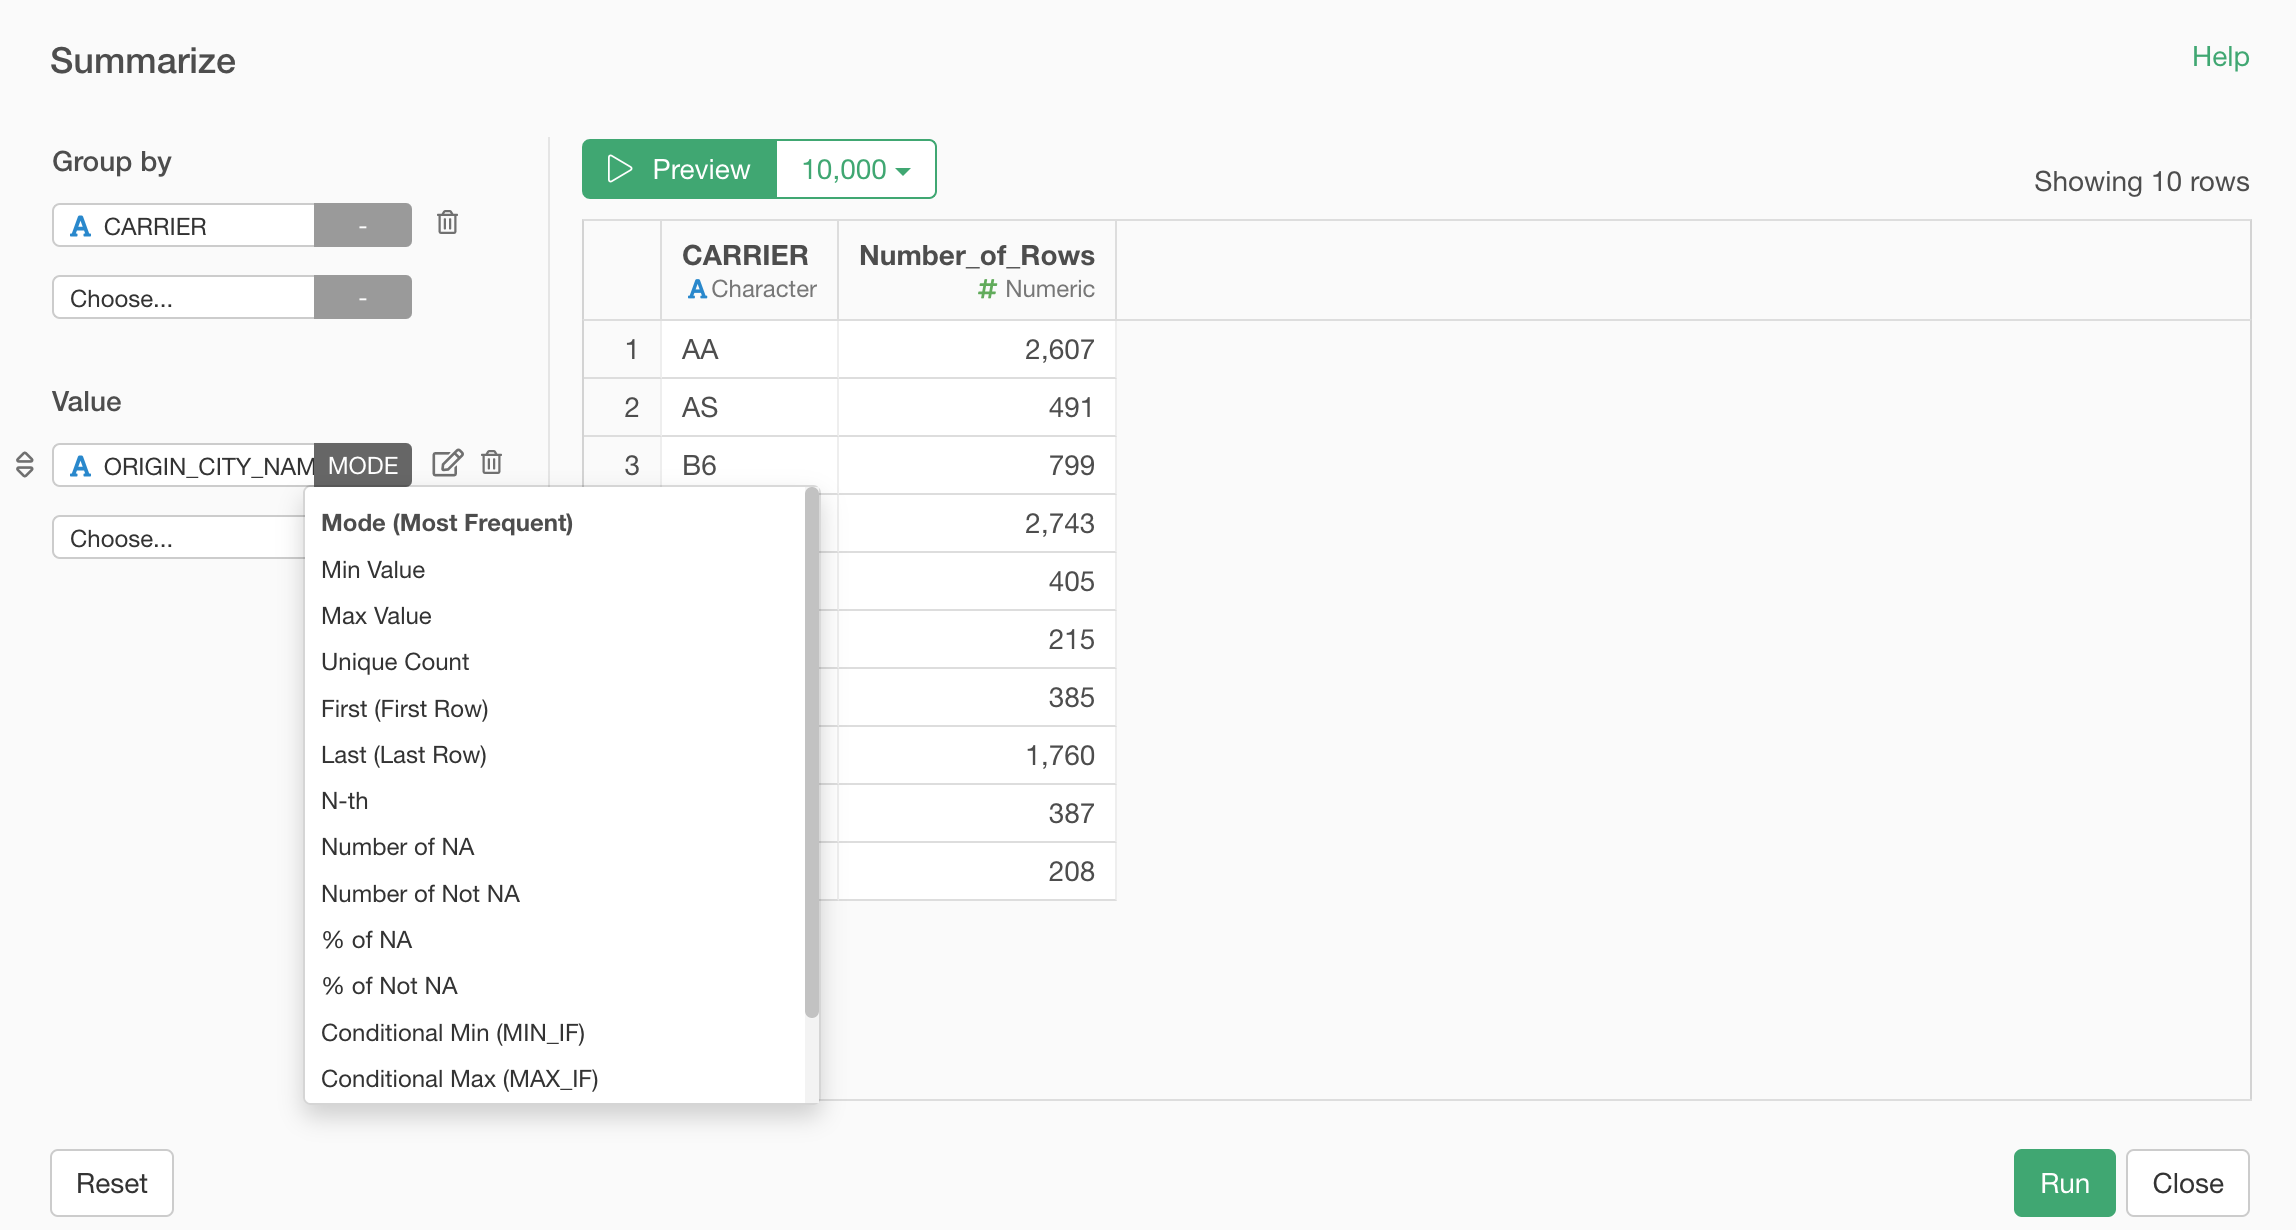
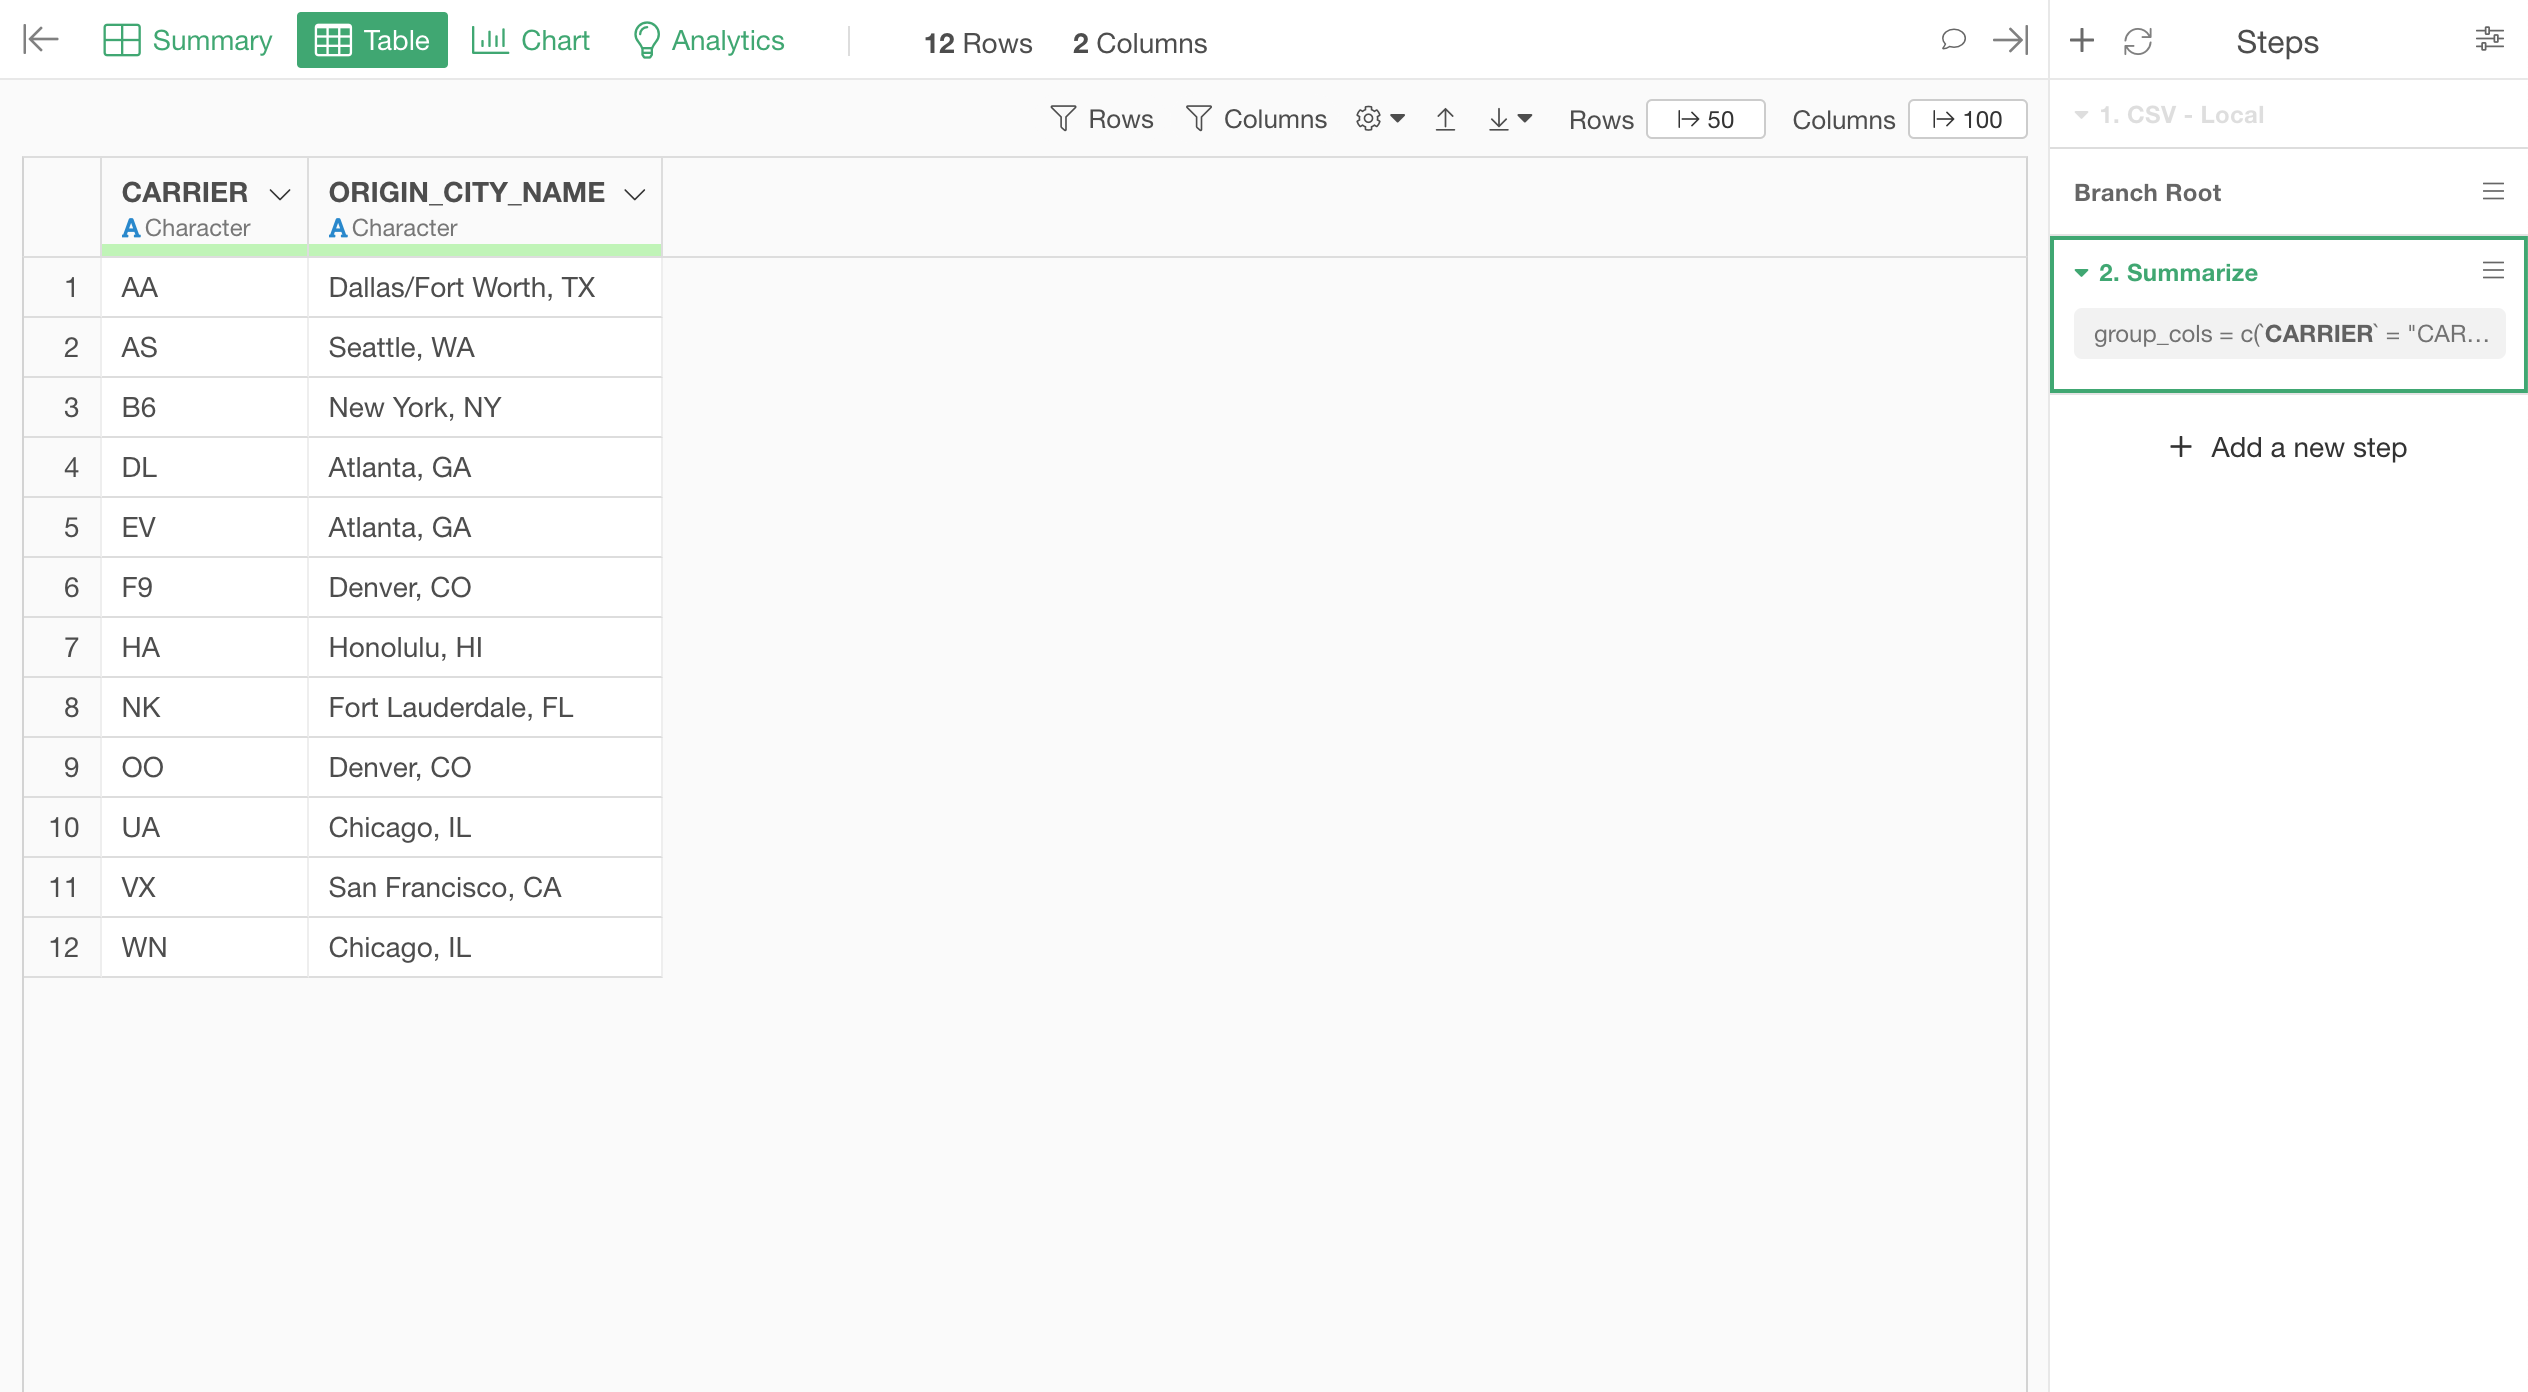
Once you hit the 'Run' button you will have the summarized data with the most frequent cities for all the carriers.
If you are interested in doing this for yourself, I have shared the sample flight data here.