
Hi there!
It’s Kan from Exploratory. Hope this email finds you well.
First, as to our January’s Data Science Booster Training, we have added the morning (California time) slot, which means you can either join the class at 9AM PT or at 5PM PT (or even both!). Also all the sessions will be recorded so you can self-learn for yourself at later times as well. Lastly, the early bird discount will end in next week so make sure you won’t miss it!
Now, here’s our weekly update for this week.
What We Are Reading
2017 The State of Data Science & Machine Learning
2017 The State of Data Science & Machine Learning by Kaggle - Link
In case you don’t know, Kaggle is a Data Science contest platform for Data Scientists to compete for building better prediction models. Recently they have done a survey by asking many of the Kaggle users about Data Science / Machine Learning and shared the result.
There are 16,000 people who responded from around the world and across many industries. You can find interesting insights regards to where we are in the world Data Science and Machine Learning. Here are a few interesting topics I thought were interesting.
What is the title of your job?
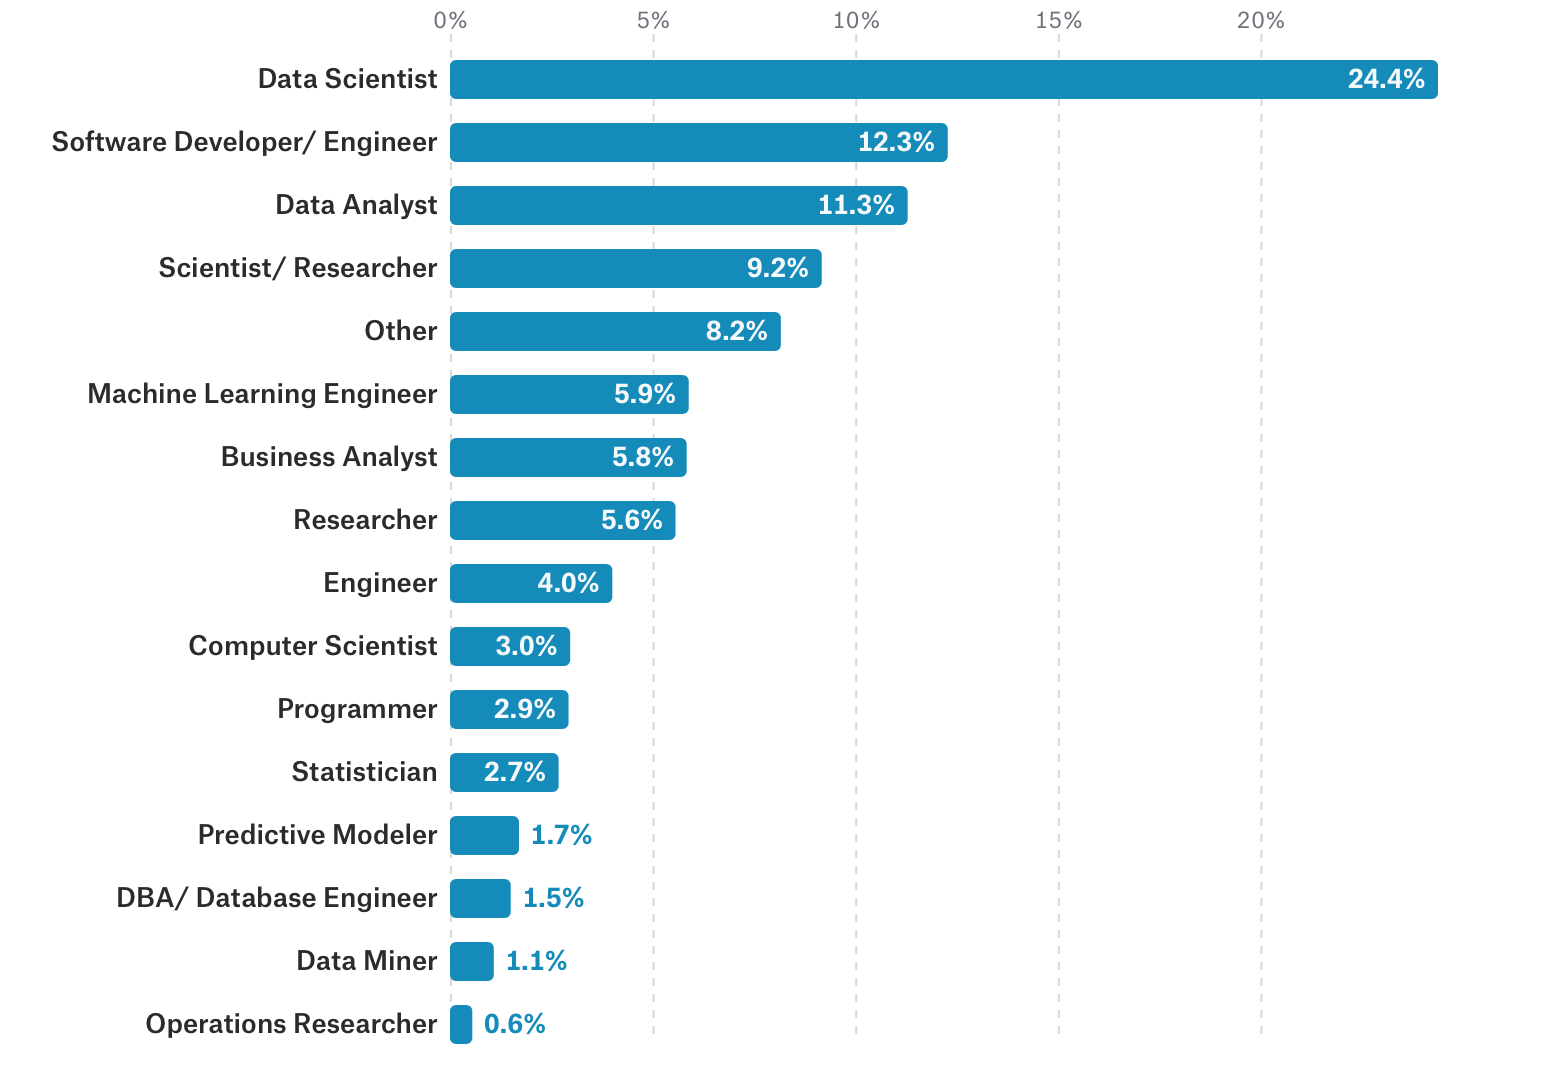
When it comes to the job titles, there seems to be still no concrete definitions about people who does Data Science. Our Exploratory’s customers are also varied from Data Scientists, Data Analysts, Business Analysts, Researchers, Statisticians, etc. As this field of Data Science evolves rapidly we’ll see more blurred distinctions between the traditional sense of the job titles.
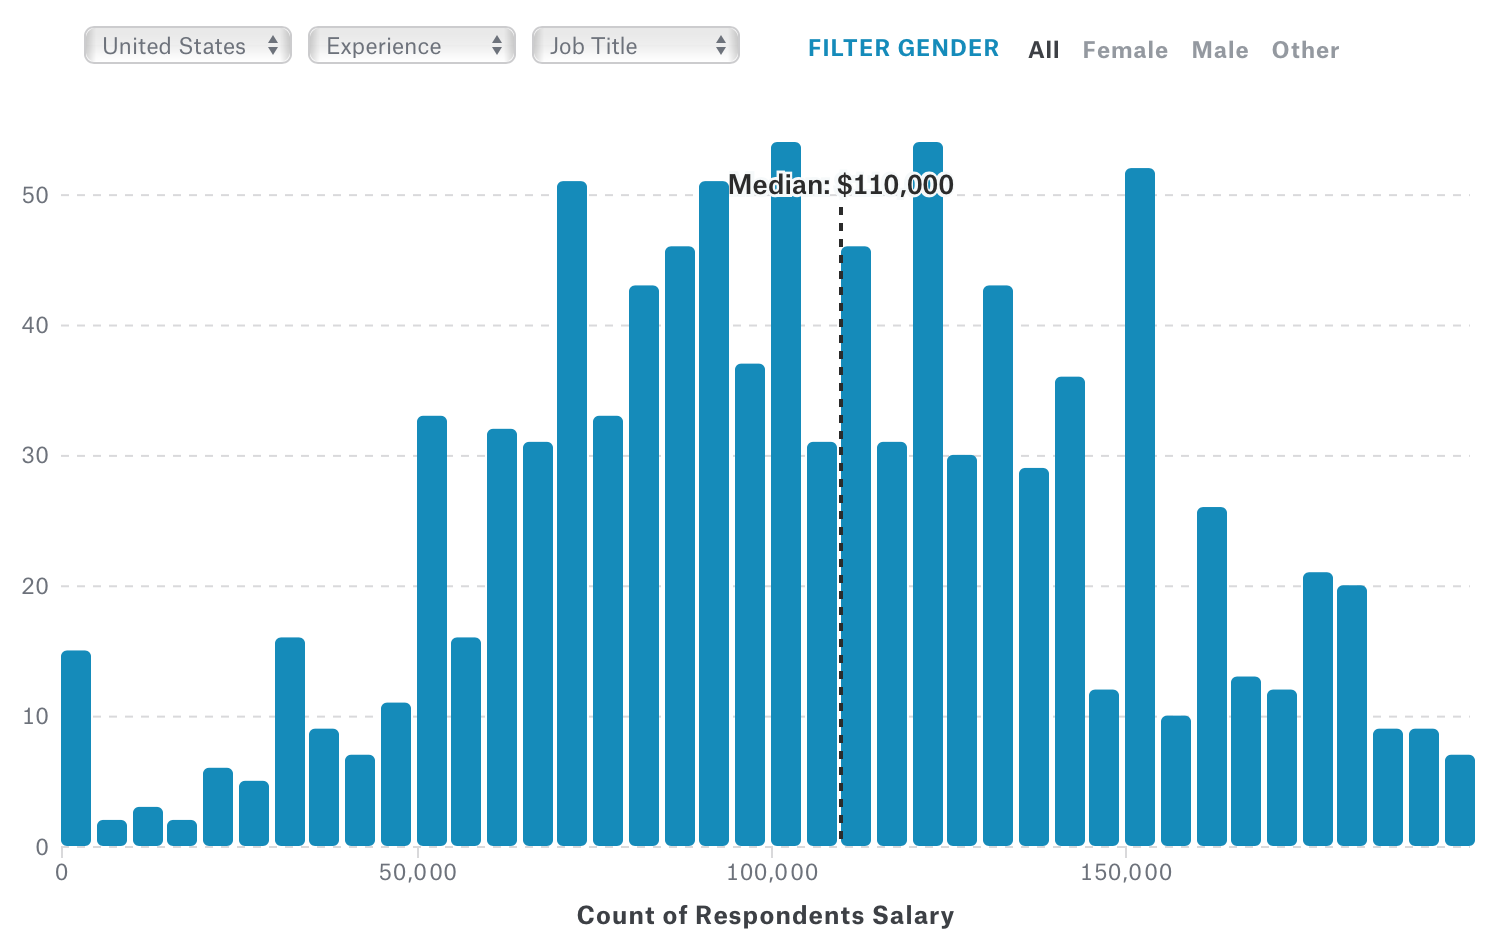
What is your full-time annual salary?
Data Scientists salary is known as very expensive compared to other jobs and that’s not getting any better. (Better for Data Scientists though!) The chart below shows the salary for all the job titles in this survey.
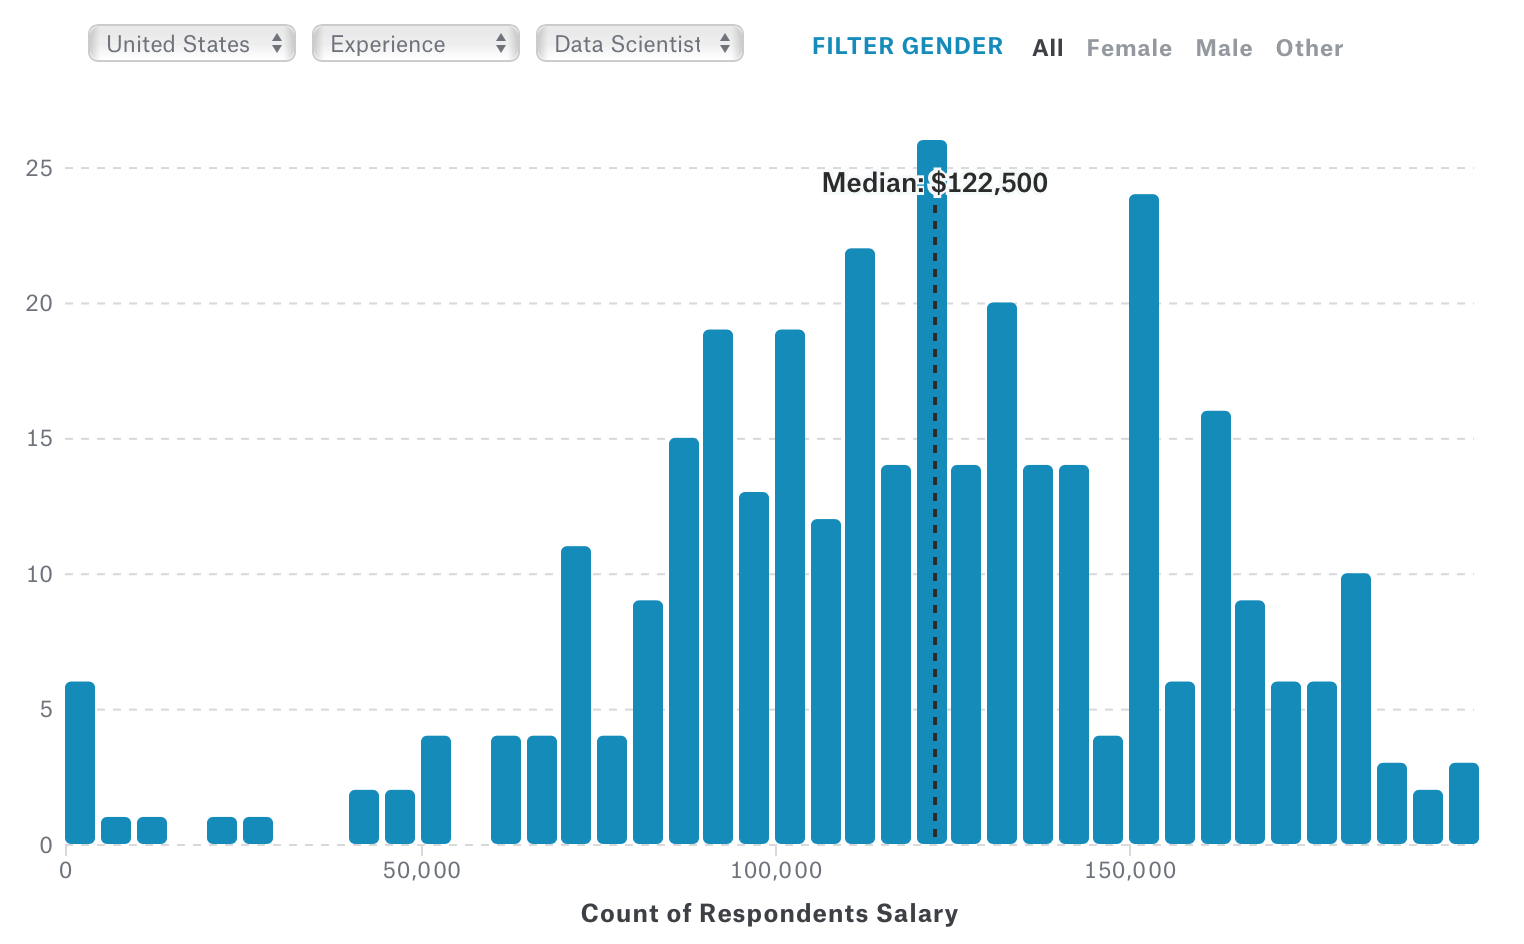
But if we look at only Data Scientists the median salary goes up to $122,500.
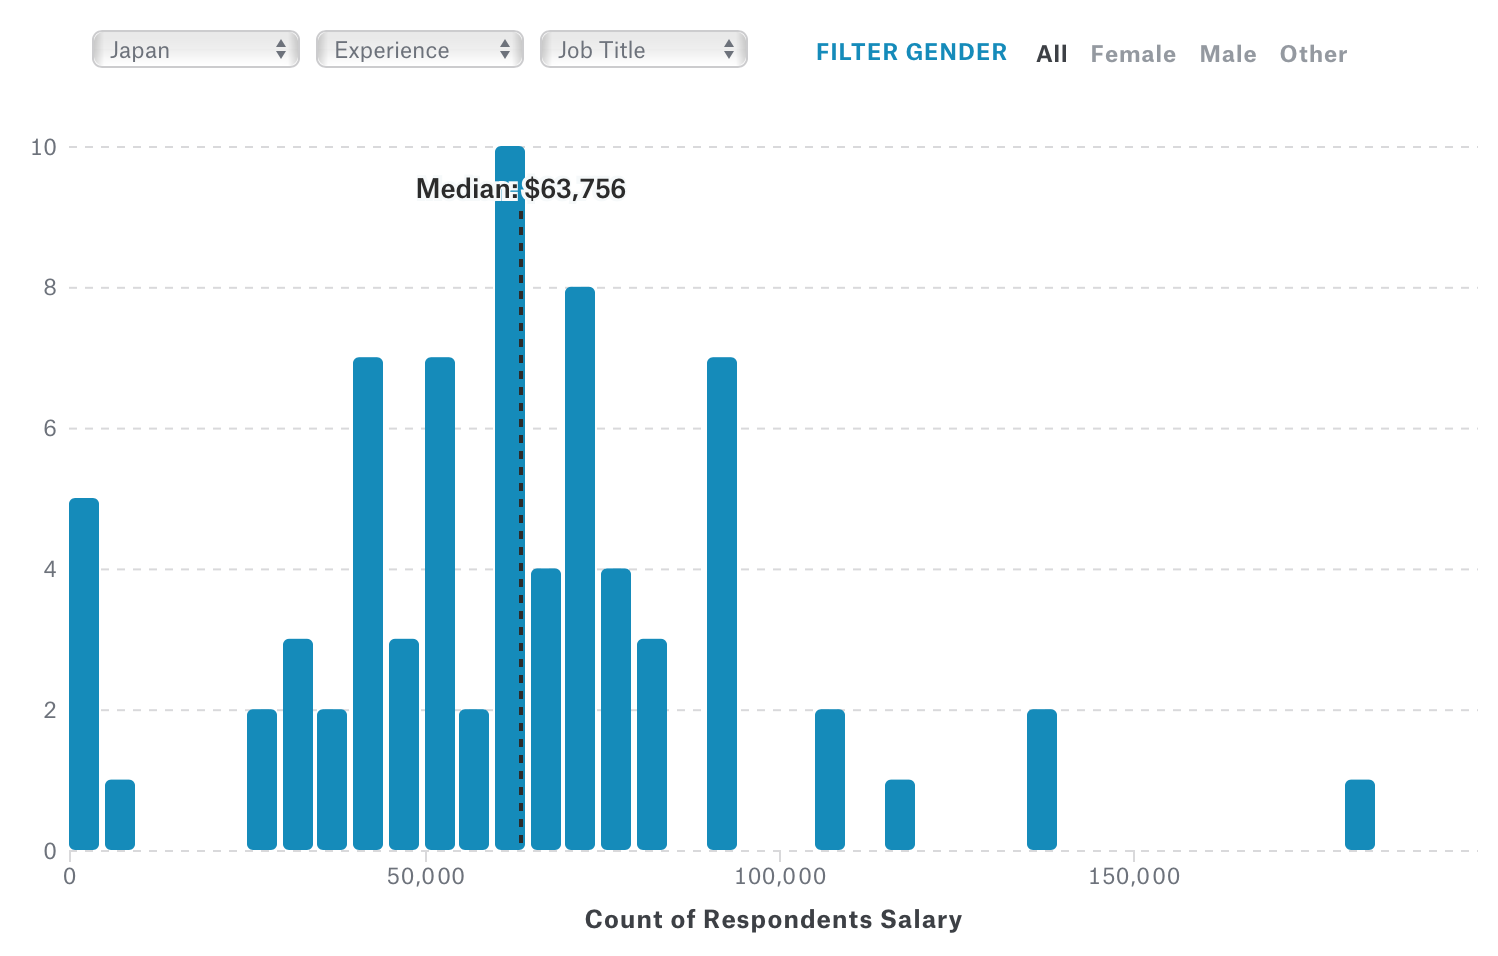
By the way, the salary is expensive in the United States, but it doesn’t mean it’s expensive everywhere. For example, the median salary is only $63.7K in Japan, that’s a half of the cost of US! Although the sample is very small to conclude that firmly, that’s not far from what I’m hearing from our friends and customers in Japan.
What data science methods are used at work?
You can also see what Machine Learning algorithms are popular among those who responded at Kaggle.
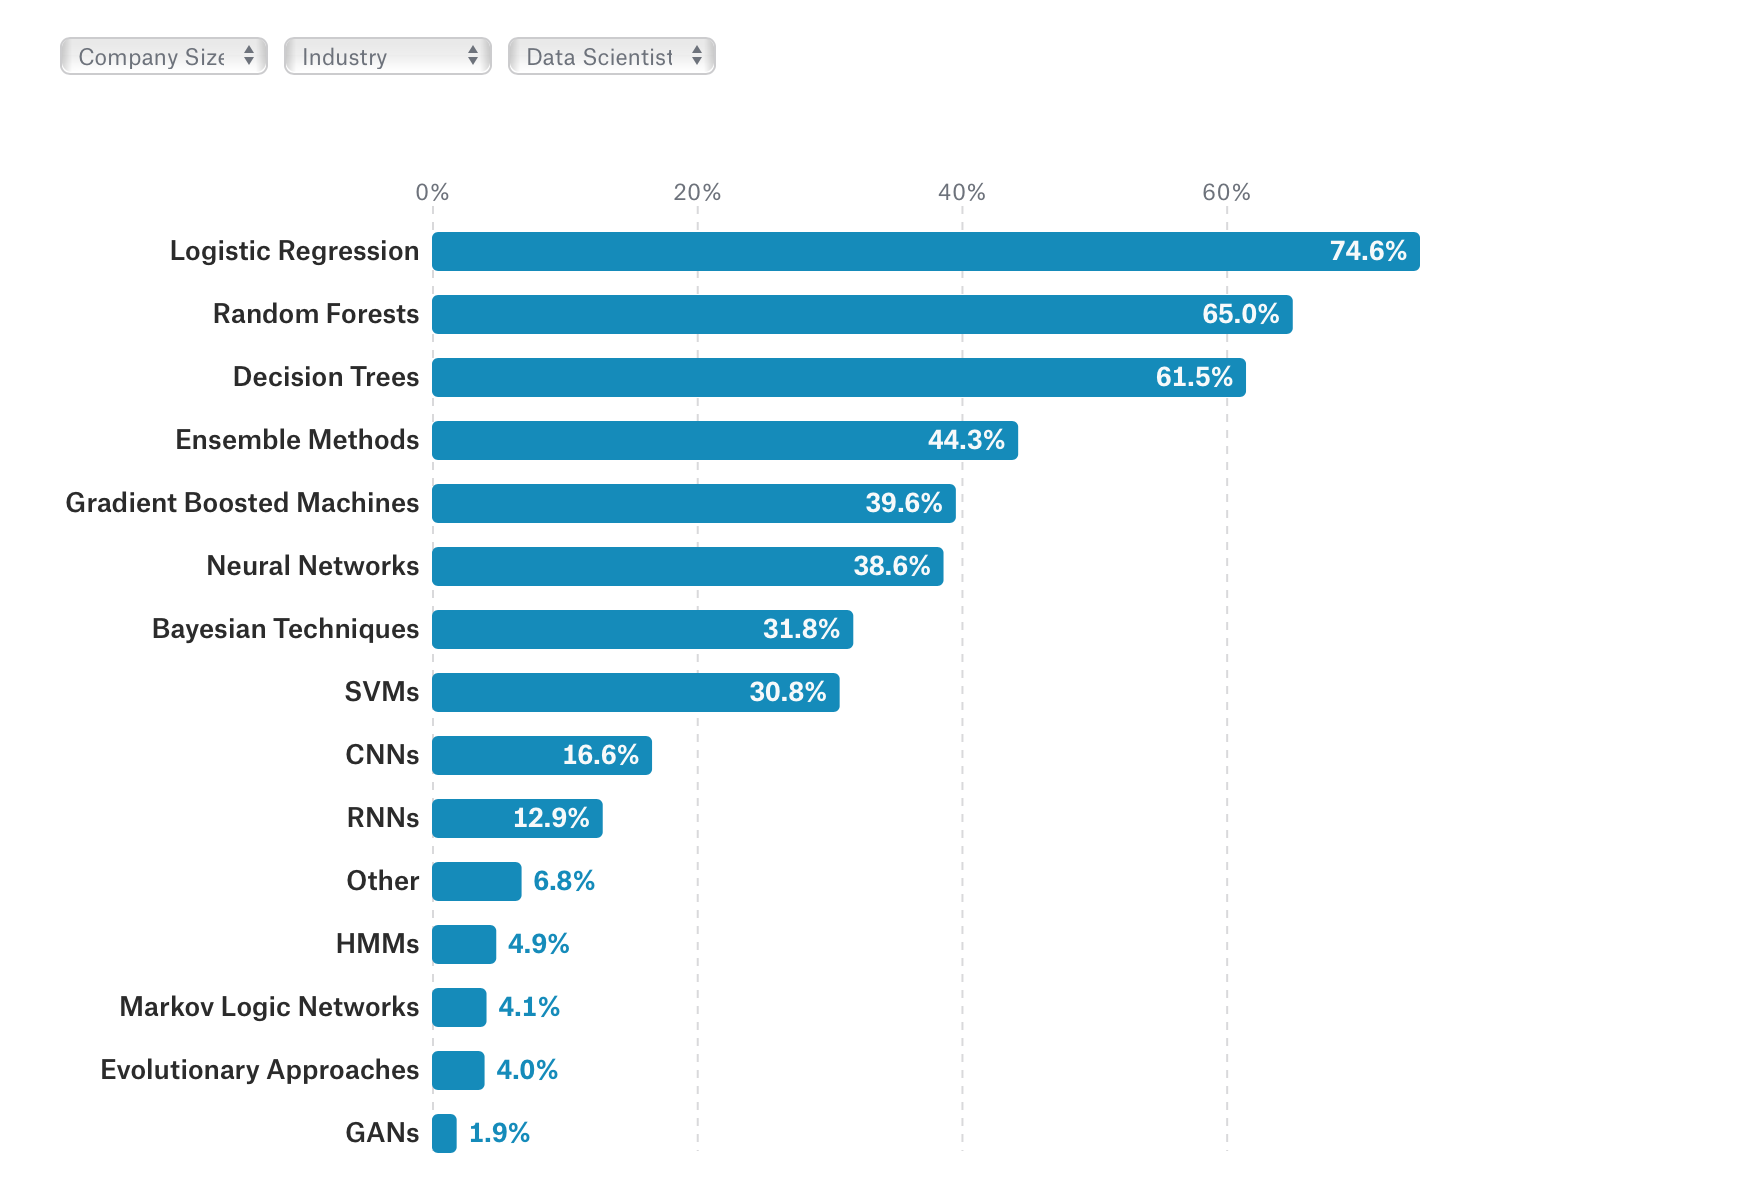
It’s a bit of surprise, though not much if you are a Data Scientist, but the good ol’ Logistic Regression comes as the most frequently used algorithm among Data Scientists. Random Forest, Decision Tree, Gradient Booster Machines (e.g. XGBoost) come after.
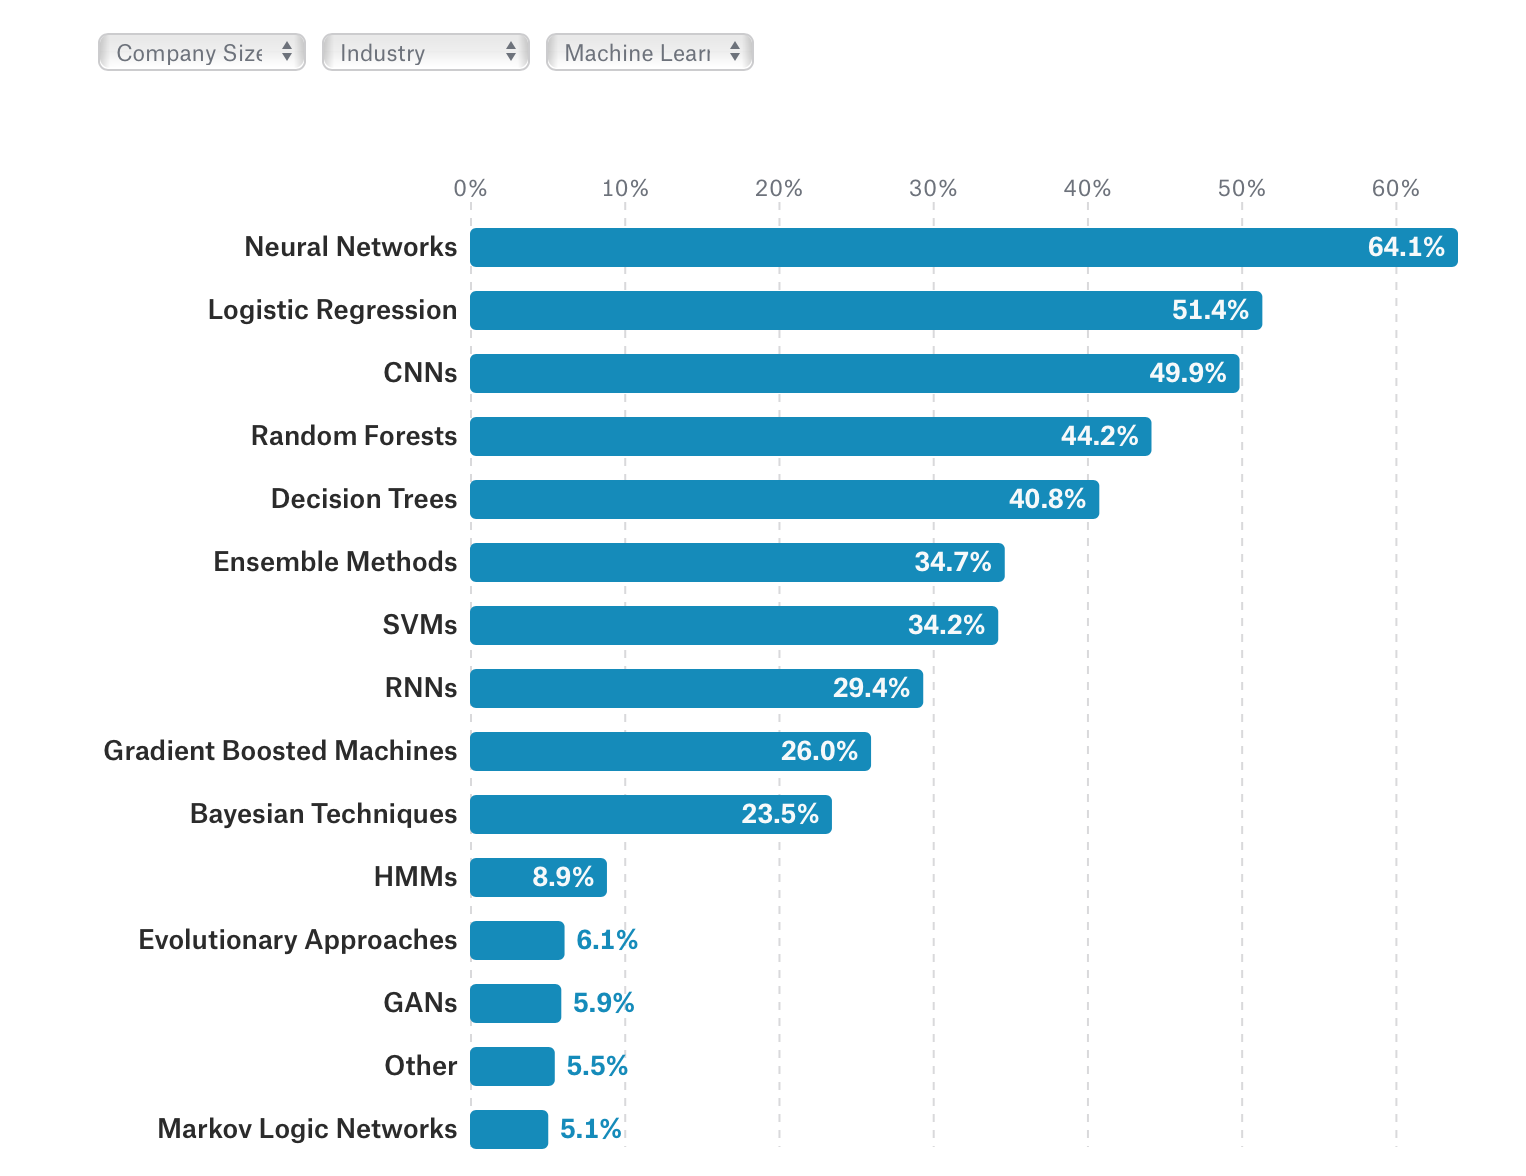
Deep Learning related algorithms such as Neural Network, CNN, RNN are not used as often as others, though they are popular among Machine Learning (ML) Engineers. This difference between Data Scientists and ML Engineers is important especially when you want to prioritize what to learn for your carrier and business.
StitchFix
http://algorithms-tour.stitchfix.com/#recommendation-systems
It’s already a two weeks ago, but a personal fashion styling service called StitchFix went IPO. It is known as a Data Science company whose Data Science team has been led by a Chief Algorithm Officer.
It’s a bit old now, but they published a very detailed explanation about the inner working of their AI system that ranks and optimizes what clothing items (Fix) to ship to whom, when, and how, with beautiful animated graphics here.
To me, the most important thing here is that StitchFix has successfully built a partnership system between Human (Professional Stylists) and AI (Personal Recommendation System), which can take the best out of each and compliment one another. I believe that’s the future of AI. AI is not going to replace us unlike many people worry about. However, people with AI will be replacing a lot of people and businesses that are late to embrace AI.
Related:
Interview: Brad Klingenberg, StitchFix on Decoding Fashion through Analytics and ML - Link
Here’s another old yet very interesting article about how StitchFix use AI.
The amazing effectiveness of combining humans and machines continues to excite me. The key to this approach is finding the strengths of each. Learning where the boundary should be and how to optimally use feedback is an extremely interesting problem - I am sure we will see much more of it in the coming years.
Interesting Data
Restaurant Visitor Data by Recruit - Link
A very big and progressive Japanese company, which I can’t explain what they do in a single sentence, has recently launched a Kaggle competition with $25,000 rewards in total. You can participate by building a better model to predict how many future visitors a restaurant will receive. Even if you don’t participate it, you can still download the data for brushing up your Data Science skills. There are people sharing great EDA (Exploratory Data Analysis) works that we can all learn something from.
US Crime Data - Link
FBI collects and publish US crime data. The data is summarized by State, Crime type, Year, etc.
US Terrorism Prosecutions Data - Link
“This database of terrorism prosecutions and sentencing information was created using public records including three lists of prosecutions from the U.S. Department of Justice (from 2010, 2014, and 2015), court files available through the federal judiciary’s case management system, DOJ press releases, and inmate data from the Bureau of Prisons.”
Blog Posts from Team Exploratory
Last week, I have published two blog posts related to Bitcoin.
- Getting Bitcoin Data and Visualizing in 3 Steps by Kan - Link
- Can We Predict Bitcoin Price With Google Trend? by Kan - Link
And I’ll be publishing two more for this Bitcoin series with Forecasting and Anomaly Detection algorithms this week, stay tuned!
What Are We Working On?
We are continuously and aggressively working on the development of v4.2.
As mentioned above, the good ol’ Logistic Regression is the most popular go to tool among many Data Scientists, and you can use it in Exploratory today. But, with v4.2, you can quickly access it under Analytics view as part of Regression Analysis.
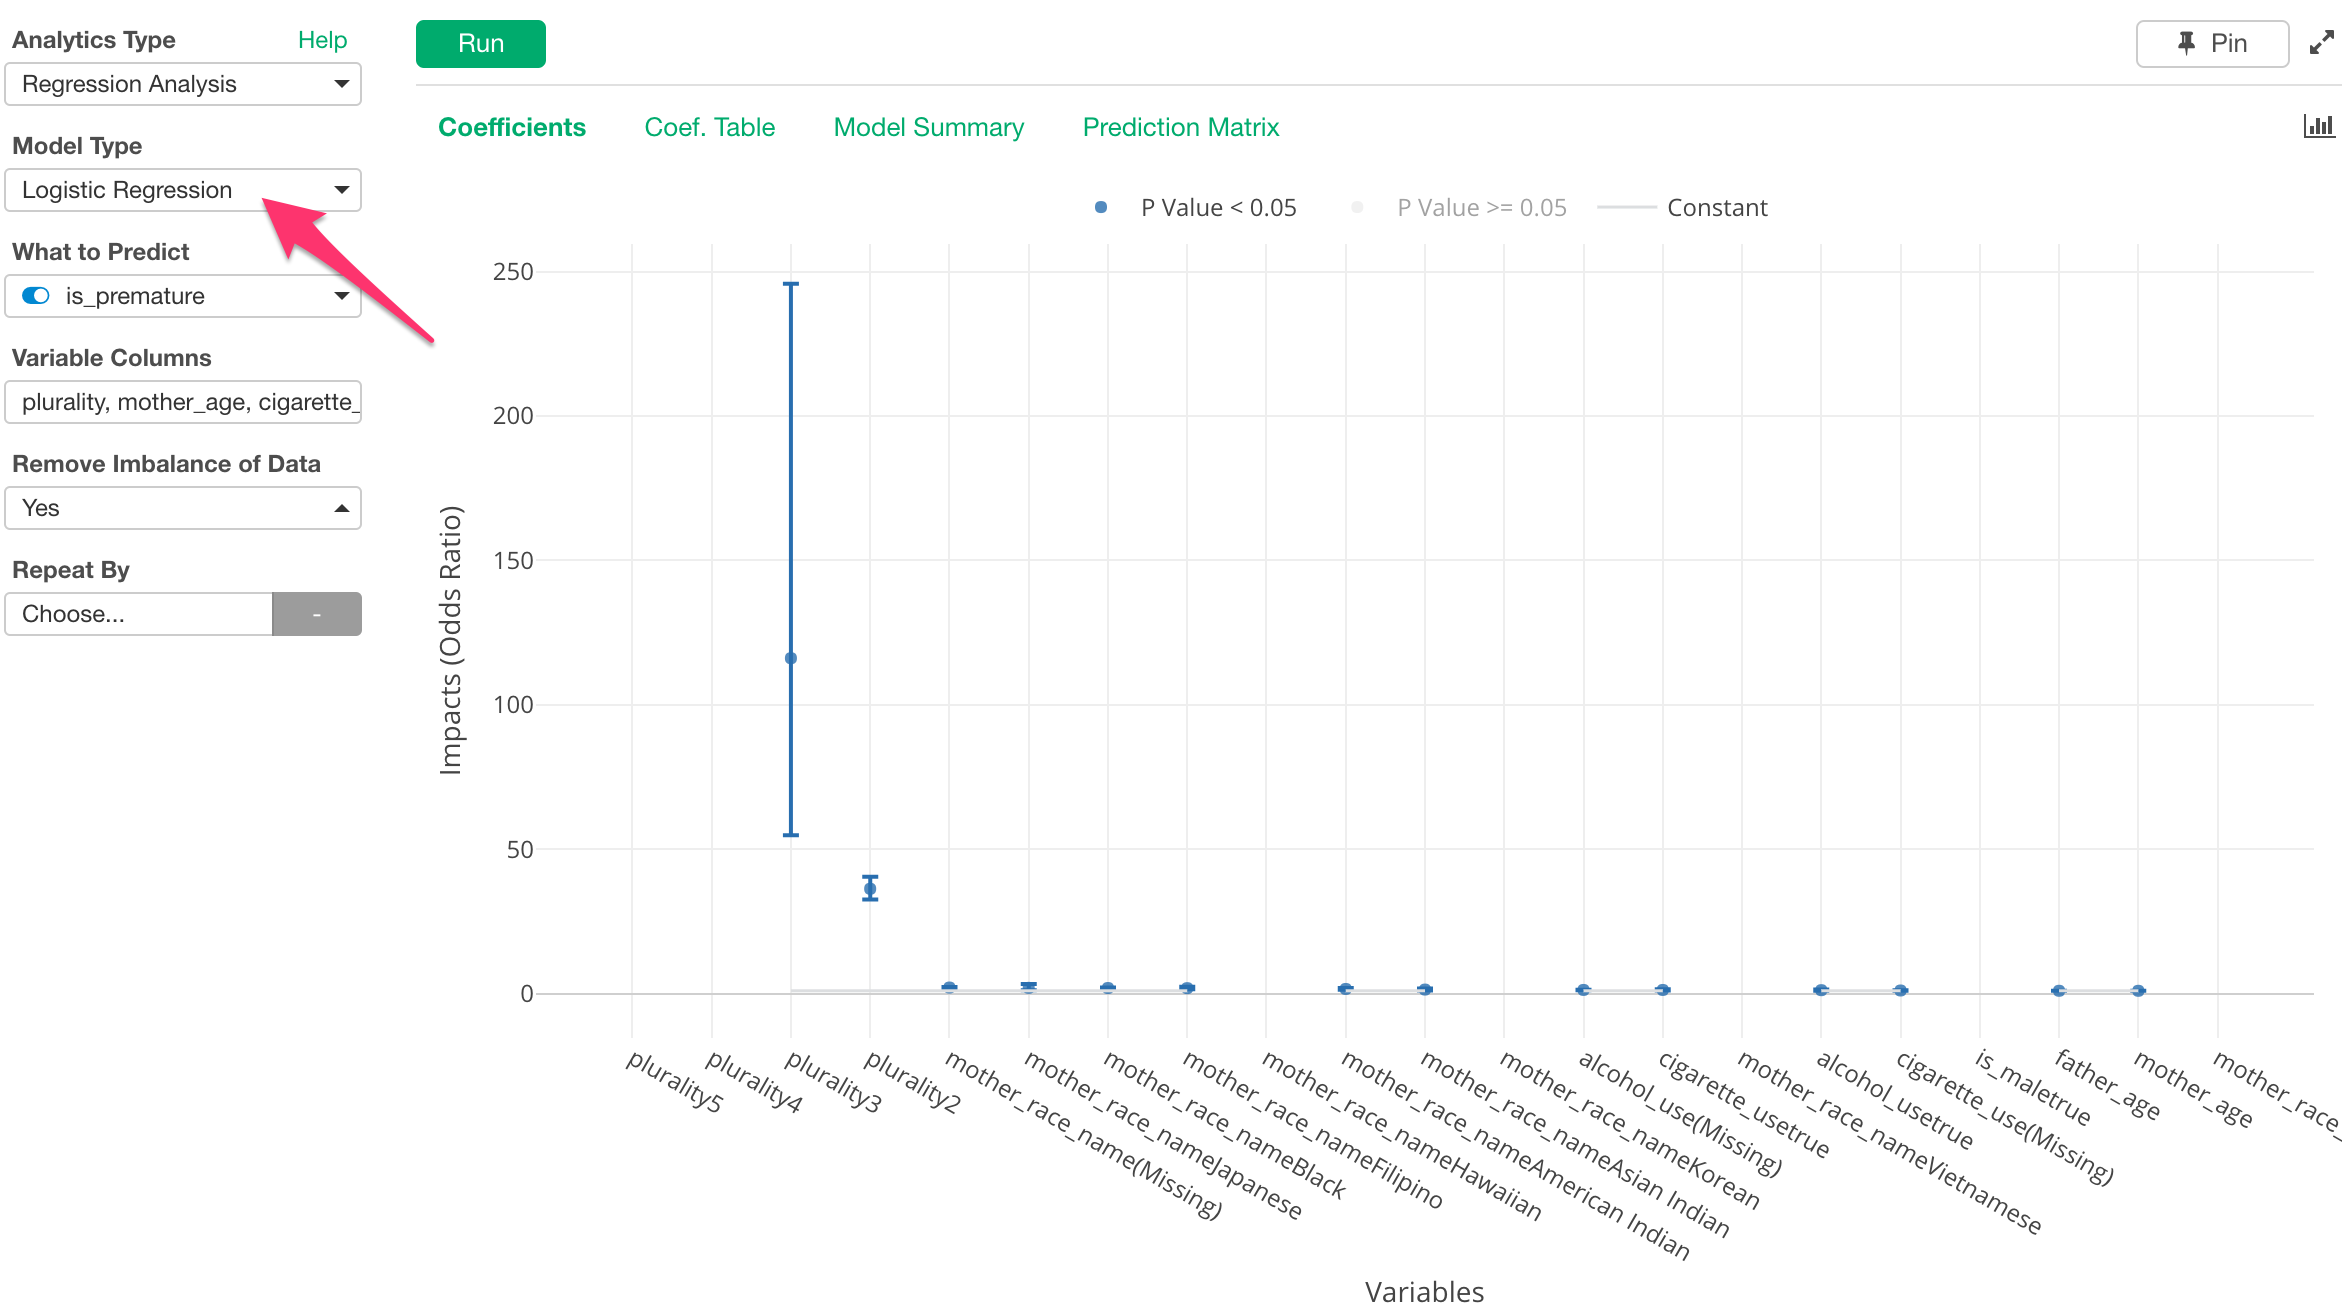
When you want to predict something that has two outcomes, for example, whether the customers will convert or not, whether they will become loyal customers or not, etc., then you can use Logistic Regression to analyze how much each variable will have impact on the outcome.
Data Science Booster Training
As mentioned at the beginning, we will have our 10 hours online live training (Link) in January to equip you with the powerful Data Science methods ranging from Machine Learning, Data Visualization, and Data Wrangling. Visit our Booster Training home page for more details.
Have a wonderful week!
Kan, Exploratory/CEO