
Hi there!
It’s Kan from Exploratory. Hope this email finds you well.
It’s already been a month since the last weekly update, so obviously I’m not doing good job here! ;)
Anyway, first thing first. I’m super excited to announce our new Data Science Booster Training in January!
It is a 5 days (2 hours a day, 10 hours in total) on-line live training where you can learn powerful Data Science methods like Machine Learning/Statistics, Visualization, and Data Wrangling. If you know somebody who wants to learn Data Science without programming, please forward this link to them and help us make Data Science more accessible to many!
Now, here’s our weekly update for this week.
What We Are Reading
Software 2.0 by Andrej Karpathy - Link
Deep Learning is Eating Software by Pete Warden - Link
There are two articles, one from Andrej Karpathy, Director of AI at Tesla, and another is from Pete Warden, Research engineer at Google, about how AI is replacing the traditional software development.
We talk about ‘Software is eating the world’ a lot. Now, it turned out that the way we build the Software itself is getting replaced by AI/Machine Learning. This is not future, it’s already happening today in areas like Visual Recognition, Speech recognition, Speech synthesis, Machine Translation, Robotics, Games, etc. all of which we used to write codes with programming languages to make them work.
In this new world, the people who build the Software need to be the teachers who train the AI models, the curators who collect data to feed the models, and the analysts who analyze the results that the models produce. I used to think Software developers are the ones who build the futures in this era of Software Revolution. But, that role is now getting passed to the hands of Data Scientists/Analysts.
How exciting!
Related:
- Airbnb develops an AI which converts design into source code - Link
- More Evidence That Humans and Machines Are Better When They Team Up - Link
- Andrew Ng Wants a New “New Deal” to Combat Job Automation - Link
How companies can navigate the age of machine learning by Ben Lorica - Link
We often talk about “80% of Data Scientists’ time is spent on Data Wrangling”, and this still holds true today. Building AI/Machine Learning models is getting easier and faster everyday, which makes the ratio of the Data Wrangling time even bigger.
I strongly think that Data Wrangling itself is actually where you find a great deal of insights by creatively encoding, transforming, imputing, augmenting, converting, etc. And this is why I don’t think it’s going to be automated anytime soon, and this mean you need to keep practicing it in order to become a great Analyst.
Others
More than a Million Pro-Repeal Net Neutrality Comments were Likely Faked - Link
“I used natural language processing techniques to analyze net neutrality comments submitted to the FCC from April-October 2017, and the results were disturbing.”
Advice to aspiring data scientists: start a blog - Link
Capsule Networks are shaking up AI, heres how to use them - Link
Stop Using Excel, Finance Chiefs Tell Staffs - Link
“Ubiquitous spreadsheet software that revolutionized accounting hasn’t kept up, CFOs say…”
Interesting Data
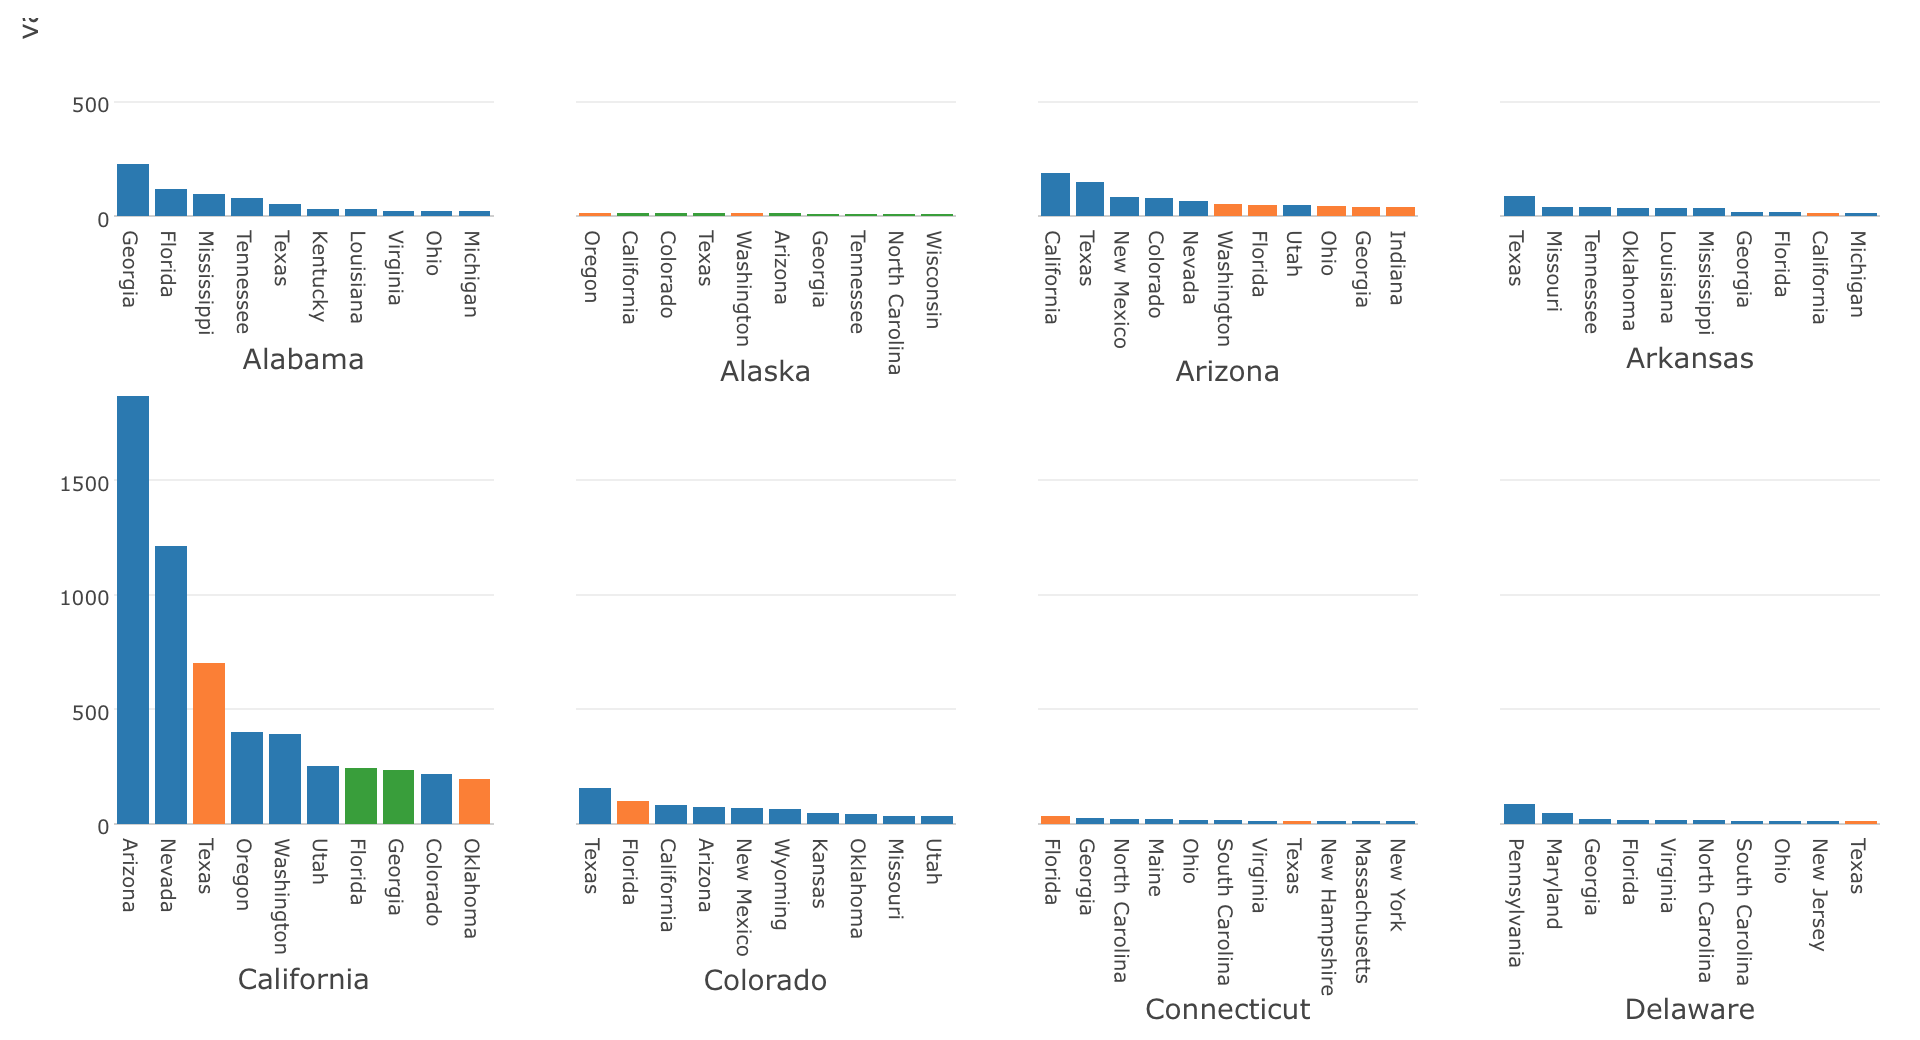
Firearms Trace Data - Link
US Federal agency called The Bureau of Alcohol, Tobacco, Firearms and Explosives collects data about where the guns were found by FBI or the local law enforcement agencies and where they originally came from. You can see the overall trends of where they come from, who produce them, etc.
You can find a variety of data sets, but I have downloaded the one that tracks where from and to and did a bit of Data Wrangling to make the analysis easier. If you like, you can download the EDF from here and import into Exploratory for your own analysis.
BIS (Bank for International Settlements) - Link
There is this cool R package called ‘BIS’ from Eric Persson to make it easy to download Economics data from BIS. You can download metrics data like Public Policy rates, Consumer prices, Global liquidity indicators, etc. I have quickly produced a chart to visualize the trend for Central Bank Policy Rates for major countries/regions here as an example.
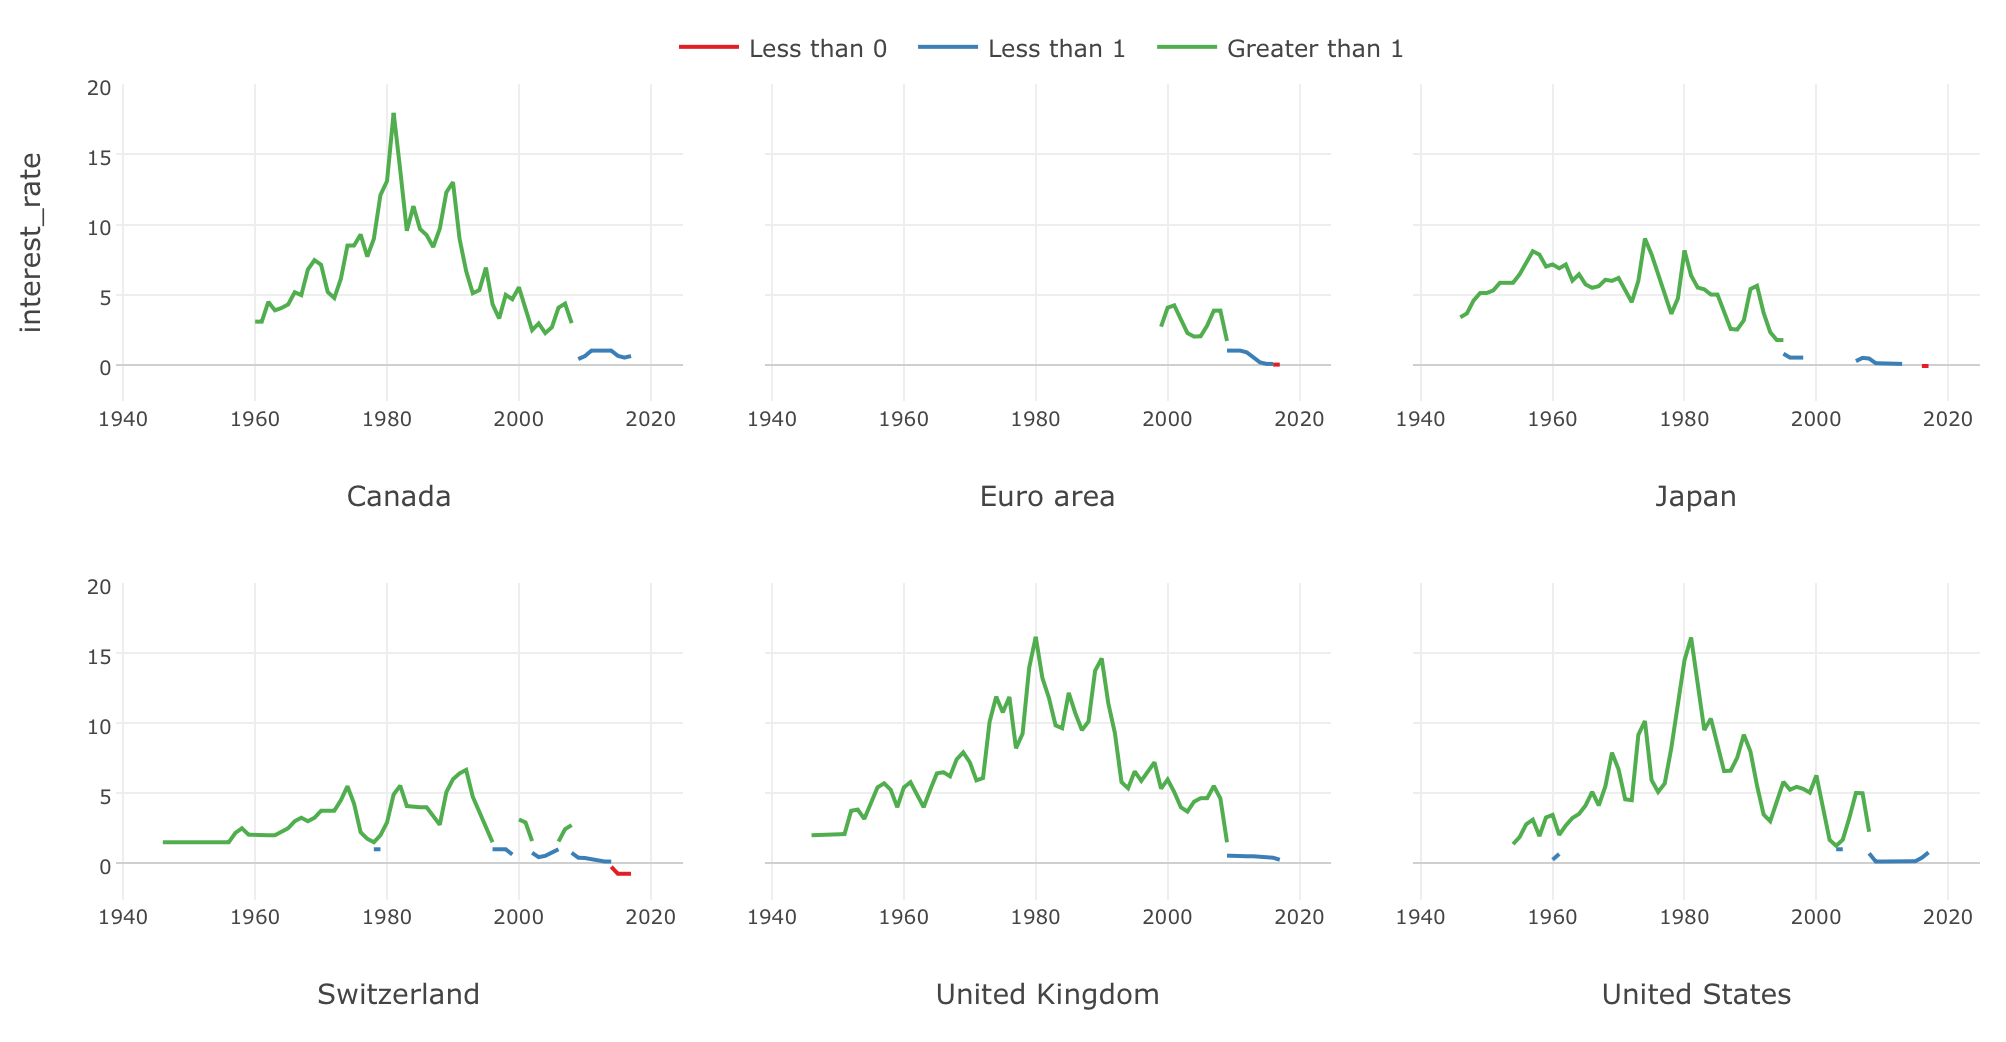
You can download the EDF and import into Exploratory to reproduce it, if you like. You need to install BIS package first, which you can quickly do inside Exploratory. Here’s an instruction about how to install R package.
What is EDF(Exploratory Data Format)? - Document
Blog Posts from Team Exploratory
Here are a few blog posts we have published recently.
What Are We Working On?
We are making a great progress on the development for the next version - v4.2. The main thing is to enhance the existing chart capabilities A LOT. But also, we’re adding new features to Analytics view. For example, one of my favorite new features for v4.2 is the support of ‘Local Estimated Effects’ under Variable Importance Analysis. This can be used to understand how each variable effects the outcome of the prediction.
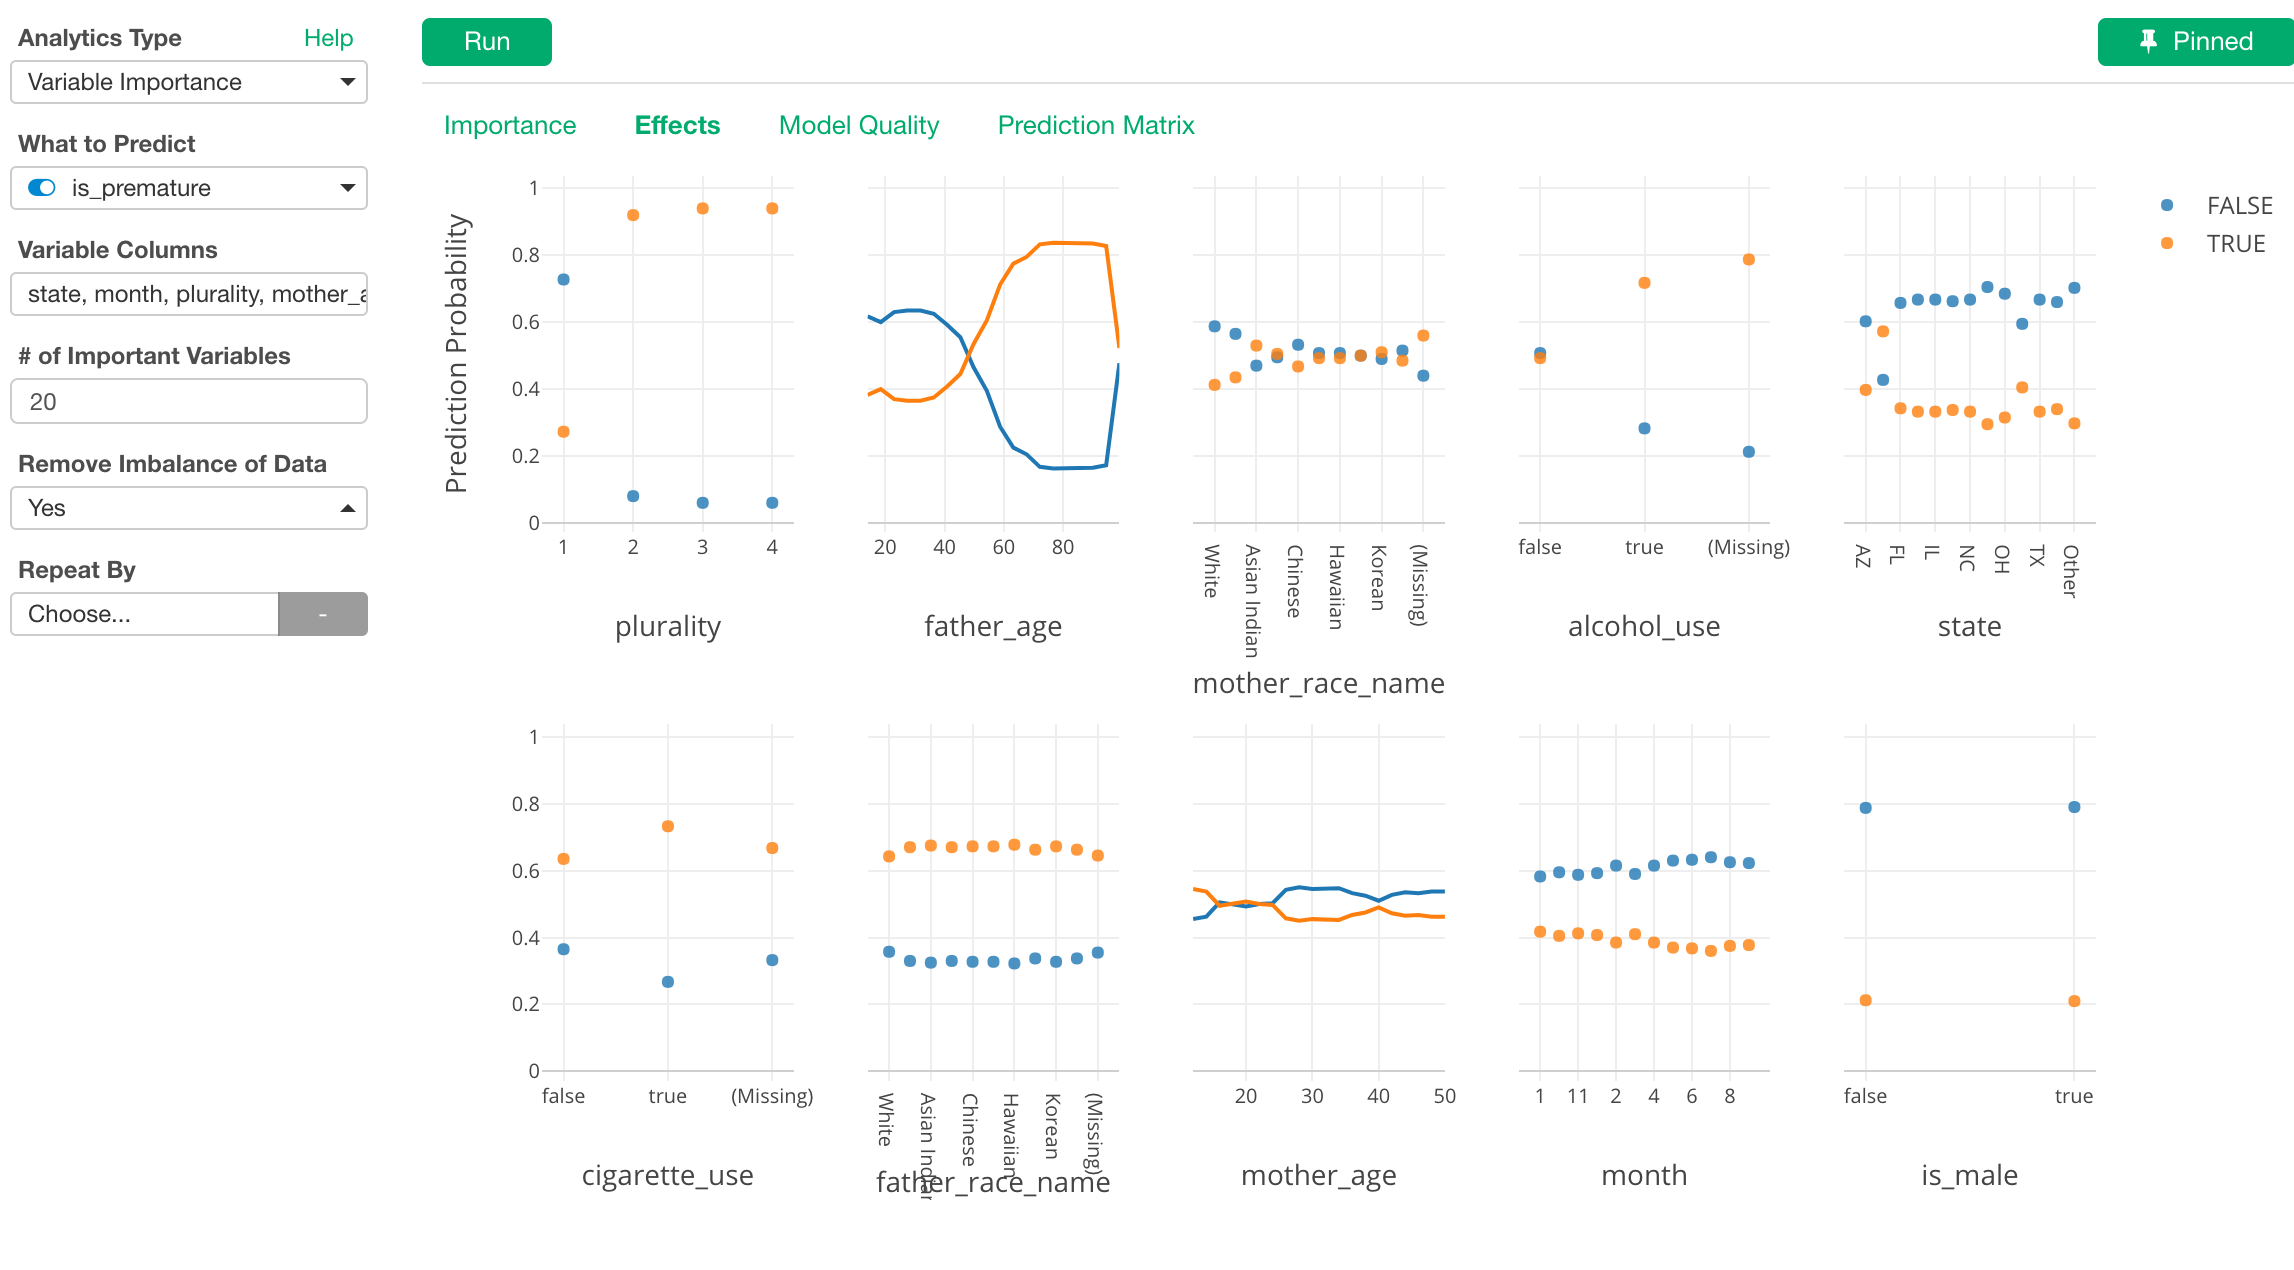
The above example is trying to investigate what makes pre-mature birth with “Natality” data and finding that it will increase the odd when the plurality is more than 2 (more than twins) and the father’s age is greater than 50, for example.
We believe that Machine Learning algorithms should be used more often, not just to predict, but also to explore data at the very initial phase of the data analysis. Rather than exploring the data by assigning columns to Charts one by one, why can’t we use Machine Learning algorithms to produce insights and directions that we can use to make our Exploratory Data Analysis more effective and productive. Analytics view is our answer to this question, and we’ll continue enhancing this area to make such algorithms more accessible to many.
Data Science Booster Training
As mentioned above, we will have our 10 hours online training (Link) in January to make you more comfortable with the powerful Data Science methods ranging from Machine Learning, Data Visualization, and Data Wrangling. If you know someone who wants to learn Data Science without programming, this is it, please forward. Visit our Booster Training home page for more detail.
Have a wonderful week!
Kan, Exploratory/CEO