When Things Get Too Crowded
Sometimes it’s useful to always show the label text for each data point (dots) on Scatterplot chart instead of showing them only when you move the mouse pointer on top of them, especially when you are presenting your chart to others.
You can do this by clicking on ‘Show Label Text’ check-box at Label shelf in Chart Control.
But the problem is that, when there are too many data points or those points are too close to one another, those text will be on top of each other and you or your audience won’t be able to see them clearly.
You can workaround this by using ggplot2 and ggrepel R packages to generate charts inside Note or Slide where you can directly write R codes. The ggplot2 package is the most well known and sophisticated data visualization tool in the field of Data Science, and the ggrepel is an add-in for the ggplot2 package and it makes the text label show up nicely.
You can see the code example and the output below. You can simply reference the data frame you created inside the project.
library(ggplot2)
library(ggrepel)

ggplot(ballot_measures_mds, aes(axis1, axis2)) +
geom_point(aes(colour = cluster)) +
  geom_text_repel(aes(axis1, axis2, label = county_name), size = 3)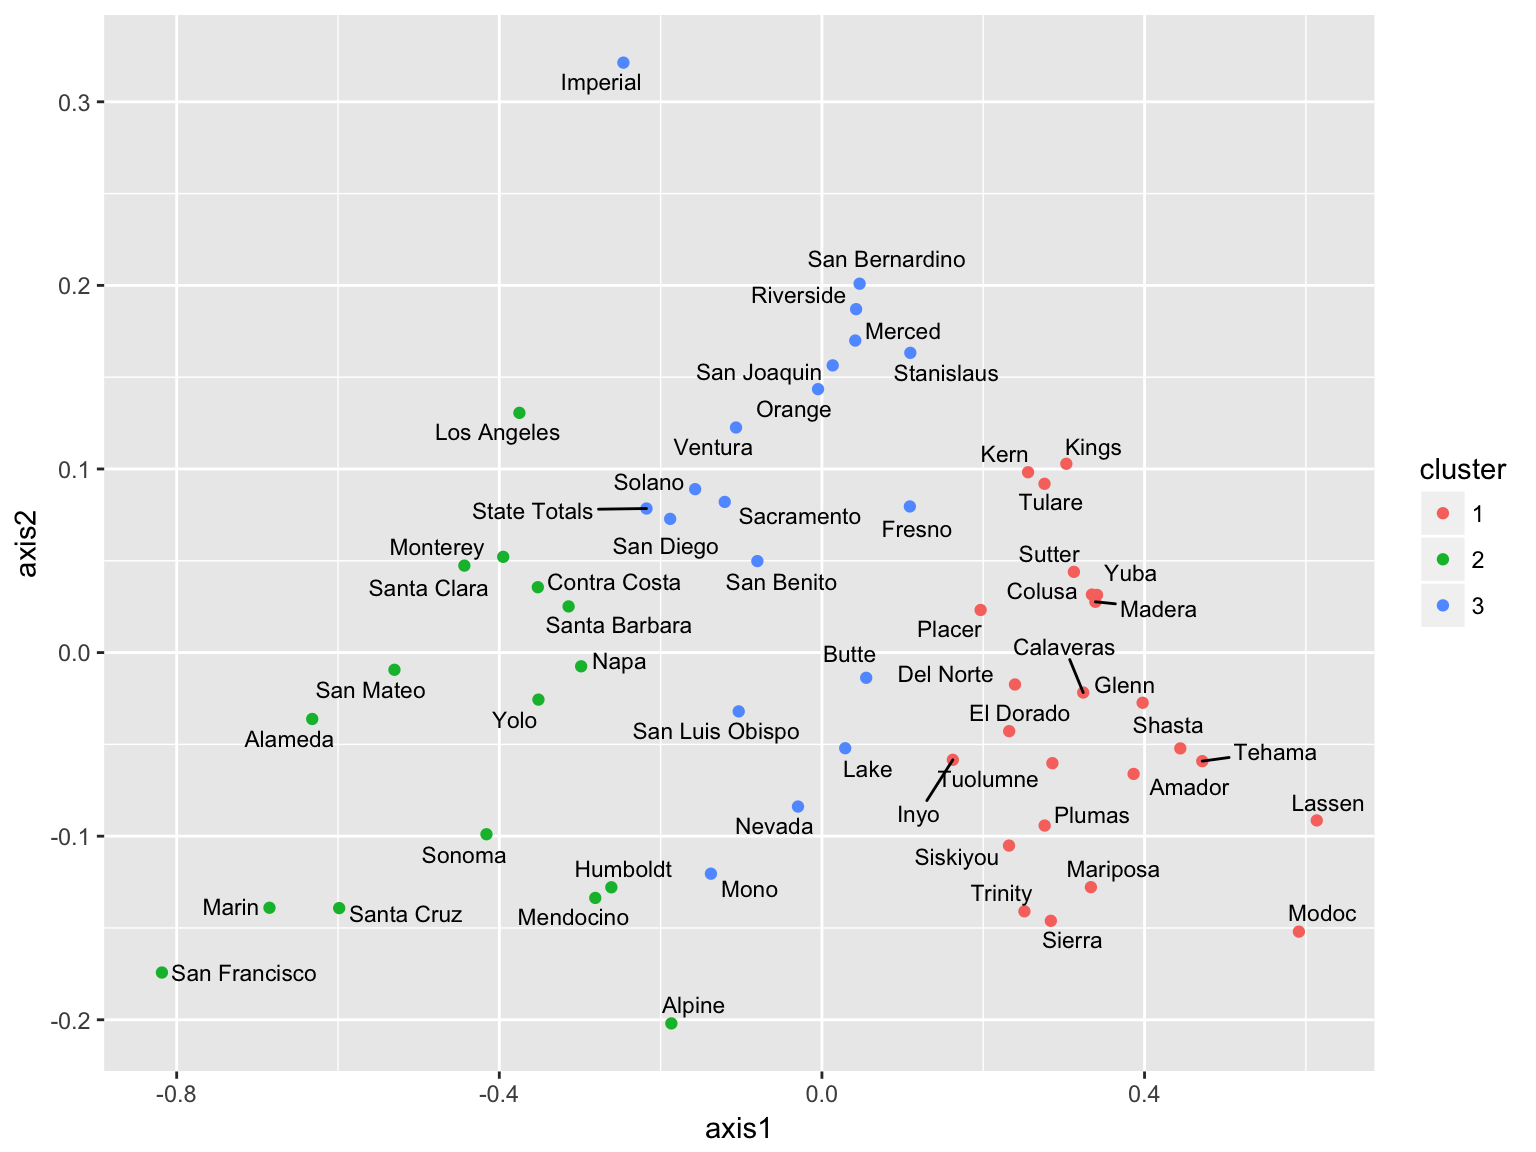
‘geom_text_repel’ is the function from the ggrepel package.