8 Most Common Text Data Wrangling Tasks Quickly Done from UI
In this post, I’m going to walk you through how you can address the following common text data wrangling challenges in Exploratory.
- Extract only numeric values from text
- Remove escaping characters and extra spaces from text
- Detect (or find) specific characters from text
- Replace specific characters with something else
- Recode or Map to pre-defined values
- Split text data into multiple values and count them
- Convert Character to Date data type
- Concatenate (or combine) text values from multiple columns
Sample Data - Unicorn Data
To demonstrate, let’s import our usual Unicorn (startups whose valuations are greater than $1 billions.) data from CB Insights web site.
You can copy and paste the URL and hit ‘Get Data’ button to scrape the table data from the web page.
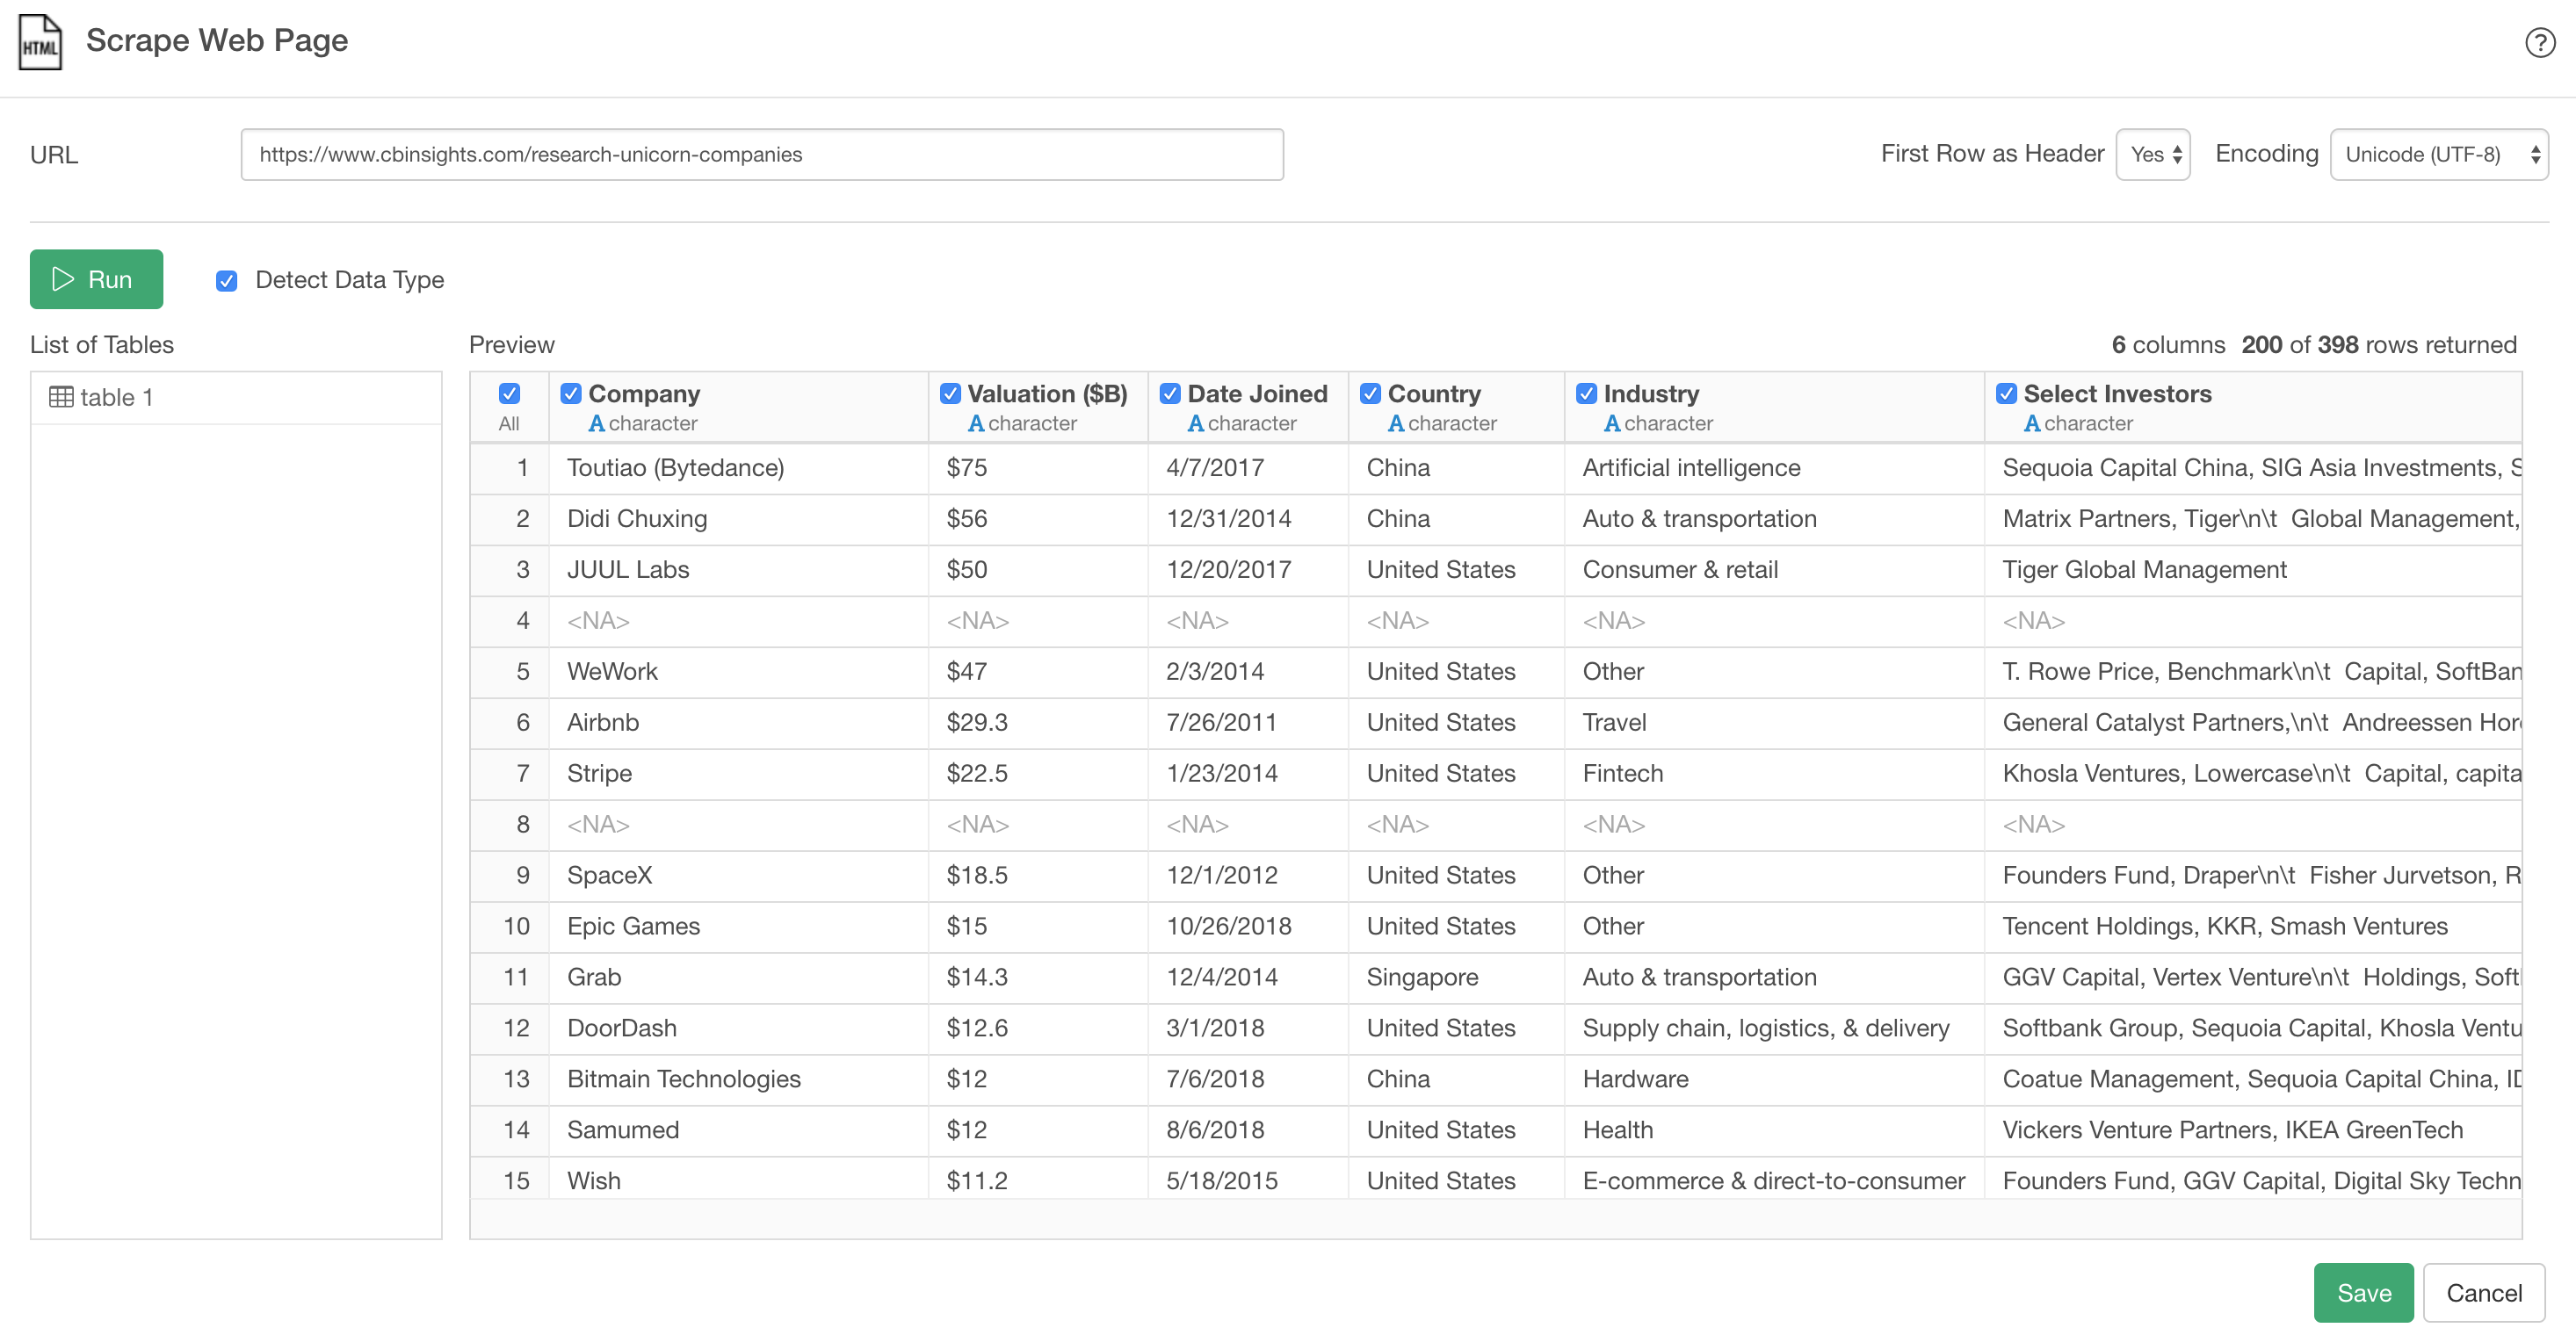
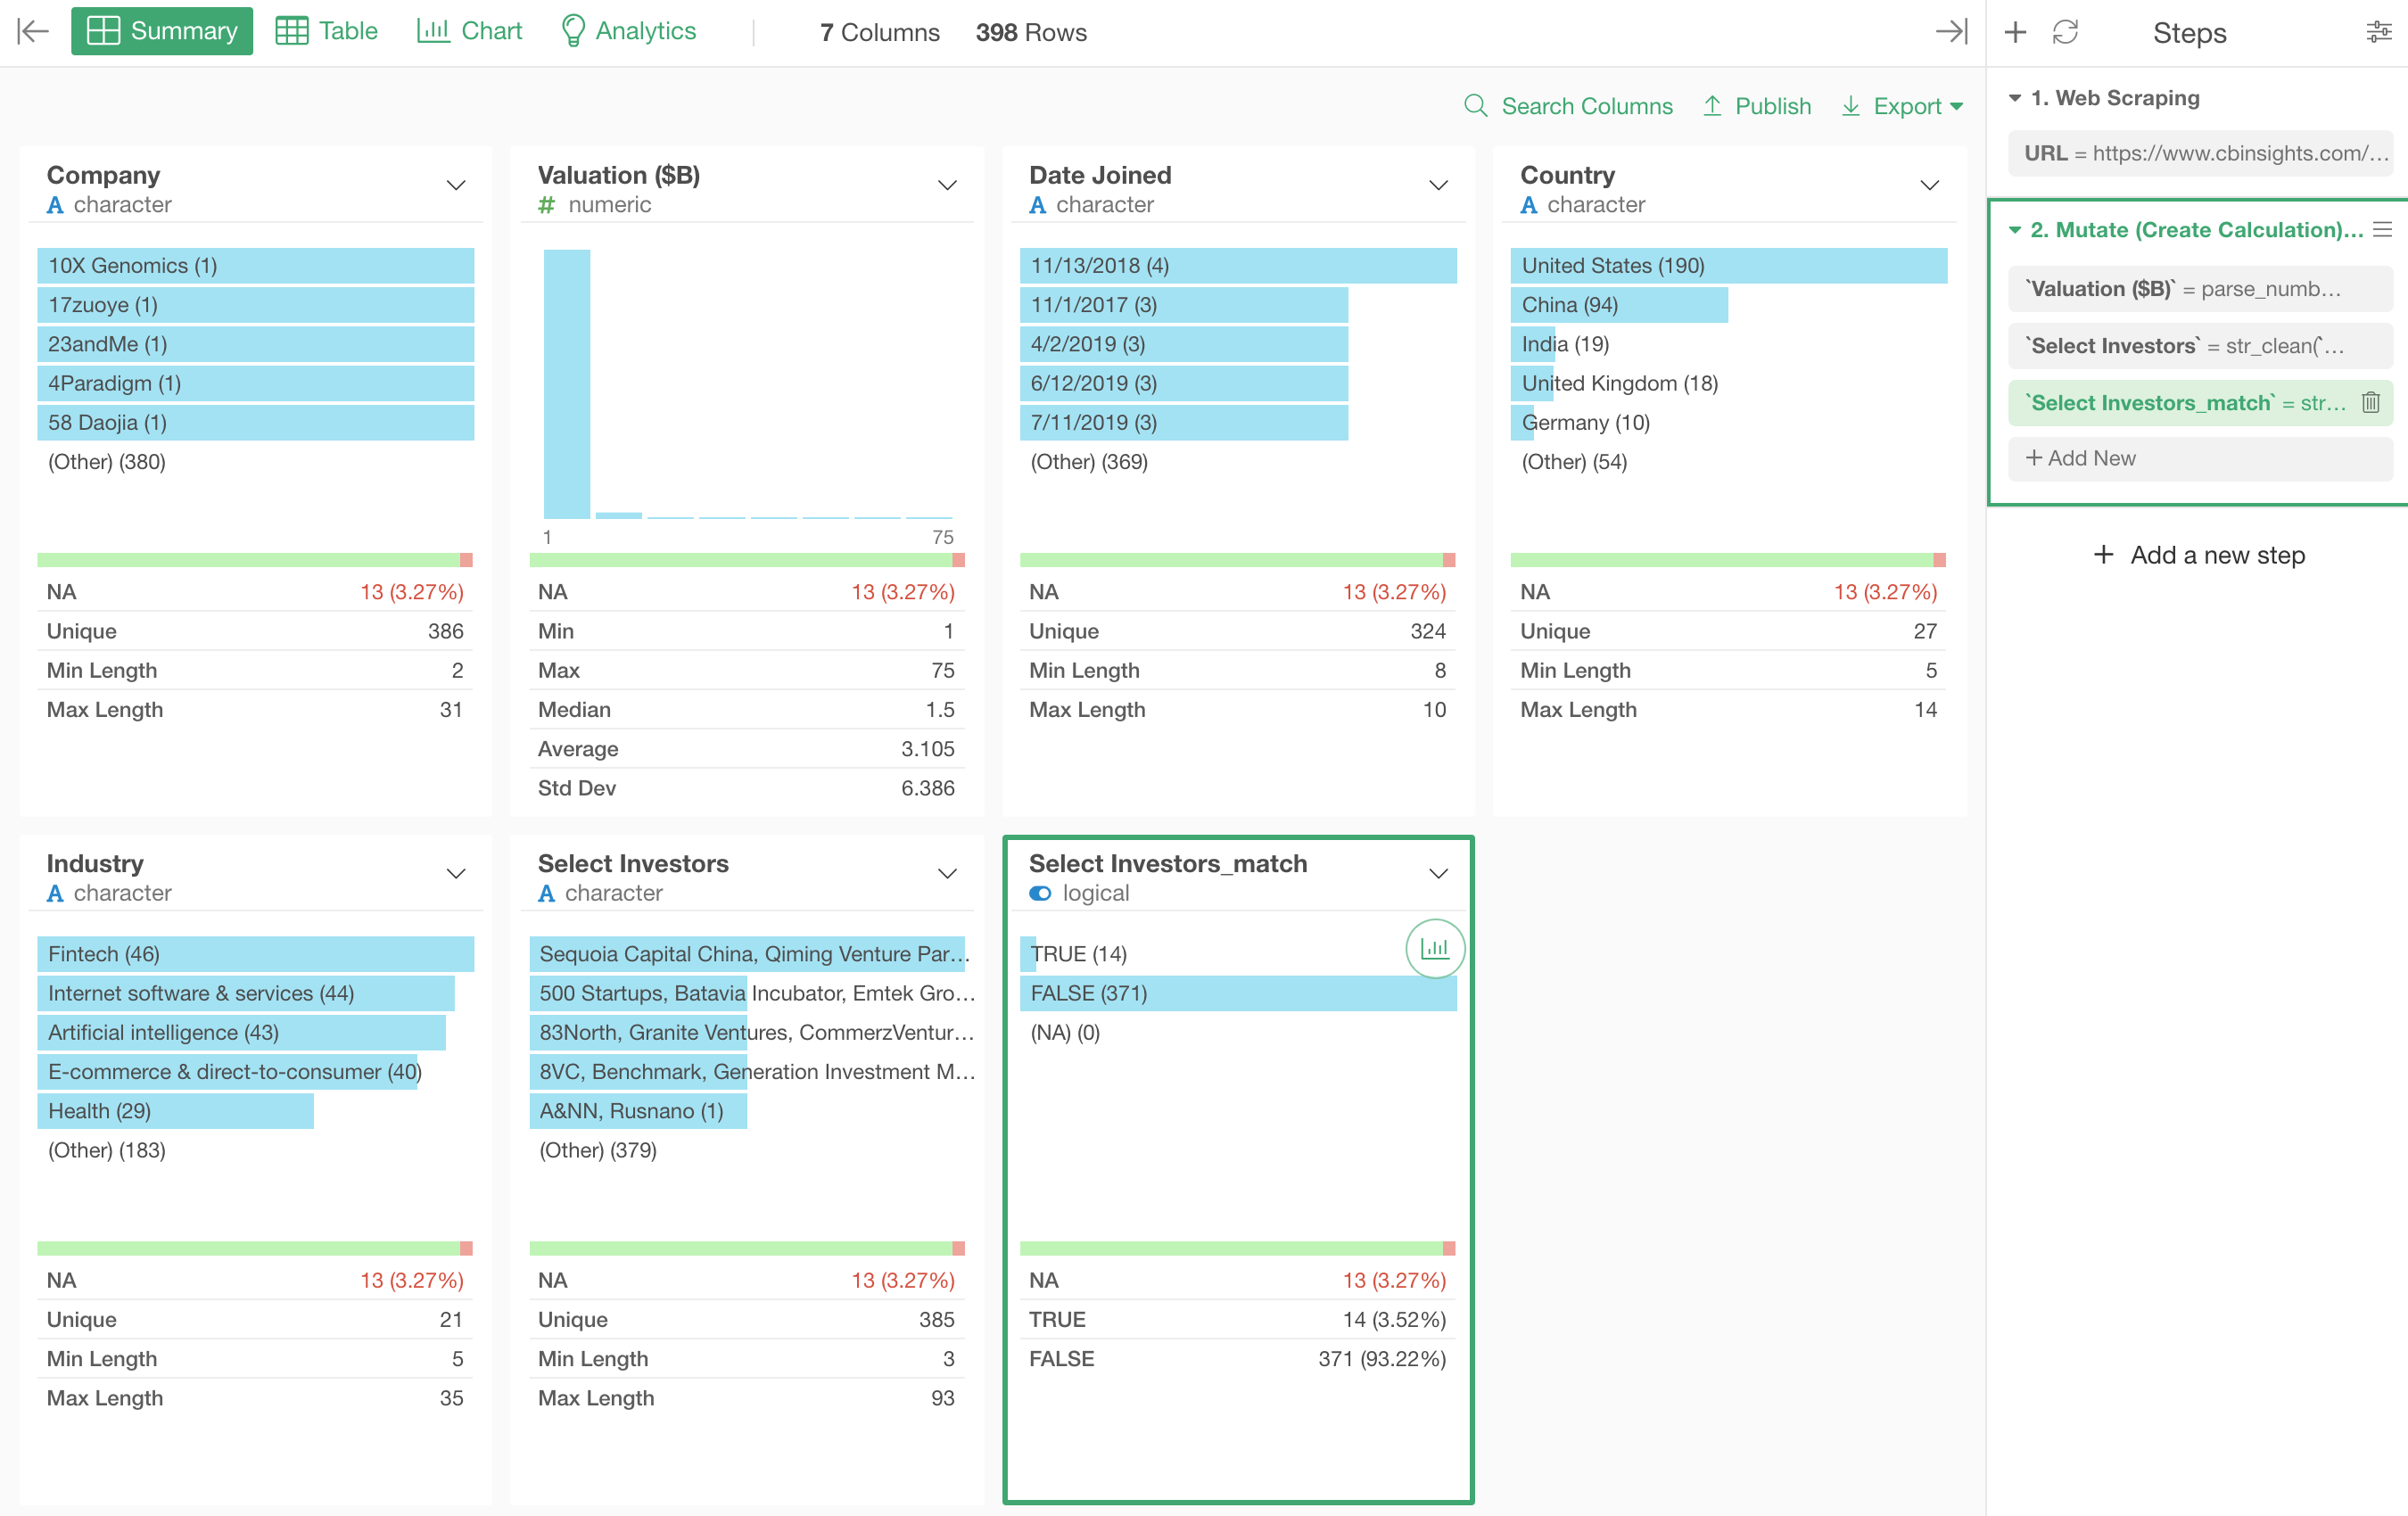
Here is how it looks once the data is imported.

1. Extract only numeric values from text
First, take a look at ‘Valuation ($B)’ column, which is registered as character type.

This is because the currency symbol inside the text has made this column to be the character type in the first place.
This is a column that contains the valuation amounts of the Unicorn startups, and we want to convert it to the numeric data type so that we can treat it as numbers and perform numeric calculations with it.
You can select ‘Convert to Numeric’ from the column header menu.

This will create a ‘mutate’ dialog with the following expression.
extract_numeric(`Valuation ($B)`)
Once you click ‘Run’ button, ‘Valuation ($B)’ column is now converted to numeric data type and it now shows a histogram with numeric statistics.
2. Remove escaping characters and extra spaces
When we go to Table view and look at ‘Select Investors’ column we can see some escaping letters like ‘’ (new line), ‘’ (tab) in the data.
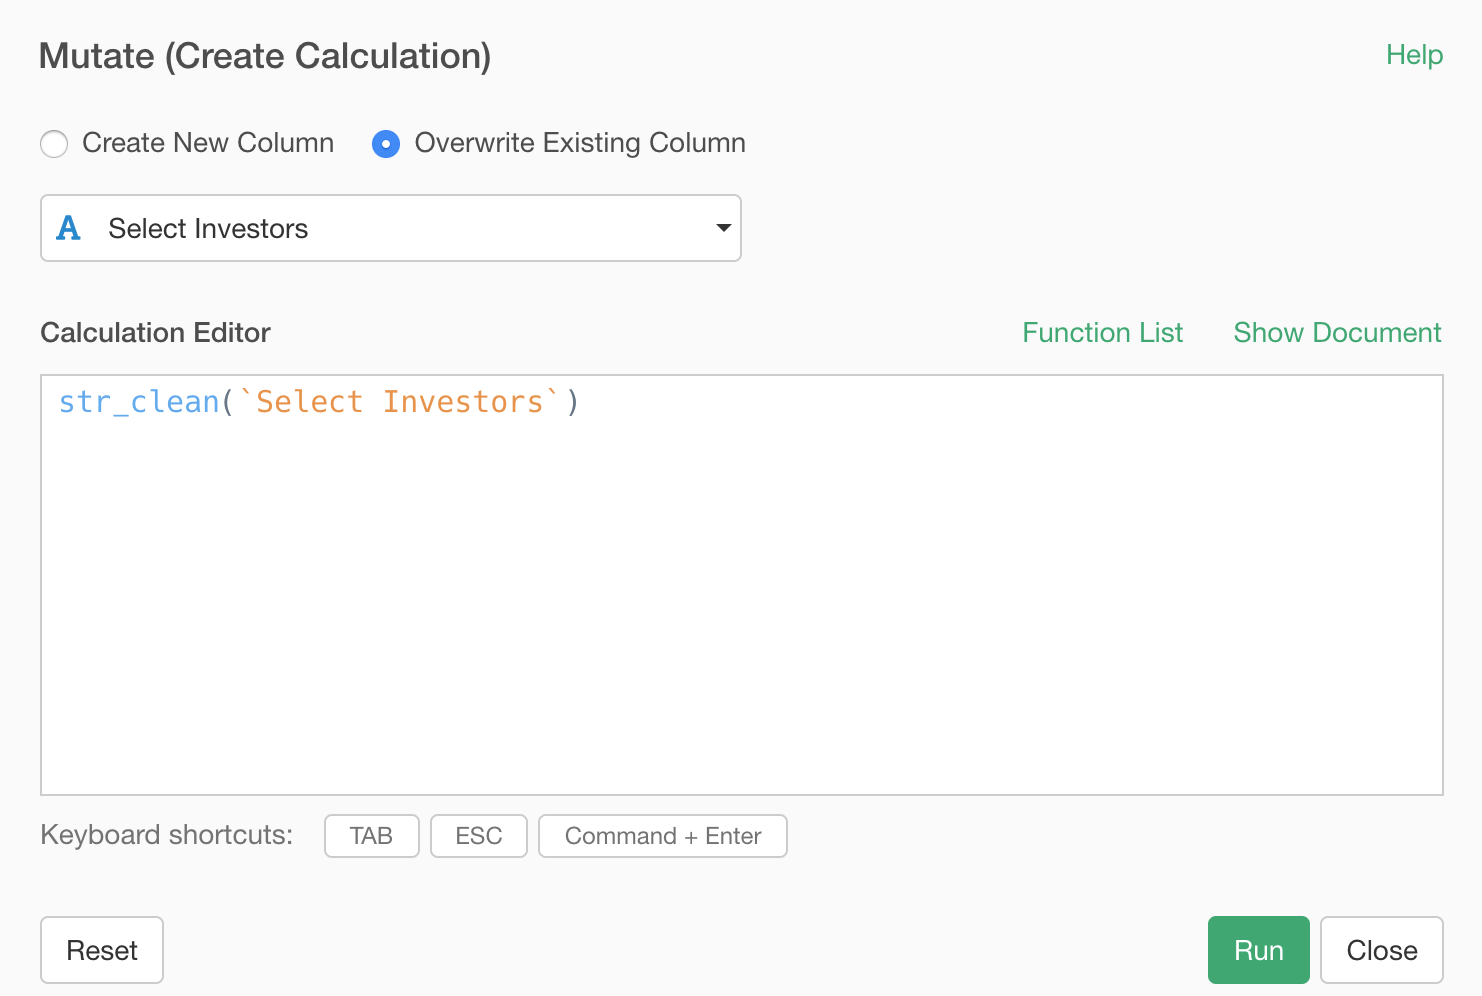
This happens often when we scrape data from web sites. We can quickly clean this up by selecting ‘Clean up Text Data’ from the column header menu.
Menu Path: Work with Text -> Clean up Text Data

This will open Mutate dialog with str_clean function like below.
Once you click ‘Run’ button, you will see that the escaping characters are gone now.
One cool thing about this function is that, not only it removes the escaping characters but also it removes extra spaces when there are two or three spaces between two words.
3. Find some characters or patterns from text
In ‘Select Investors’ column, we can see ‘Andreessen Horowitz’.
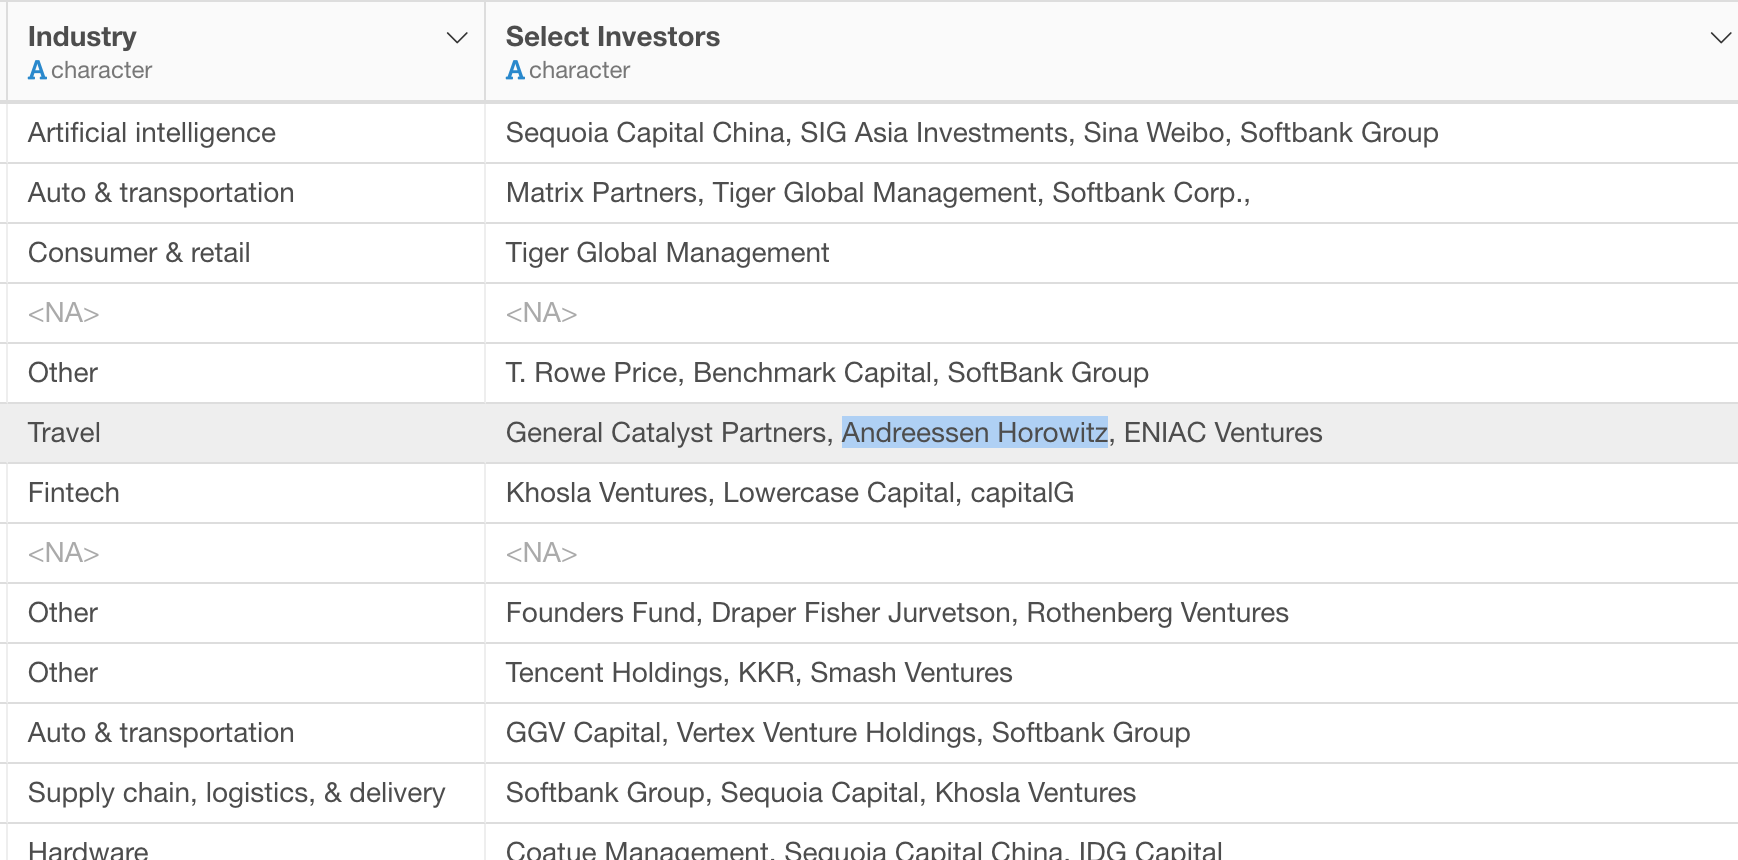
Let’s say we want to find out which Unicorns ‘Andreessen Horowitz’ has invested.
For this, we can use str_detect function, which will evaluate if each row value contains a specified characters or not and return TRUE or FALSE based on the matching.
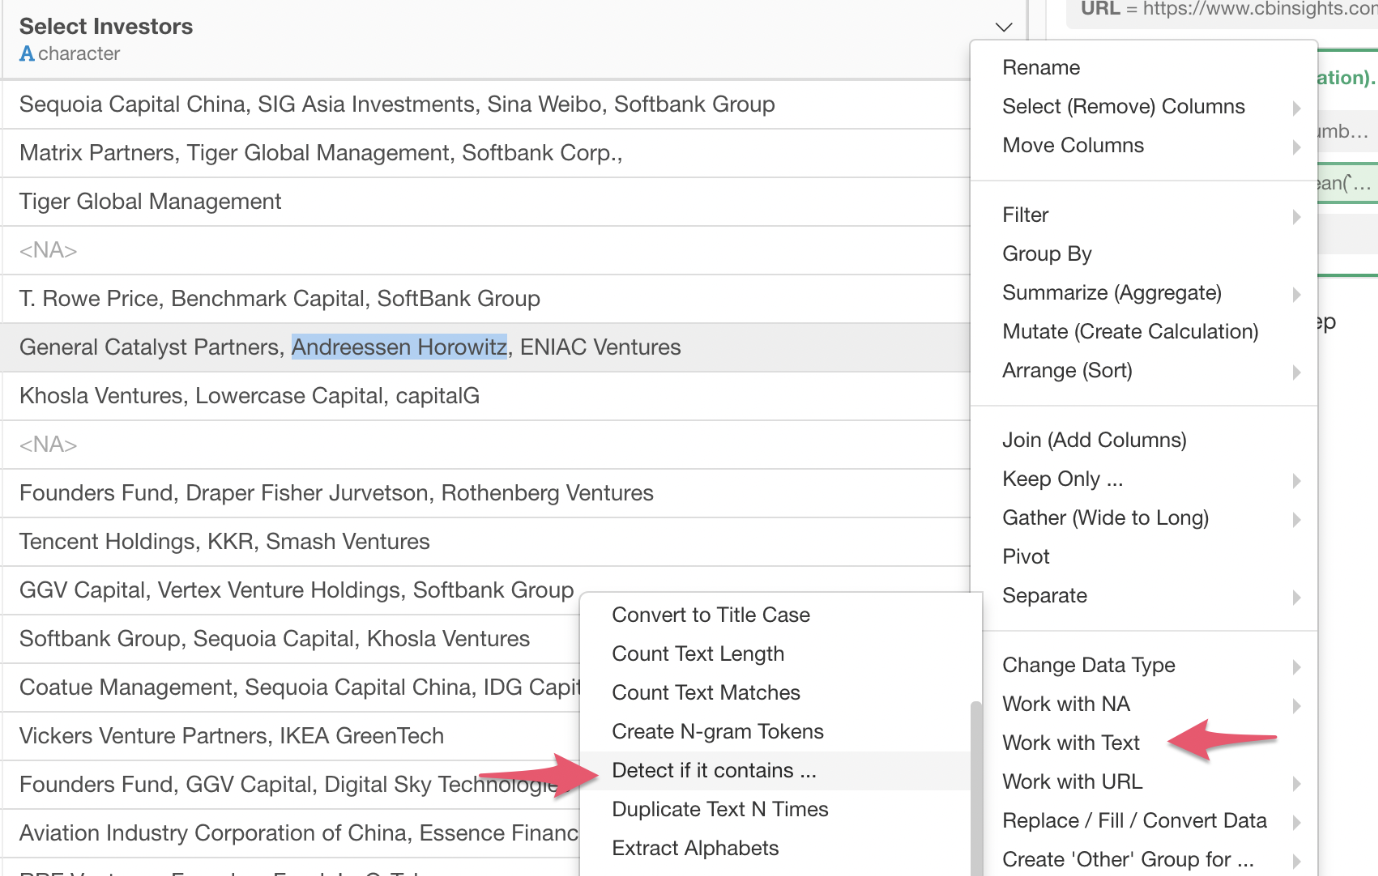
Select Work with Text -> Detect if it contains…
from the column header menu.
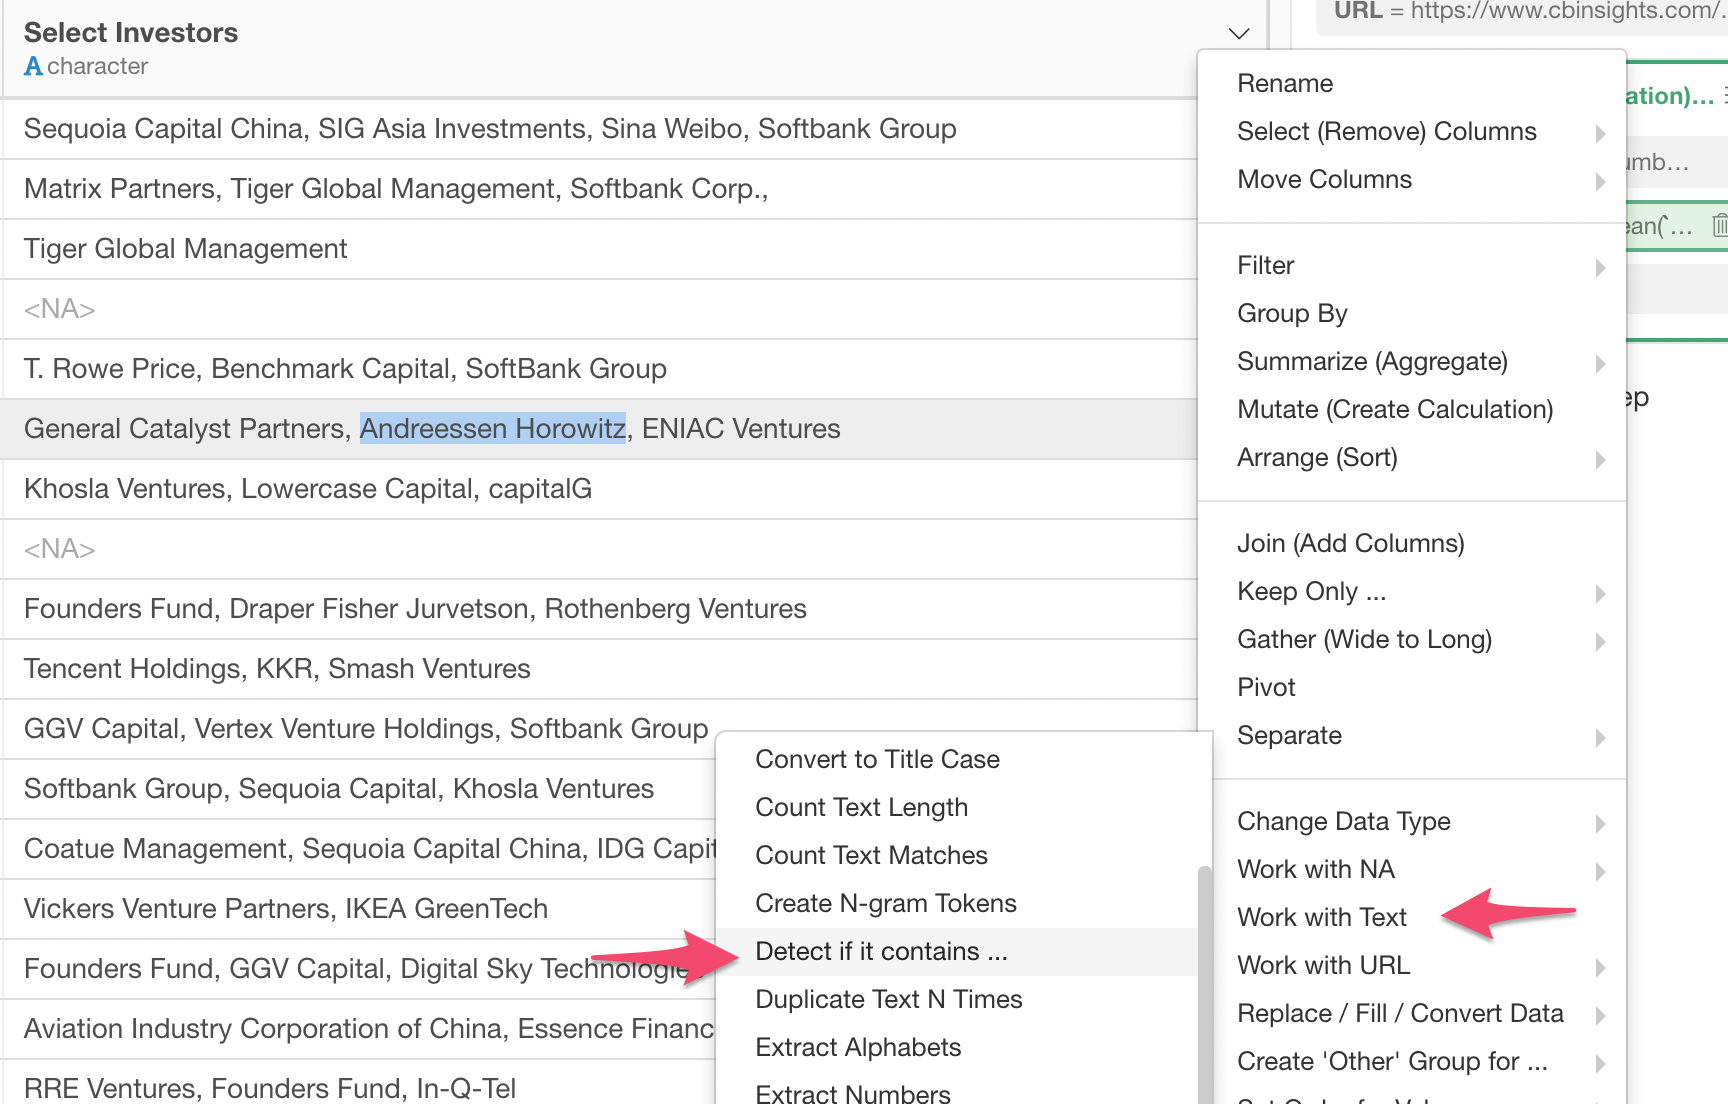
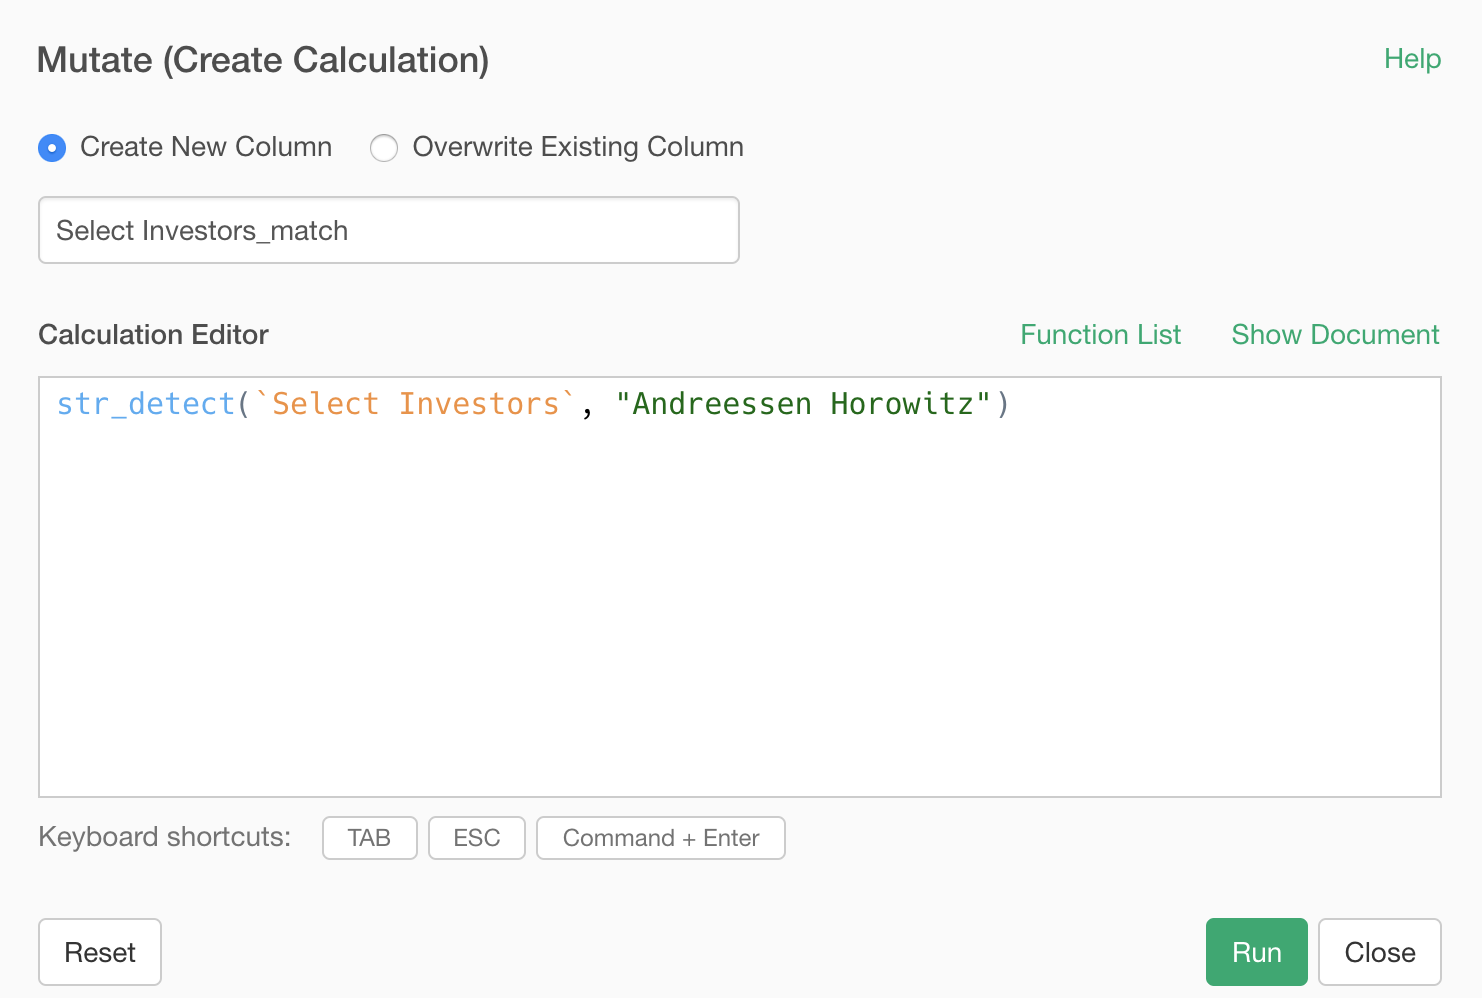
This will open Mutate dialog with ‘str_detect’ function like below.

And you can type ‘Andreessen Horowitz’ inside the double quotes.
This will return TRUE for the rows that include ‘Andreessen Horowitz’.
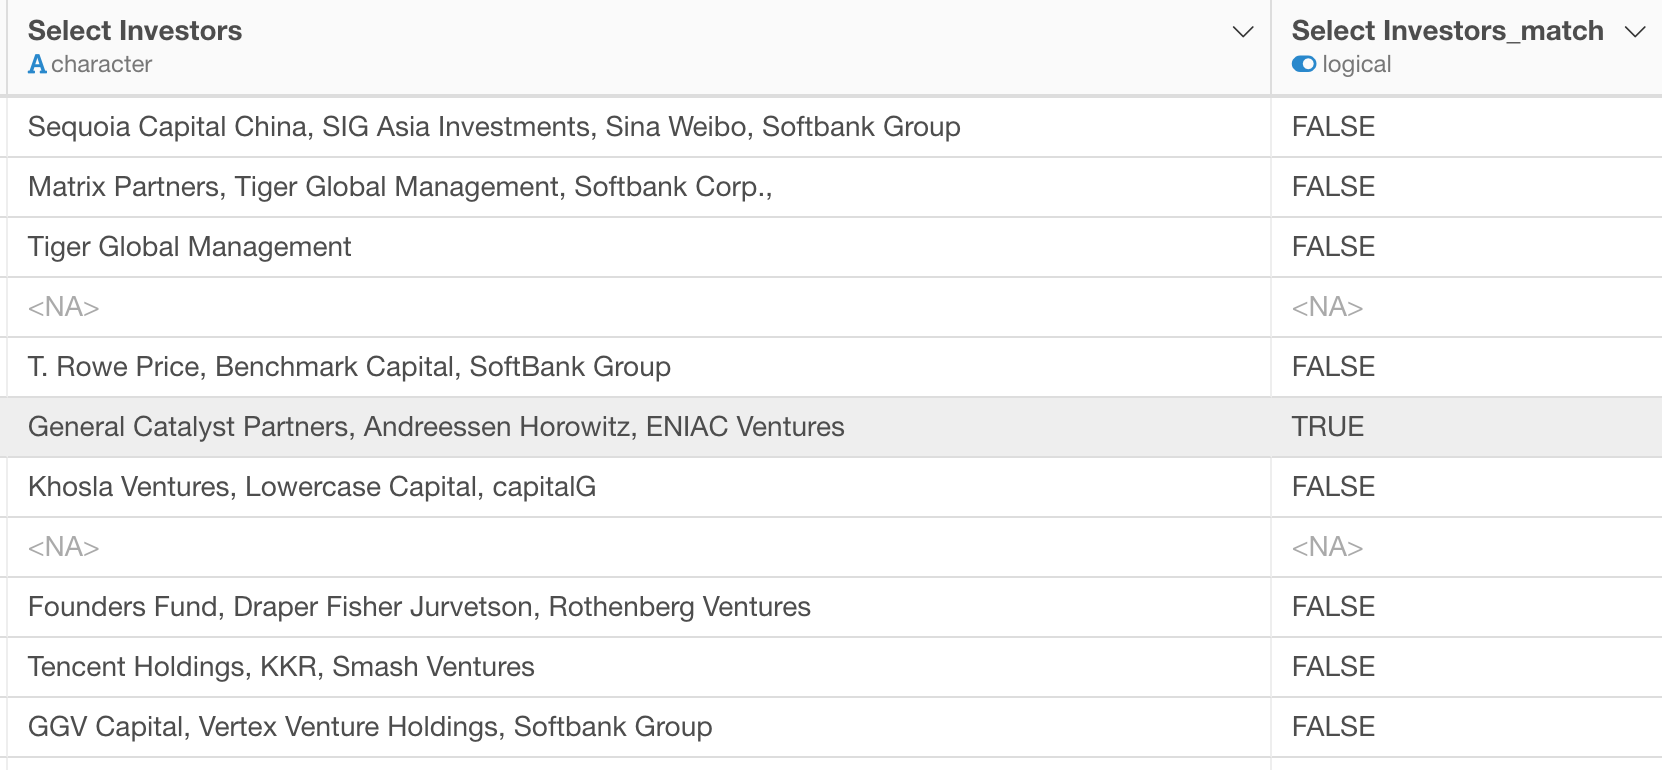
We can go to Summary view to see that it has invested in 14 Unicorn startups, which is 3.52% of the total number of the Unicorns. (as of 9/4/2019)
4. Replace some characters or patterns with something else
By the way, the ‘Andreessen Horowitz’ is a venture capital firm that was started by two legedaries in Silicon Valley who created a few tech comapanies including Netscape, LoudCloud.
Anyway, they are also known as A16Z so let’s say we want to change the value to ‘A16Z’.
Select Work with Text -> Replace Text
from the column header menu.
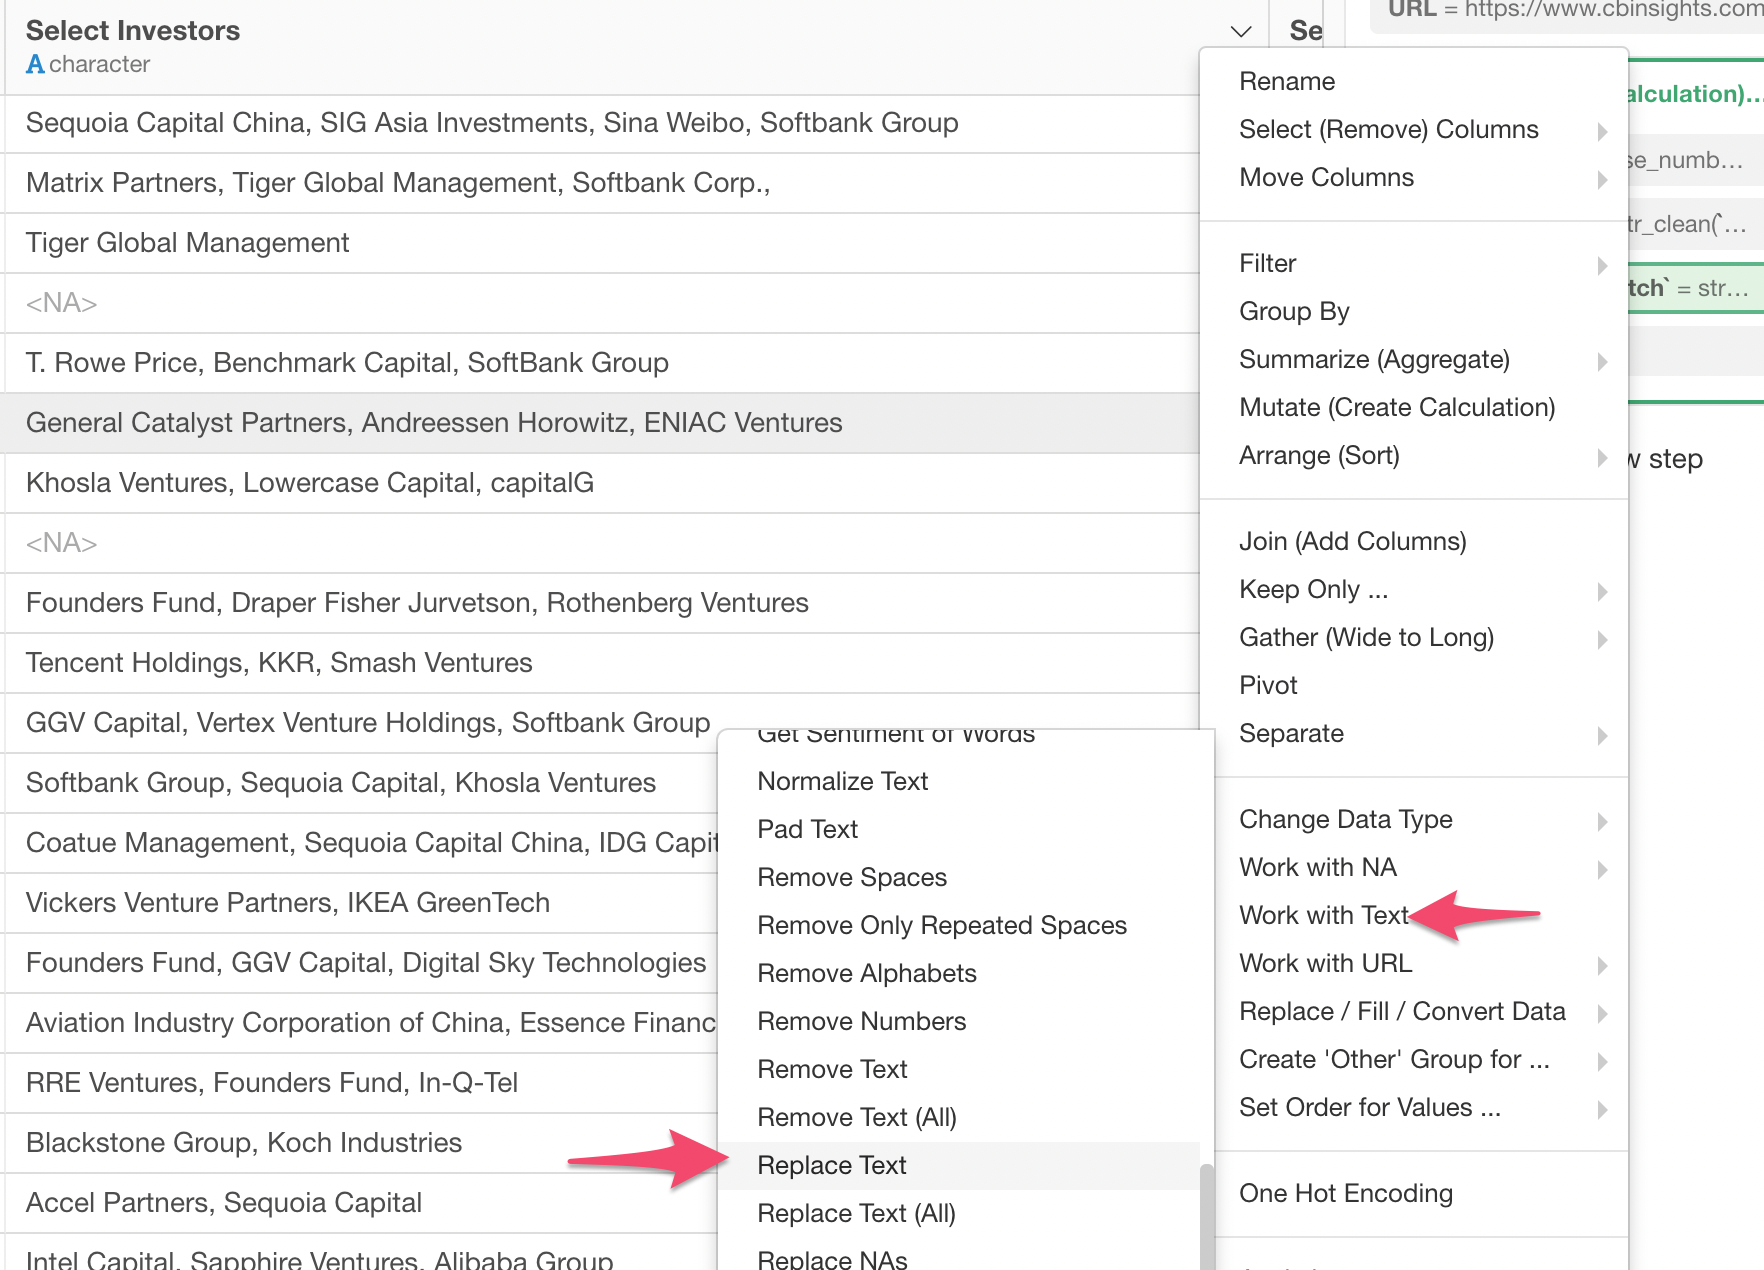
This will open the Mutate dialog with the str_replace function.

You can type the characters to be replaced and the characters to replace.

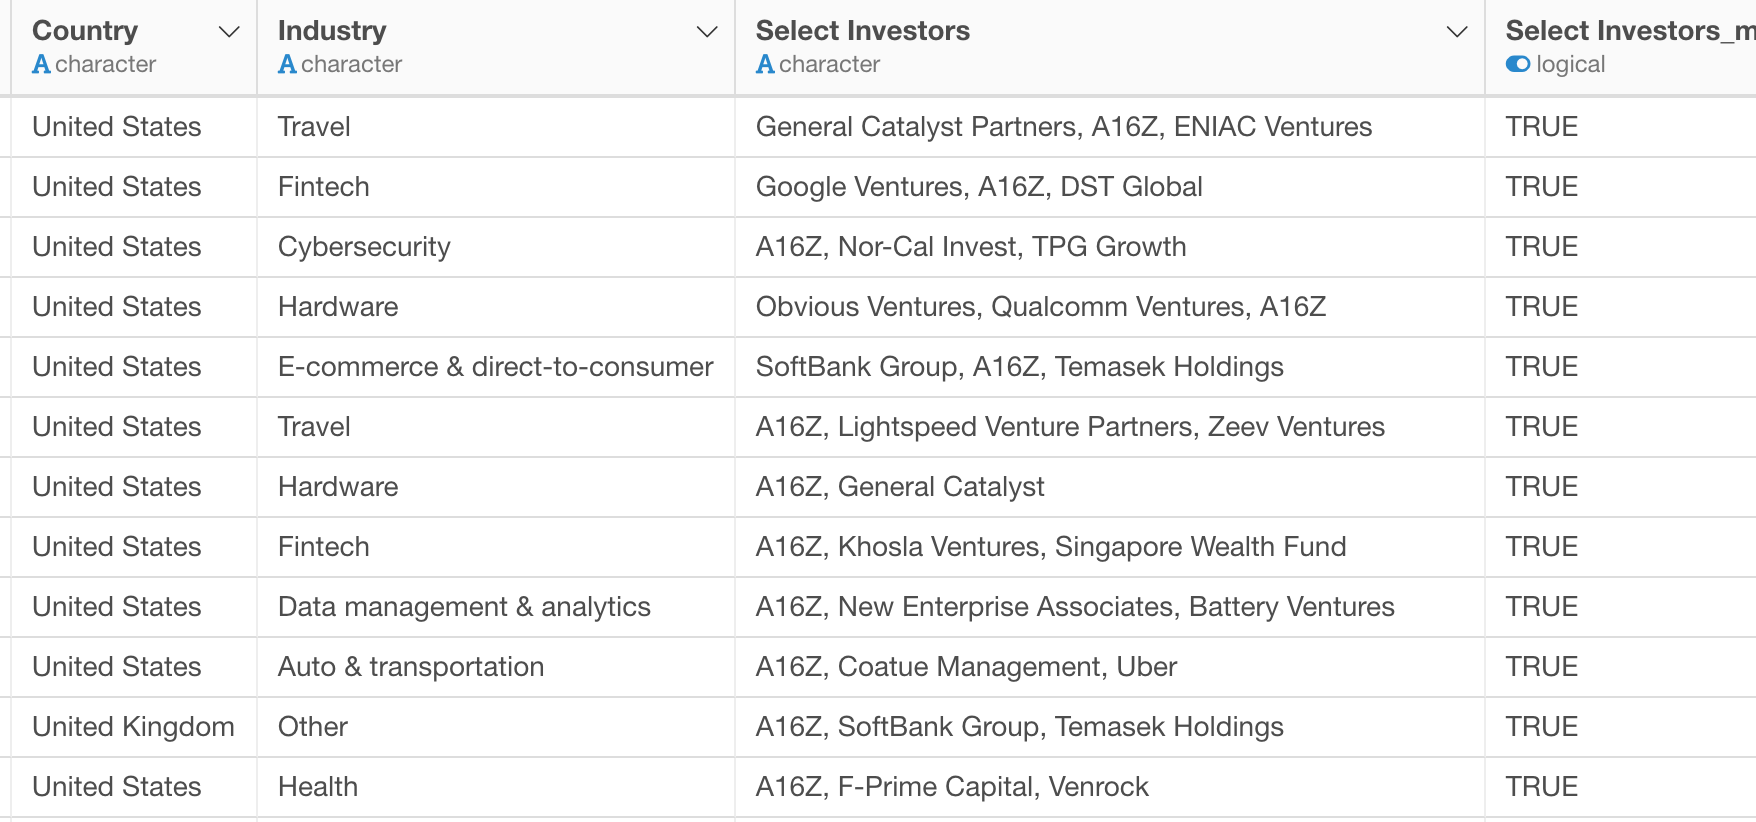
Once you click ‘Run’ button you will see all the “Andreessen Horowitz” entries are not replaced as “A16Z”.
5. Replace the whole value with something else
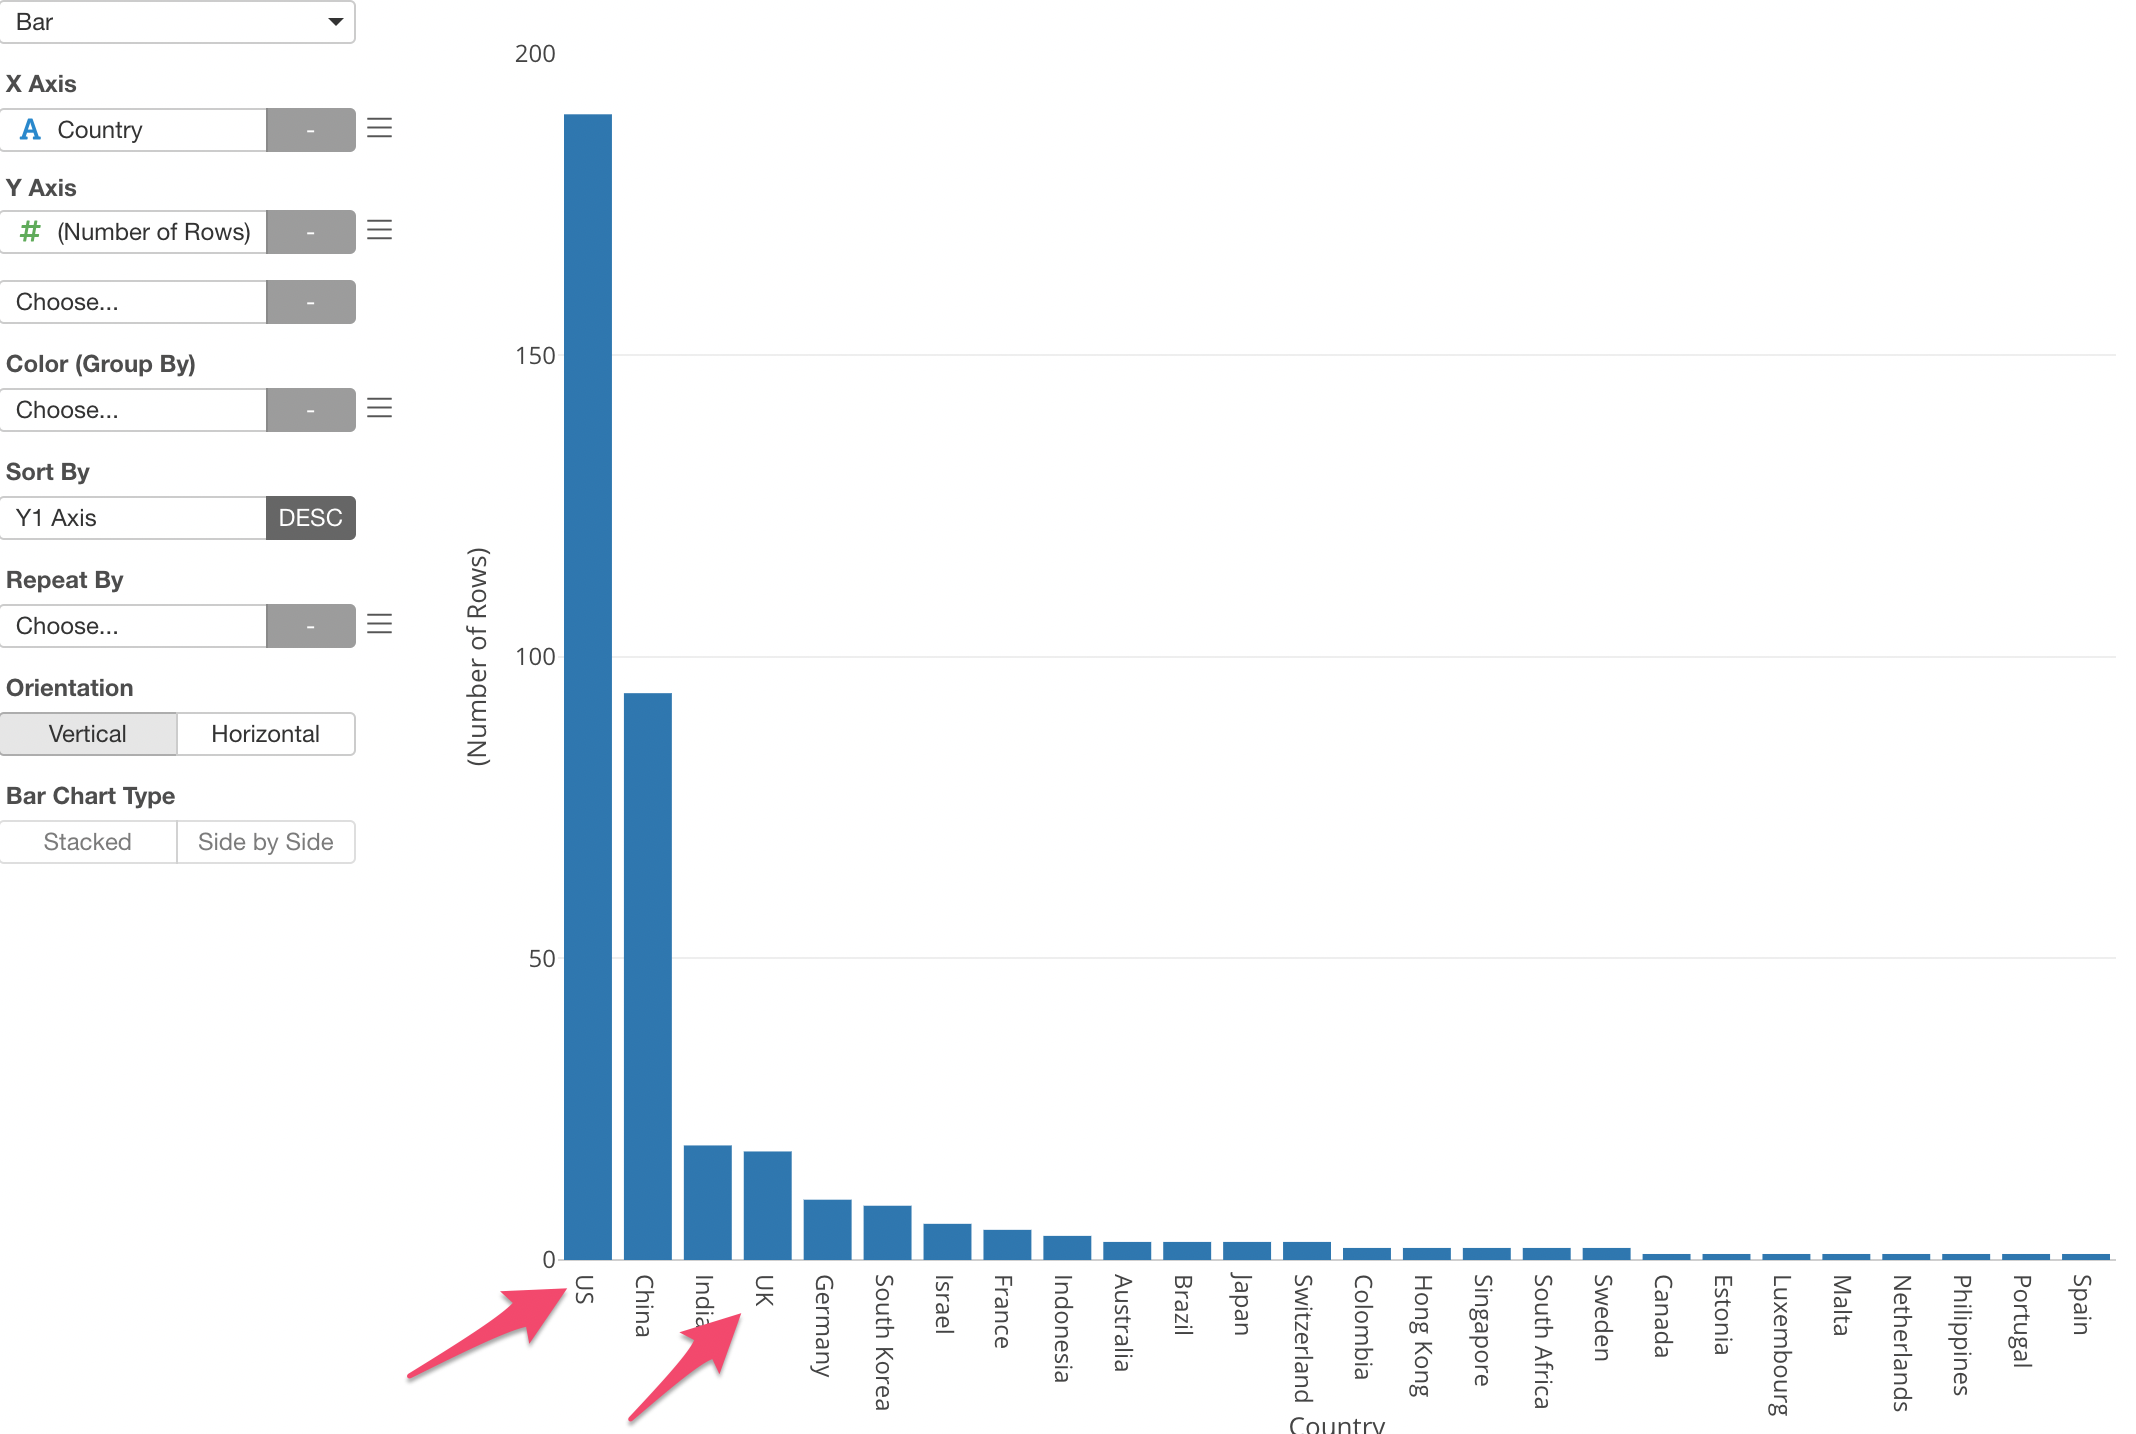
Here is a chart that shows the number of Unicorns by country.

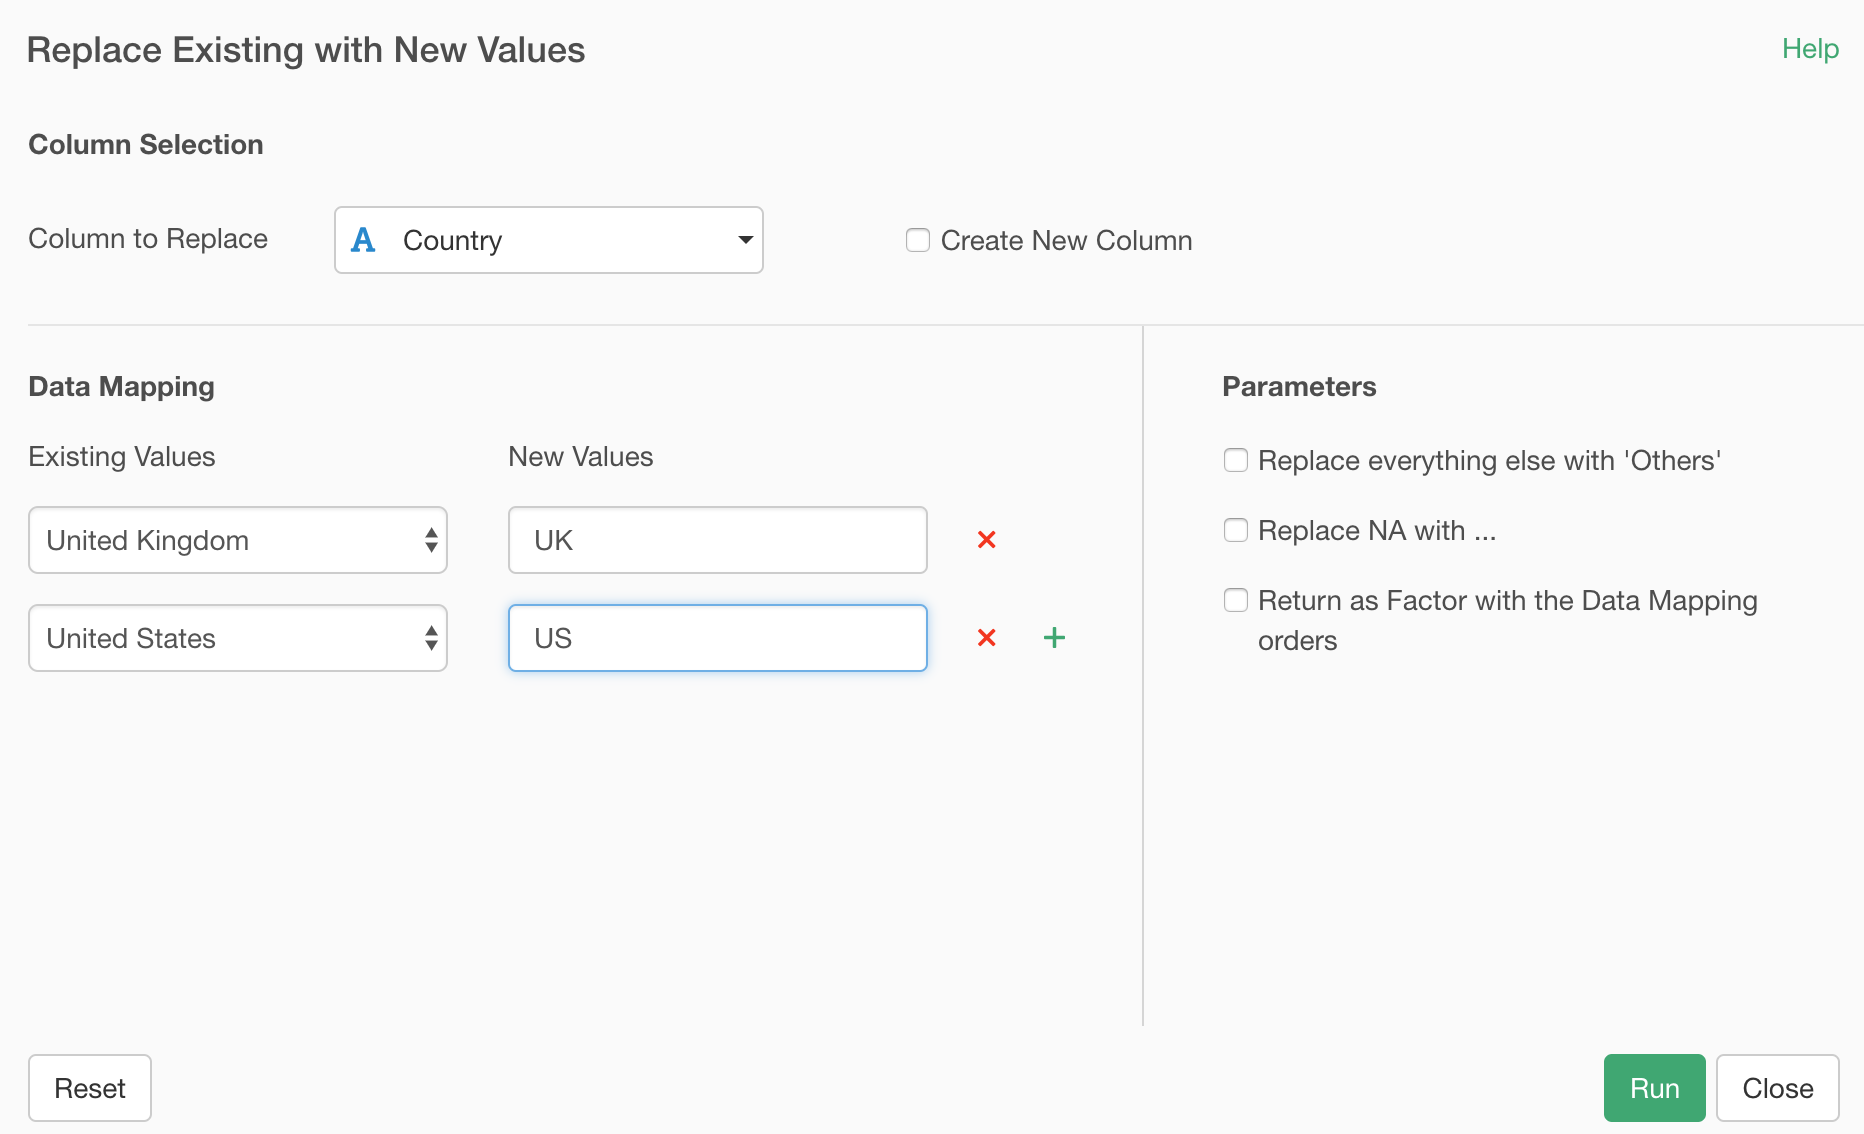
Now let’s say we want the following two countries name to be something shorter.
- United Kingdom -> UK
- United States -> US
We can use ‘Recode’ command step to do this.
Select Replace / Fill / Convert Data -> Replace Existing with New Values
from the column header menu.

This will open the ‘Recode’ dialog where you can define a rule for the replacements.
Once you click ‘Run’ button, we can see them being updated in the chart.
6. Split a list of values to multiple rows
Look at ‘Select Investors’ column. We can see that multiple investors are listed for each row and they are separated by comma.

Let’s say we want to count how many Unicorns each investor has invested.
If we can break apart the list of the investors and bring each investor into its own row it will be much easier to count them.
You can do this by using ‘Seperate to Rows’ command.
Select Separate -> Separate to Rows by -> Comma
from the column header menu.

This will open ‘Separate Rows’ dialog.
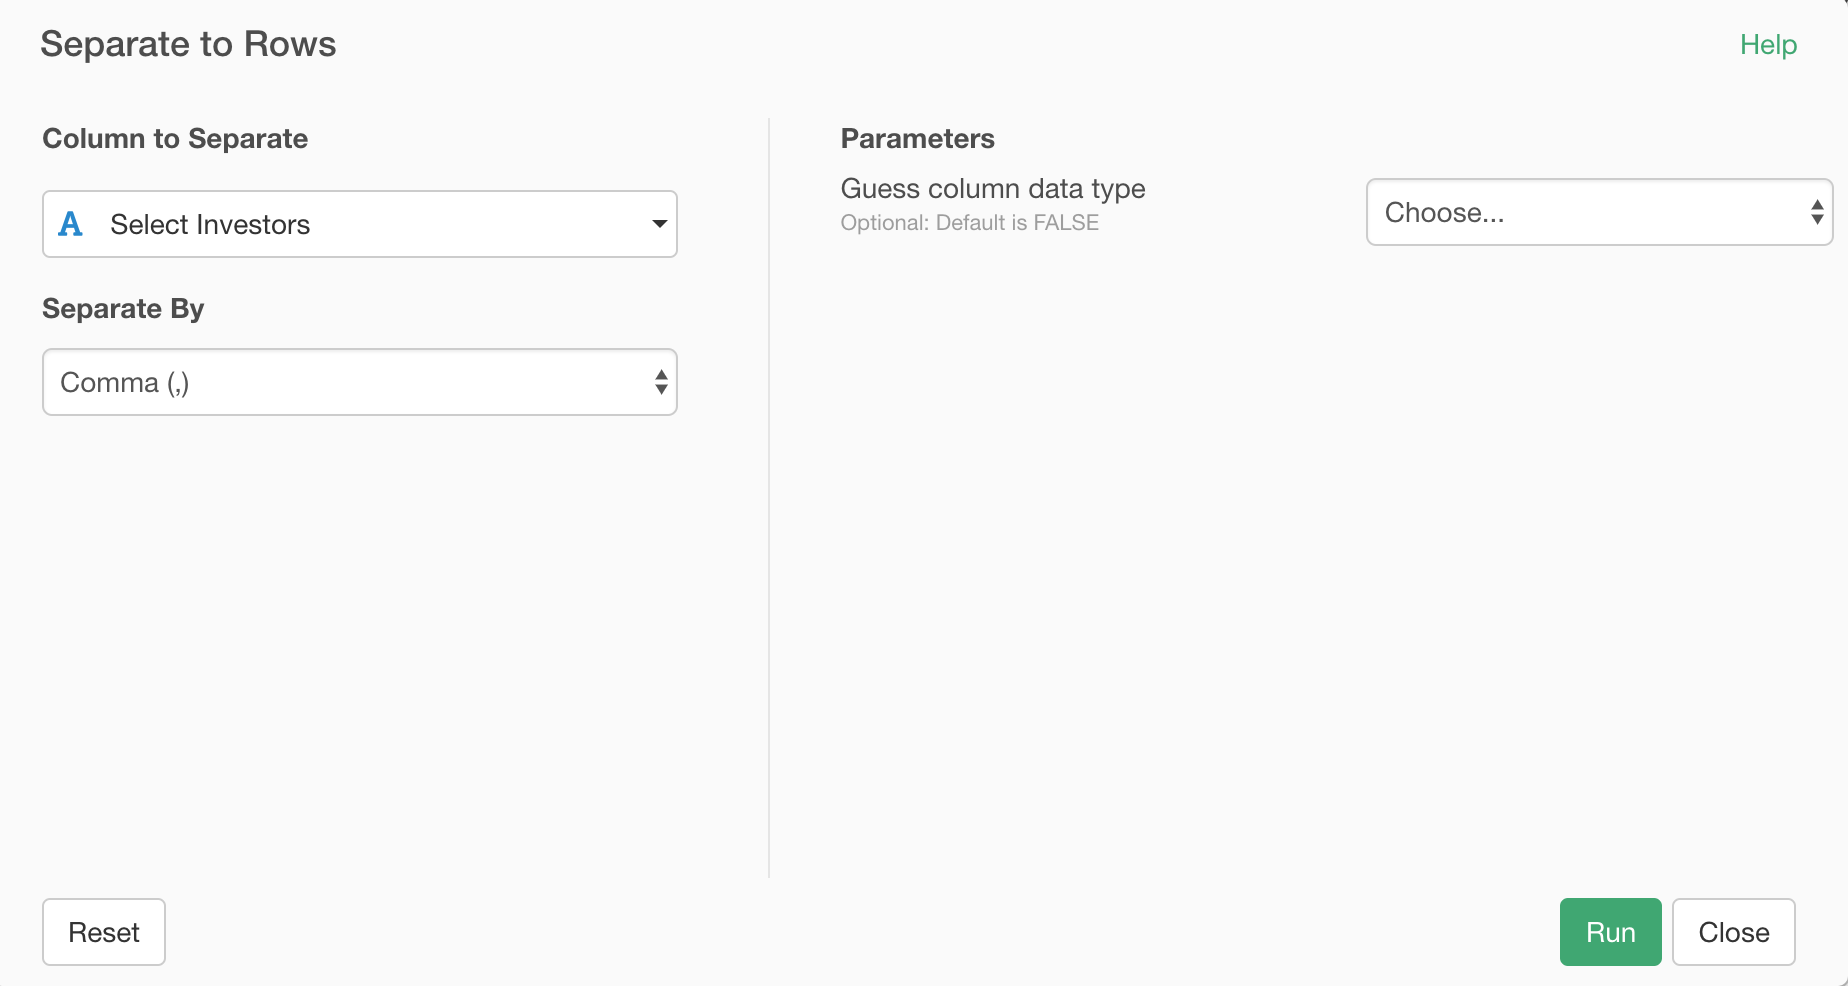
Accept the default and click ‘Run’ button. You will see each investor name is now independently presented in each row.

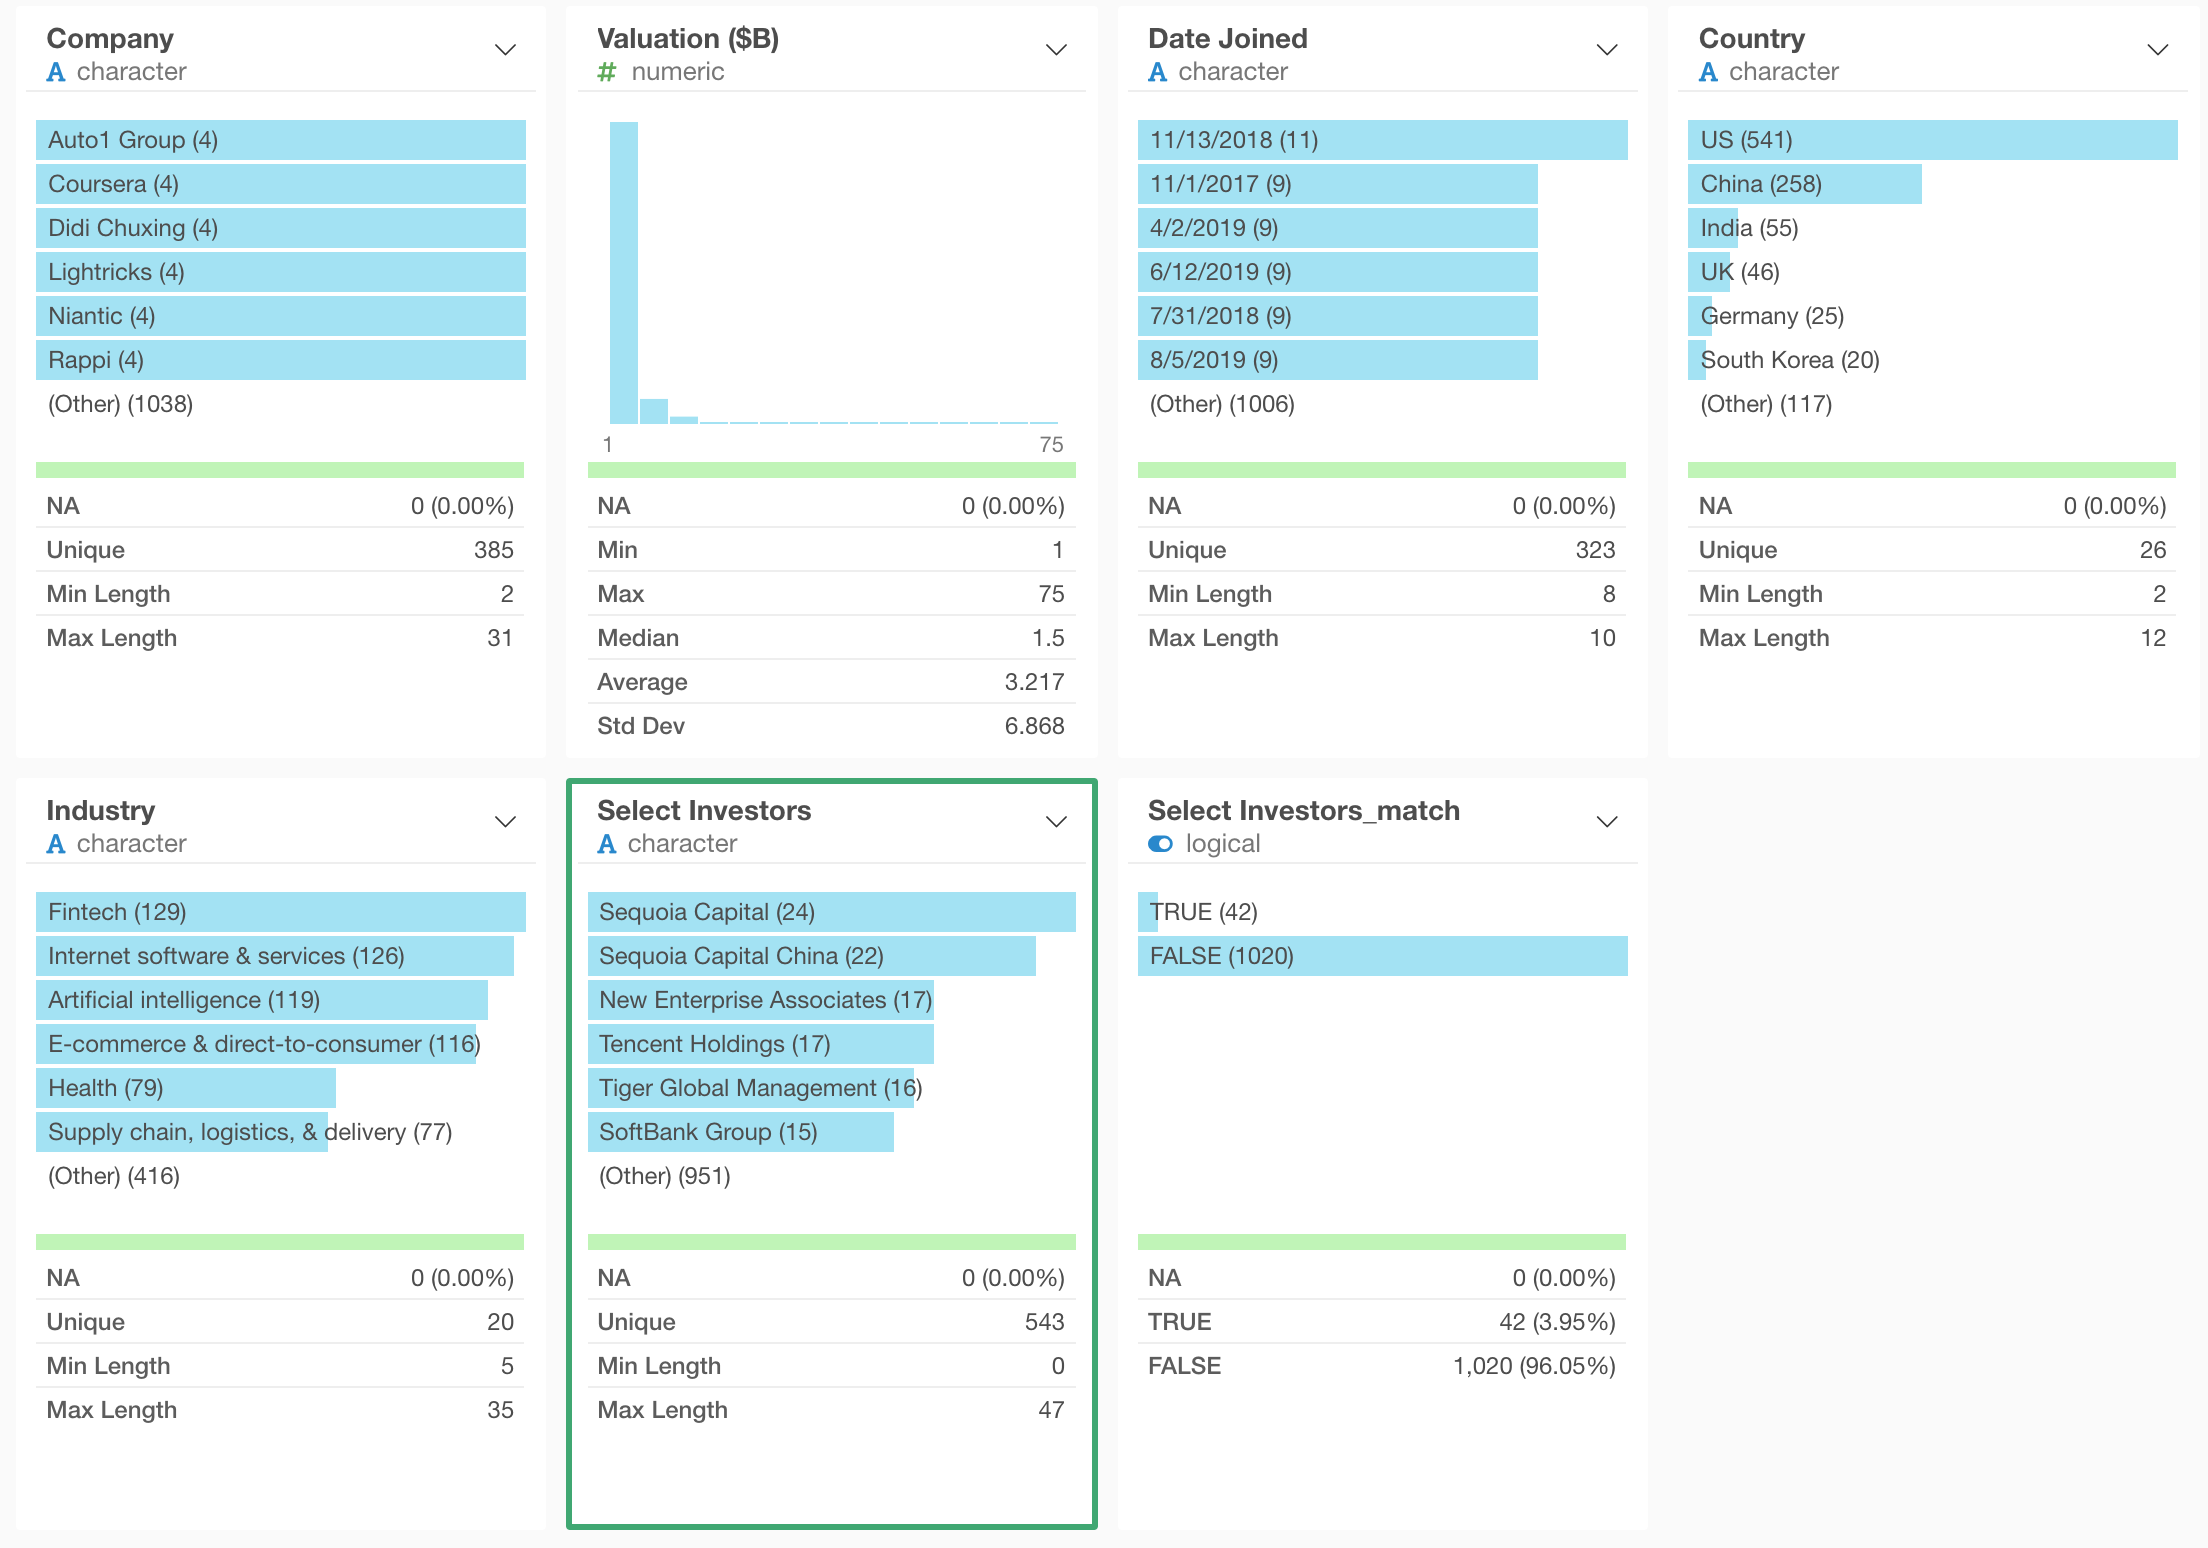
Now, when you go to Summary view you can see who are the top investors quickly.
7. Convert Character Column to Date/Time Data Type
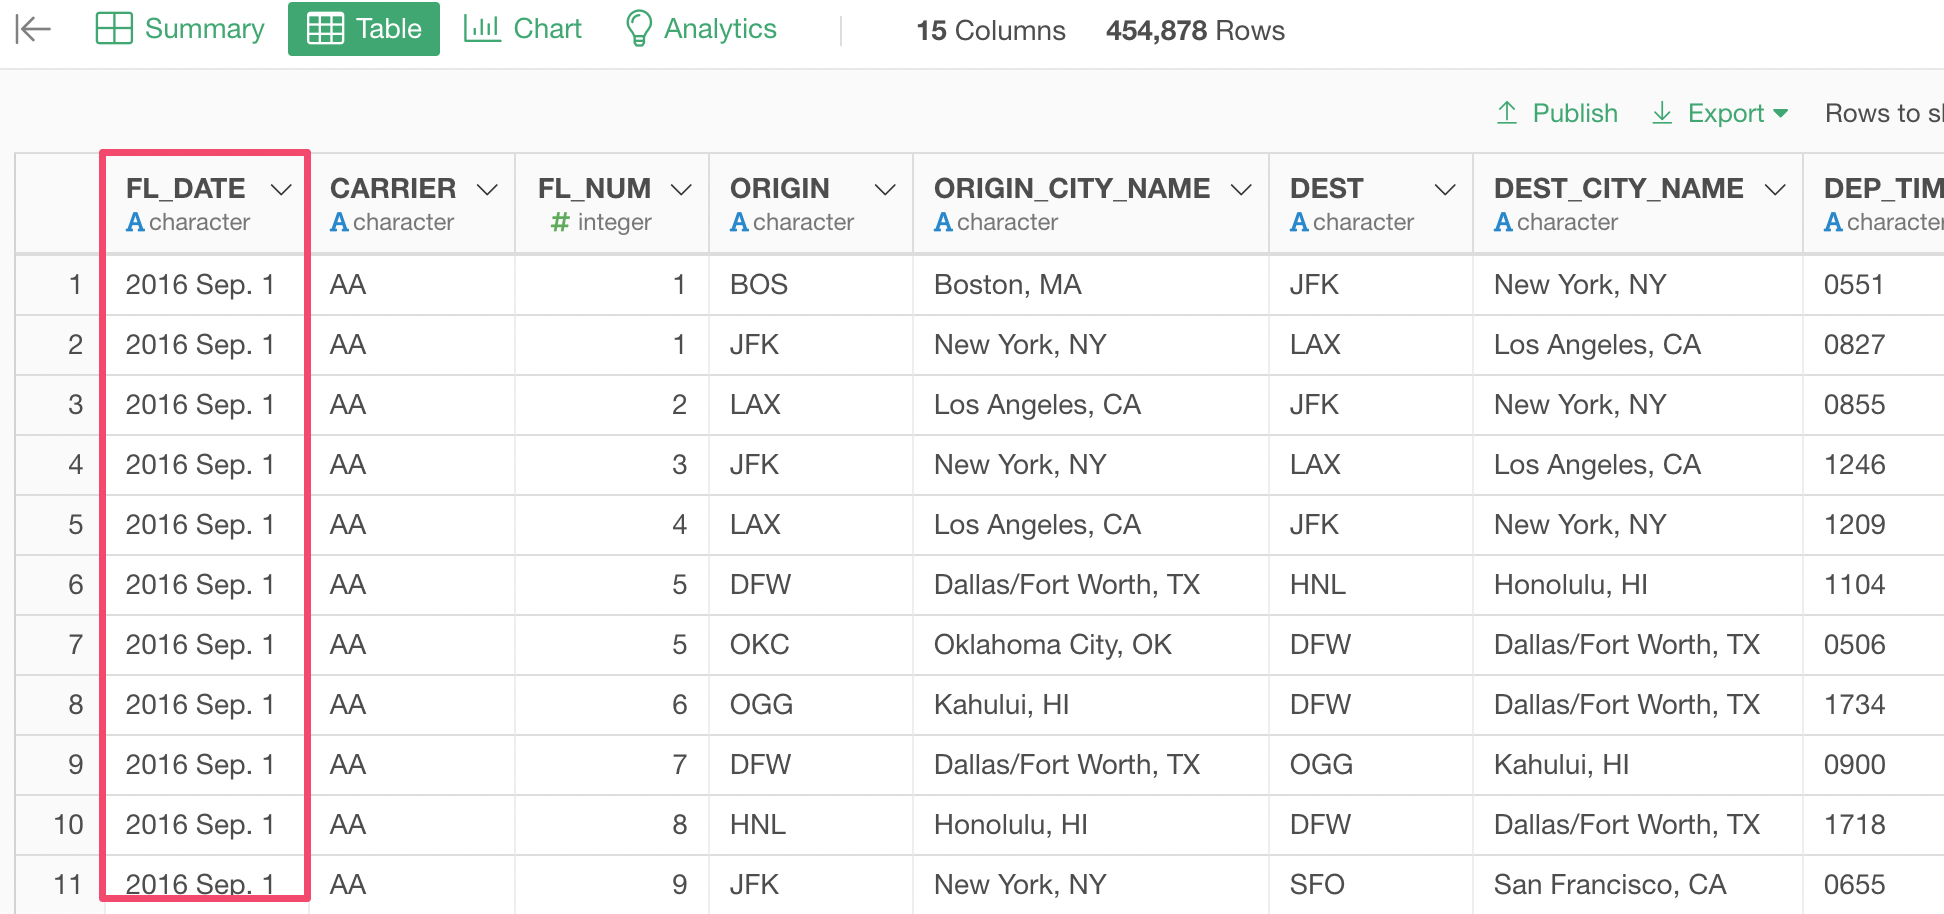
Let’s change the data to ‘Flight Delay’ data for this topic.
You can download the data from here.
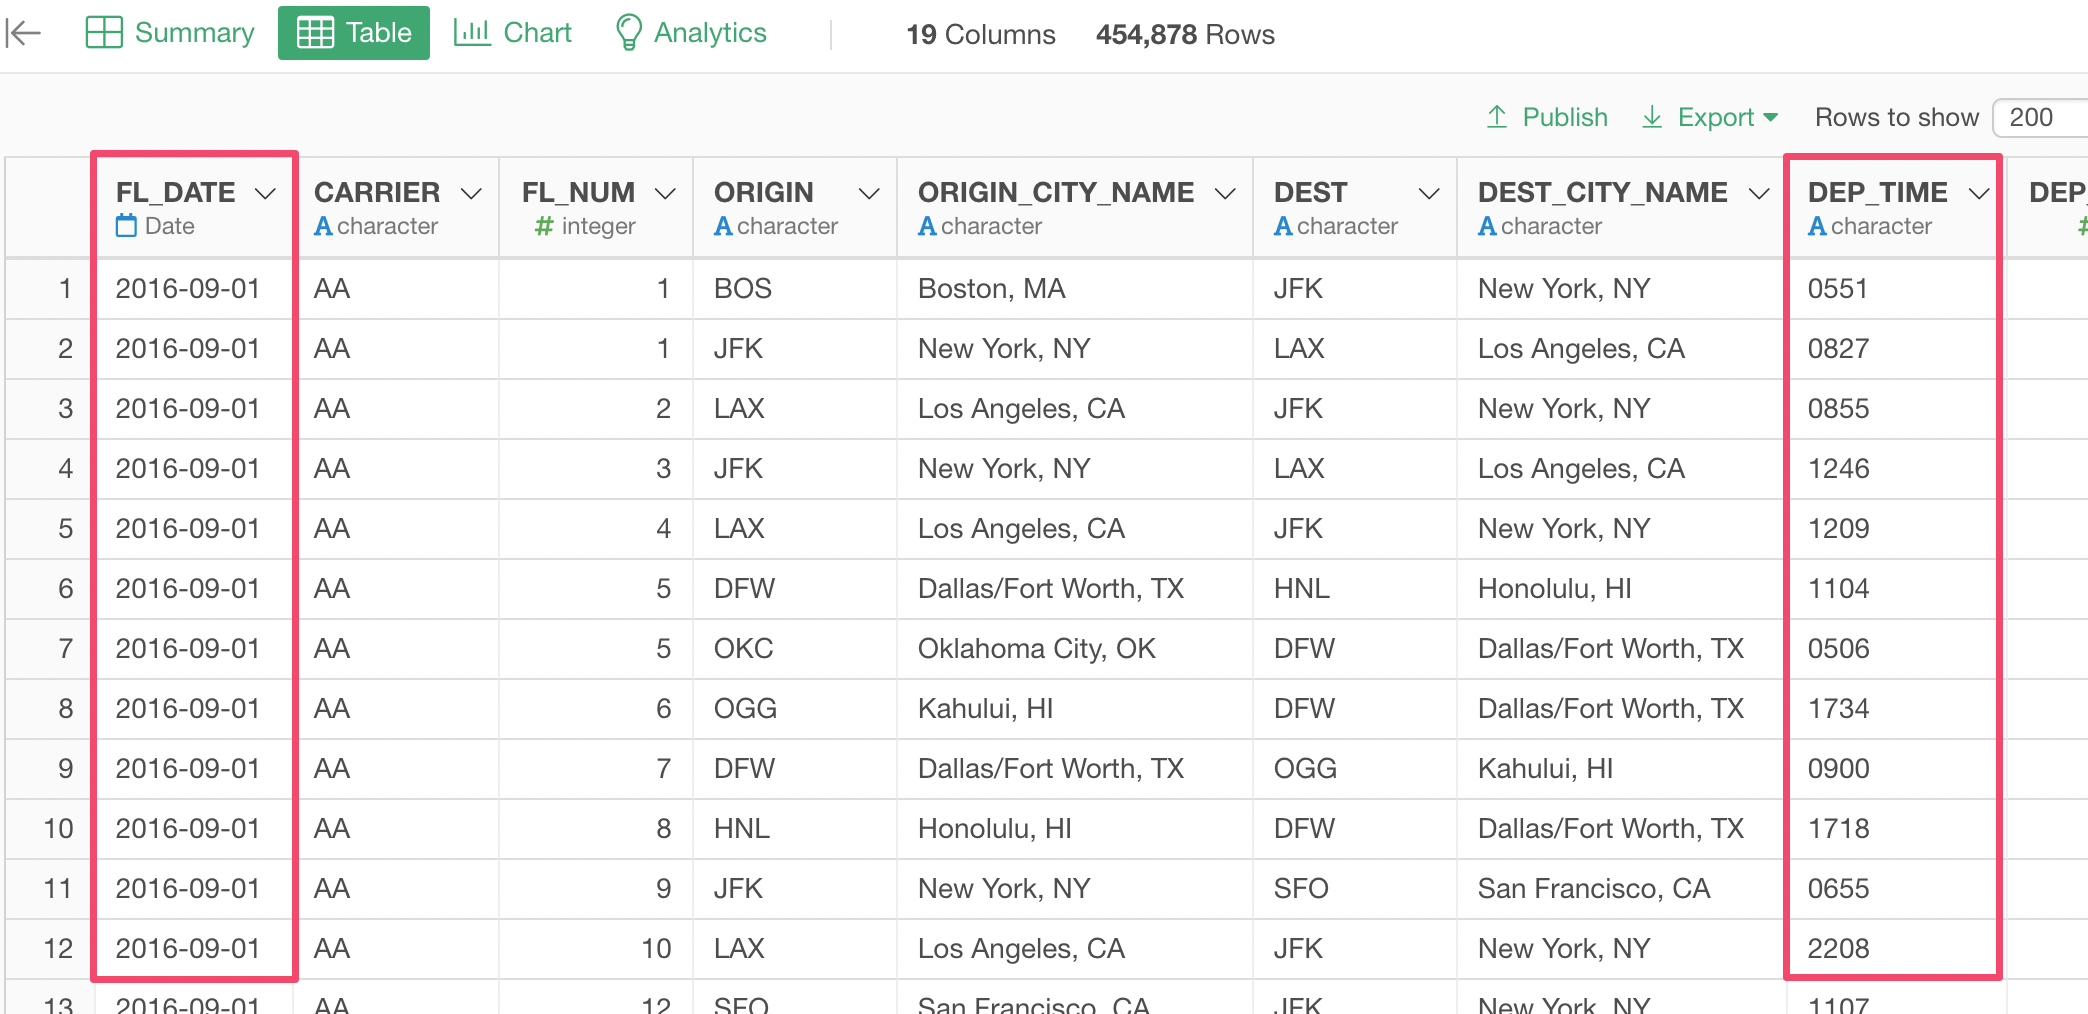
Once you import the data you will notice that the FL_DATE column is registered as ‘character’ even though it looks like a date data.
We can convert this by selecting,
Change Data Type -> Convert to Date / Time -> Year, Month, Day
from the column header menu.

The reason I selected ‘Year, Month, Day’ is because the original data comes in that order.
This will open the Mutate dialog with ‘ymd’ function.

‘ymd’ represents the order of the date for the original data, which is Year, Month, and Day.
Once you click ‘Run’ button, the column will get converted to Date data type column.

8. Concatenate Multiple Columns
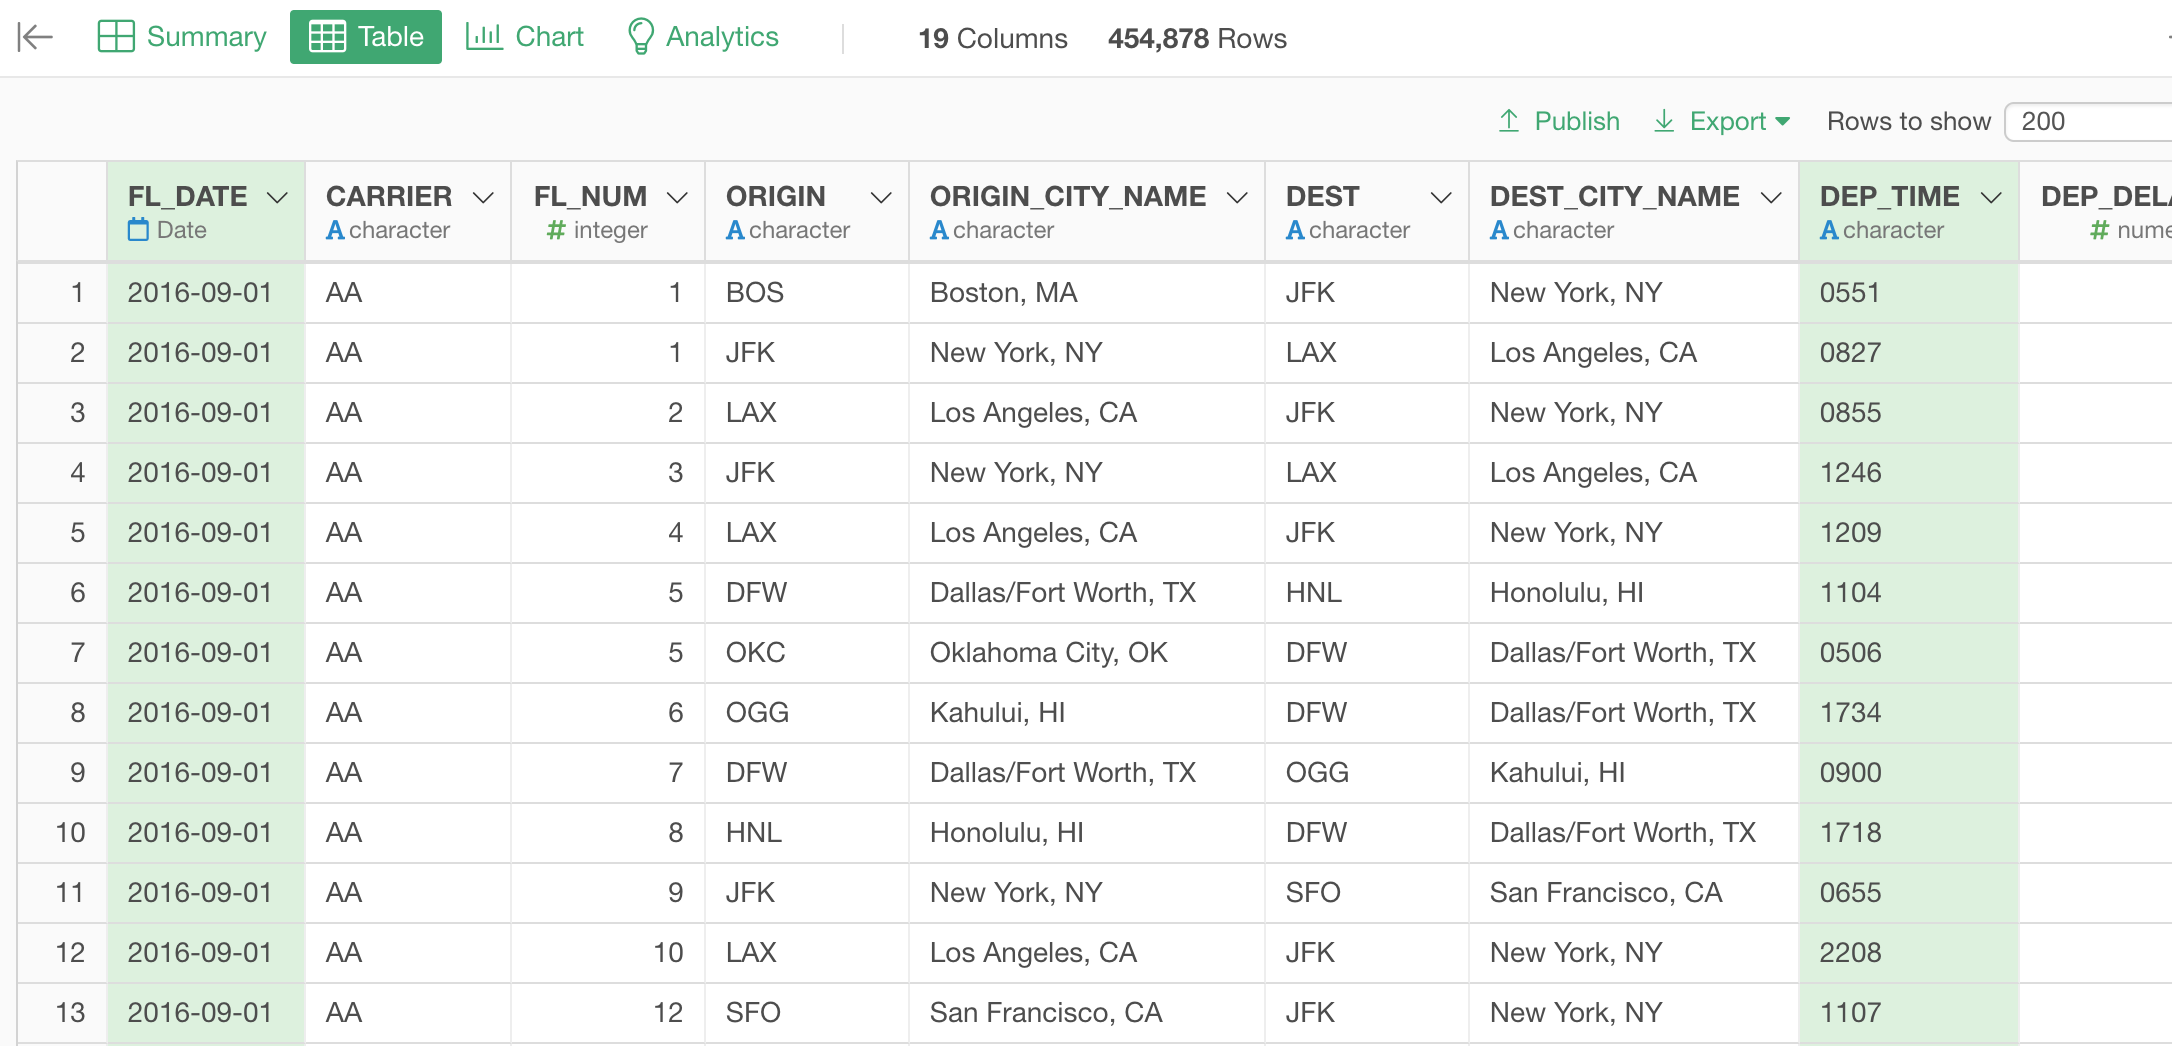
When we look at the data, the flight departure time is separated into the FL_DATE and the DEP_TIME columns.
We can concatenate the values from these two columns so that we will have te flight departure time that contains date and time information.
Select those two columns with Command (Mac) or Control (Windows) key.
Then, select ‘Unite Multiple Columns’ from the column header menu.
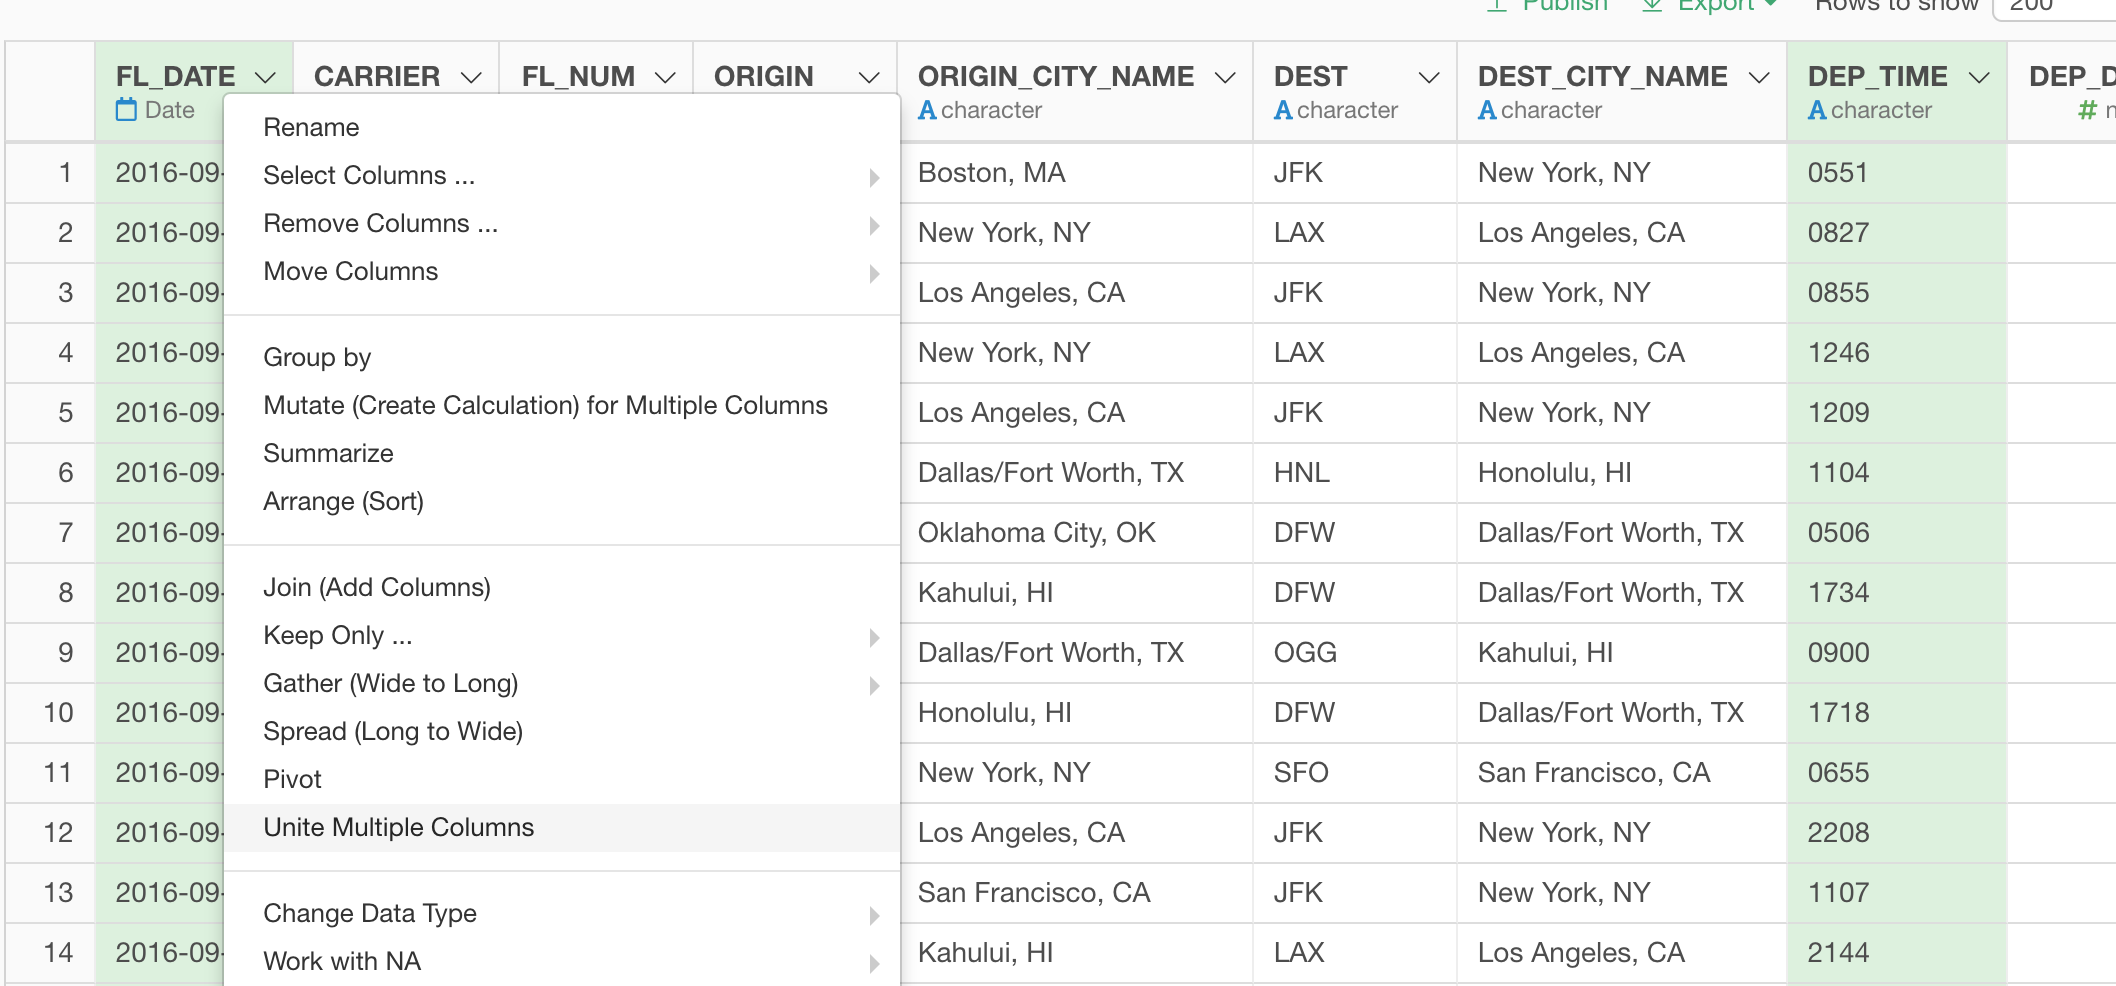
This will open ‘Unite’ dialog.
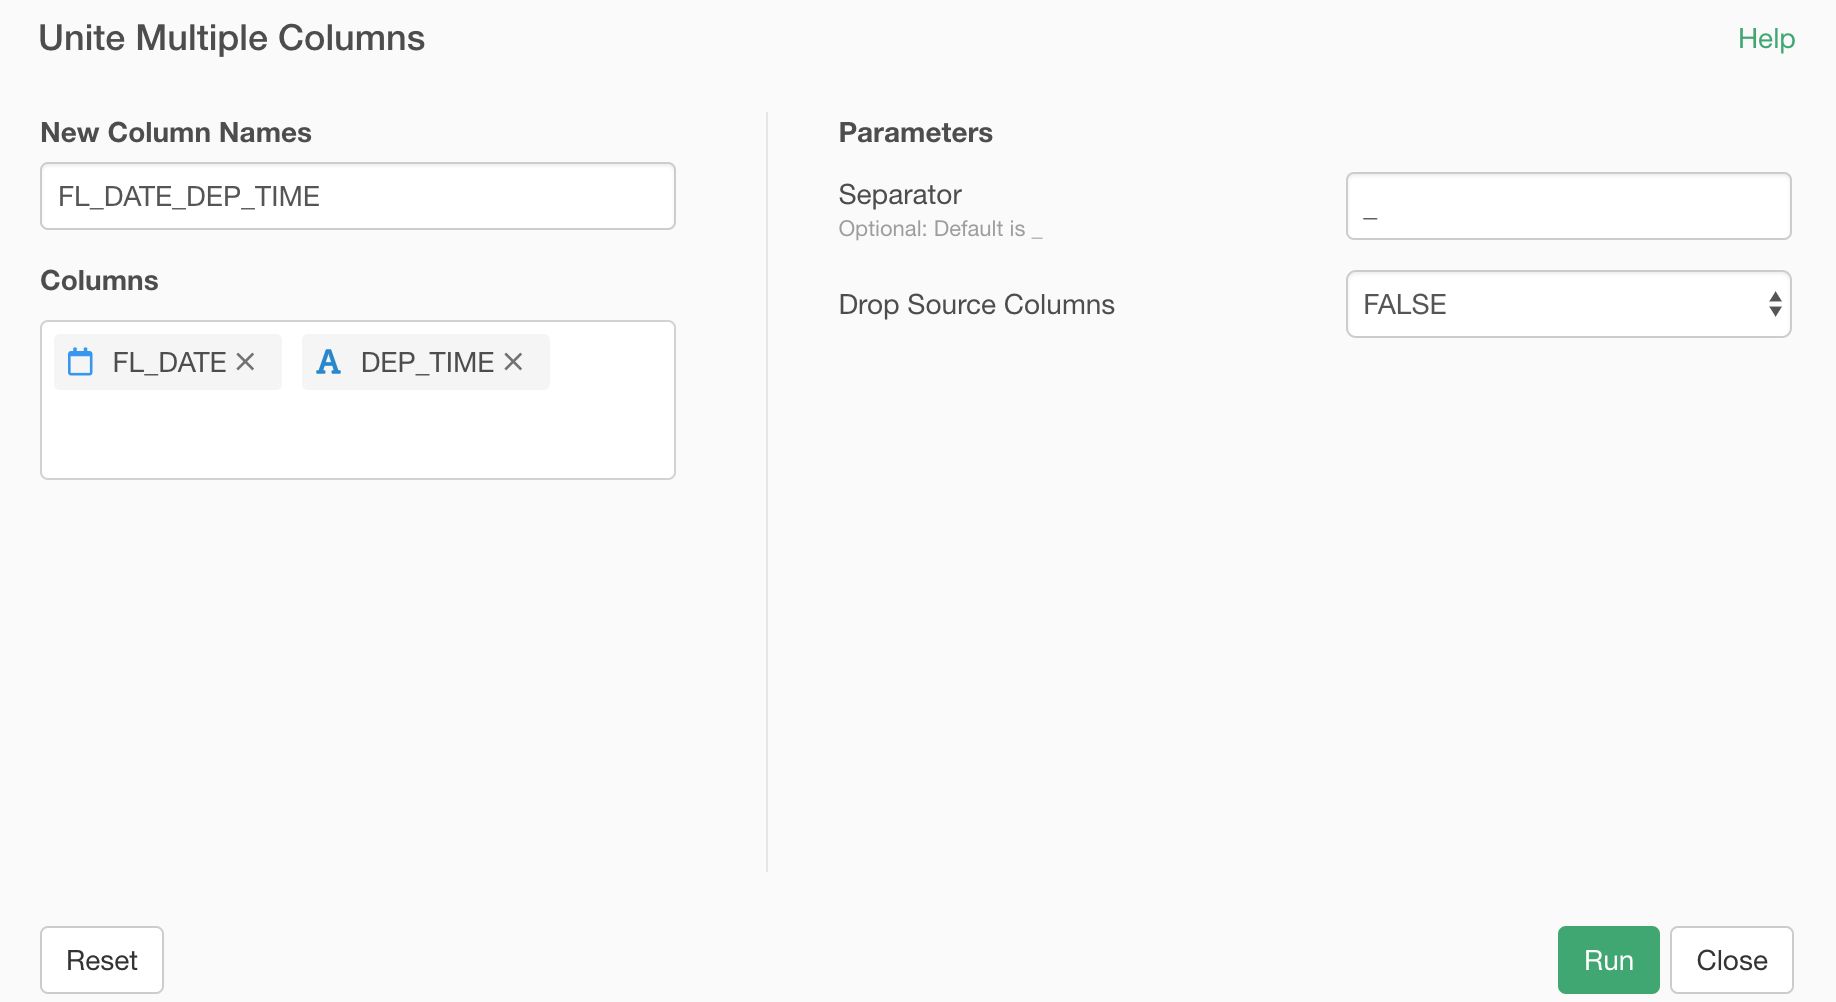
We can use the default separator, which is an underscore, to concatenate the two values.
Once you click on ‘Run’ button, you will see the two columns are now concatenated together.
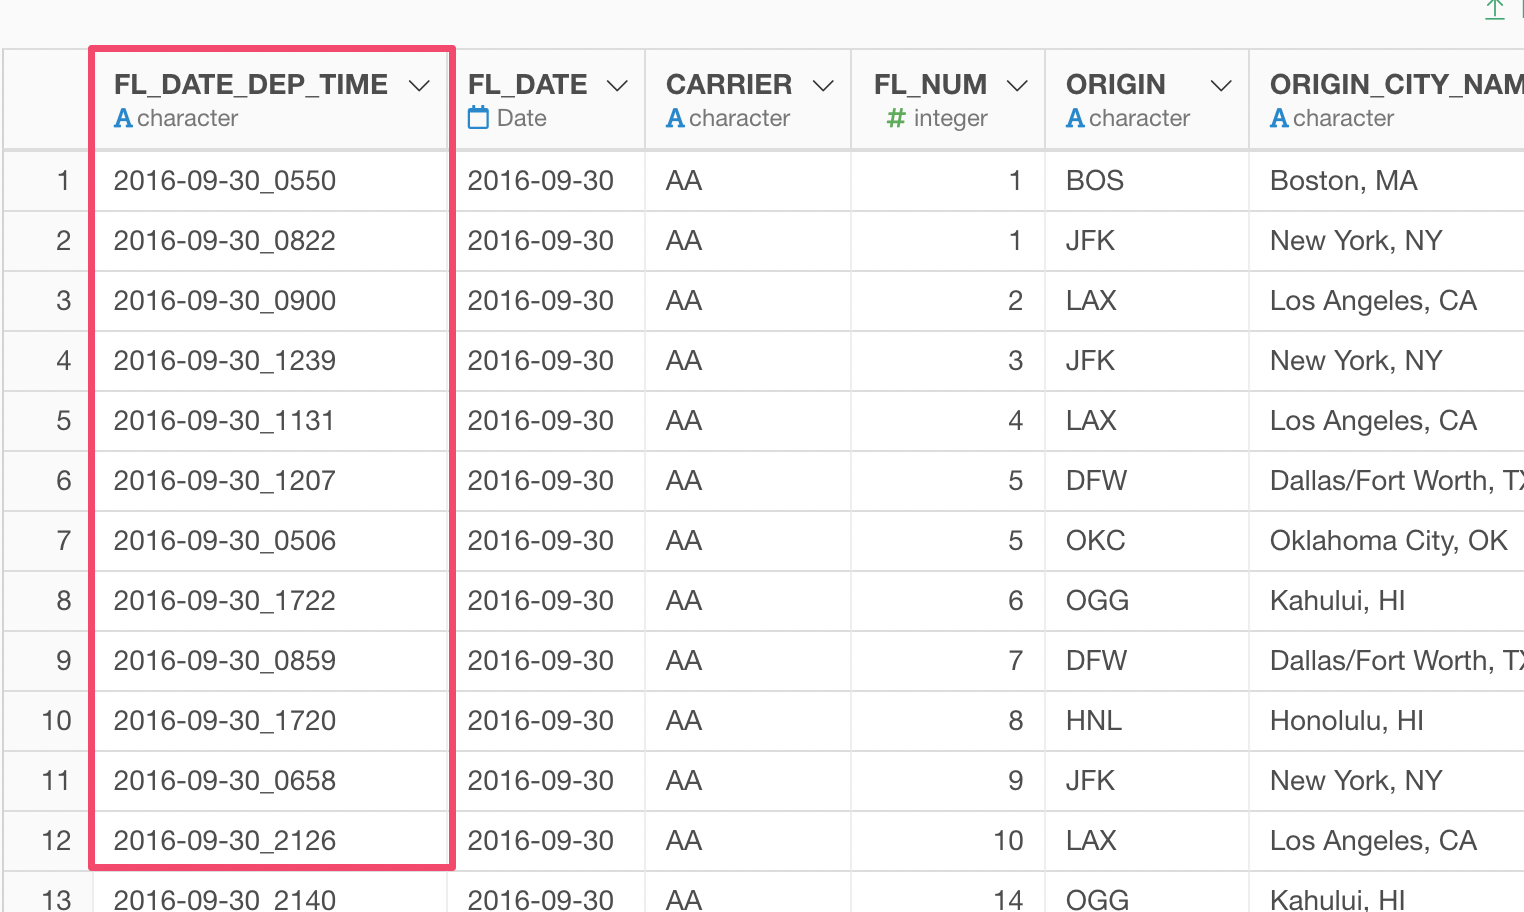
Convert from Character to POSIXct (Date and Time) with ‘ymd_hm’ function.
You will notice though that the column is now the Character data type.
But we want it to be POSIXct, which is a data type for Date with Time data.
Actually, we can do this in the very similar way we just did above.
Select Change Data Type -> Convert to Date / Time -> Year, Month, Day, Hour, Minute
from the column header menu.

By clicking the ‘Run’ button in the mutate dialog, you will see ‘FL_DATE_DEP_TIME’ column is being converted as ‘POSIXct’ data type.
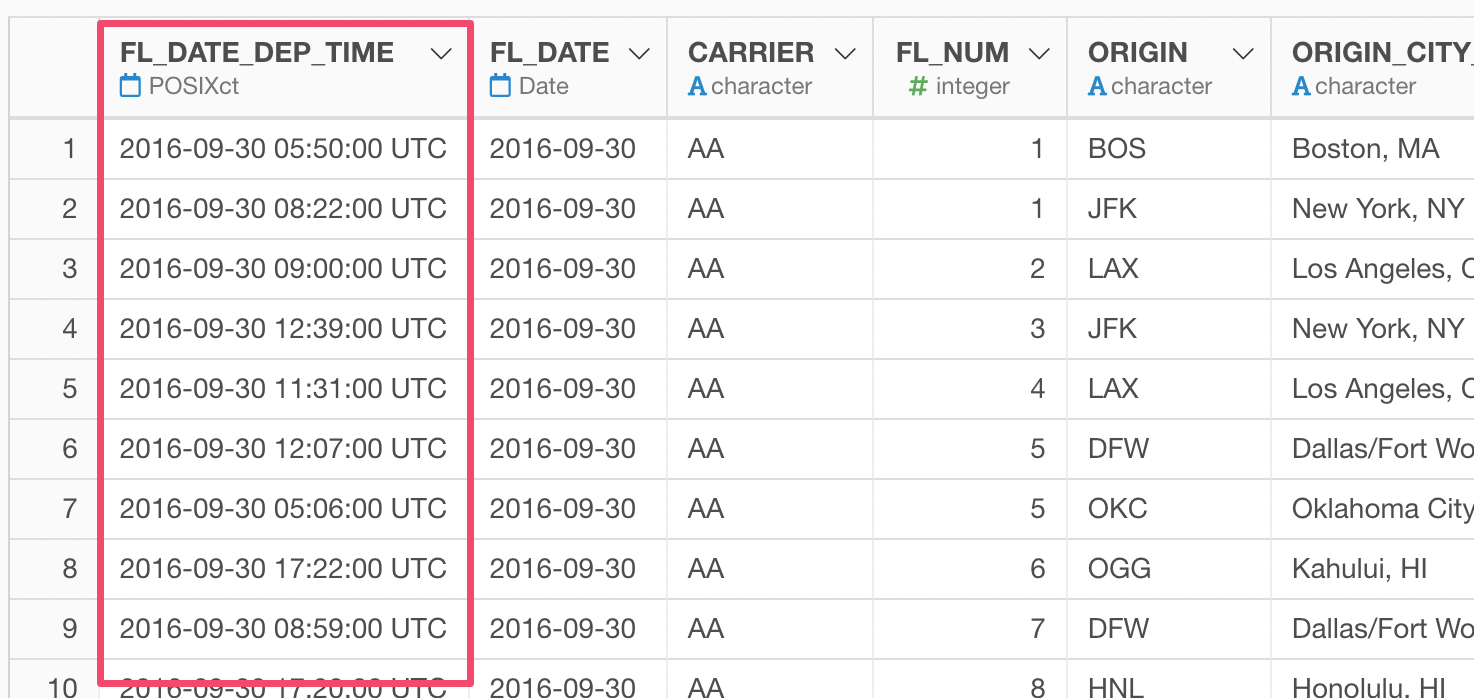
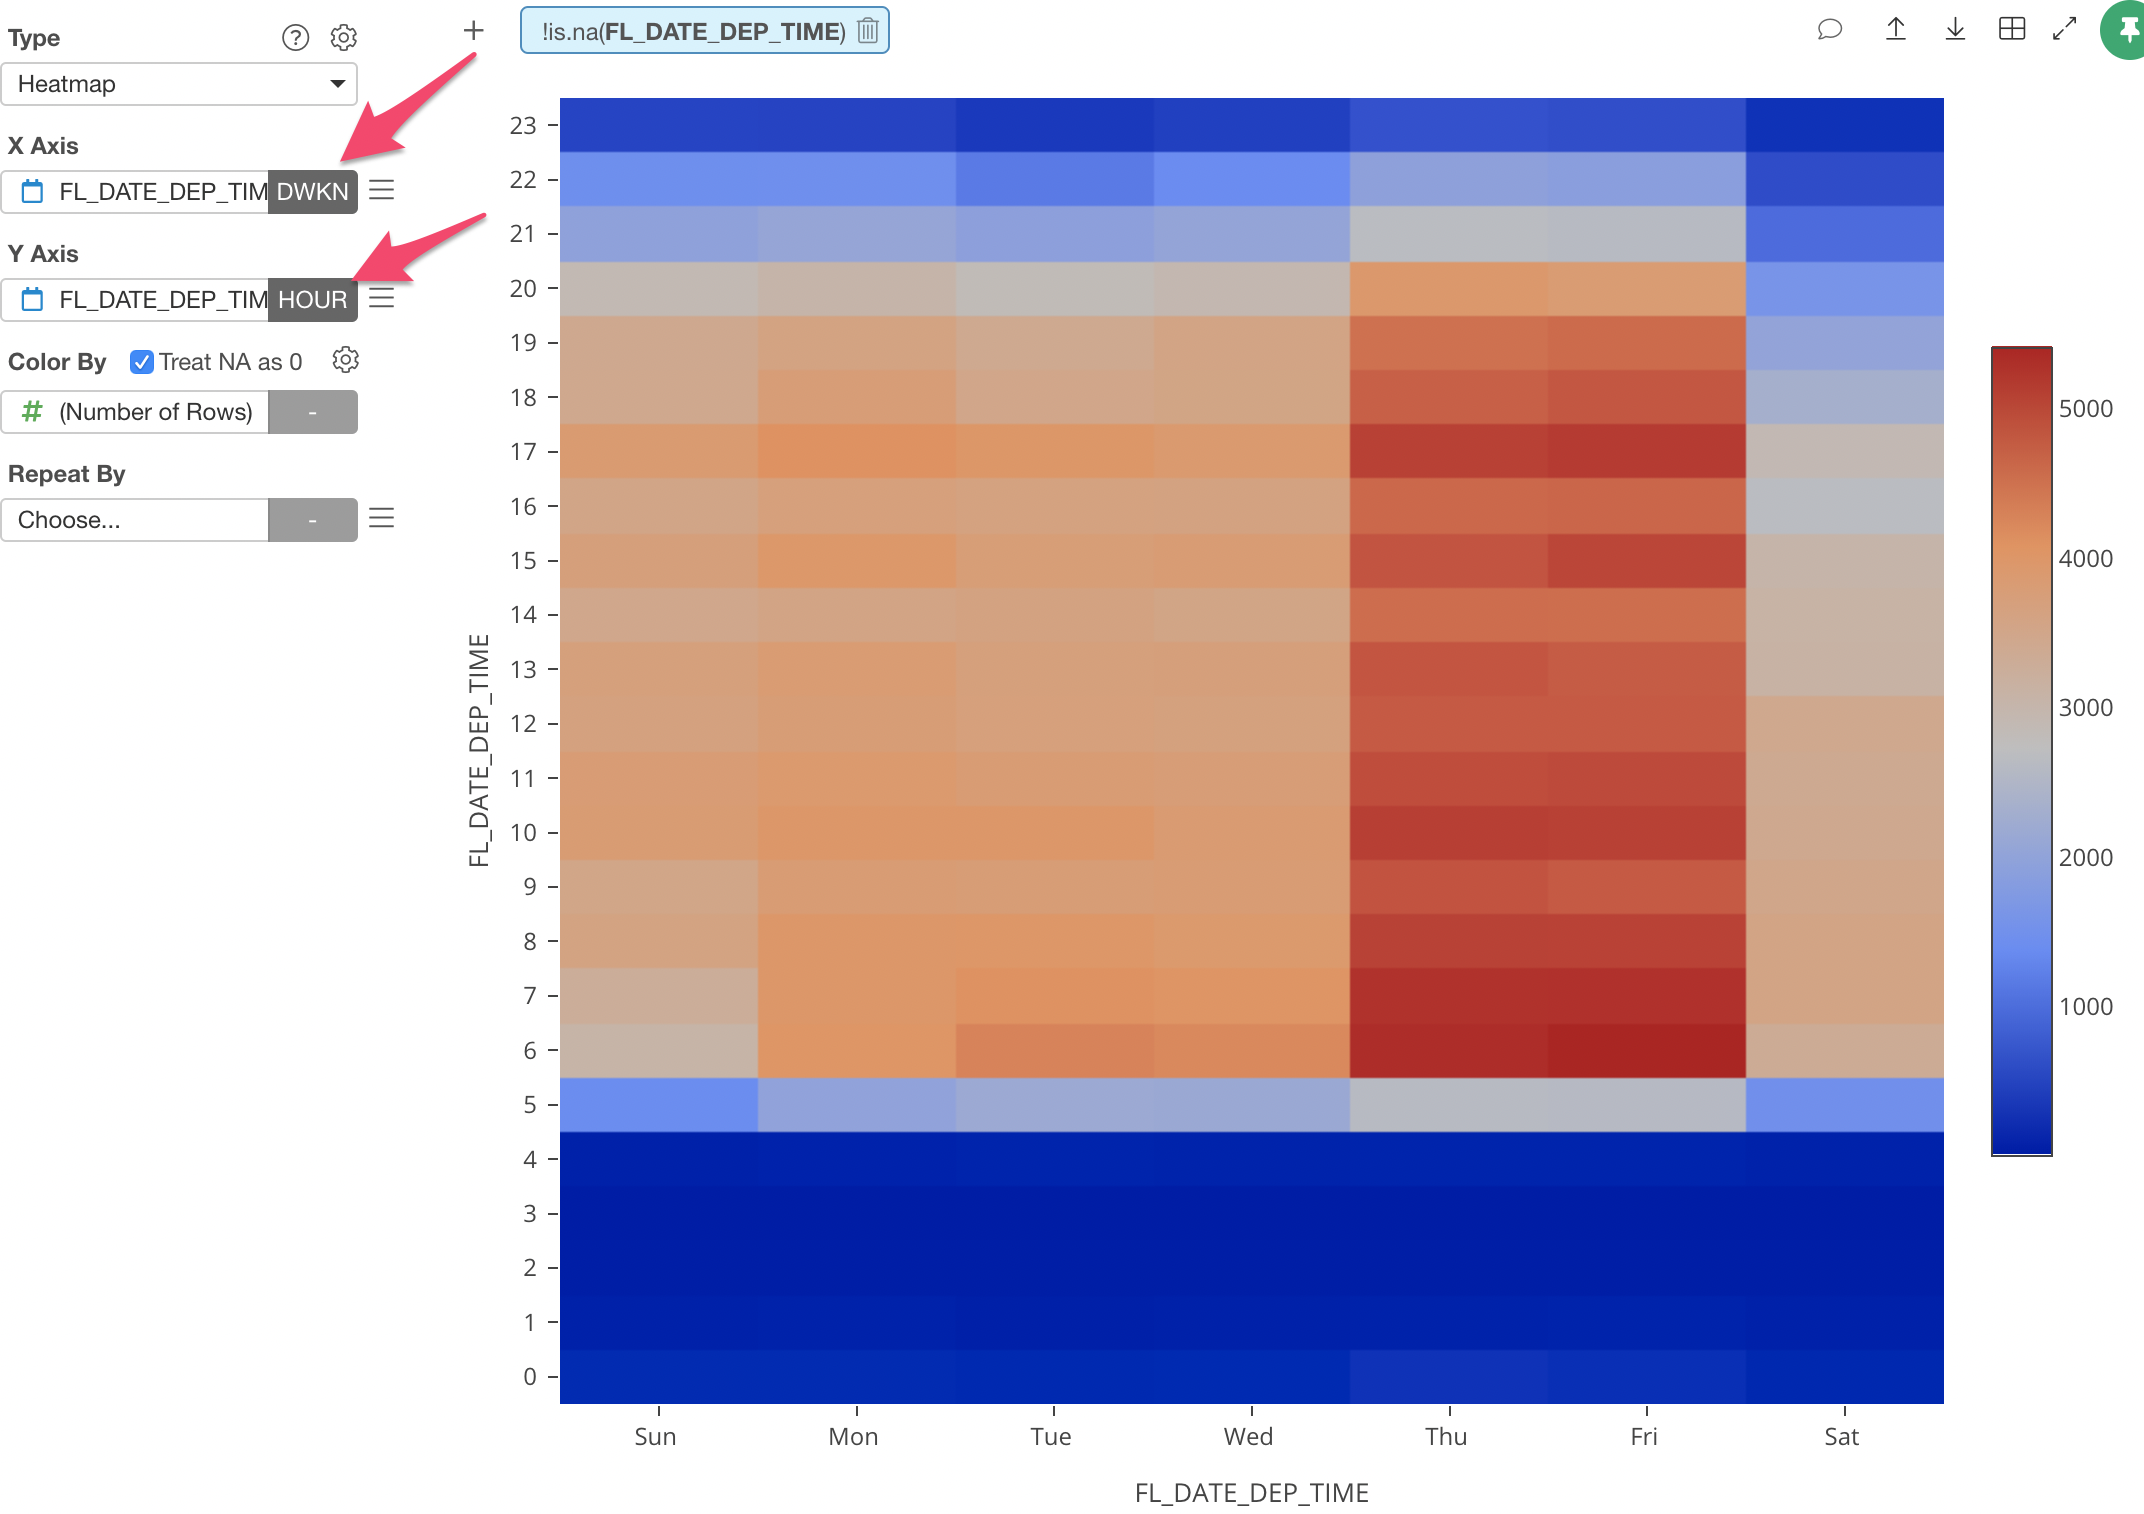
This will allow us to look at this data from many various perspectives.
For example, by using Heatmap chart we can visualize which hour of day and day of week have more flights quickly.