Data Science Booster Training
Yes, Data Science is and will be the hottest topic in the next 10 years. Yes, Data Scientists are making a lot of money. And yes, AI/Machine Learning is eating the world. But this training is not about that.
It’s about how you can make smarter decisions to address your business problems and, event better, create new business opportunities by using Data Science.
Collecting and storing data has become much easier than before, but getting real values out of it has not become as easy for most of us. It can be rather overwhelming just to think about what to do with the ever growing volume of the data. But, the thing is, when you have more data, you should be able to discover more useful patterns or trends that are hidden in the data. And finding such patterns and trends can predict the future much better. Based on such predictions, you can make much smarter decisions for your business.
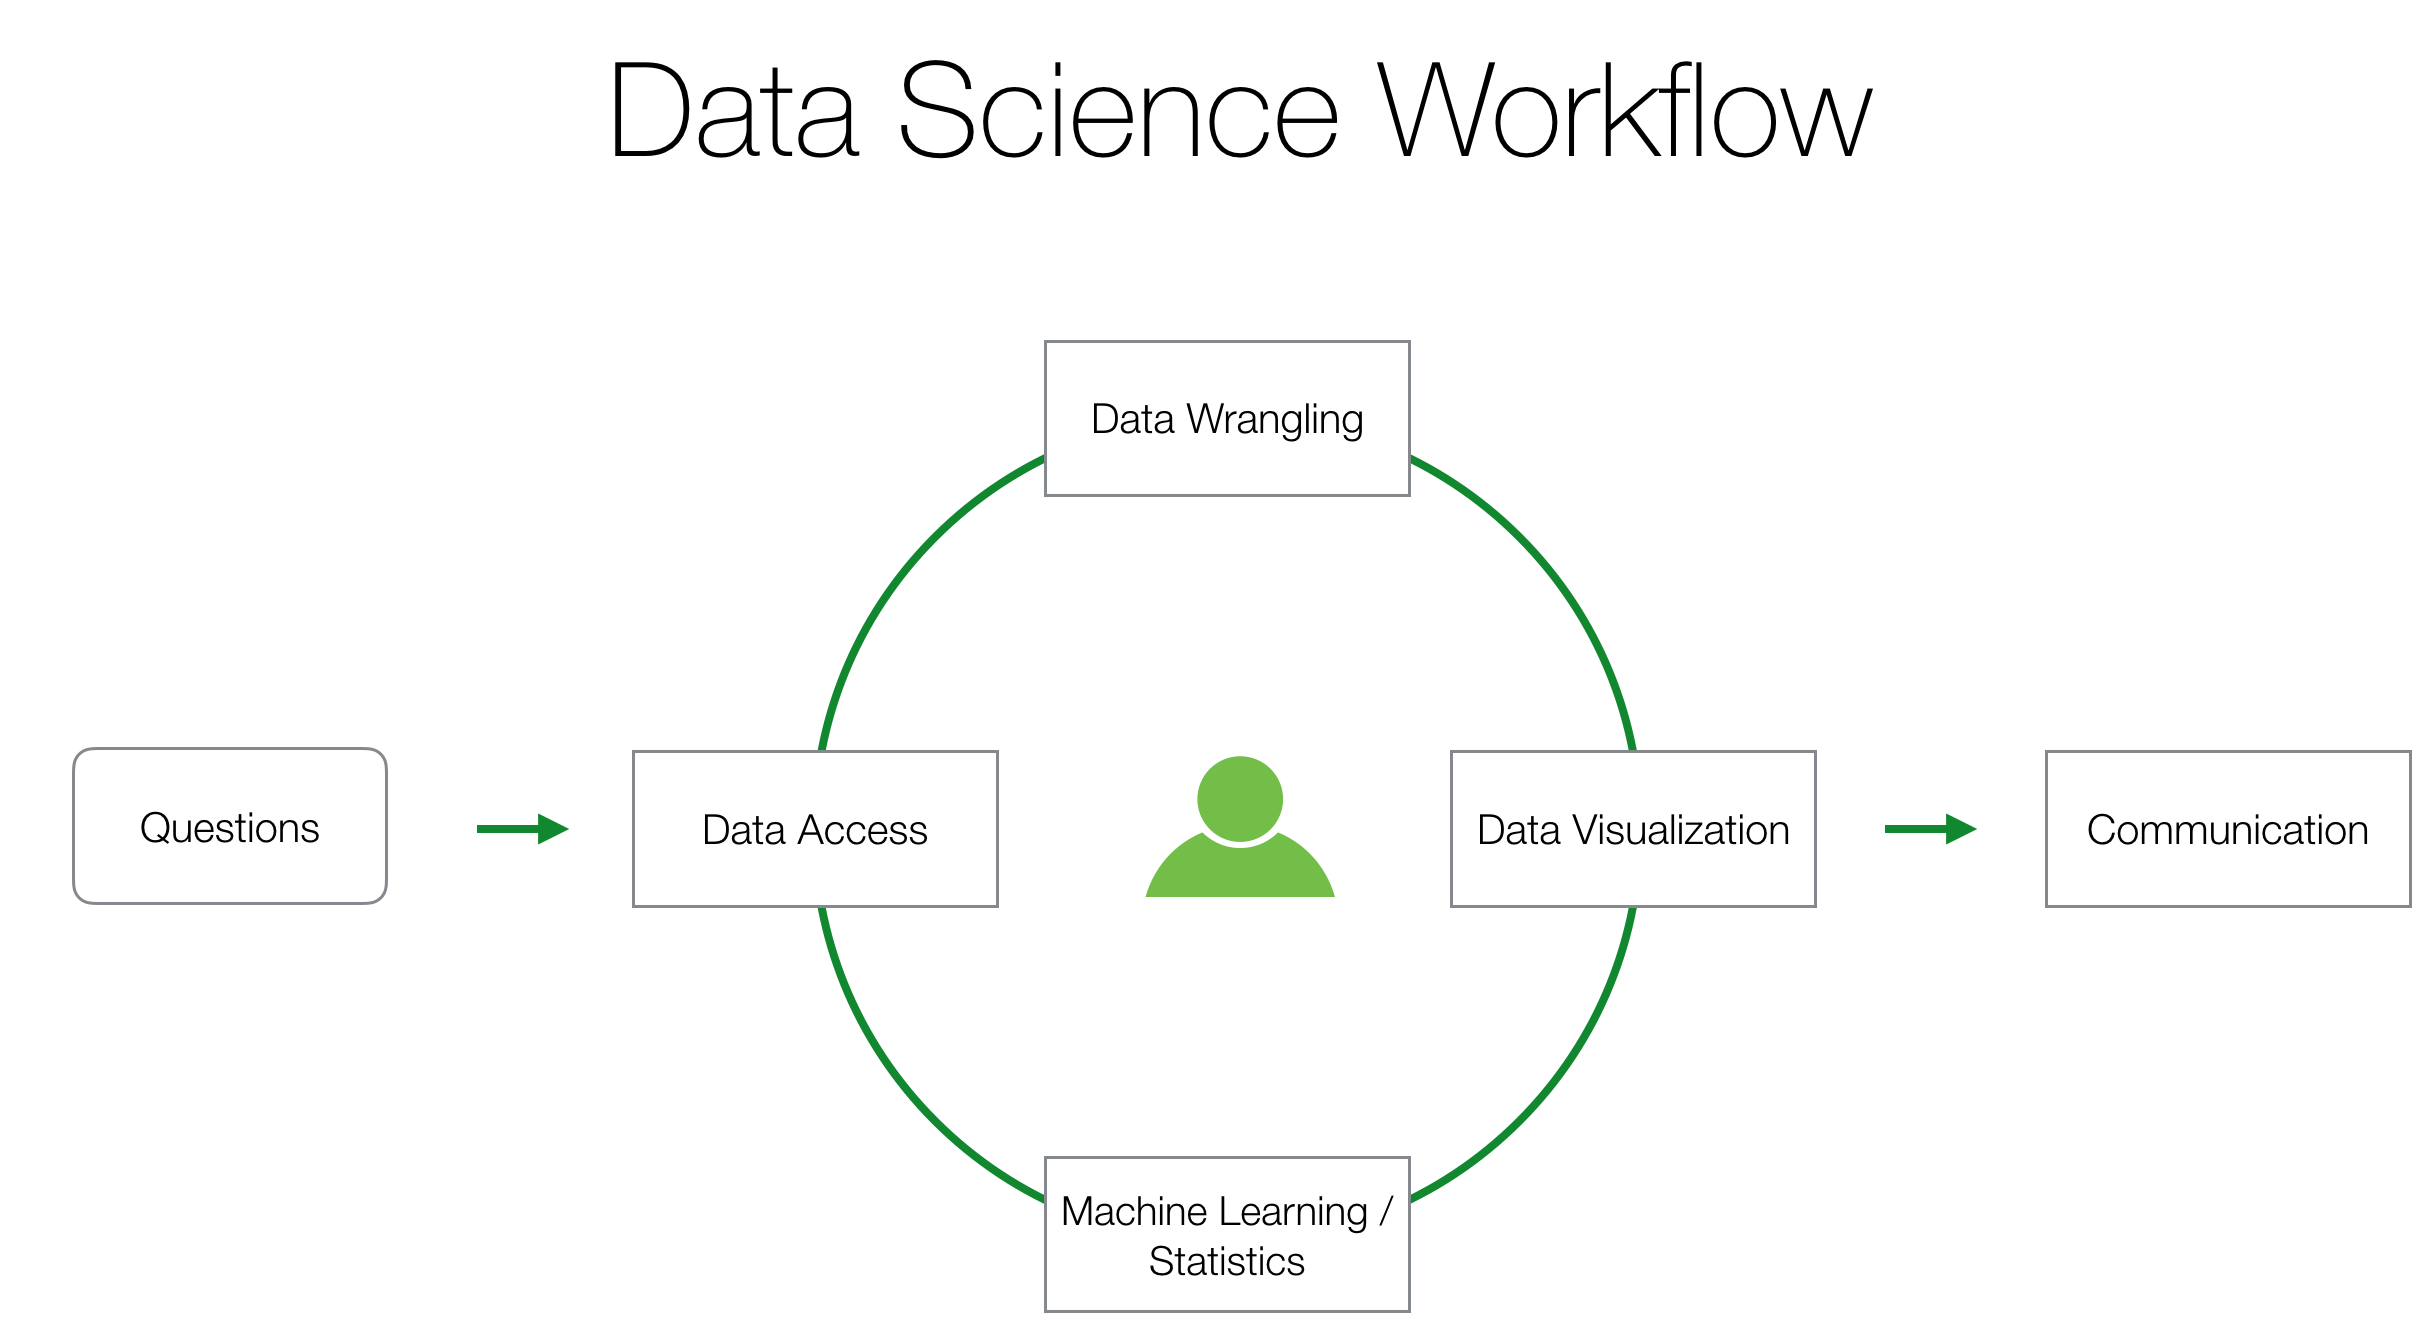
And that is what Data Science is all about. And this is what some of the Data advanced companies such as Google, Facebook, AirBnB, Uber, etc. in Silicon Valley do every day. They use Data Science methodologies including not just Machine Learning / AI algorithms, but also Data Access, Data Wrangling, Data Visualization, Statistics, Communication, etc. at all levels of the organizations to address their business problems effectively.
But, we think that these practically useful methods and techniques should not be limited to people in Tech. They should be available to anybody regardless whether you are a technical person or not. And this is why we have developed this 5 days Data Science Booster training course to help you obtain the most practically useful Data Science skills without the need of programming.
The best way to become better at Data Science is to do Data Science. This on-line live streaming training guides you to step into the world of Data Science, and you will immediately start using the Data Science methods to find hidden patterns and trends from real world data with your own hands. The training emphasizes more on the practicality of the Data Science methods, this means you will learn not just what they are, but also why and when you want them and how you can use them to make smarter decisions for your business.
There Are Already Other Data Science Trainings, Why Another Training Program?
Unlike other Data Science related trainings you find on-line or off-line, you are not required to have any programming skills nor statistical backgrounds. Instead, you will use a UI tool called Exploratory - UI for R (the most popular data science programming language) - to quickly access various R’s capabilities ranging from machine learning and statistics to data wrangling, data visualization, and data access capabilities.
In the last two years, we have been delivering in-class Data Science Bootcamp training classes in Silicon Valley (US) and Tokyo (Japan) while we were building Exploratory. We have trained many people, most of whom were non-techies, in various industries (Banking, Web Marketing, Advertising, TV, News Papers, Software, Retail, Healthcare, Medical, Gamble, Telecommunications, Auto, Manufacturing, etc.) and various job roles (Sales reps, Marketers, Consultants, Executive Assistants, Designers, Executives, Financial Analysts, HR managers, Engineers, etc.) and helped them become proficient in exercising Data Science methods with their own data.
Among many things we have learned from delivering these classes, the two most important things are:
- People can learn and do Data Science regardless whether they are technical or not
- They learn it much better by doing it rather than listening or reading it.
Based on our learning from providing such training and working with companies like Facebook, Google, Apple, NASA, etc., we have built this 10 hour on-line training program to boost your Data Science skills starting from scratch. In this training, you will spend most of the time learning how to explore and analyze data effectively by exercising rather than learning how to program or the details of the inner-working or theories behind the machine learning algorithms. This would be a perfect training if you want to understand the benefit of applying Data Science methods and use them effectively with your data to improve your business and your career.
Training Objectives
At the end of the training, you will be able to:
- Understand the benefit of Data Science methods, how to use them, when to use them, and most importantly why you want them.
- Use the Data Science methods effectively to gain deeper business insights from the real world data that are useful for making business decisions.
- Communicate your insights - what they are, how you discover and conclude, why they are important - with others effectively.
Training Details
Date: 1/8(Mon), 9(Tue), 10(Wed), 11(Thu), 12(Fri).
Time: 9AM PT (US Pacific Time) or 5PM PT
Total Time: 10 hours of online classes (2 hours a day) plus exercise homework.
Place: Online (Web Conference URL will be sent to the participants.)
Price: $495 (US Dollars)
It will include one year subscription of Exploratory Desktop - Personal Edition and the training materials. This will give you enough time and environment to keep improving your Data Science skills by applying what you have learned in the training to your real world data.
Discounts
We have seats available for full-time students at a discounted rate. Please contact at support@exploratory.io for details.
Group discount is also available. Please contact us at support@exploratory.io for details.
Payment policy
Individual payments for Data Science Booster Training must be made by credit card through our website. All prices are in US Dollars.
Refund policy
If you are not happy with your training experience for any reason, we will refund you with the full amount.
Who will be right for this training?
This training would be perfect if you :
- Want to learn how to apply Data Science in the real world business scenario.
- Want to start a journey of becoming a Data Scientist.
- Want to start Data Science projects but don’t know where to start.
- Wanted learn Data Science before, but gave up due to the steep learning curve of learning programming and/or statistics.
What you need before the training
- Being able to use Excel (or any other spreadsheet tools) and perform the basic calculations (e.g. sum, average, etc.).
- Being curious about Data.
- Having a desire and commitment to learn how to understand data better.
- Positive attitude towards to learning something new.
What you don’t need before the training
- Programming skill (if you have, of course you can do a lot more down the road, but not necessary for this training.)
- Statistics background (if you have, of course that makes things easier, but not necessary for this training.)
- Negative attitude towards to learning something new. ;)
Training Agenda
Training class runs from 9AM - 11AM and 5:00PM - 7:00PM PT each day from Jan 8th - Jan 12th, 2018. You can join either the morning or the evening session. You can join both, too, if you want! ;)
Before Training
Before the training starts, we ask you to install Exploratory Desktop onto your PC and complete Exploratory’s ‘Getting Started Tutorial’. This will allow us to spend more time on learning Data Science itself rather than learning how to use Exploratory.
- Install Exploratory (appx. 30 minutes, mostly the time for downloading necessary softwares.)
- Getting Started with Exploratory - Tutorial (appx. 60 - 90 minutes.)
We will send you a setup guide and a getting started tutorial, and support you via online meetings or chats if you encounter any issues or questions.
Day 1 - Getting into Data Science
9:00AM - 10AM PT / 5:00PM - 6:00PM PT
Welcome to Exploratory’s Data Science Training
- Introduction to Data Science, R, and Exploratory
You will learn the basics of Data Science, R, and Exploratory.
10:00AM - 11:00AM / 6:00PM - 7:00PM PT
Introduction to Exploratory Data Analysis and Data Visualization Hands-on
You will learn how to understand the overview of the data by looking at the numeric summaries, distribution of the data, and relationships between columns.
Day 2 - Gaining Insights by Data Wrangling
Unfortunately, the real world data never comes in clean formats that are ready for analysis. The good news is, by learning the grammar of Data Wrangling you can address various challenges in cleaning and preparing data for analysis.
9:00AM - 10AM PT / 5:00PM - 6:00PM PT
Introduction to Exploratory Data Wrangling - Part 1.
You will learn the basics of Data Wrangling grammar following a dplyr framework - a grammar of Data Wrangling - to explore the data effectively.
10:00AM - 11:00AM / 6:00PM - 7:00PM PT
Introduction to Exploratory Data Wrangling - Part 2. : Working with Text and Date Data
You will learn how to address the most common challenges when working with Text and Date data by cleaning and transforming them.
Day 3 - Gaining Insights by Statistical Algorithms
9:00AM - 10AM PT / 5:00PM - 6:00PM PT
Correlation Analysis - Introduction to Correlation Algorithm
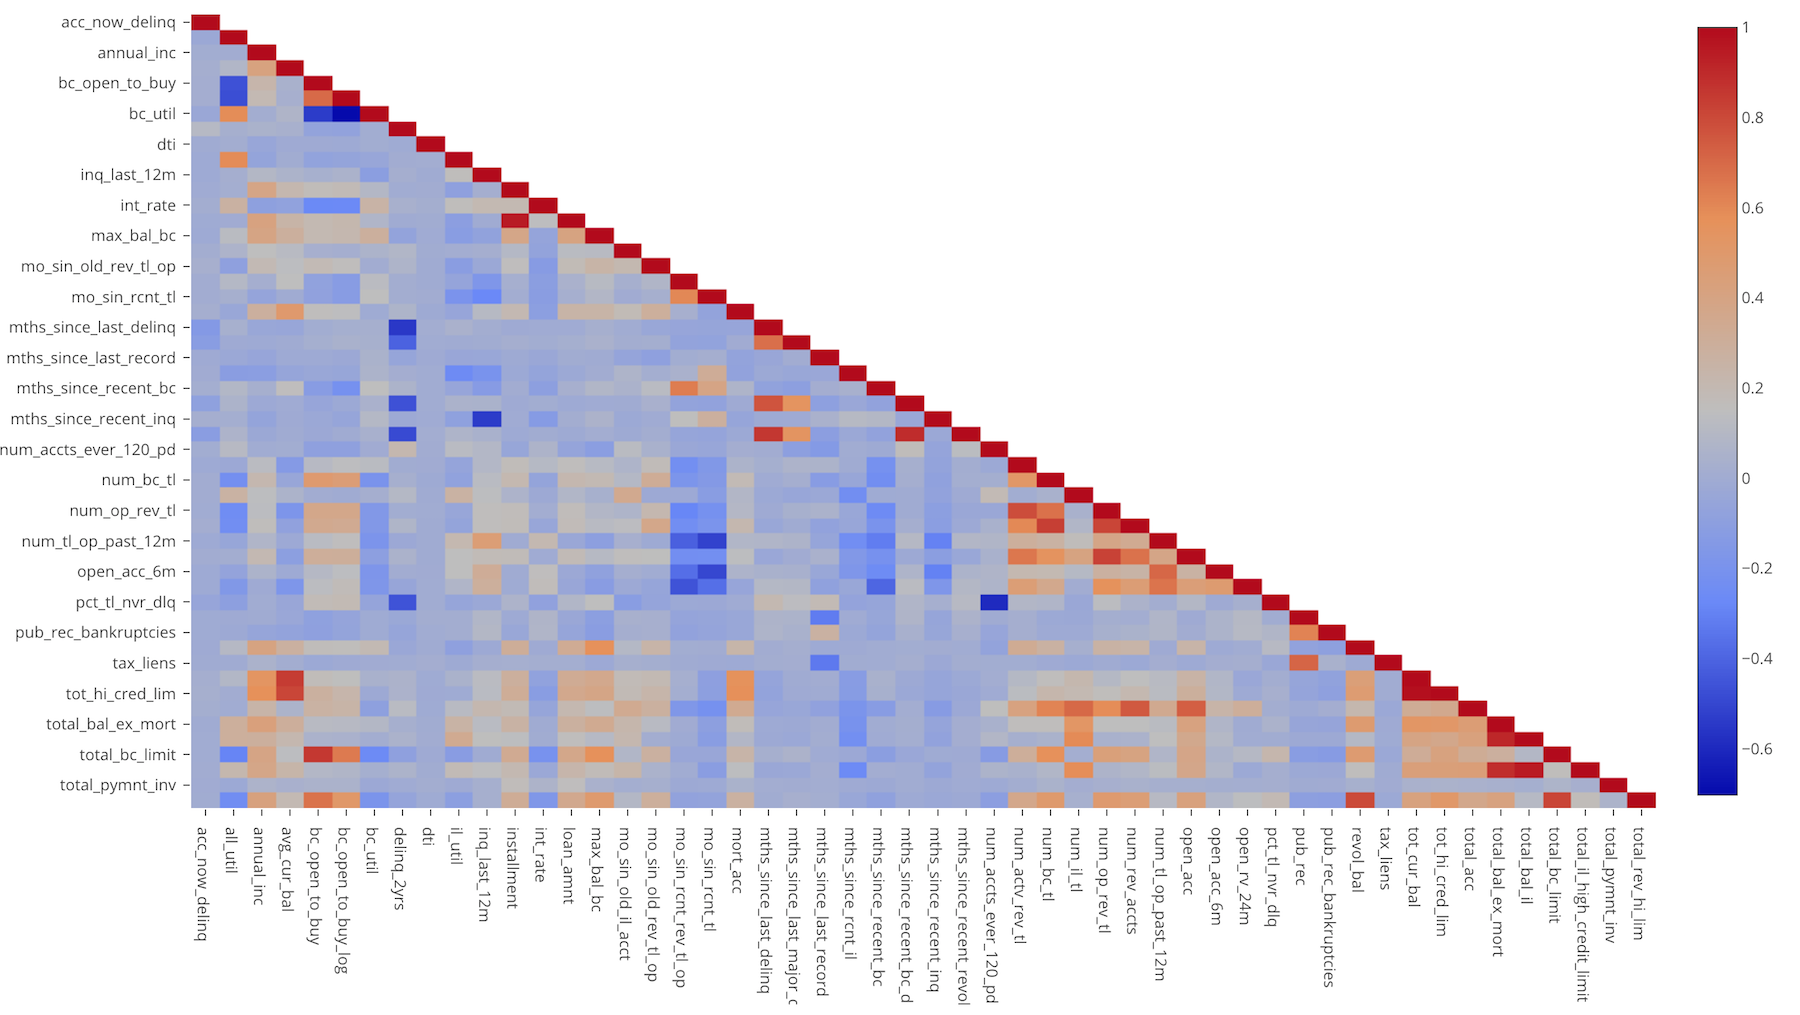
You will learn what Correlation algorithm is and how you can use it to find highly correlated pairs of the variables.
Hands-on: Finding correlation among the web traffic measures and pick the measures that you want to pay attentions to.
10:00AM - 11:00AM / 6:00PM - 7:00PM PT
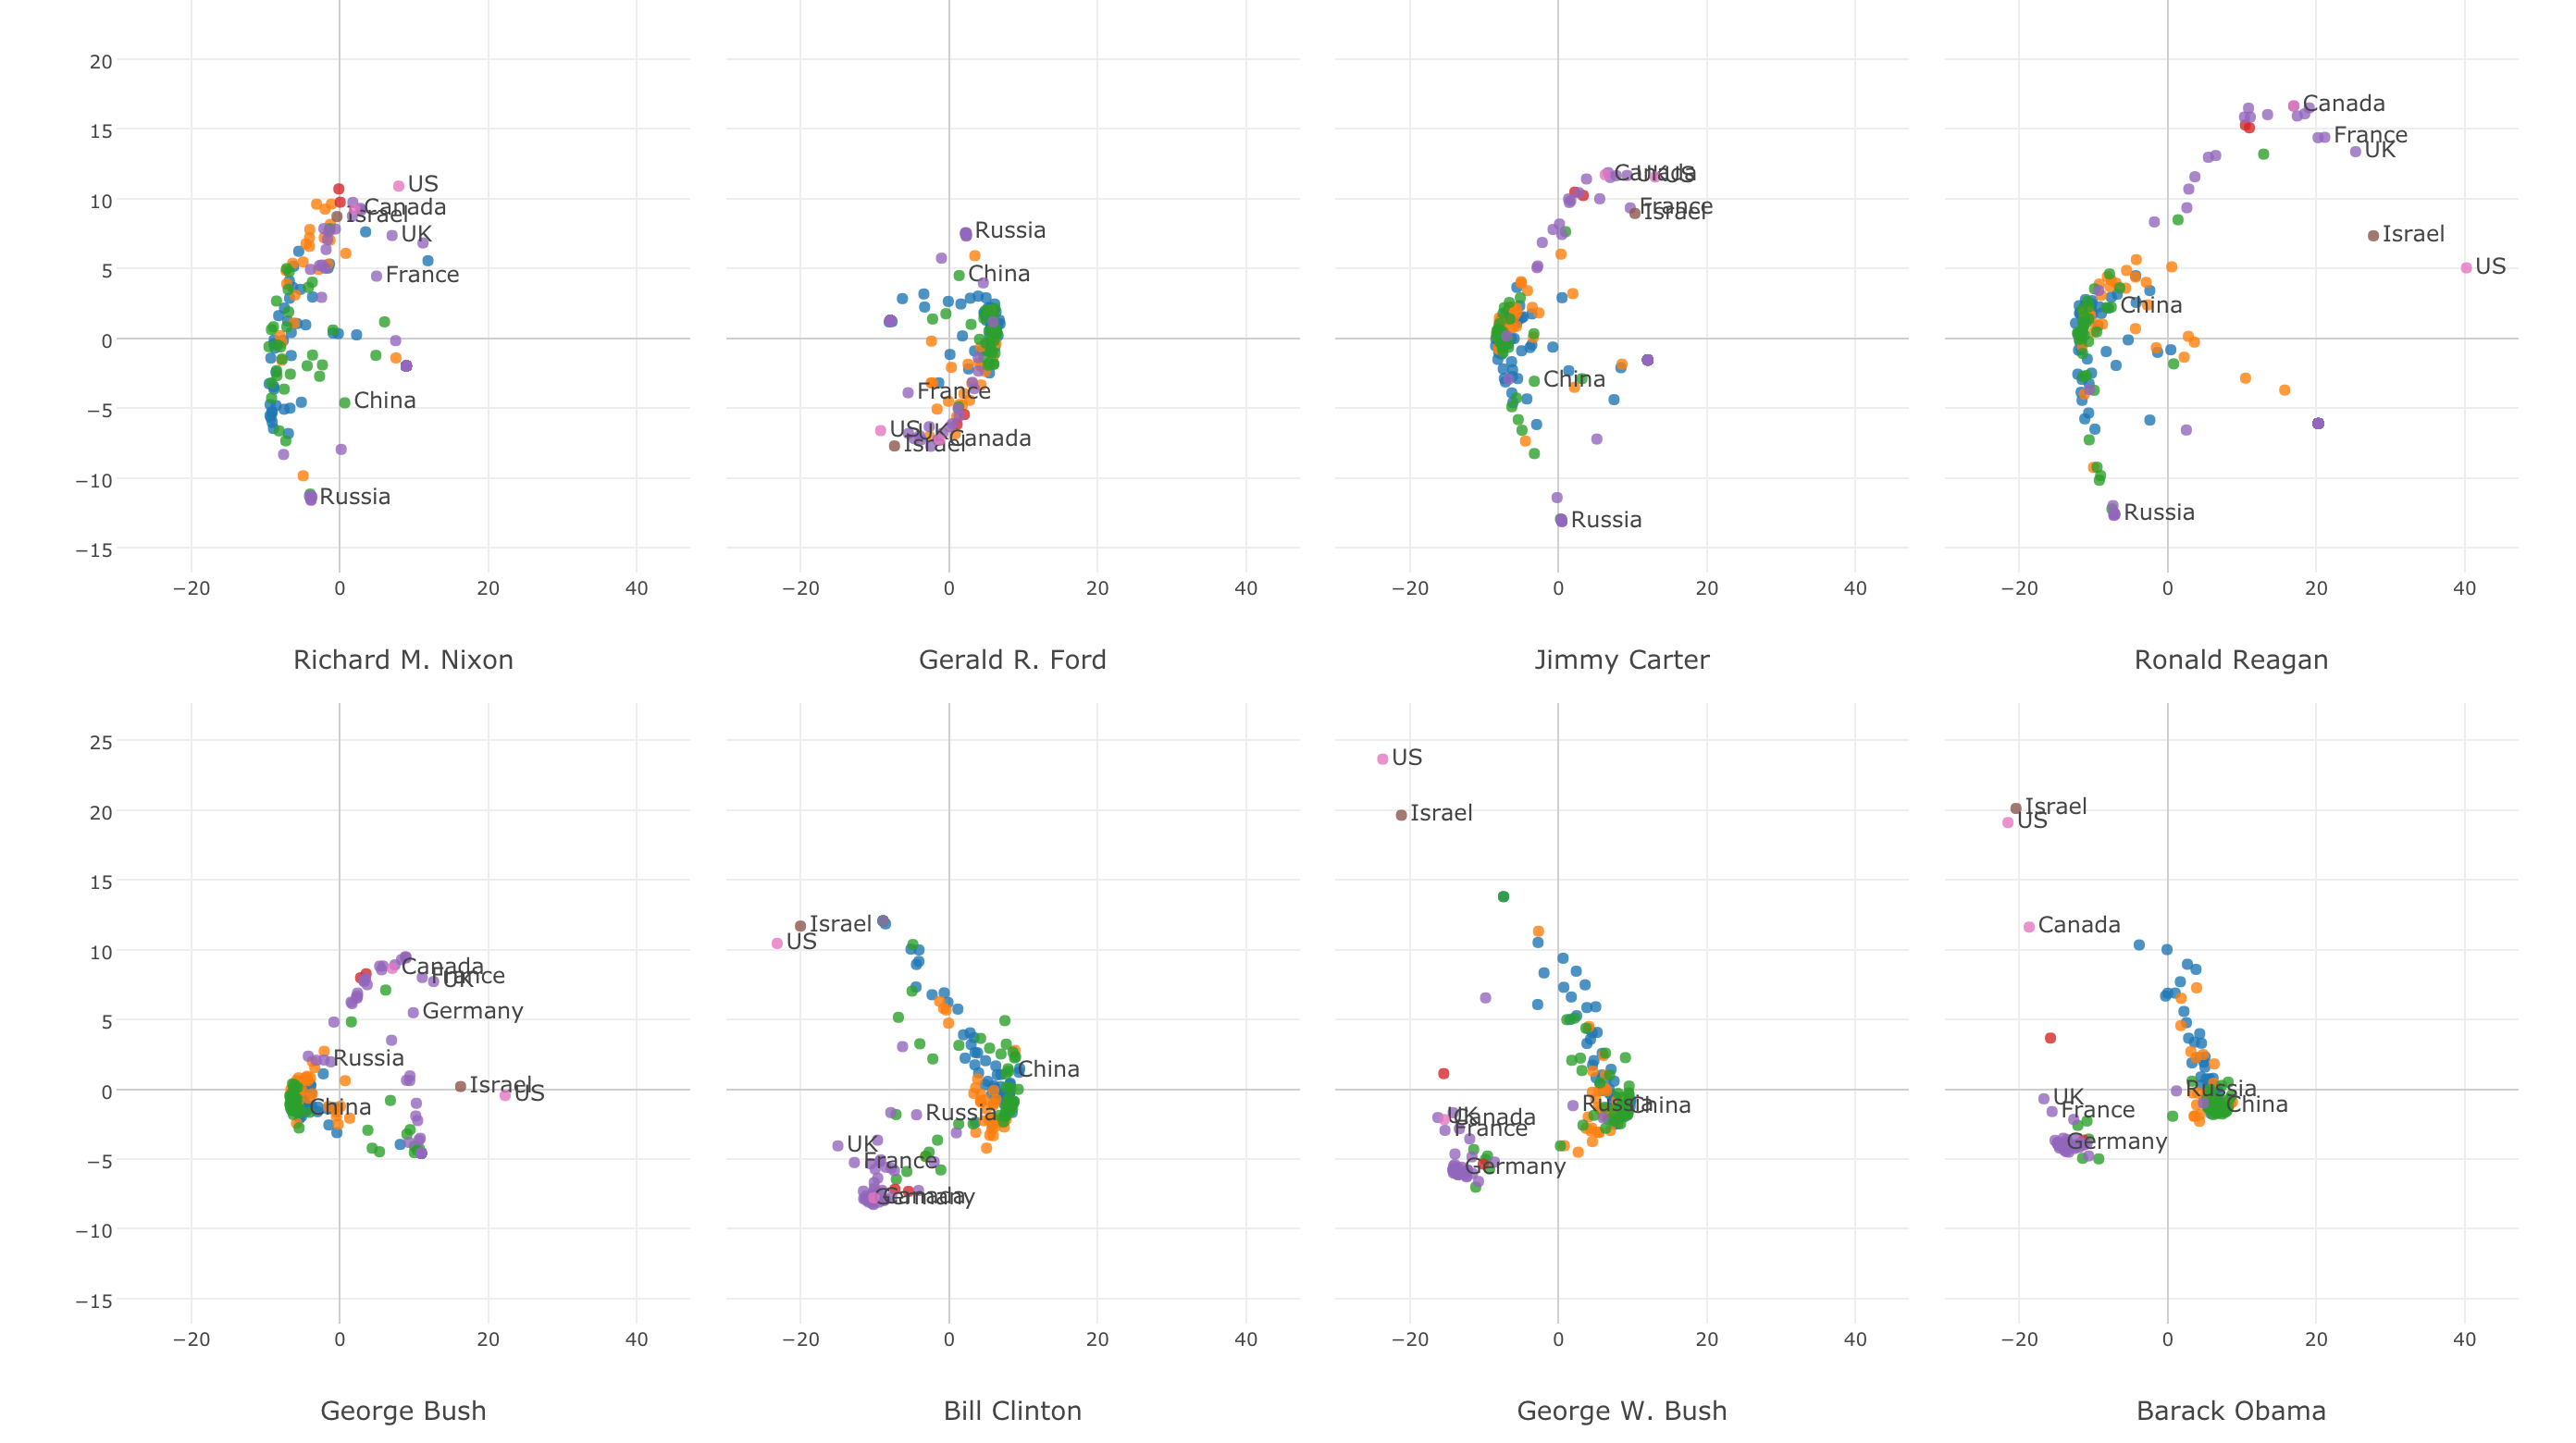
Similarity and Clustering Analysis - Introduction to Distance, Multi- Dimensional Scaling, and K-means Clustering algorithms.
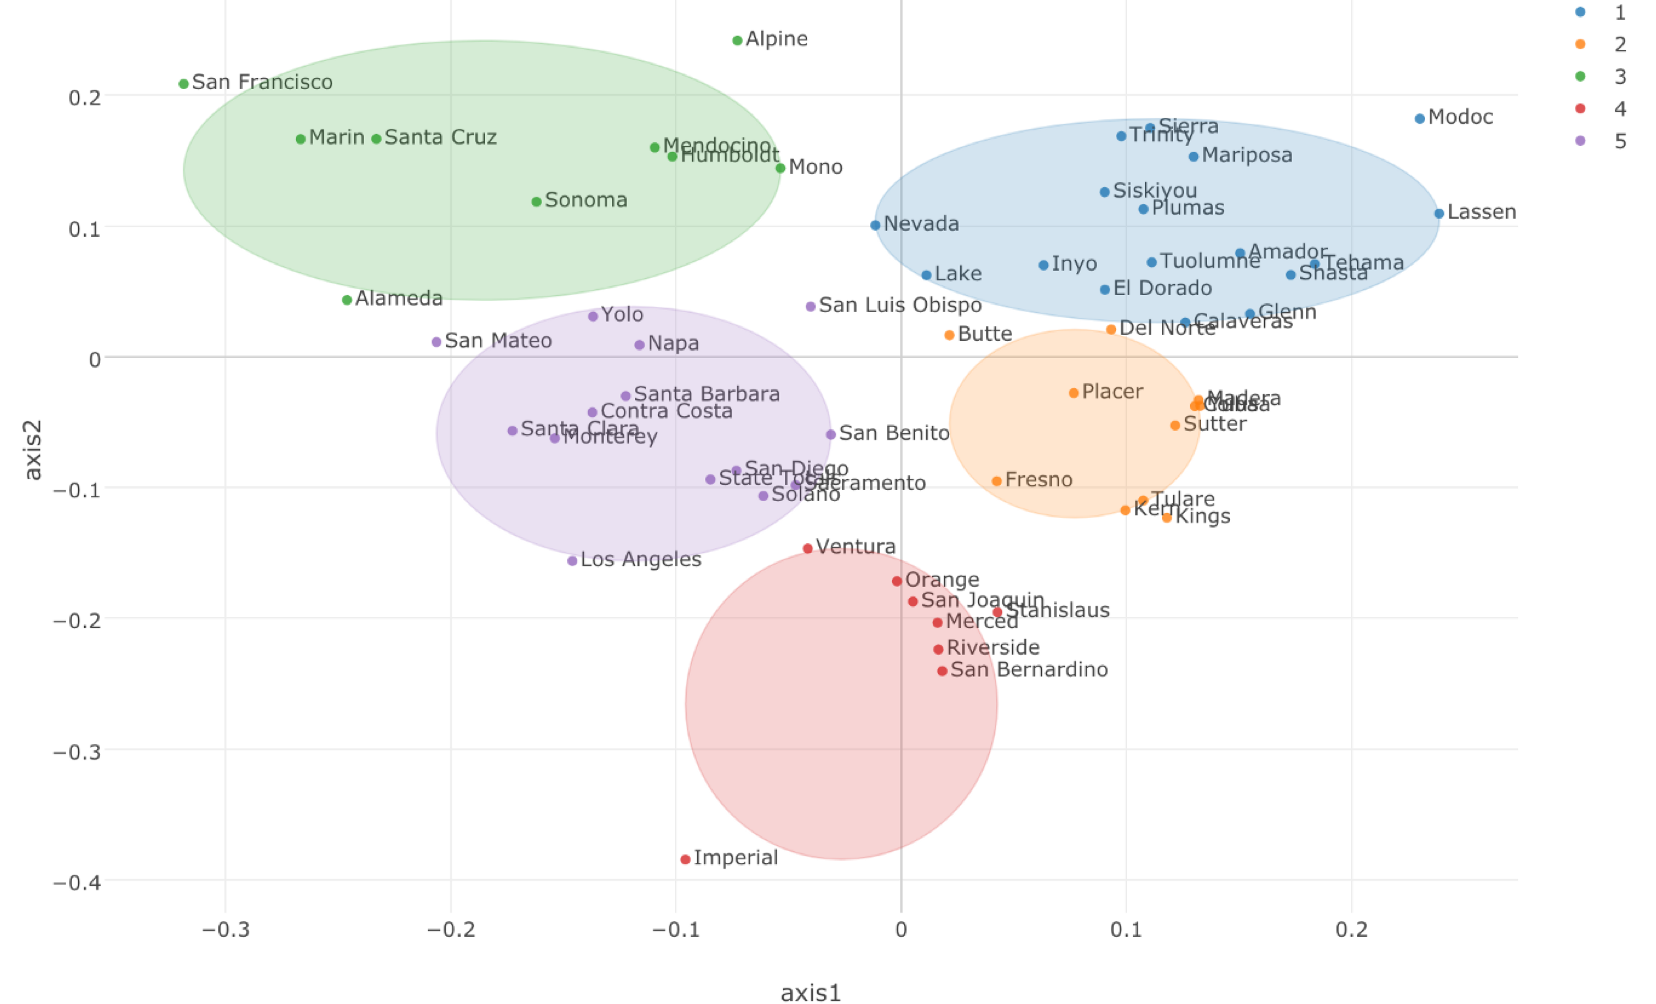
You will learn Distance, MDS, and K-means clustering algorithms and how to use them to understand the relationships among the categories quickly.
Hands-on: Finding similarities among customers based on their past product purchase history and creating customer segmentation for a better targeted marketing campaign.
Day 4 - Gaining Insights by Machine Learning Algorithms - Part 1
9:00AM - 10AM PT / 5:00PM - 6:00PM PT
Regression Analysis - Introduction to Regression Algorithm
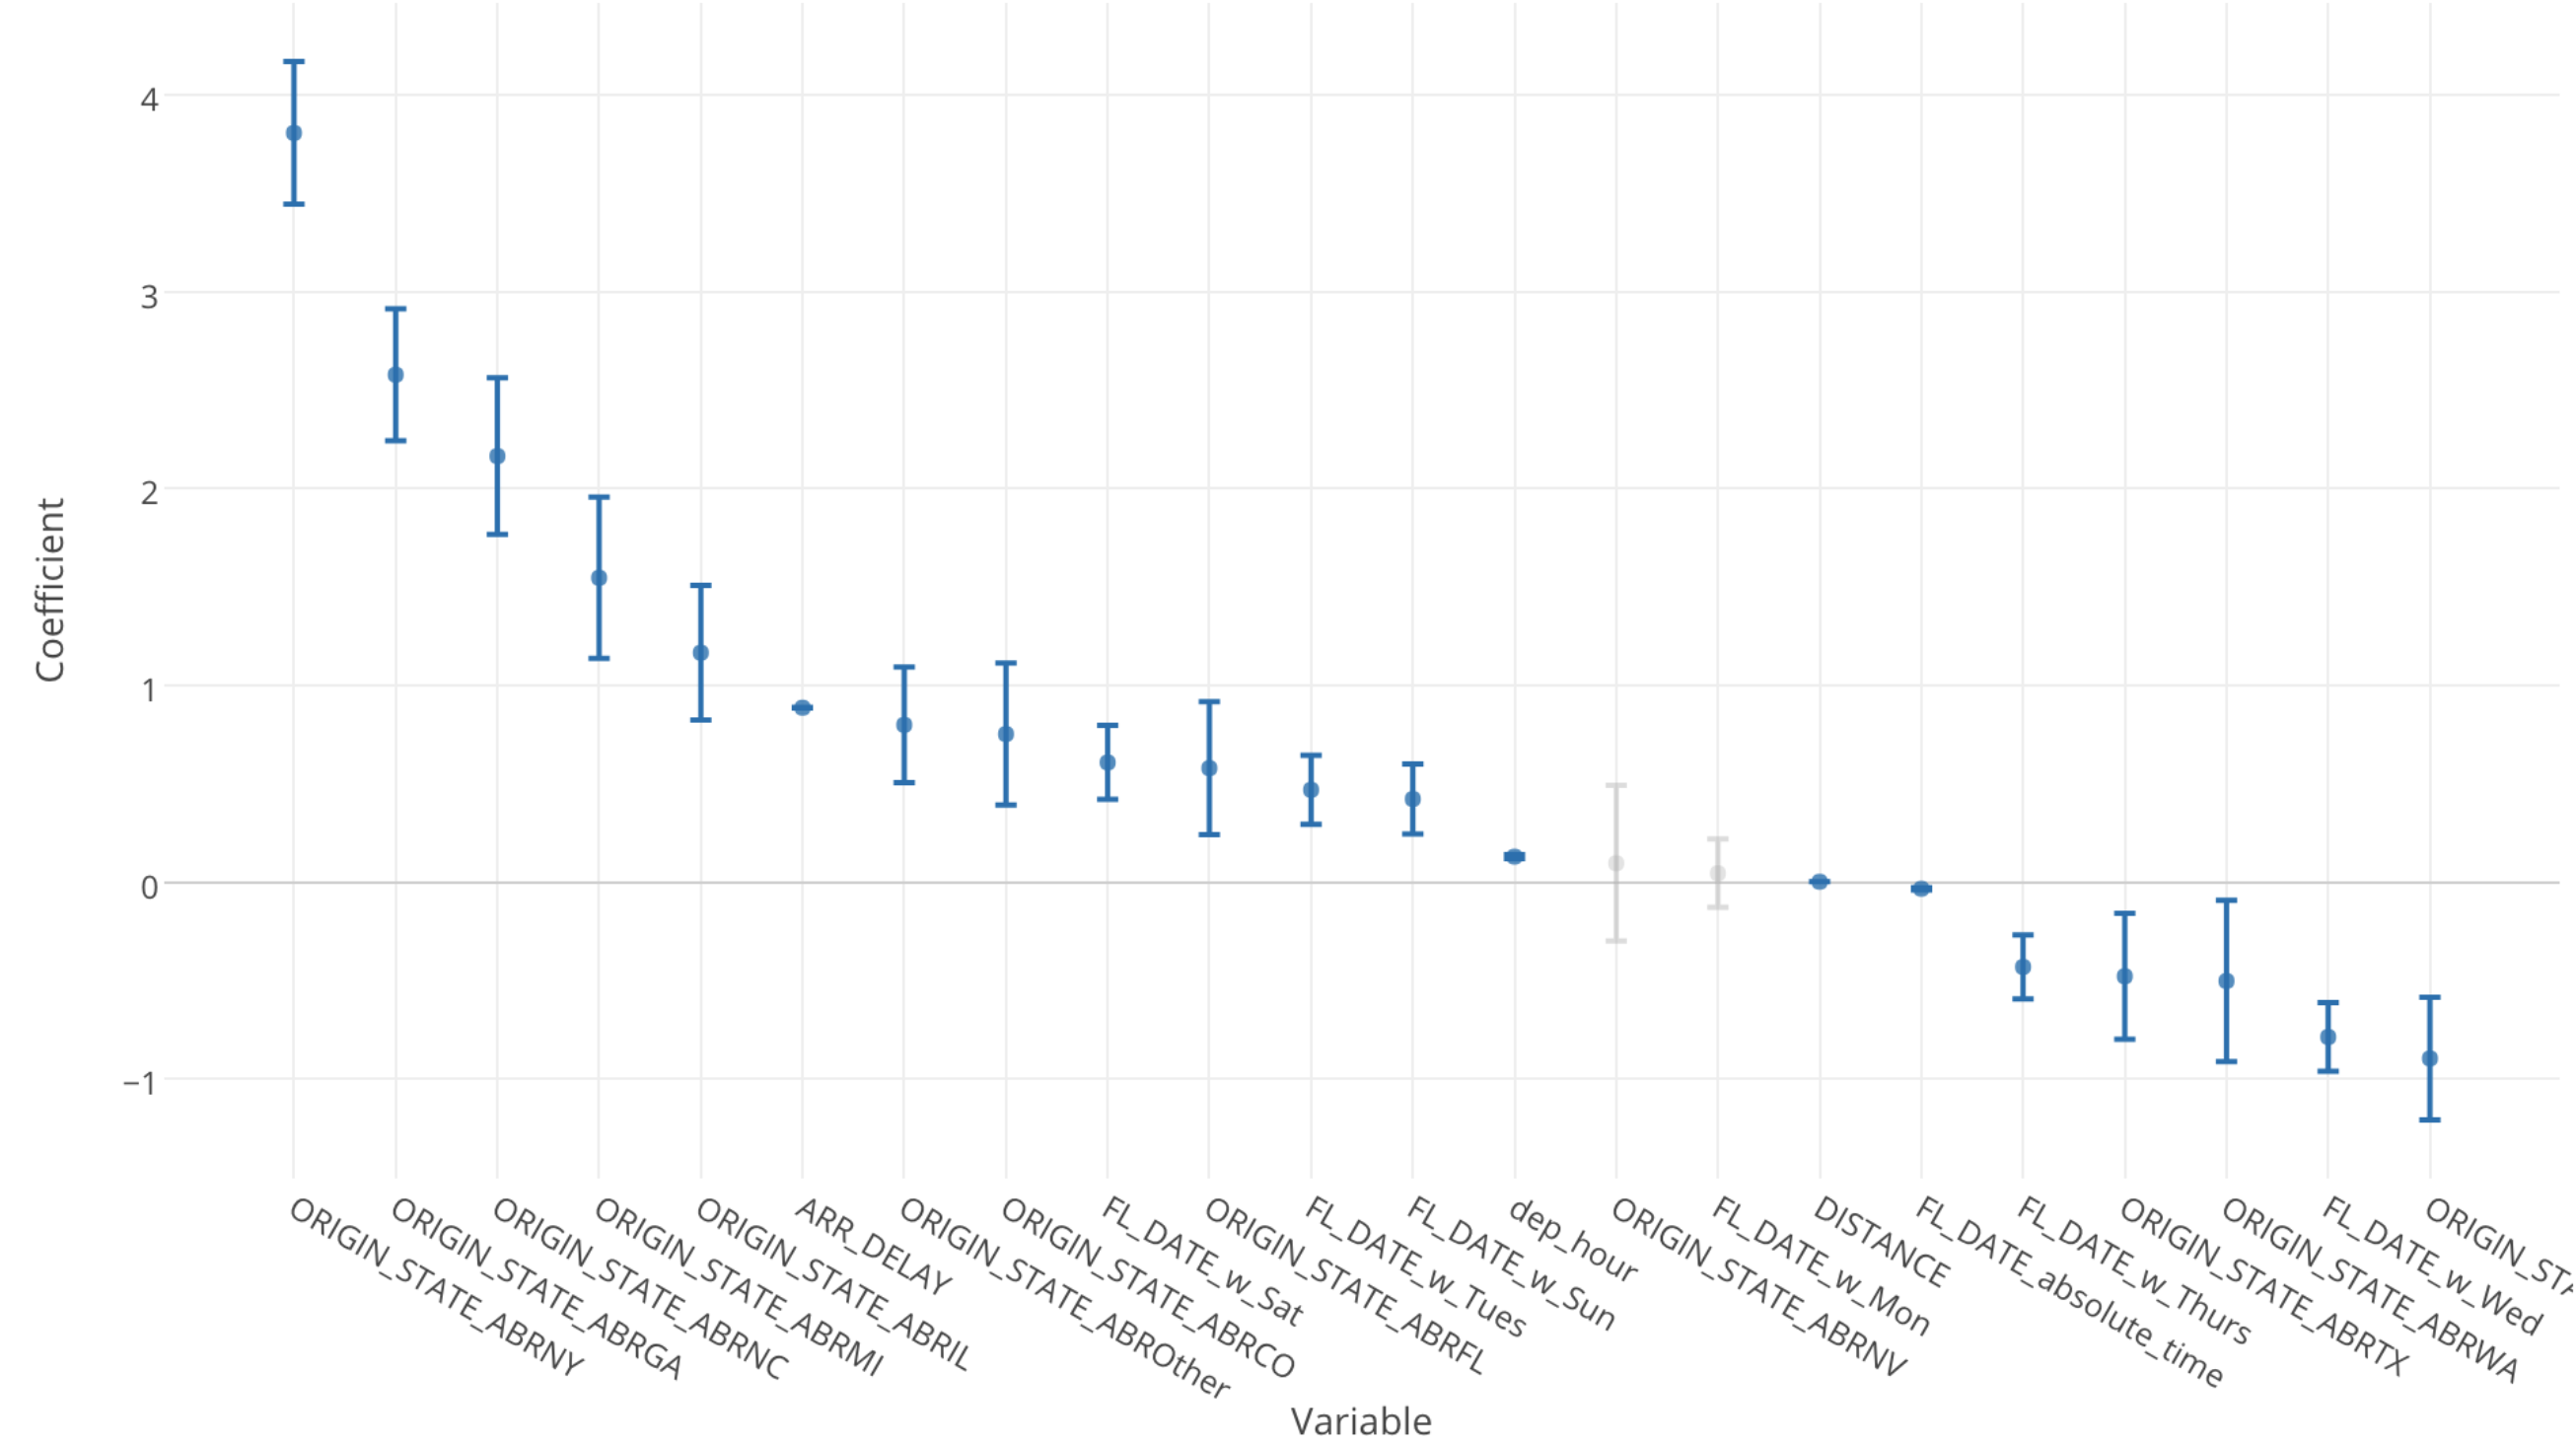
You will learn how to understand relationships among variables and the effect of each variable to one another by using the most commonly used algorithms - Linear and Logistic Regressions.
Hands-on: Predict customer purchase amount based on some of the attributes such as, the time spent on the web site, locations, date and time, past purchase history, etc.
10:00AM - 11:00AM / 6:00PM - 7:00PM PT
Variable Importance Analysis - Introduction to Classification and Random Forest Algorithm
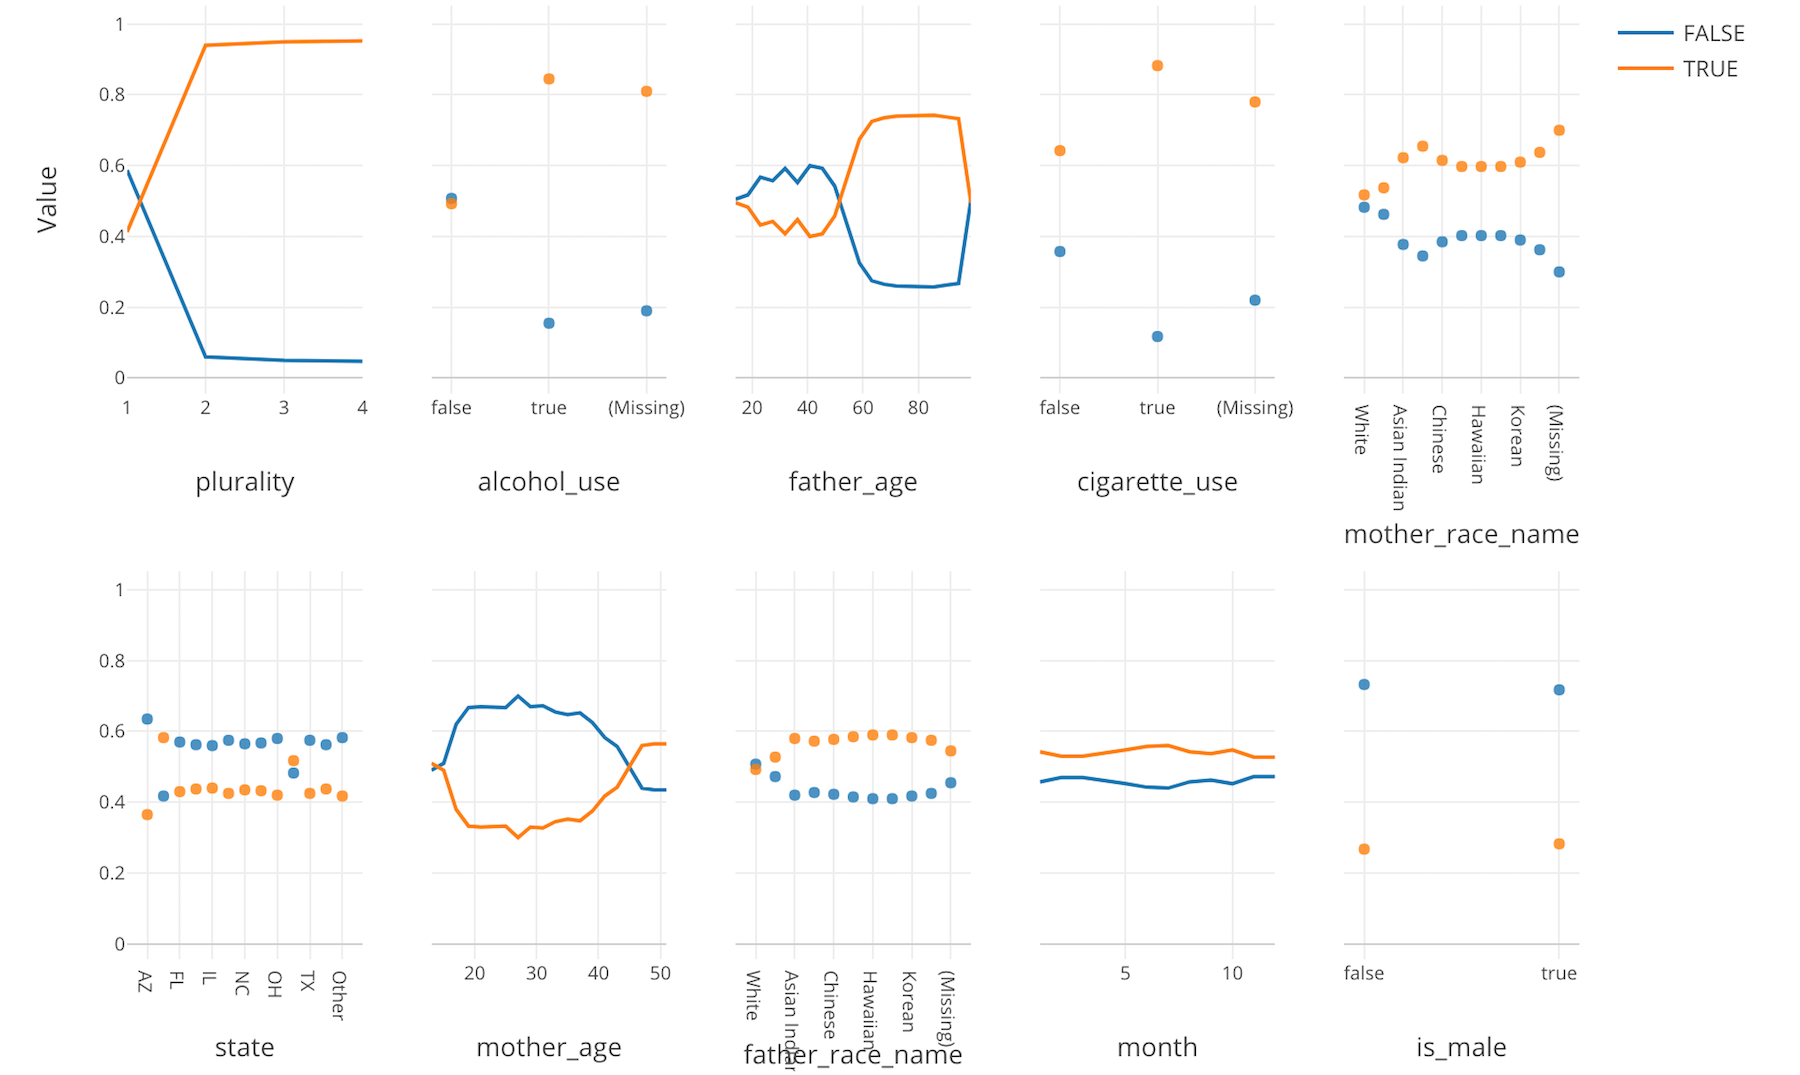
You will learn how to use one of the most popular Machine Learning algorithms among data scientists - Random Forest - to understand what are the key factors that you want to pay attentions to in order to get your desired outcomes.
Hands-on: Discover what product features and customer attributes help customers convert to paid customers.
Day 5 - Gaining Insights by Machine Learning Algorithms - Part 2
9:00AM - 10AM PT / 5:00PM - 6:00PM PT
Time Series Forecasting - Introduction to Prophet Algorithm
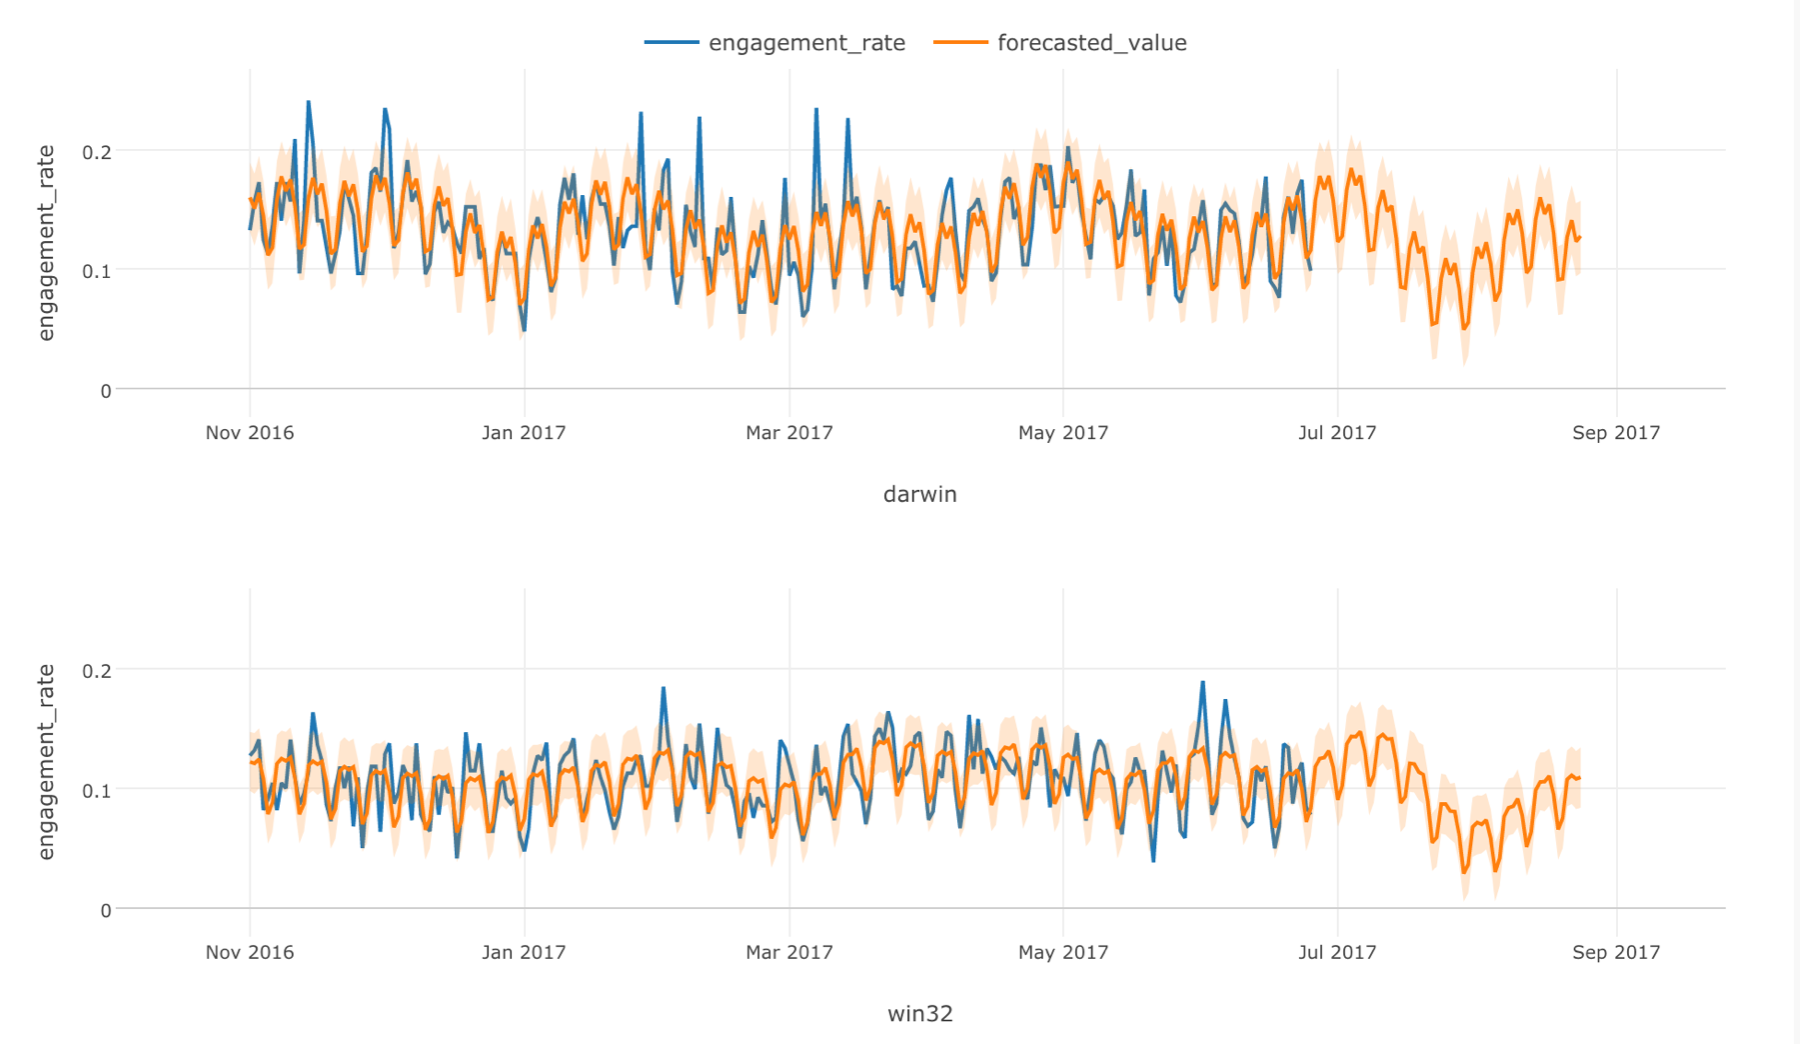
You will learn how to forecast for time series data by building forecasting models.
Hands-on: Predict the web site traffic over the next 3 months based on the historical data so that you can prepare your team by allocating required resources better.
10:00AM - 11:00AM / 6:00PM - 7:00PM PT
Cohort Analysis - Introduction to Survival Analysis Algorithm
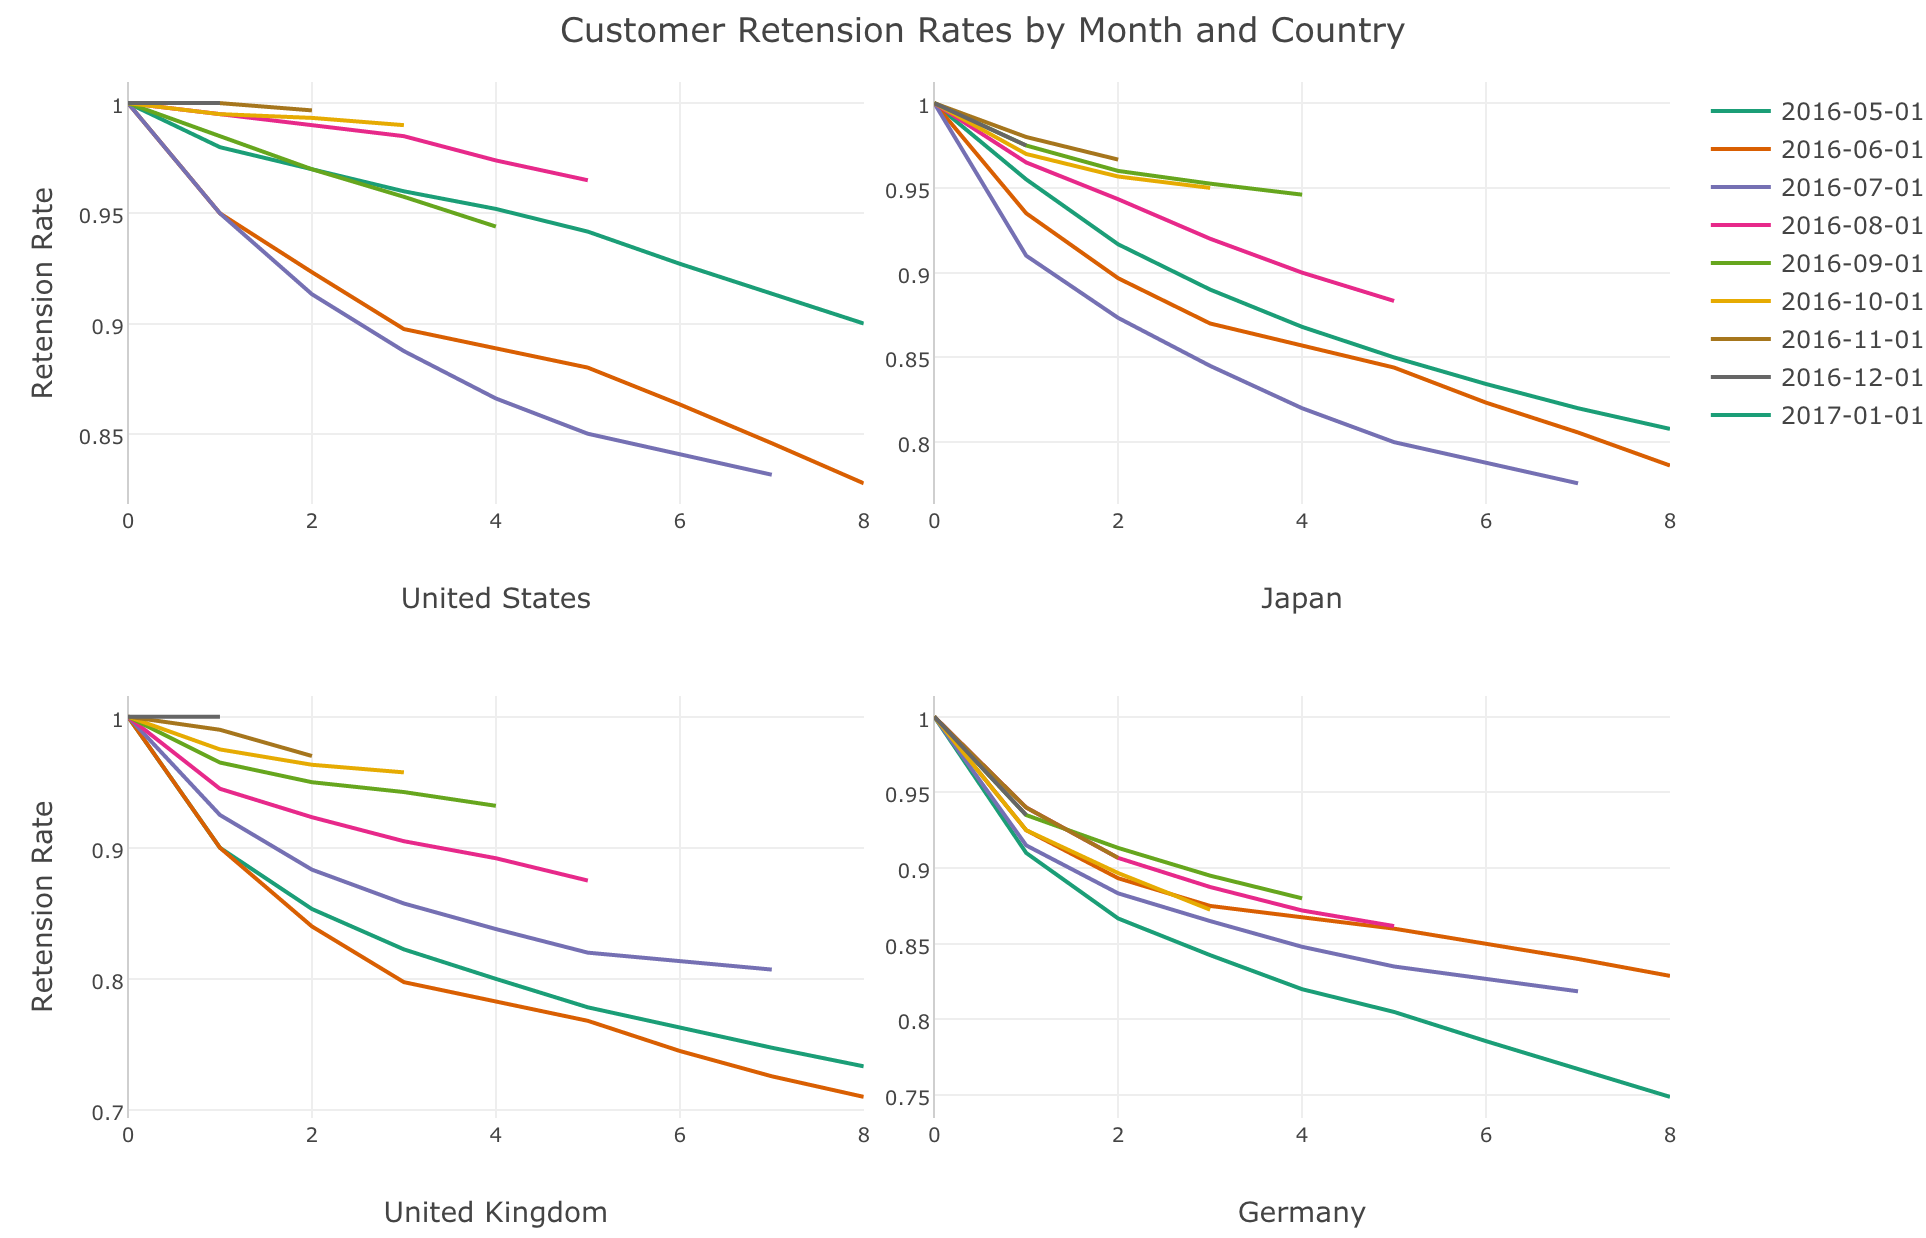
You will learn how to estimate survival rates by different cohorts (groups) by applying Survival Analysis algorithm.
Hands-on: Discover which cohorts are showing better (or worse) customer retention rates and what makes difference between the converted users and the not-converted.
11:00AM - 11:30AM 7:00PM - 7:30PM PT
- Q&A
- Summary
- Advise on further reading and practice
After Training
- Office Hours for the Training Participants to Drop in
- One-on-One Meeting for Consultation / Mentoring
- Chat at Slack and at Exploratory’s website for questions and answers
- Monthly Update with the latest news in Data Science to keep your knowledge/skill up to date
After the training, we will schedule an Office Hours (3 hours) during which we make ourselves available for answering at Slack channels and at interactive web conference sessions. You can also book one hour of one-on-one meeting with us to discuss your questions and challenges with your data. We’d encourage you to take advantage of these opportunities to maximize the values of the training.
This training is designed to boost your Data Science skills so that you can start using Data Science methods right after the class. But the field of Data Science is huge and it is evolving rapidly every day. Becoming better at Data Science is a journey of continuously learning new techniques and algorithms, just like learning any other professions. We are here to help you making the journey as satisfying, valuable, and most importantly FUN!
Training Methodology
The training is delivered entirely online over a period of 5 days. It consists of a series of one hour length modules. You will finish two modules a day throughout the 5 days by learning and exercising various Data Science methods ranging from Data Wrangling, Data Visualization, Statistics, and Machine Learning.
On-line Live Chat is available throughout the training hours. Training group channel is also available at Slack for discussions and questions even outside of the classes.
We recommend you to reserve a minimum commitment of 3 hours a day for joining the live on-line sessions and completing the exercise section for each module.
Every live session will be recorded and available for the participants to review it later. The participants can keep all the training materials for reviewing them later. However, it is prohibited for commercial uses or re-distribution.
Instructor
Kan Nishida (CEO/Exploratory)
Led development teams to build various Data Science products including Machine Learning, BI, Data Visualization, Mobile Analytics, Database, etc. as a development director at Oracle, while building a team to provide training and consulting services to equip teams at Fortune 500 companies with Data Science skills. Beginning of 2016, started Exploratory to make the rapid pace of the advancements in Data Science accessible to 99% of people around the world. As a CEO and Chief Product/Education Officer, he’s spending most of his time making Data Science more accessible and easier by building tools and teaching.
Who Are We?
We had worked at some of the biggest enterprise software companies in Silicon Valley for building Data Science products and solutions for about twenty years before starting Exploratory, but never seen anything of this scale and speed of innovation that is currently undertaking in the world of Data Science in the last decades. Fortunately, much of the advancements are happening in Open Source communities so they are available to anybody. Unfortunately, much of such advancements have been locked in the form of computer languages (e.g. R, Python, etc.). So practically speaking, only the people with programming skills have been benefiting from such advancements, but people without the skills have not. And this has created a massive gap between them in terms of the qualities of decision making based on data.
We wanted to change that by building a simple and cohesive UI experience for Data Science so that more people can access such advancements and gain deeper insights from their everyday data to maximize their business and career opportunities. And that is Exploratory, a tool that connects the modern Data Science and people without programming skills. Since we started in March 2016, we have now over 12,000 registered users in 86 countries all around the world who are making better decisions by understanding their data effectively.