A Quick Introduction to Random Forest Algorithm
Random Forest is one of the most popular machine learning algorithms and often used in Exploratory Data Analysis to find the relationship among the variables.
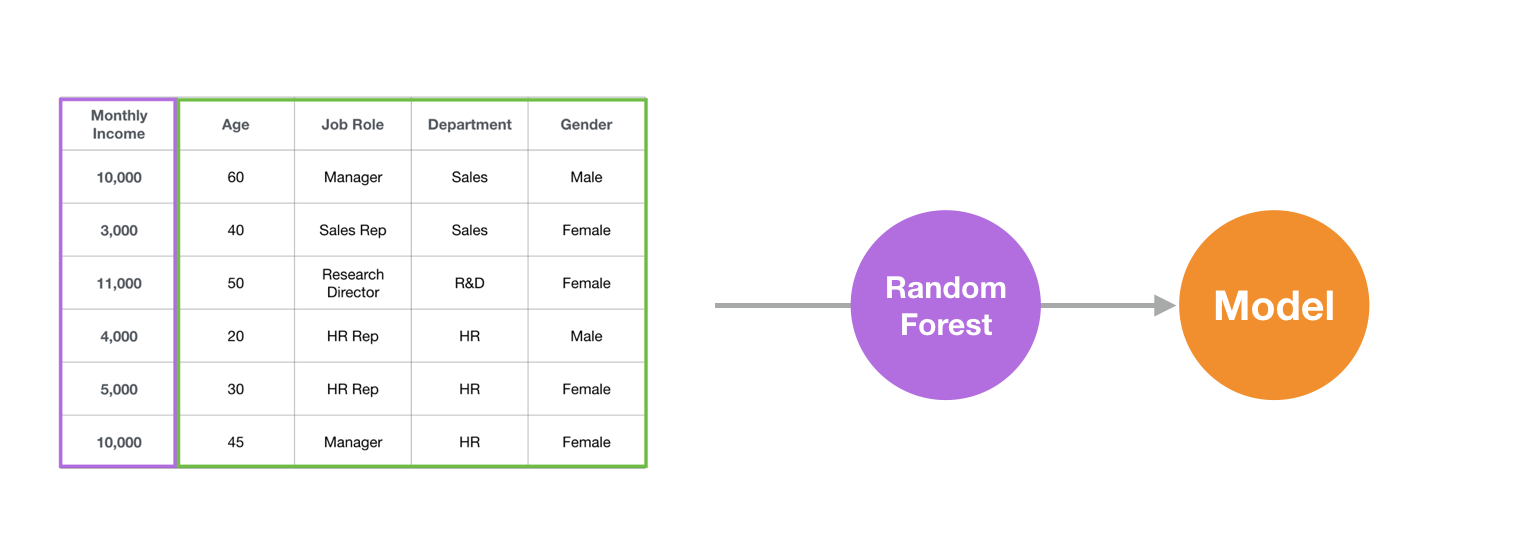
For example, let’s say we want to predict the Monthly Income for a set of employees that we don’t know their monthly income yet.
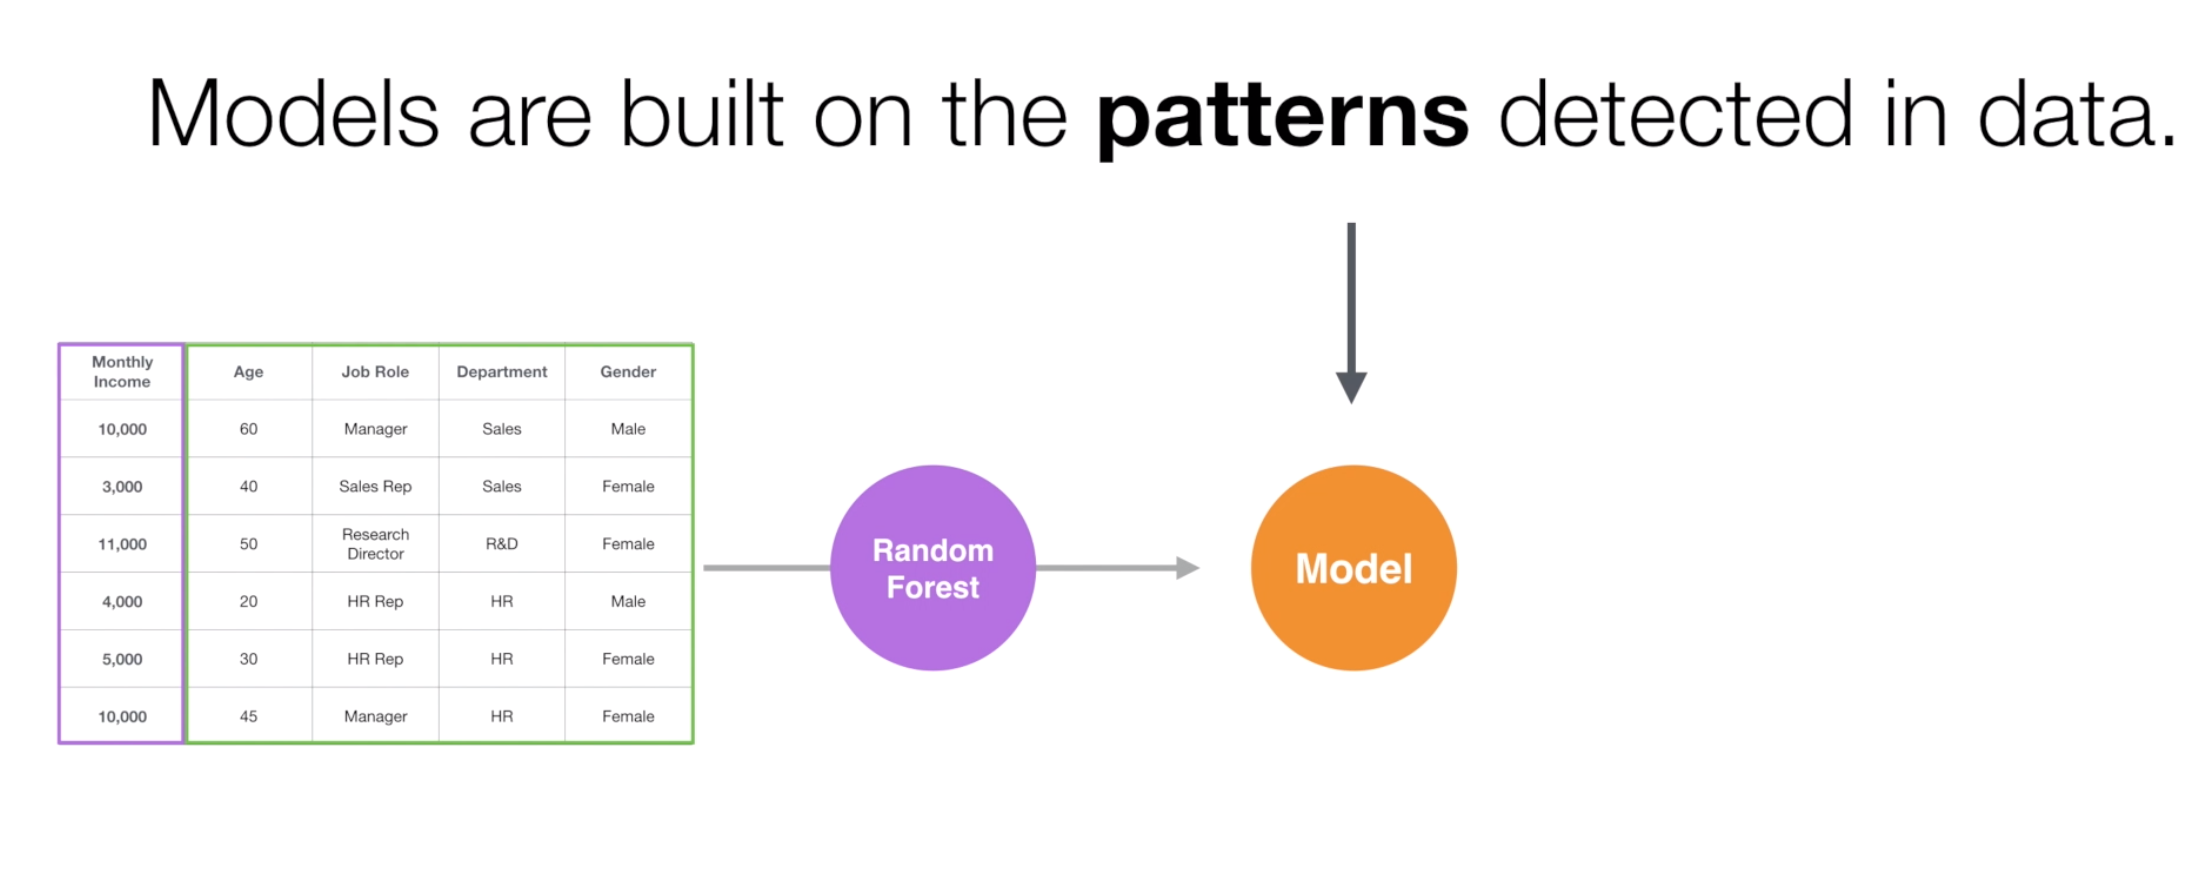
We can give the employee data to the Random Forest algorithm, then it will analyze the data, find out the patterns, and build a prediction model, which is basically a set of rules.
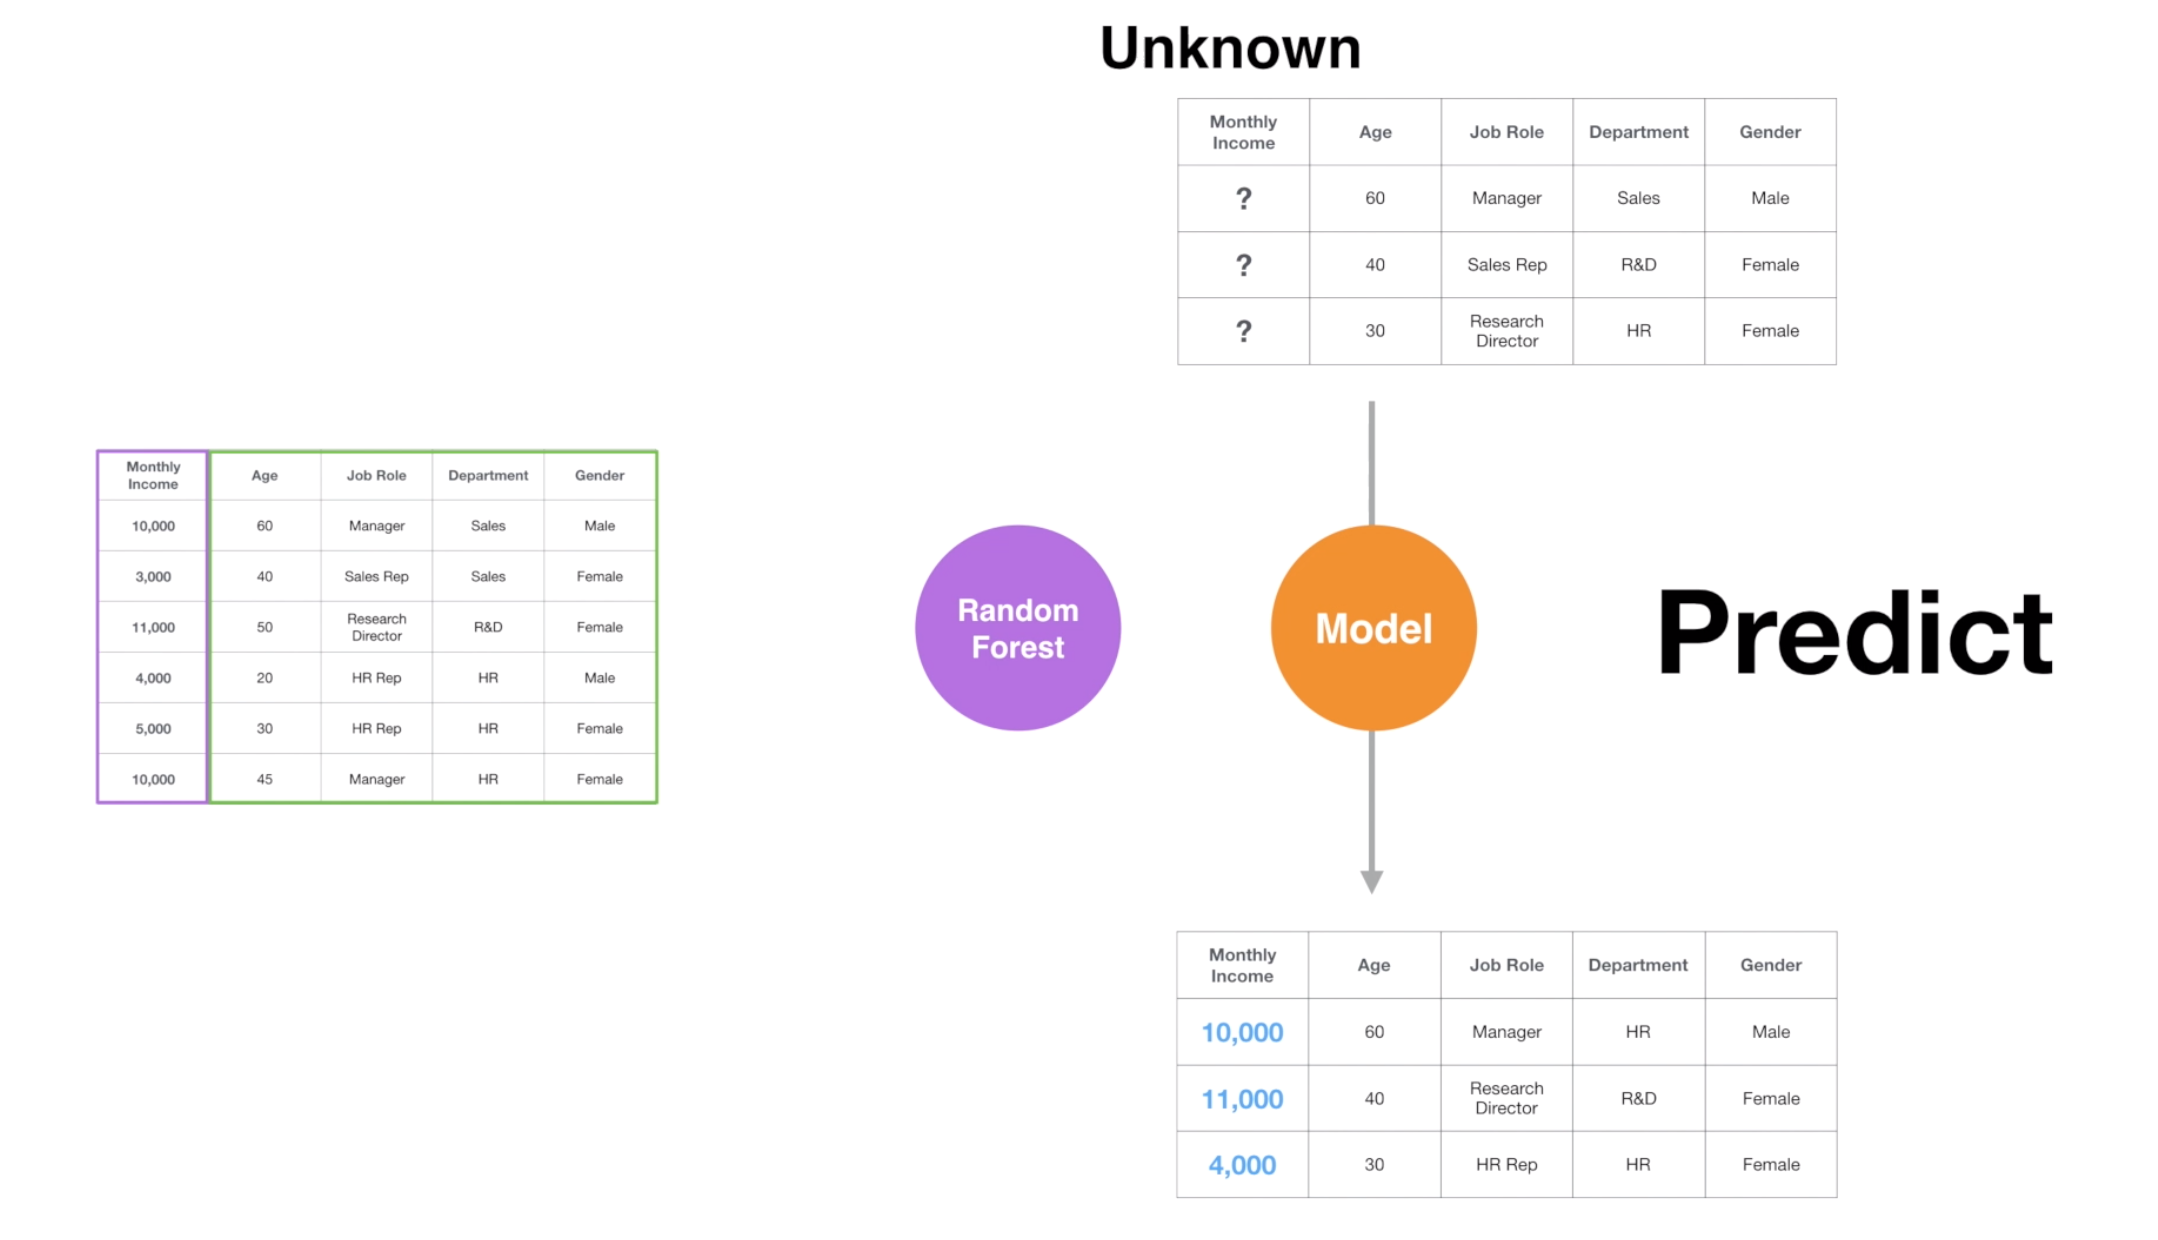
Once the model is created, we can give a new set of employees that we don’t their Monthly Income yet, then it will predict the Monthly Income for the new employees by using the rules defined in the model.
But predicting for the new data is not the only thing Random Forest can do. The model created by the Random Forest can give us an insight on “Which variables are strongly associated with the increase of decrease of Monthly Income”, which is super helpful especially at the Exploratory Data Analysis phase.
Let’s use the employee data and explore what makes the employees’ monthly income higher or lower by using Random Forest.
Sample Data
We’ll use HR Employee Attrition data, you can download it from here.
Each row represents each employee in this data.
Use Random Forest
First, go to Analytics view.
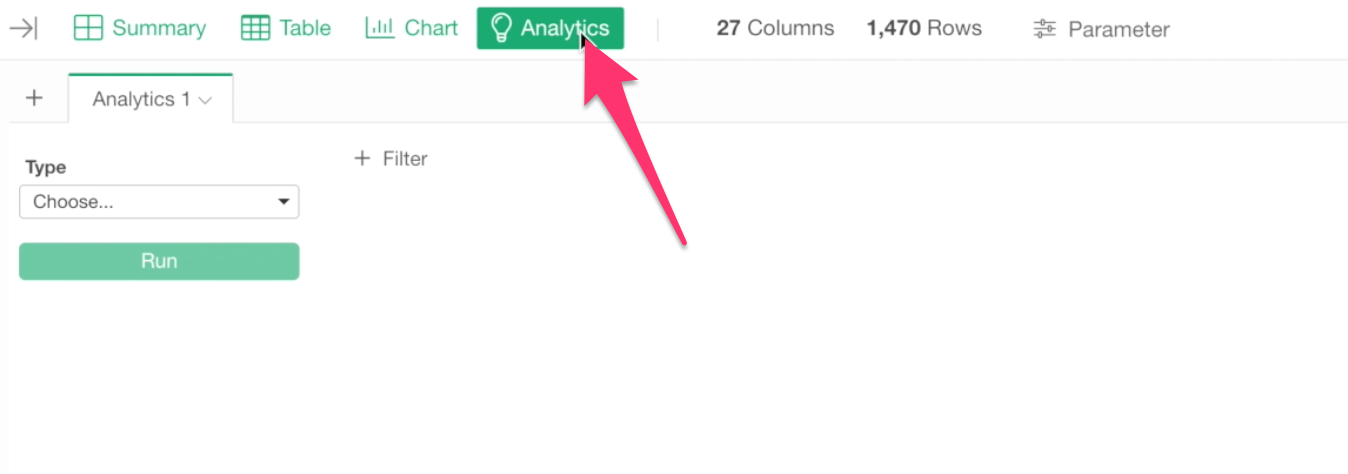
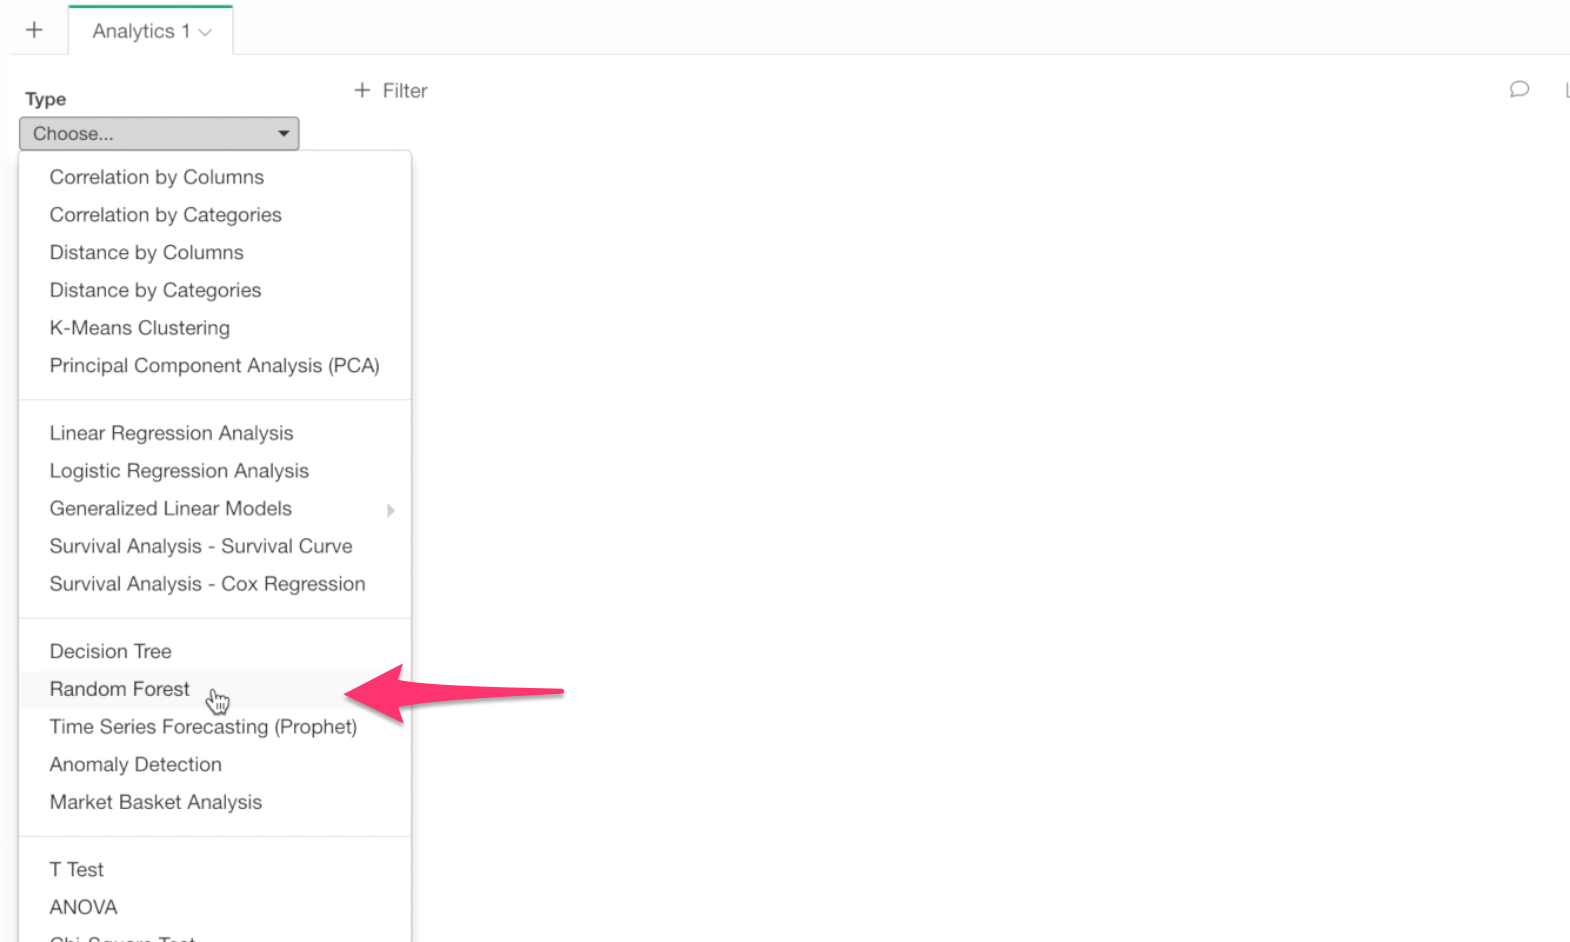
And select Random Forest for Analytics Type.
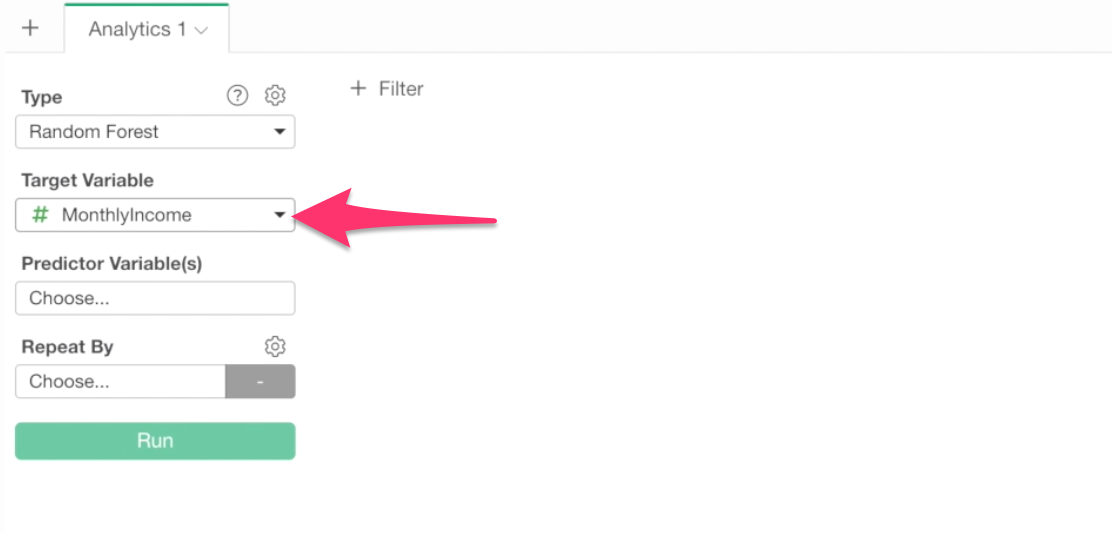
Select Monthly Income for Target Variable because this is the variable of our interest in this analysis.
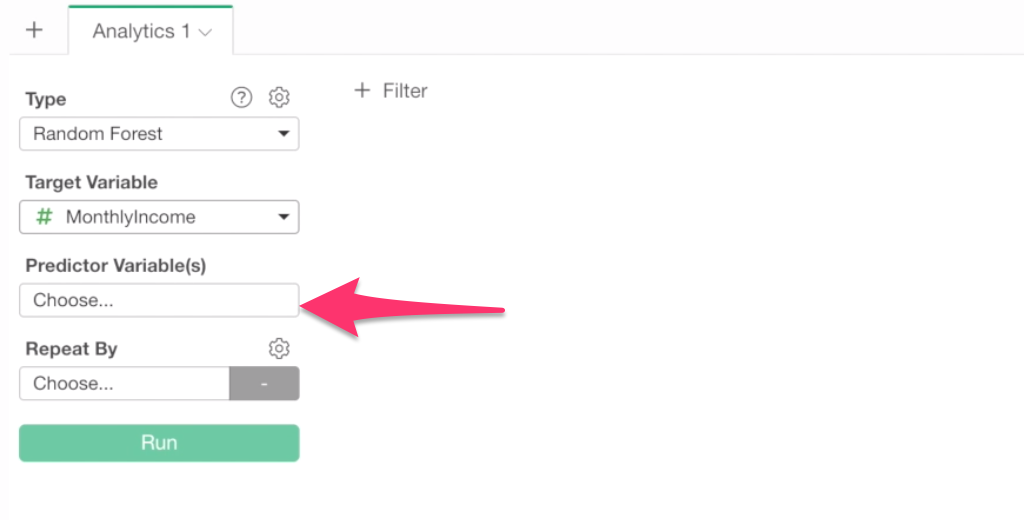
And, Click on Predictor Variable box to select columns (or variables).
Inside the column selection dialog, select all the columns as predictor variables by using Shift or Control key.
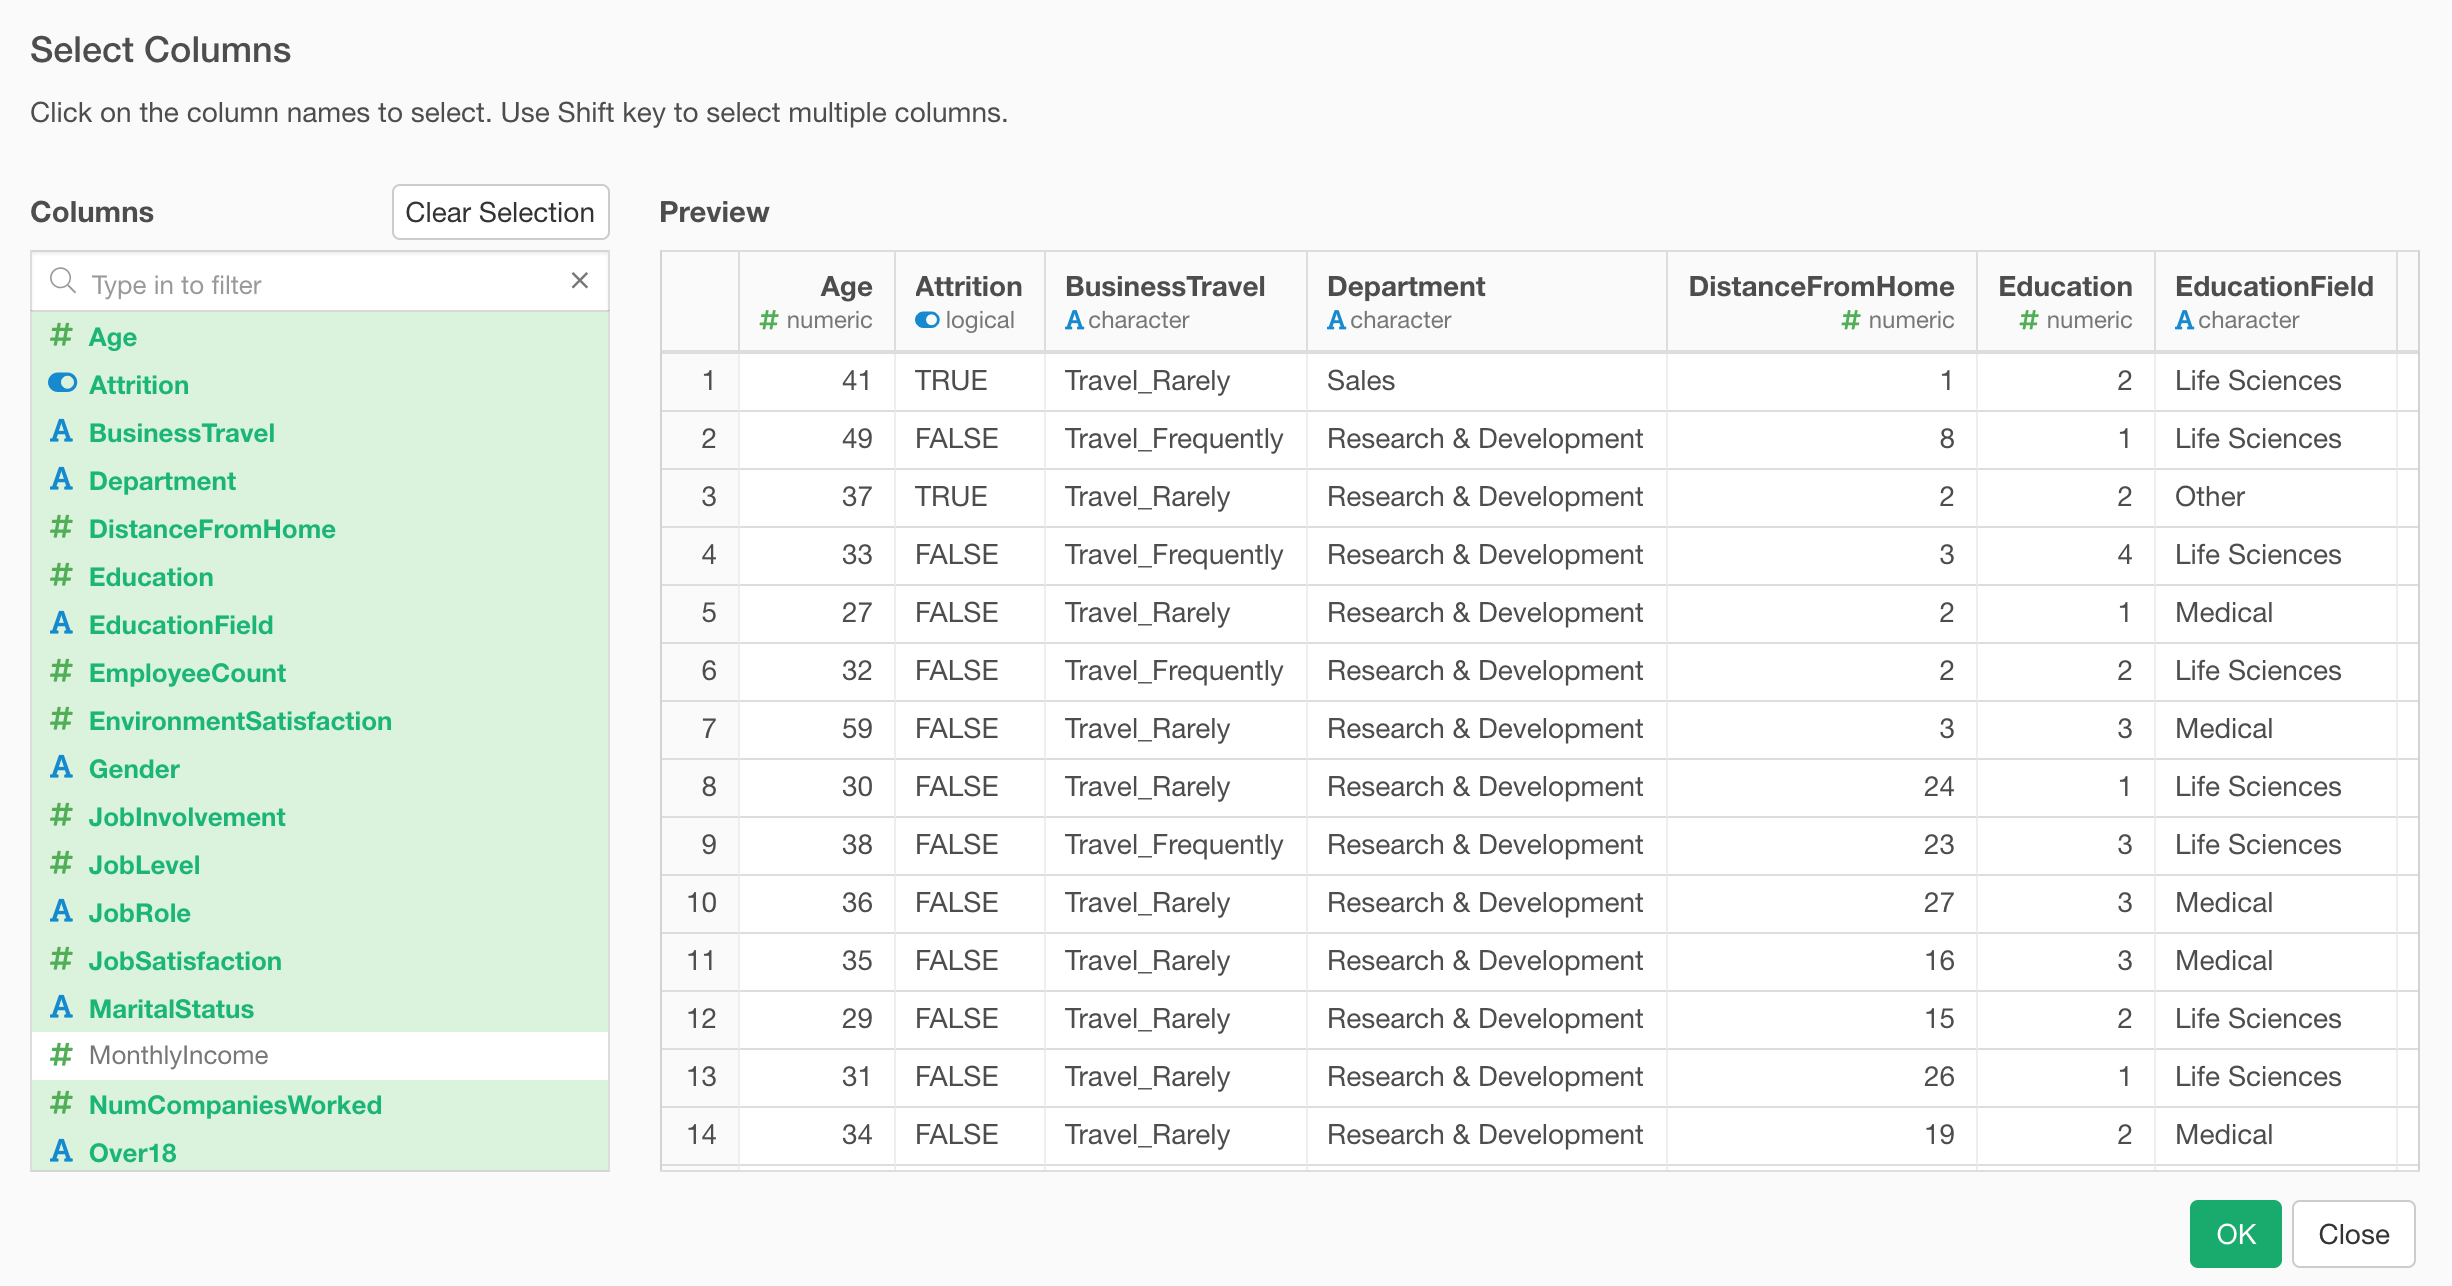
And click the Run button.
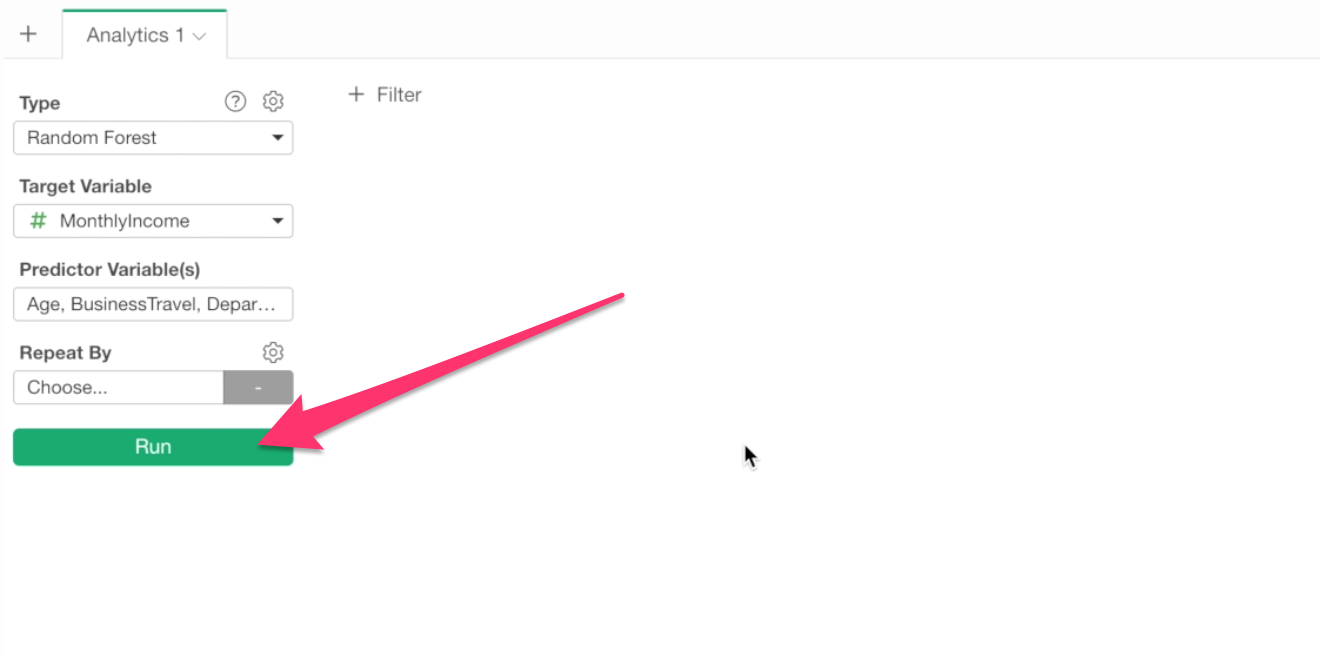
This will create a Random Forest prediction model.
Which variables are more important?
Once it’s done, under the Importance tab we can see which variables are more important or less important to predict the monthly income.
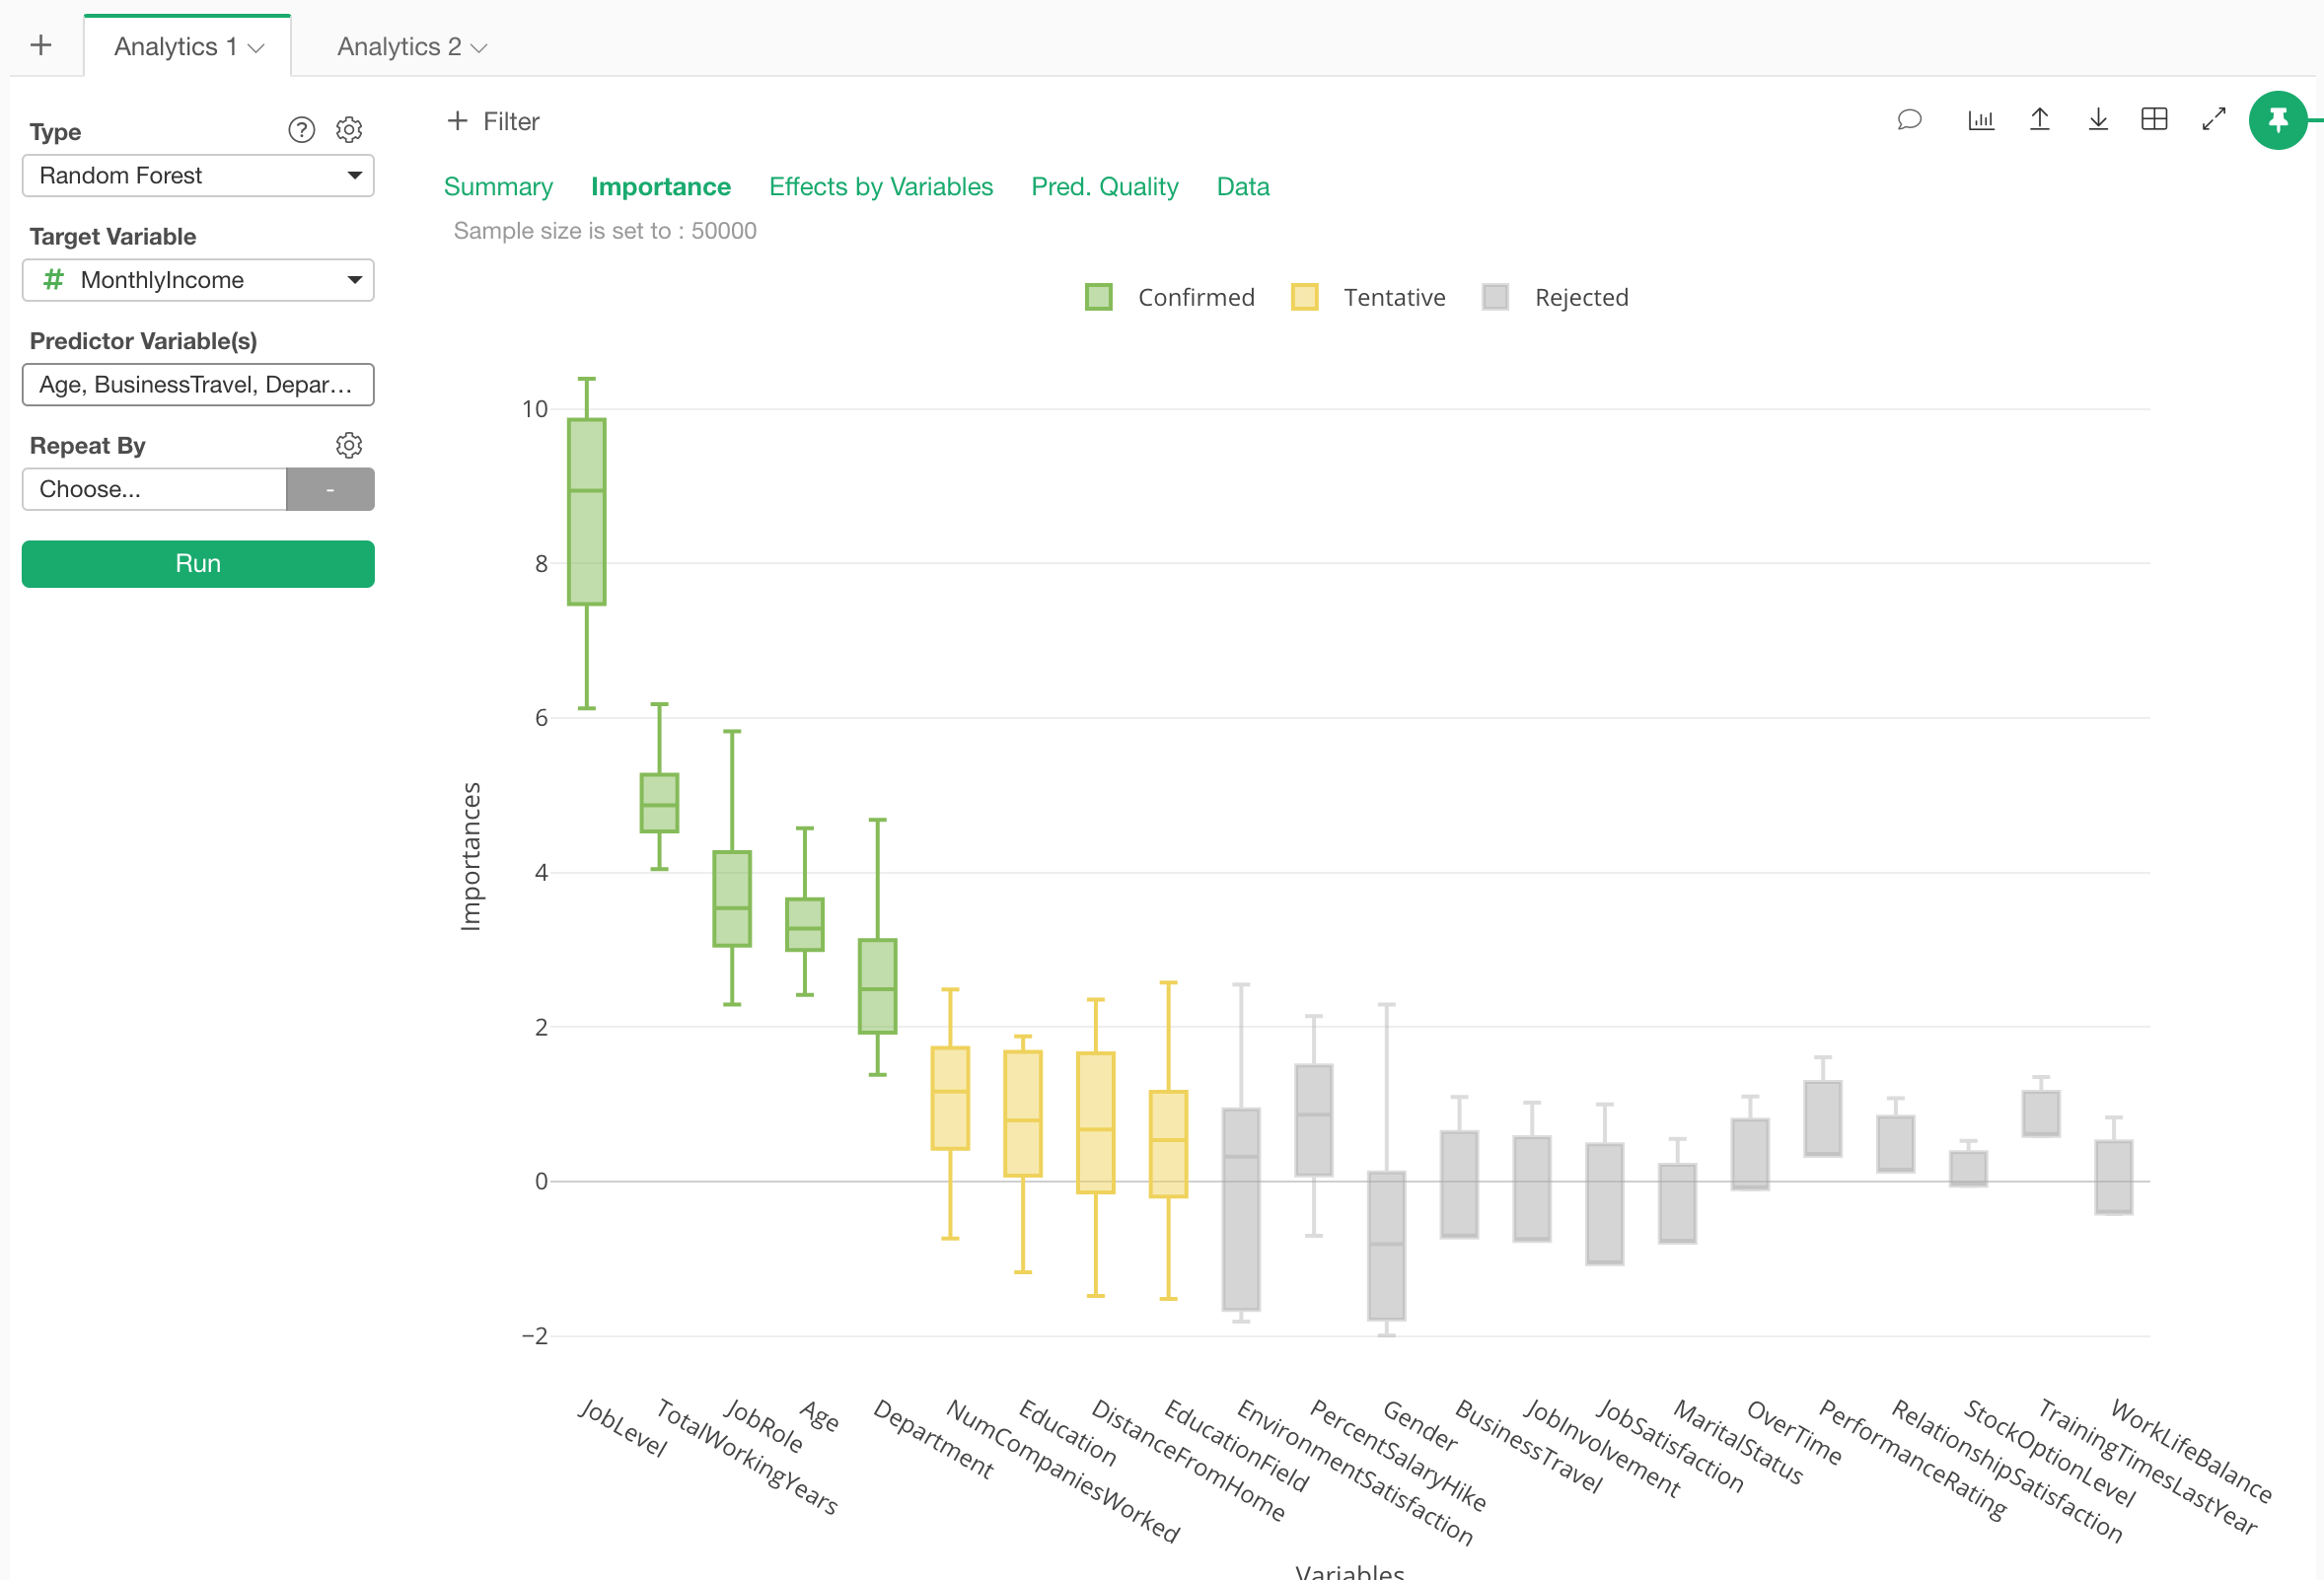
We can see that Job Level, Total Working Years, Job Role, and Age are the most important variables.
The higher the importance scores are the more associated the variables are with the Monthly Income.
How are they associated with Monthly Income?
Now, how are they related to Monthly Income? For example, does the increase in Job Level increase the Monthly Income?
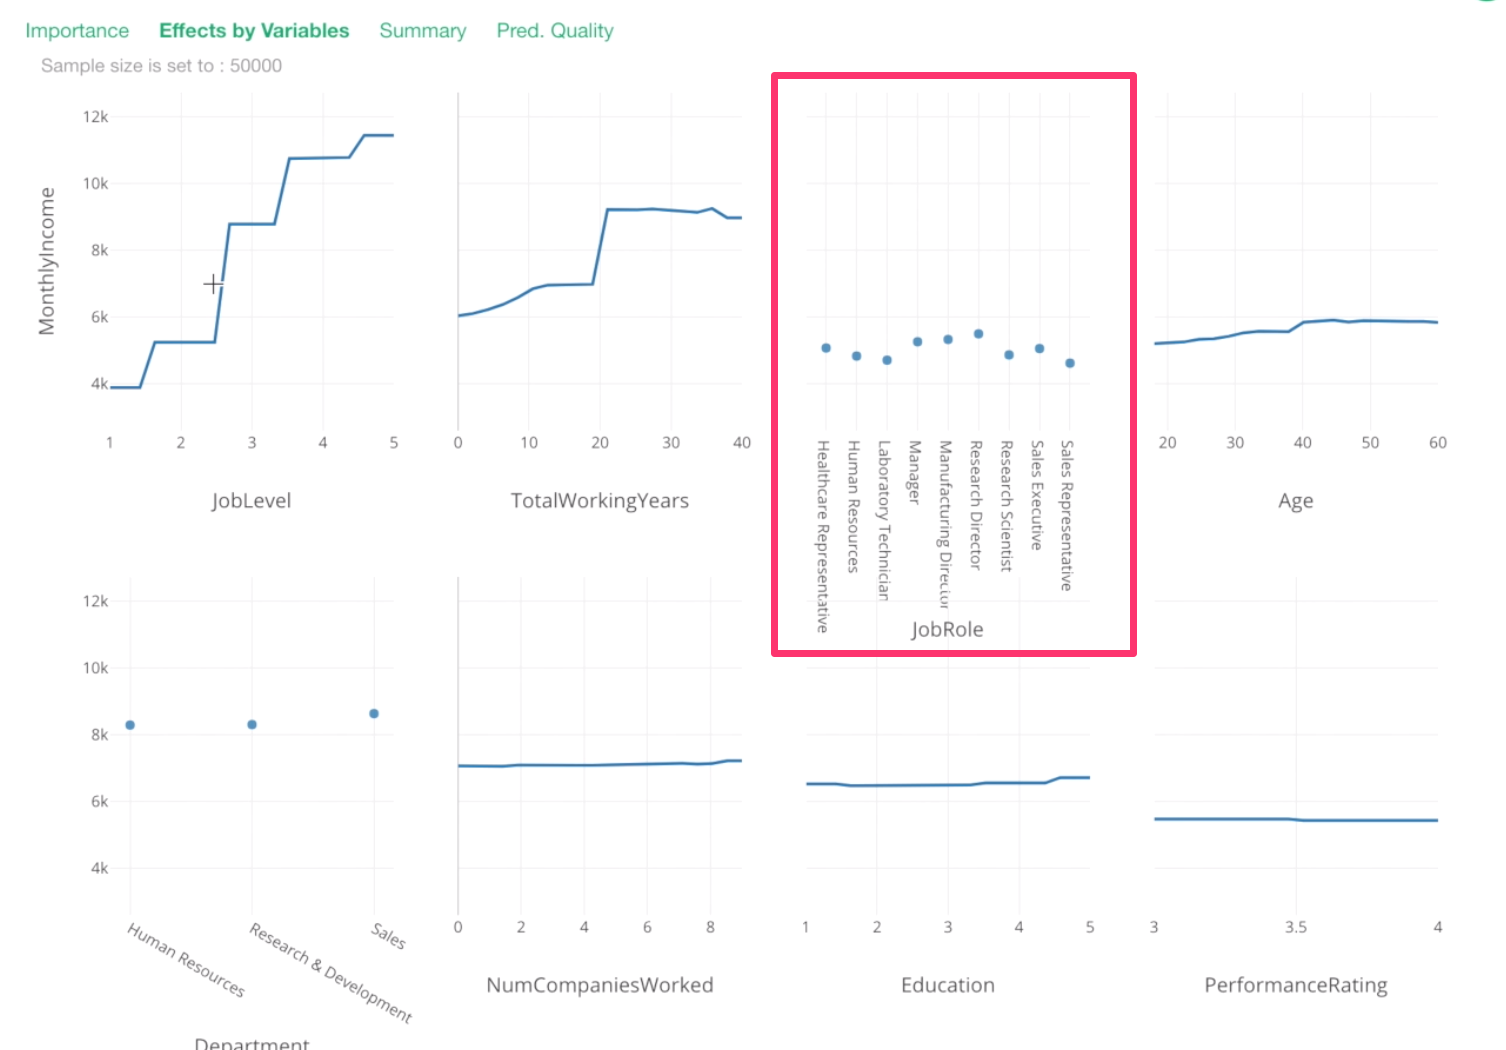
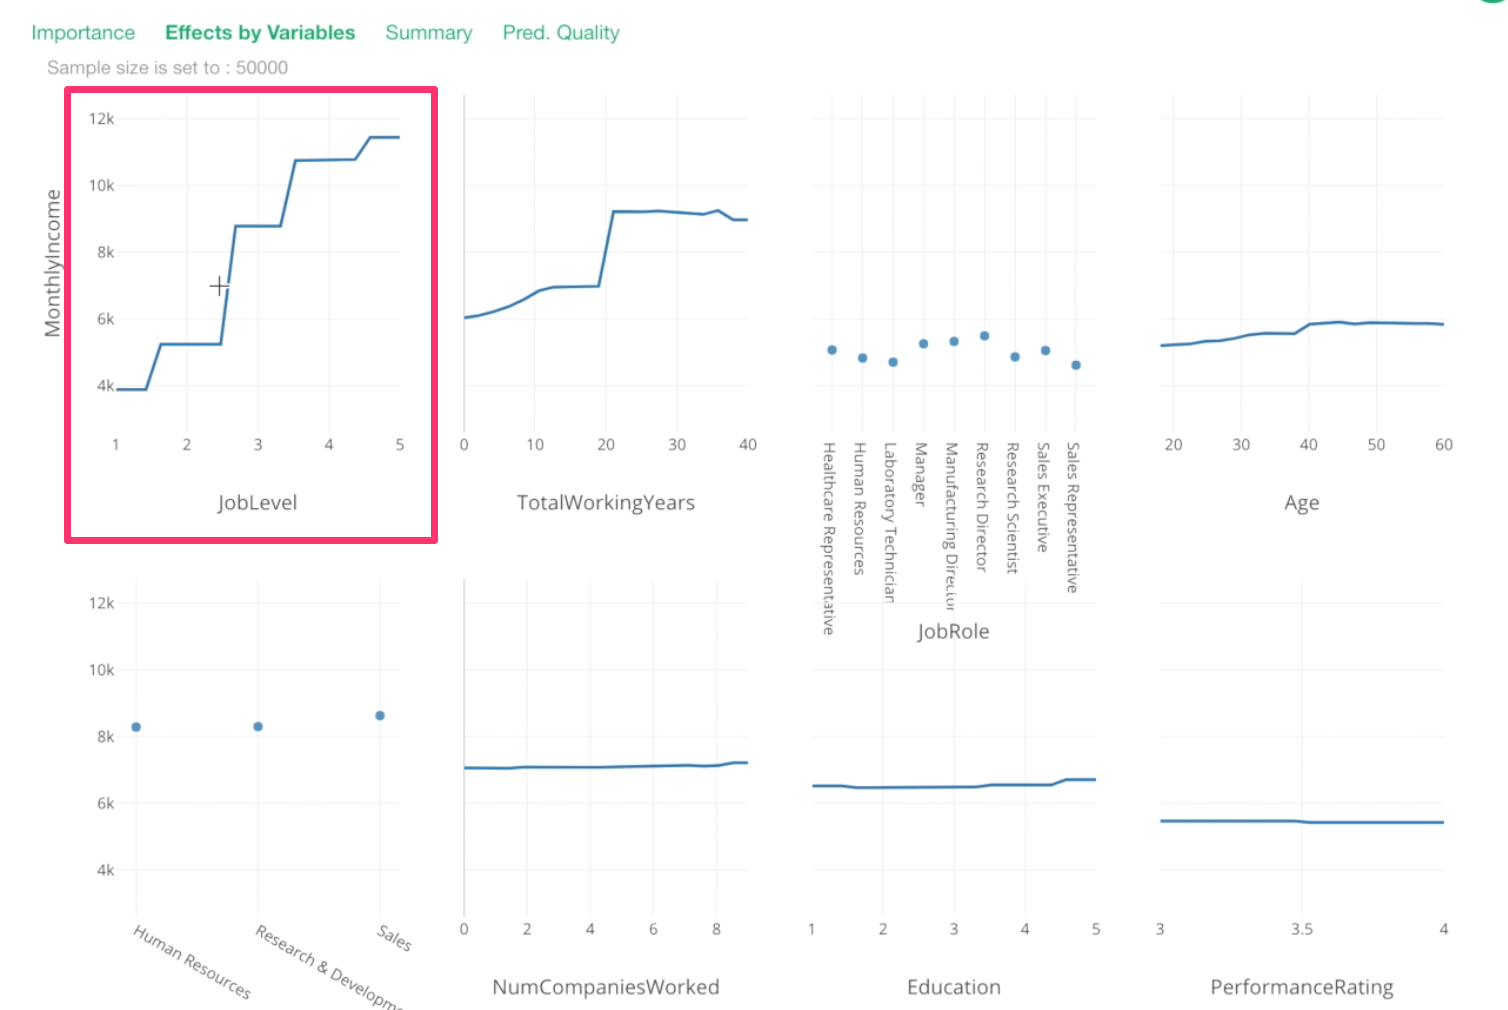
To answer this question, we can go to Effects by Variables tab.
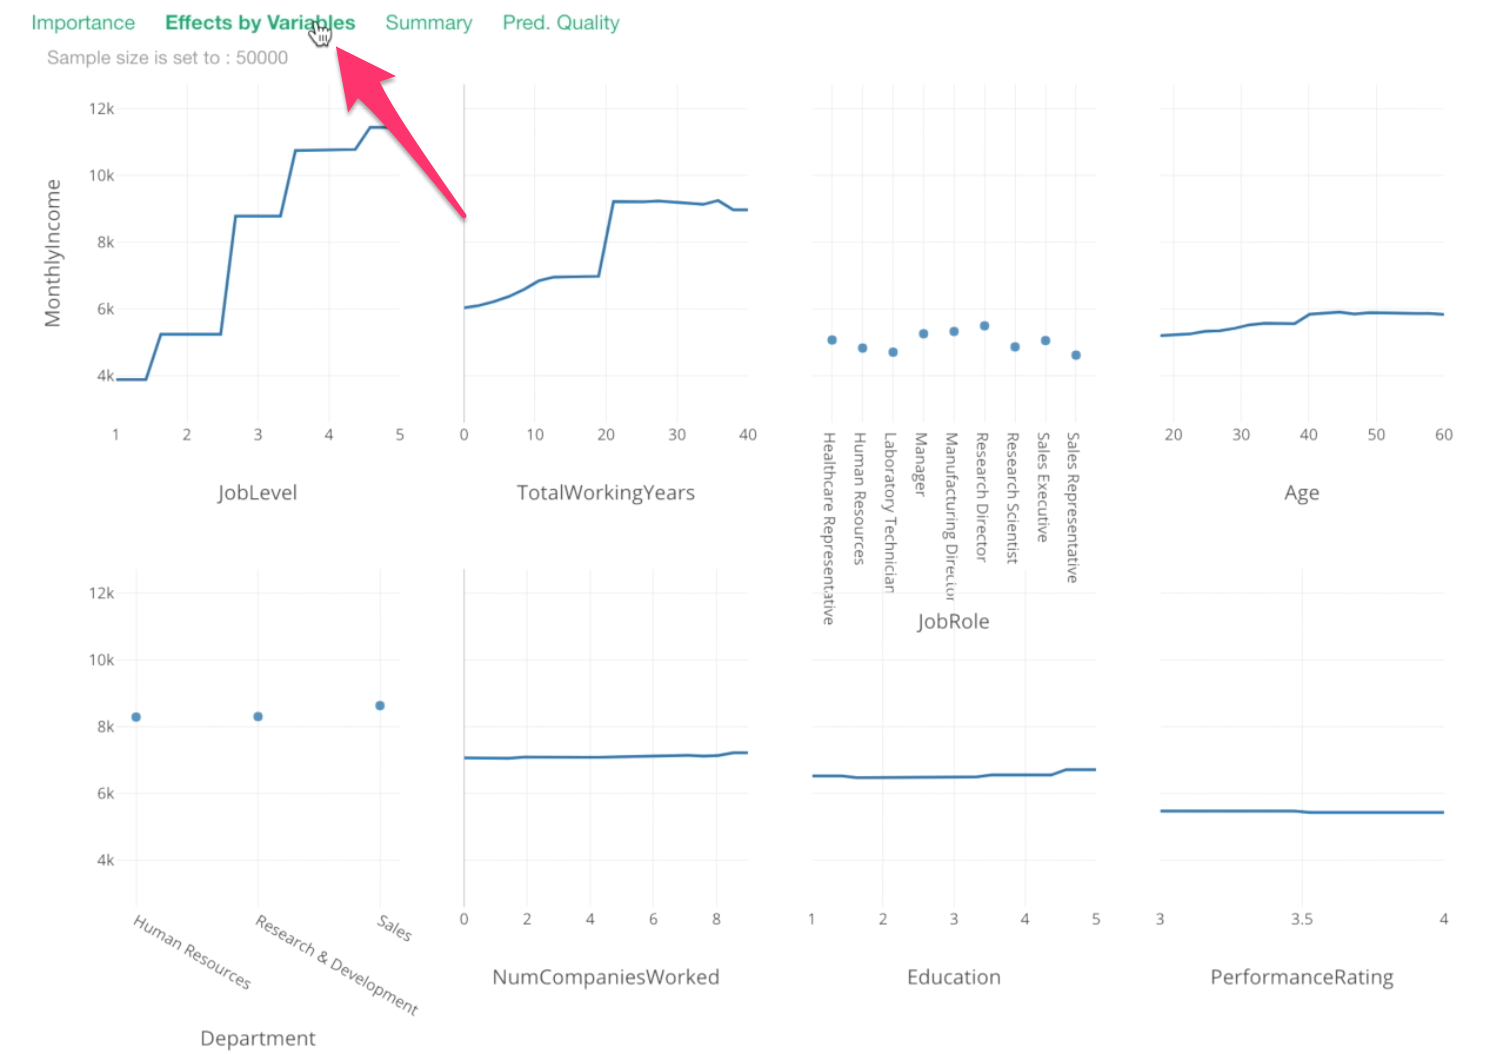
Each chart shows the relationship between Monthly Income and a given variable.
Y-Axis is the monthly income values. And all the data points are showing what the model thinks they would be based on given values on X-Axis.
For example, this Job Level chart is telling us that one job level increase would increase a significant amount of the monthly income.
Let’s take a look at Total Working Years.
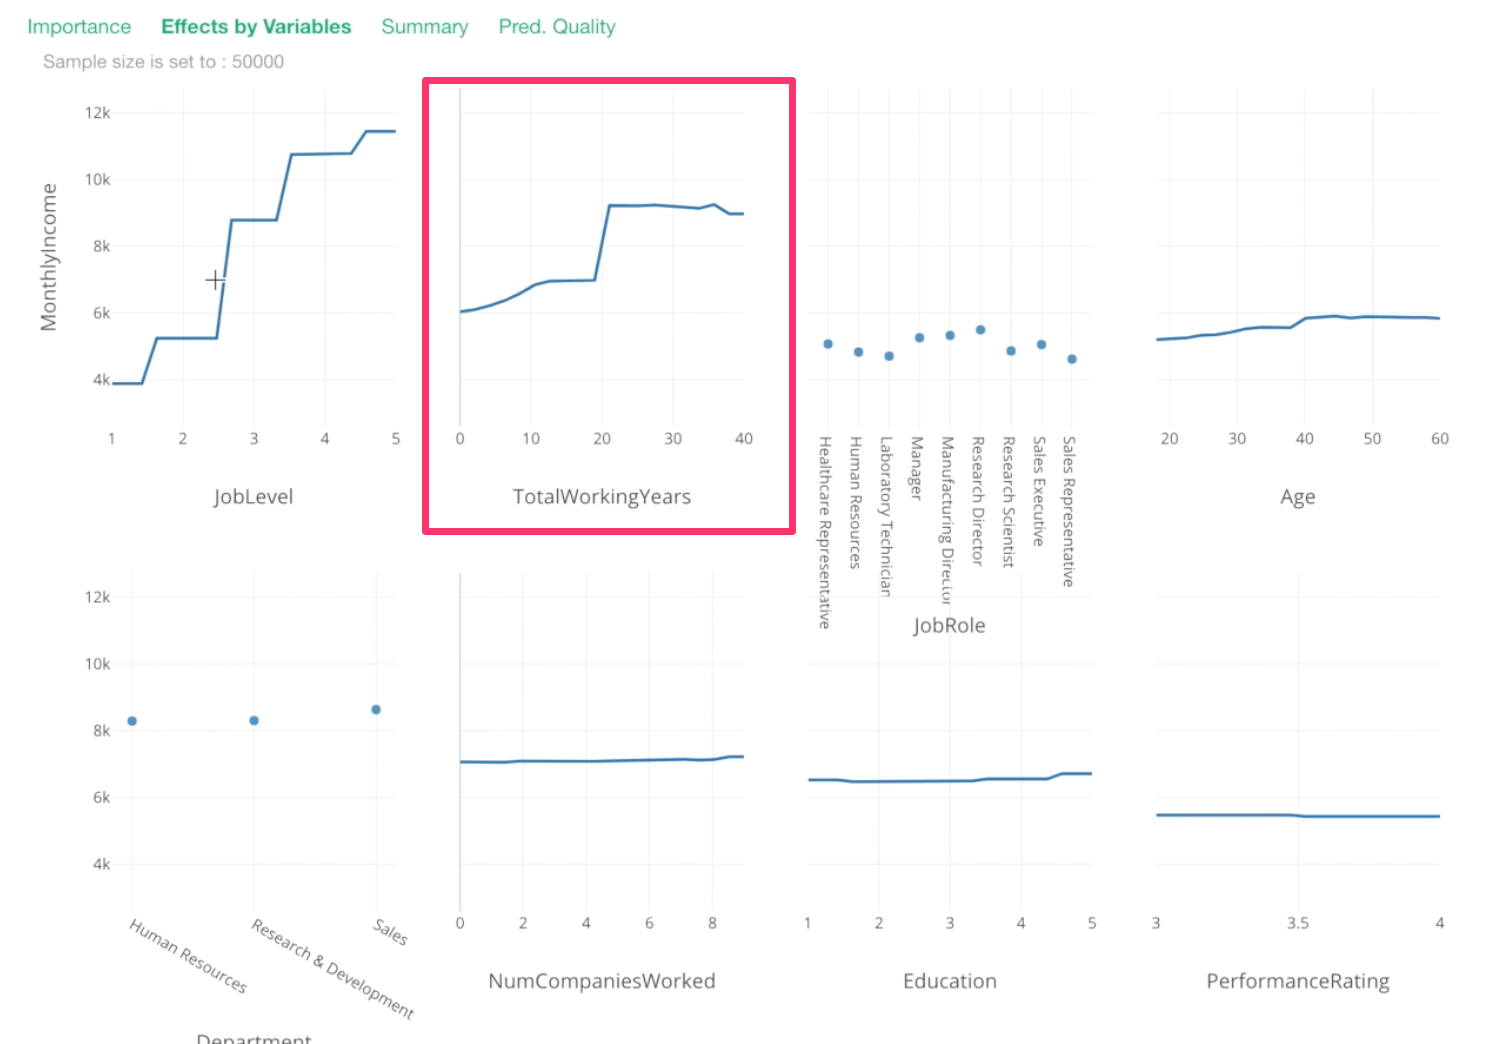
From 0 to 20th year, there seem to be incremental increases in Monthly Income, then around 20th year, there is a huge spike!
Then, after that, it stays the same or, if anything, it decreases a bit.
For Job Role, this is something we have already known. Manager and Research Director tend to have higher Monthly Income.