Note in Exploratory is essentially a reporting tool on steroid.
You can embed your charts and analytics you have built in Exploratory while you write about insights you have found with Markdown formats.
But there is more.
It is basically an extension of RMarkdown, which is the most popular reporting tool in the world of R. This means that you can even embed any R codes to visualize your data with your favorite R packages or embed dynamic calculations as part of your sentences in writing.
What can I do with Note?
Here is a list of things you can do with Note in Exploratory.
- Open Note Editor in a Separate Window
- Write text with formatting information
- Preview the Output
- Embed Visualization Charts
- Embed Analytics Charts
- Configure Charts Size
- Embed R Code Block
- Embed Inline R Code
- Save as HTML / Word / EDF
- Publish and Share
- Restore Old Versions of Note
- Let’s take a look one by one.
0. Open Note Editor in a Separate Window
When you write the Note often you want to include Charts and Analytics. And sometimes you might find yourself needing to open the chart to modify the setting.
Going back and forth between Note and Chart (or Analytics) is cumbersome.
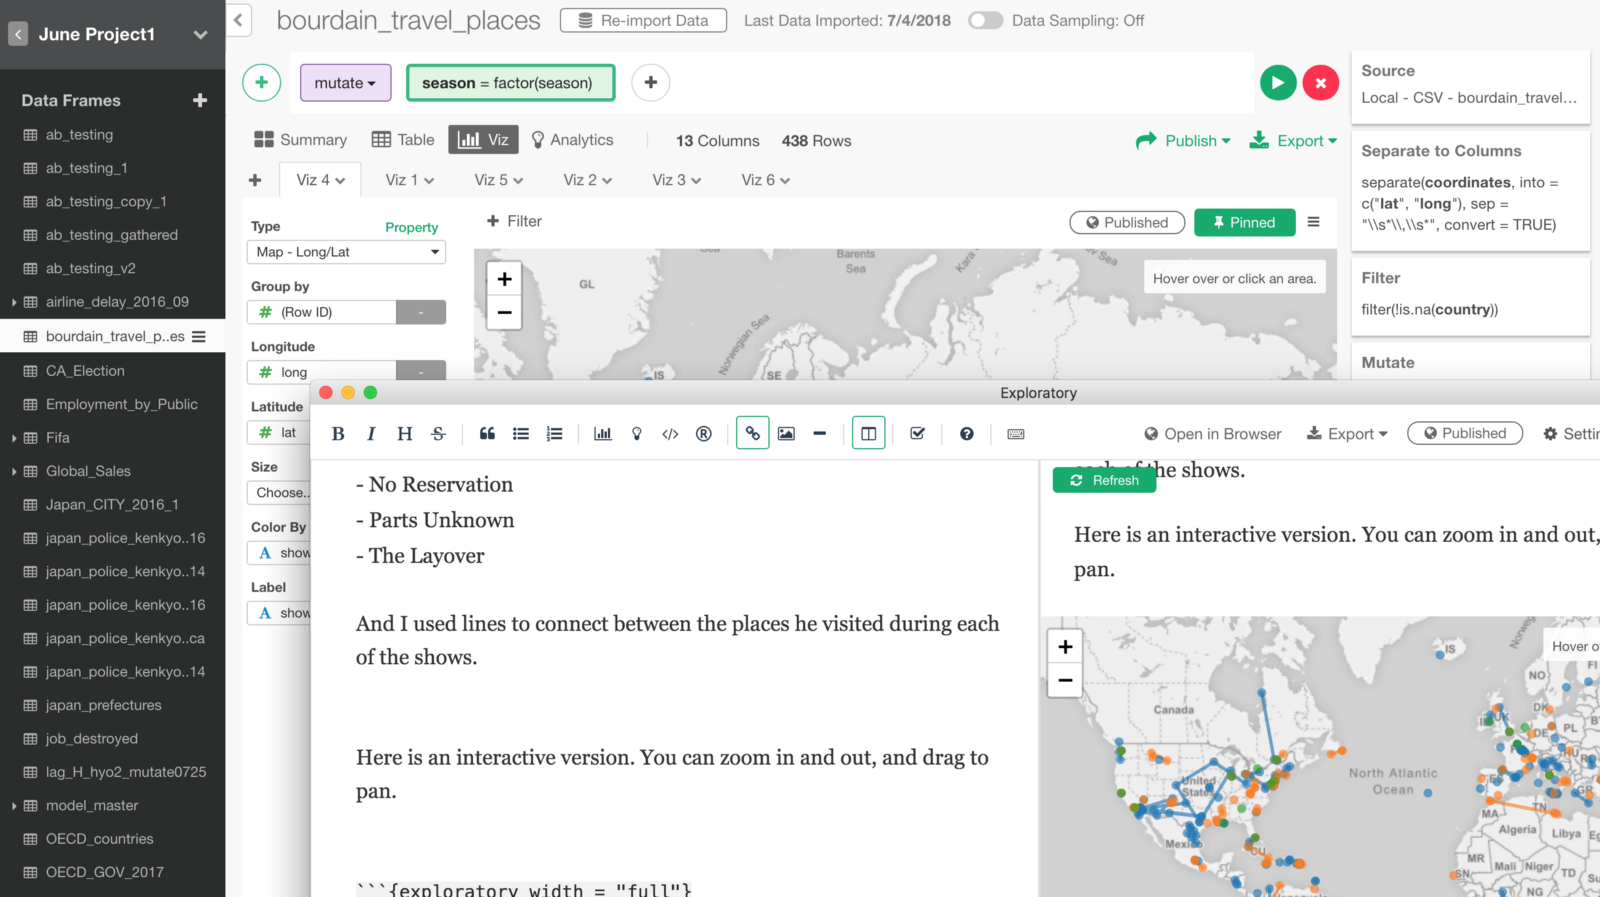
This is when you want to open the Note Editor in a separate window.
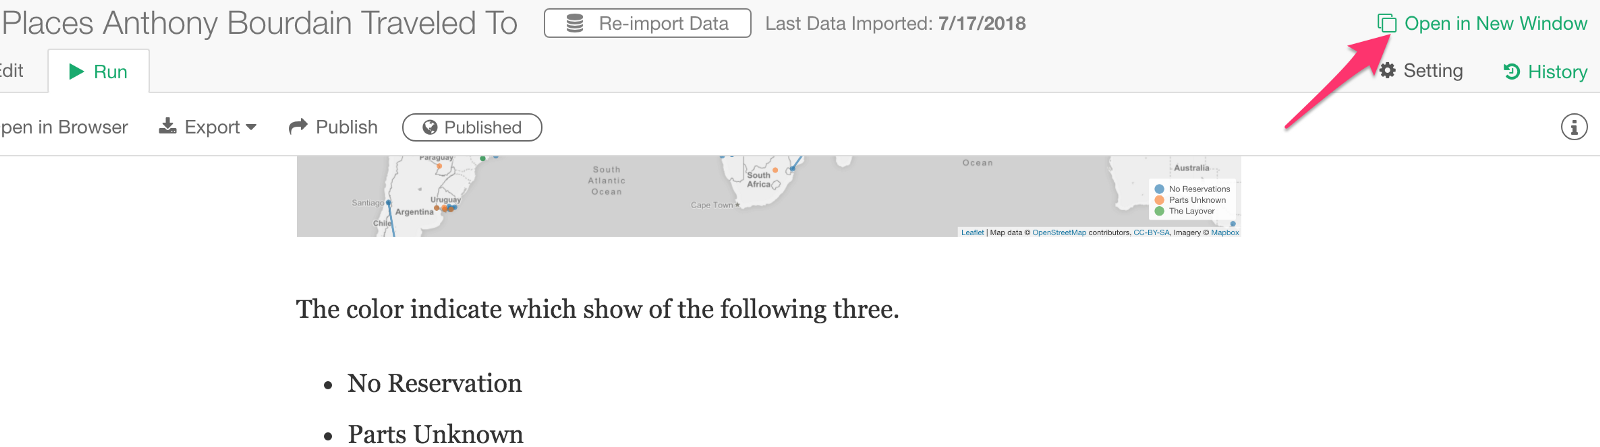
This way, you can keep the Note Editor opened while you are updating the corresponding charts and analytics.
1. Write Text with Markdown
What is Markdown?
Have you seen something like below?
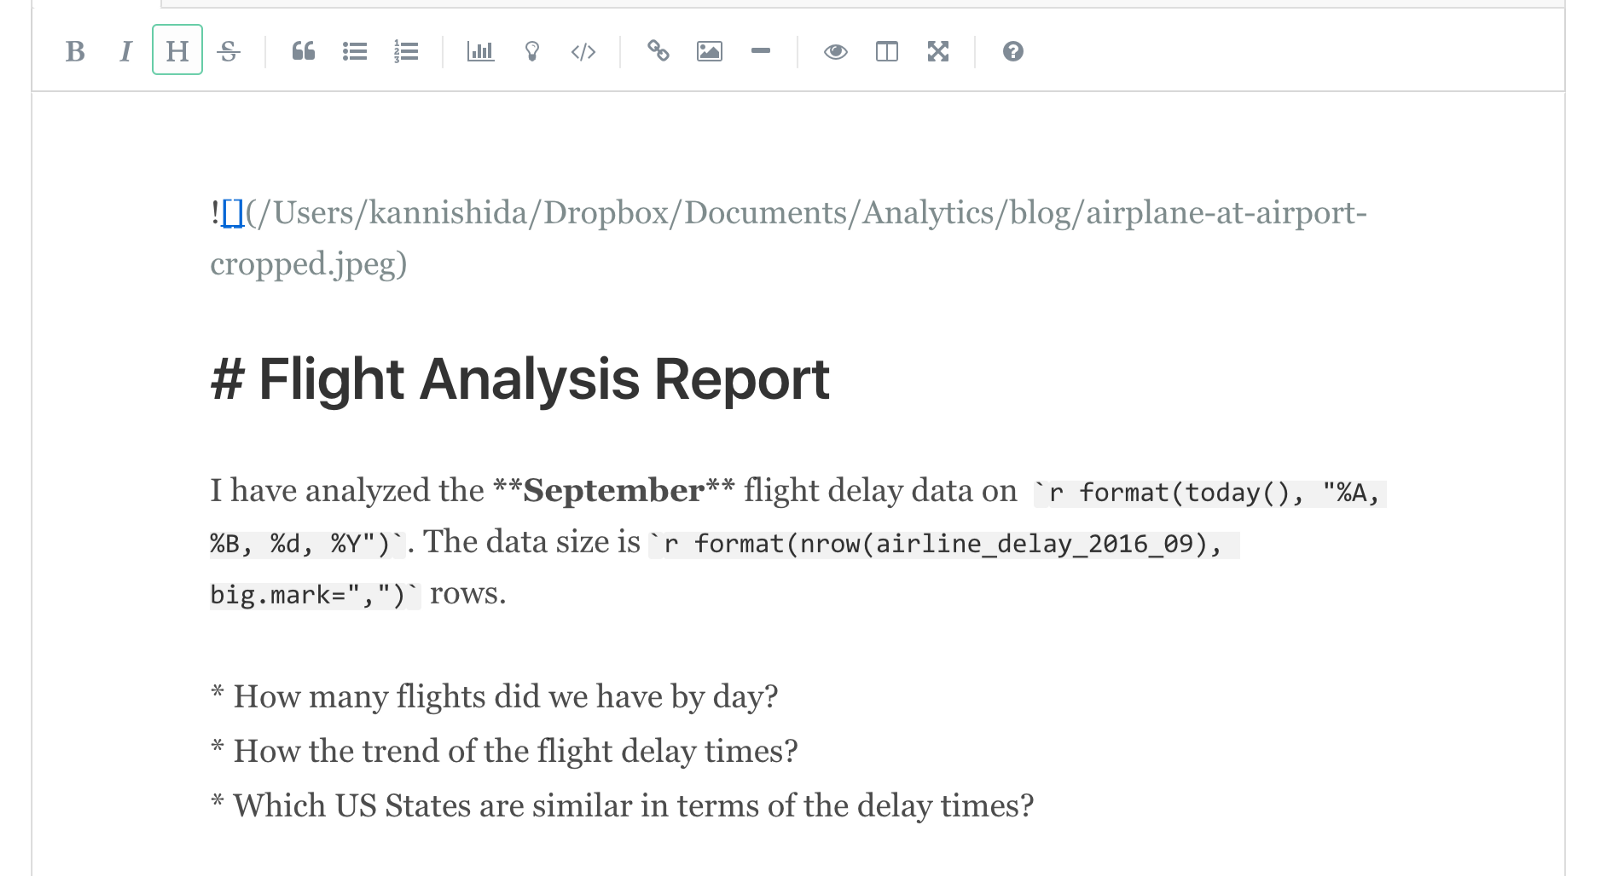
This is how the Markdown text looks like. It uses special text (e.g. # for H1 Header, ## for H2 Header, etc.) to set the formatting of the text.
Why do I want Markdown?
The markdown editor inside Exploratory is built on top of this cool markdown editor called “SimpleMDE”, which instantly updates the text based on the markdown formatting.
The standard markdown formatting syntax as listed below are supported as you would expect.
- Header
- Bold / Italic
- List
- URL Link
- Image
- Quote Code Block
- Table
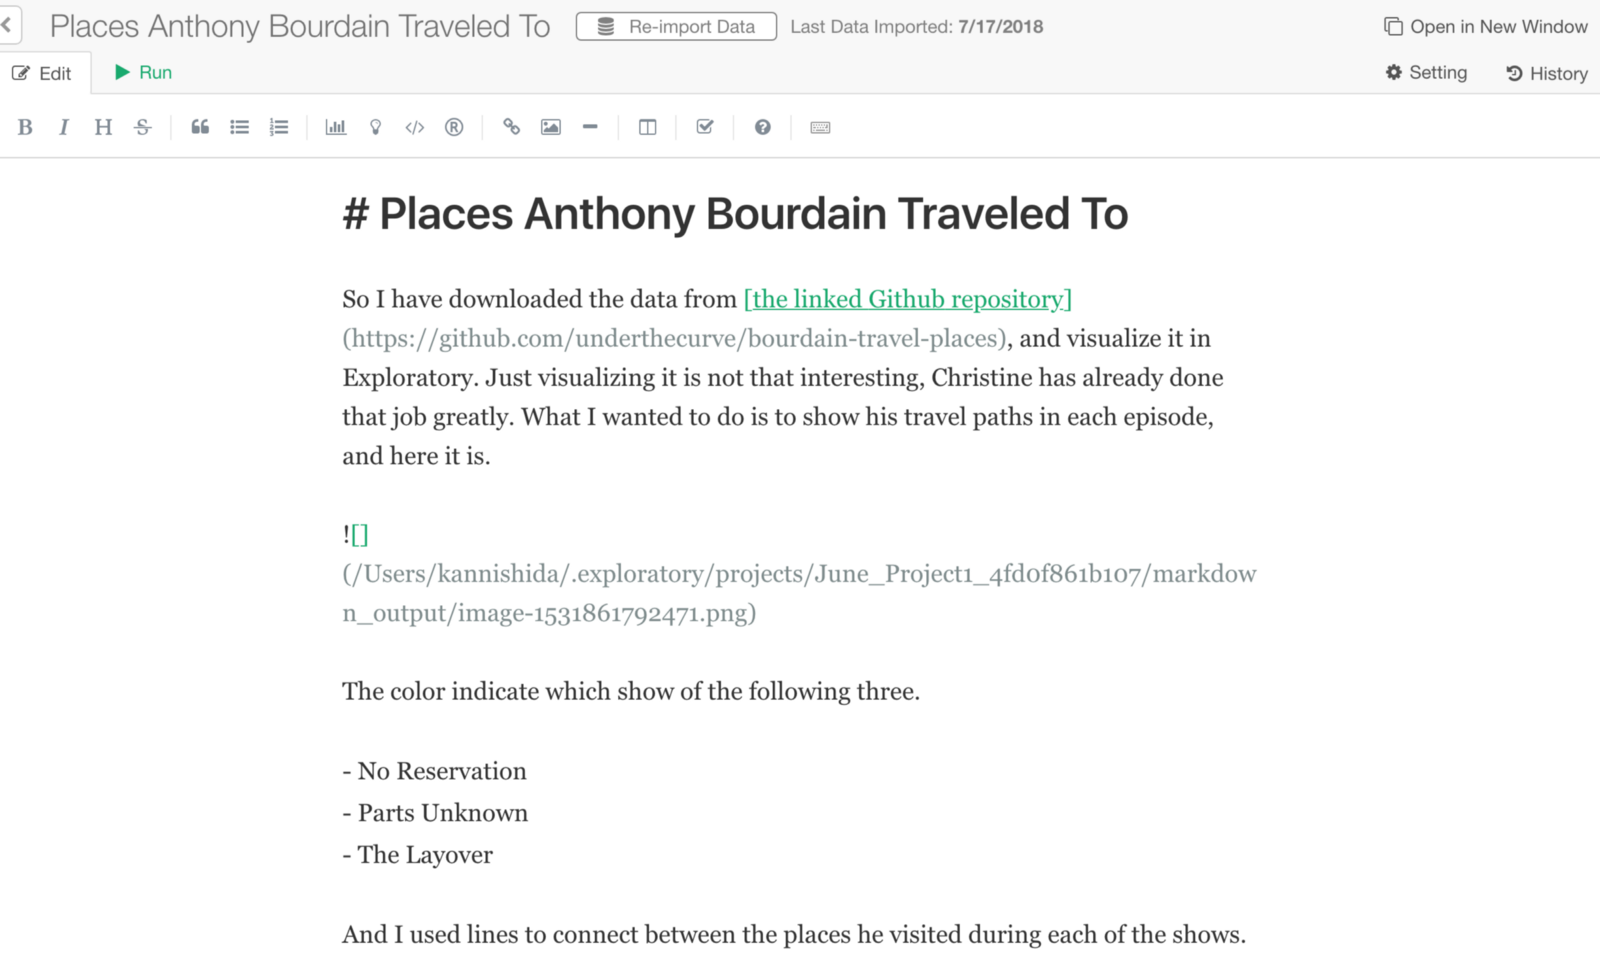
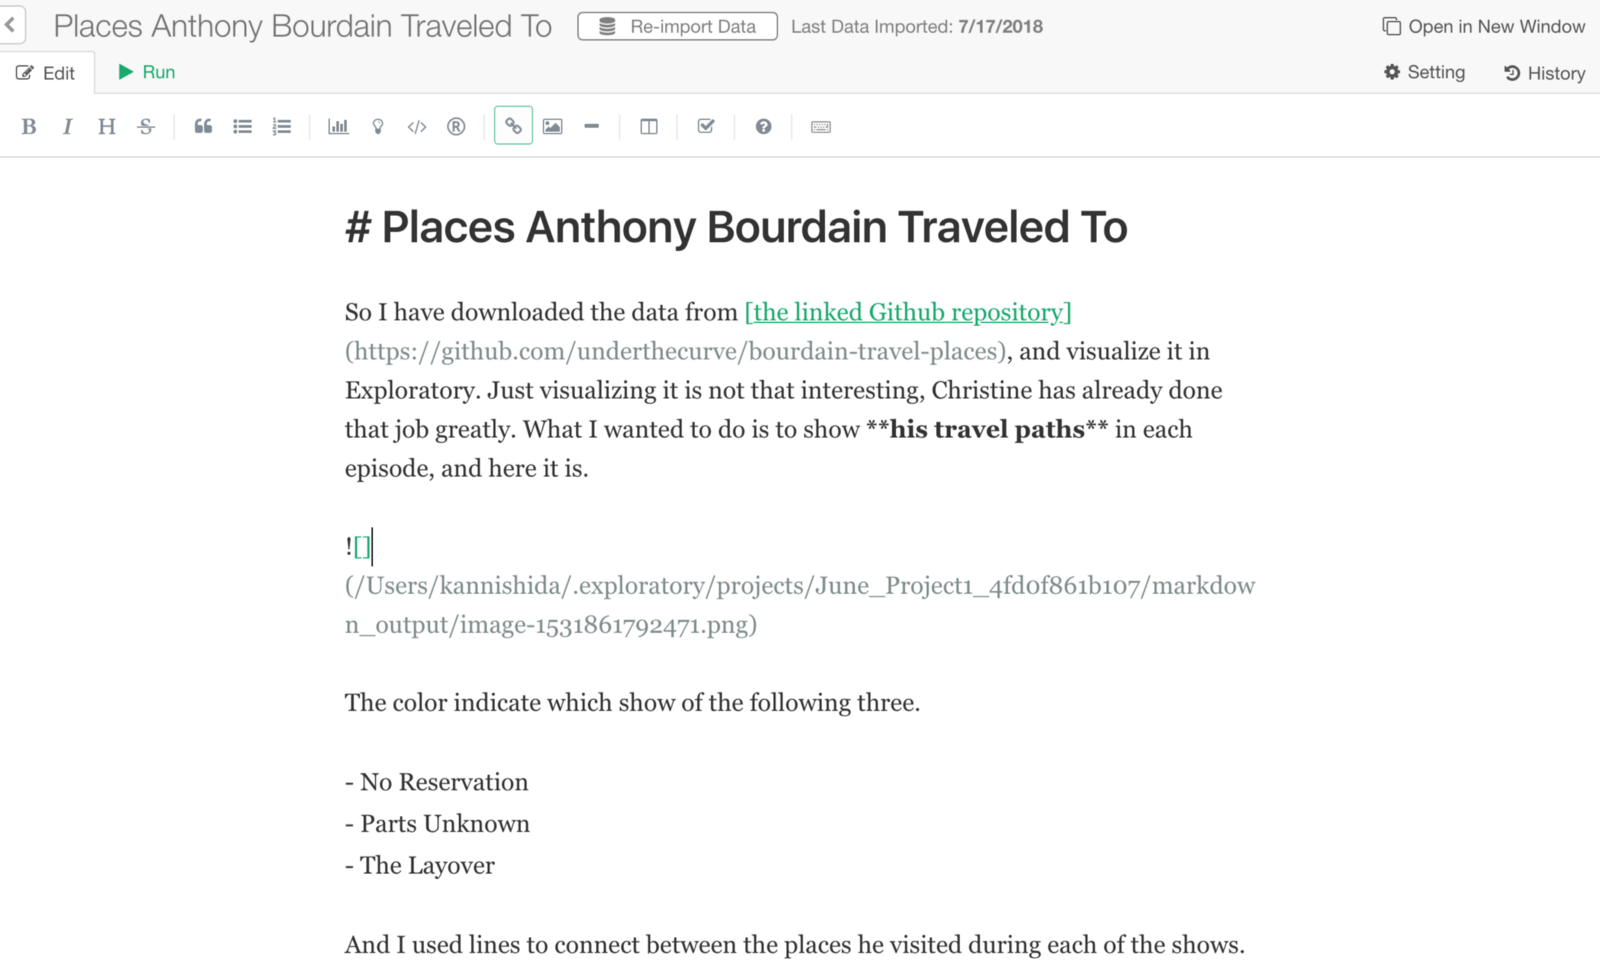
Here’s an example.
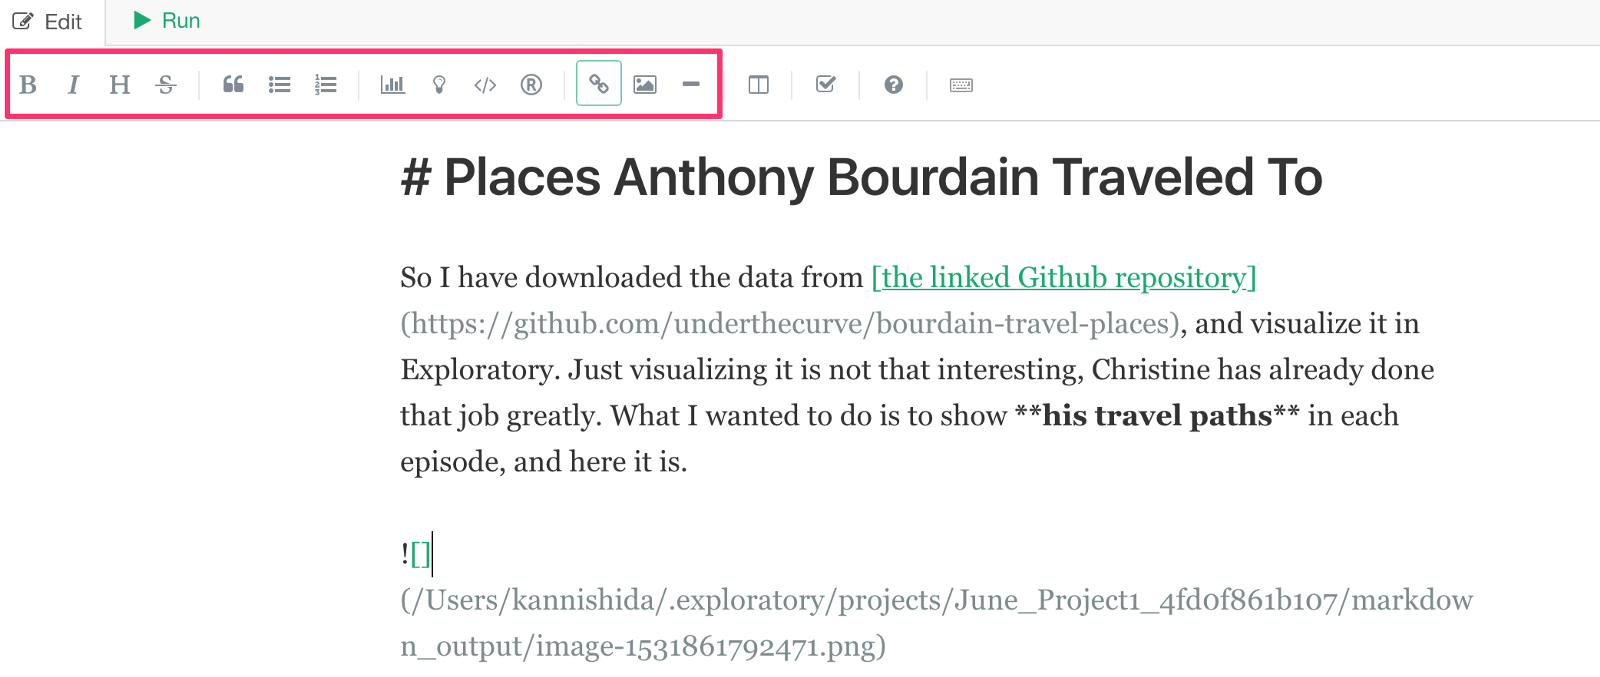
Formatting Options in Toolbar
Not familiar with Markdown at all?
No worry, you can use the icons in the toolbar to start the formatting.
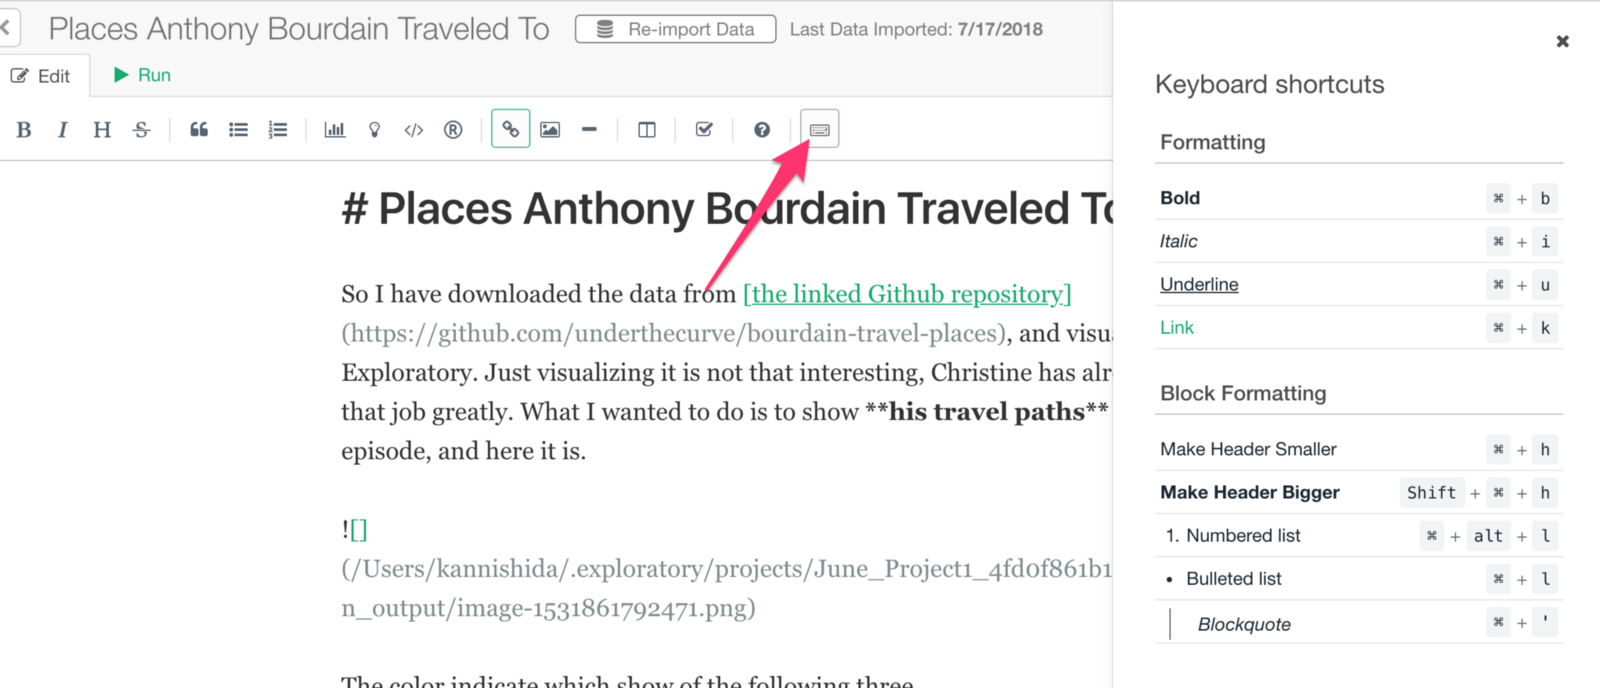
Short-Cut Keys
Are you more of a short-cut key type rather than a clicking type?
Great news. Most of the formatting types can be done by the short-cut keys. Click on ‘Keyboard’ icon to see a list of the short cut keys.
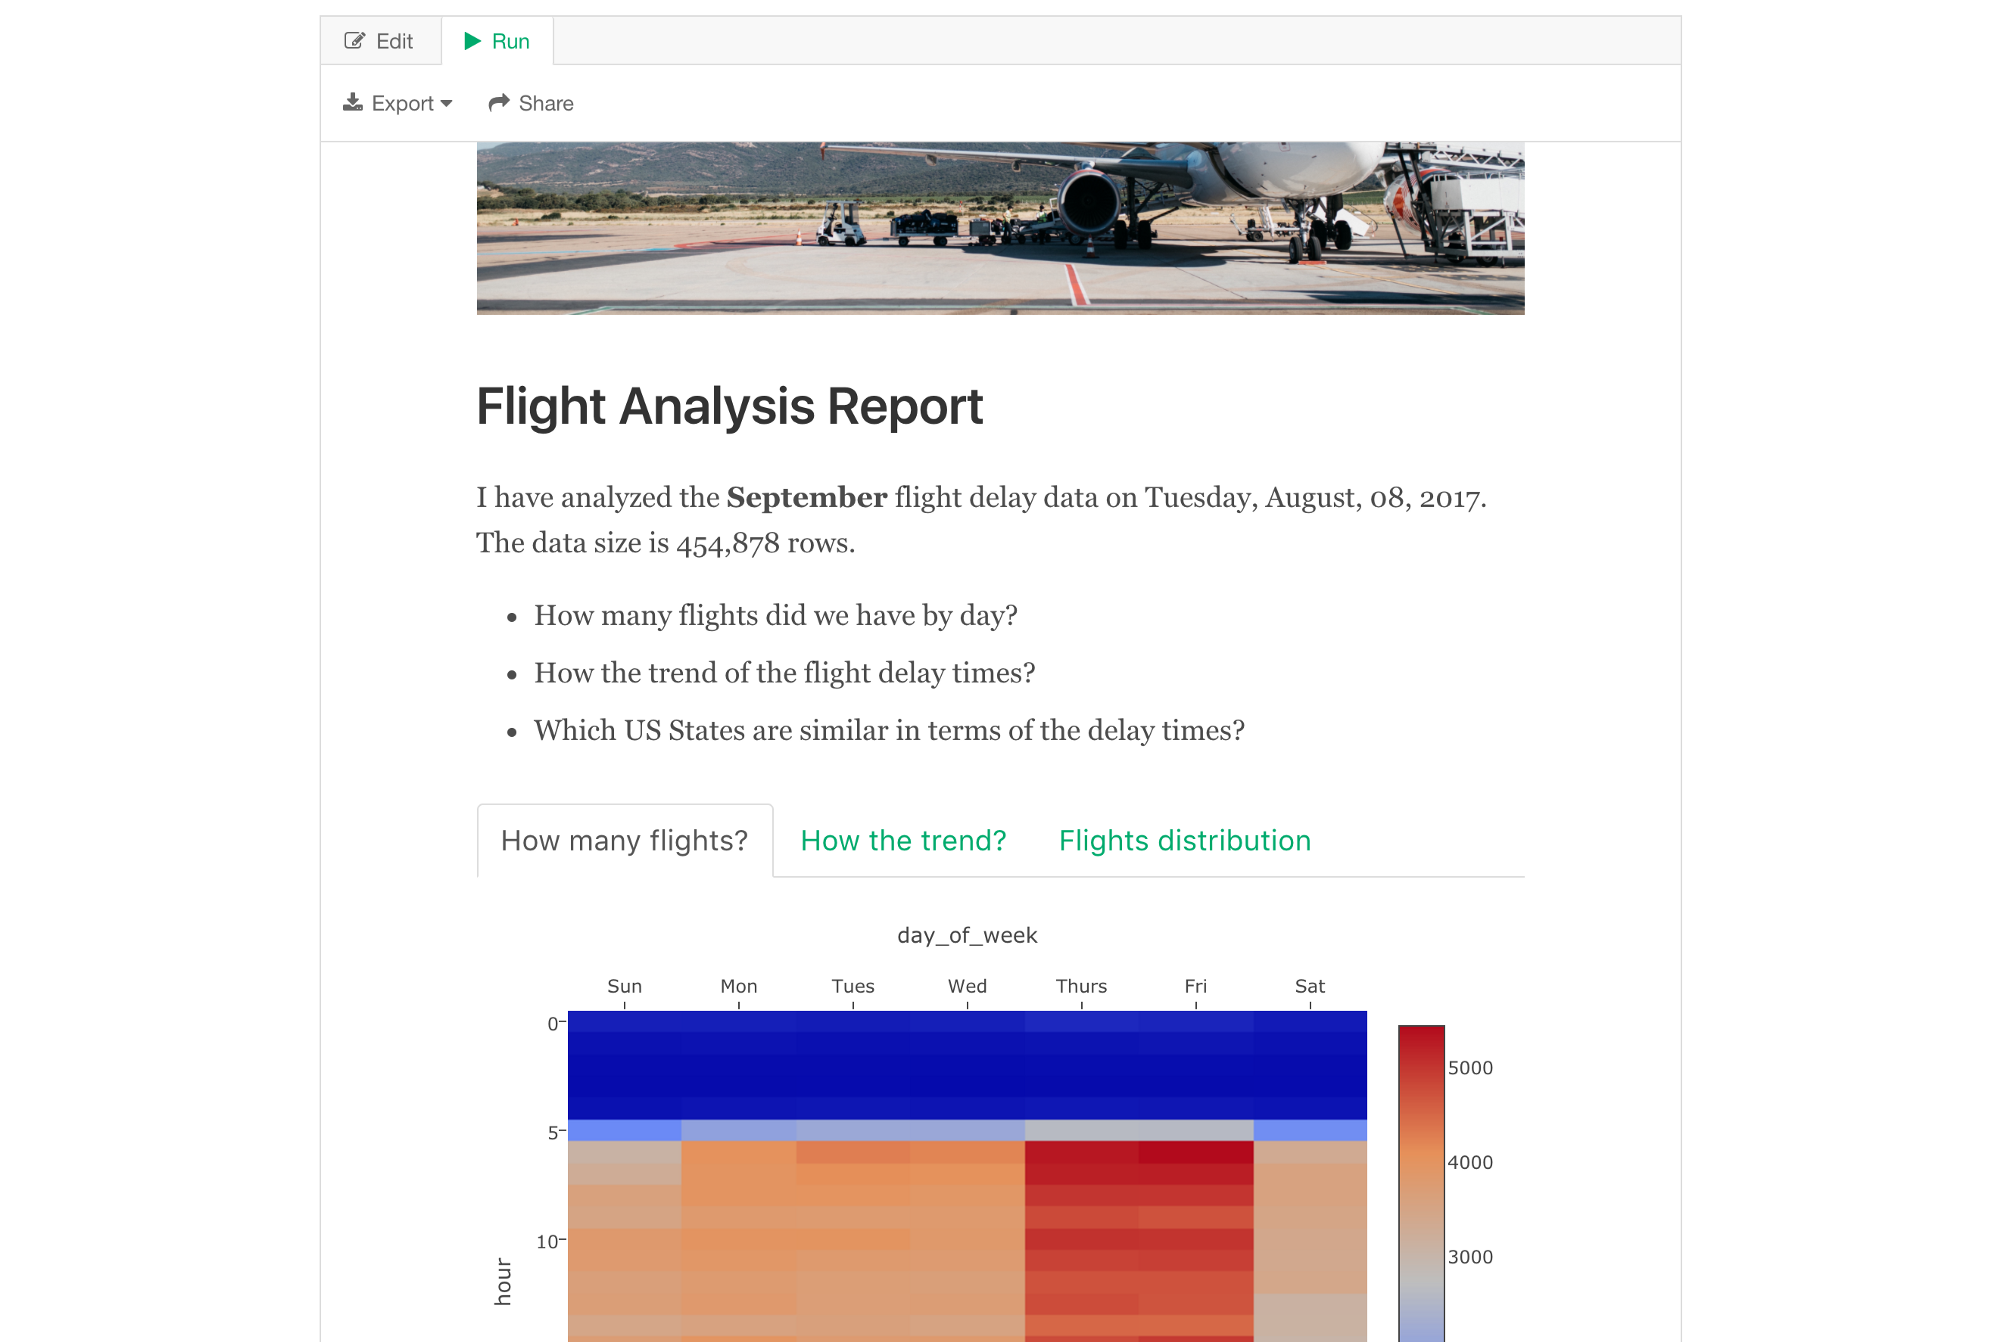
2. View the Output
There are two ways to view the output of your Note. Edit-Run Toggle mode and Side-by-Side mode.
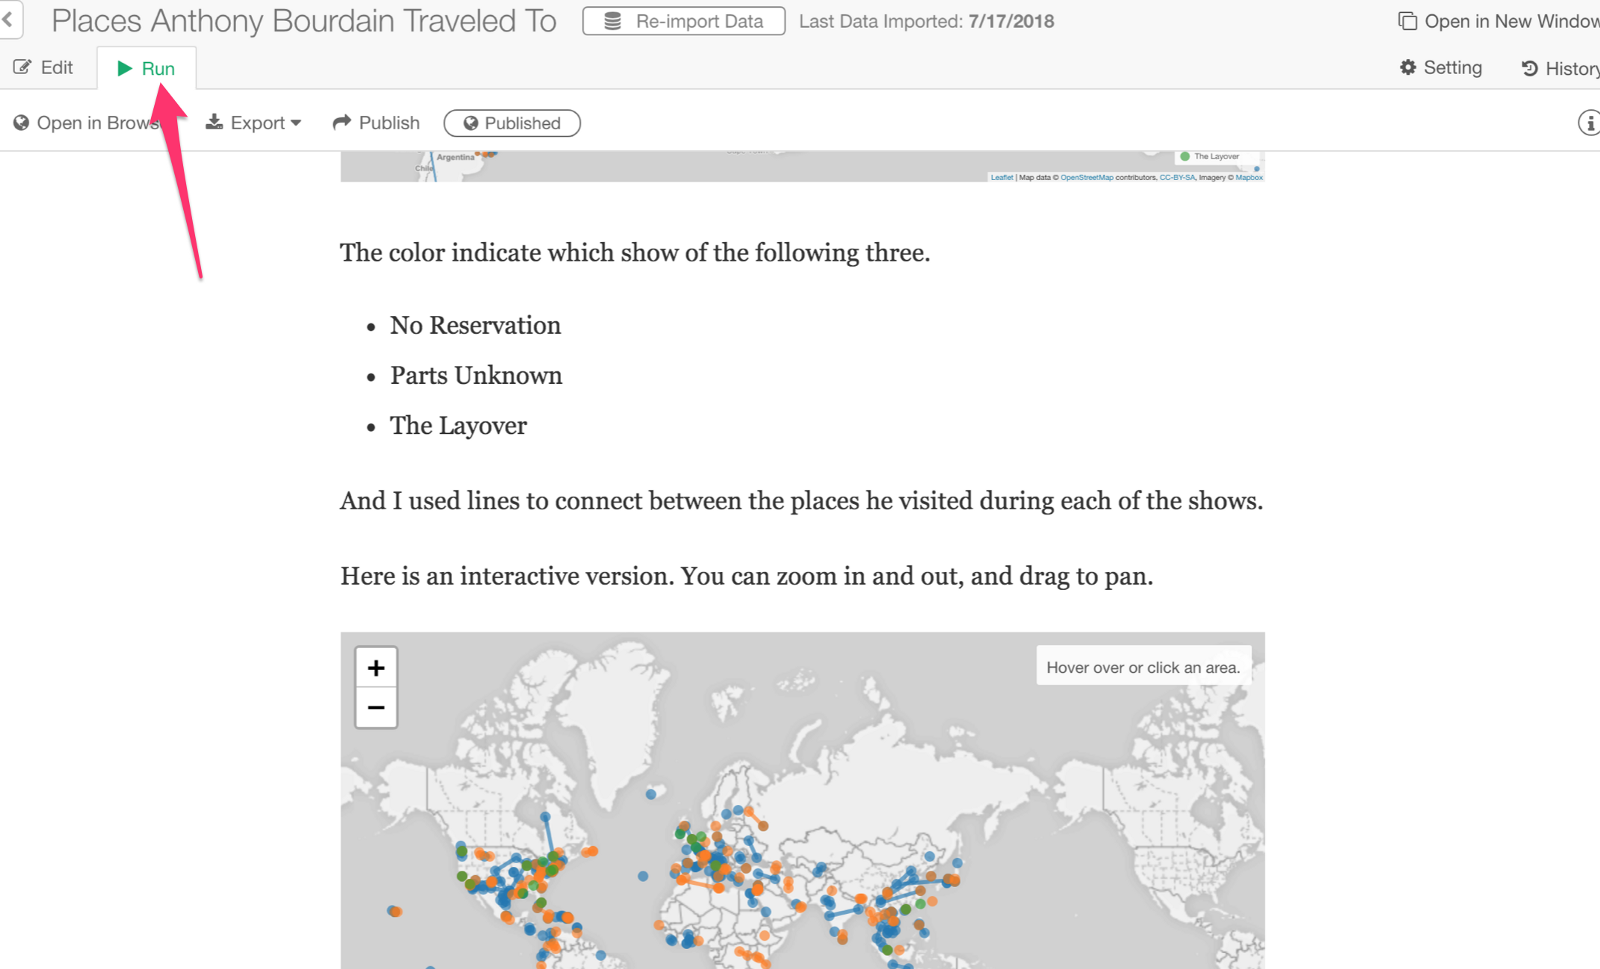
Edit-Run Toggle Mode
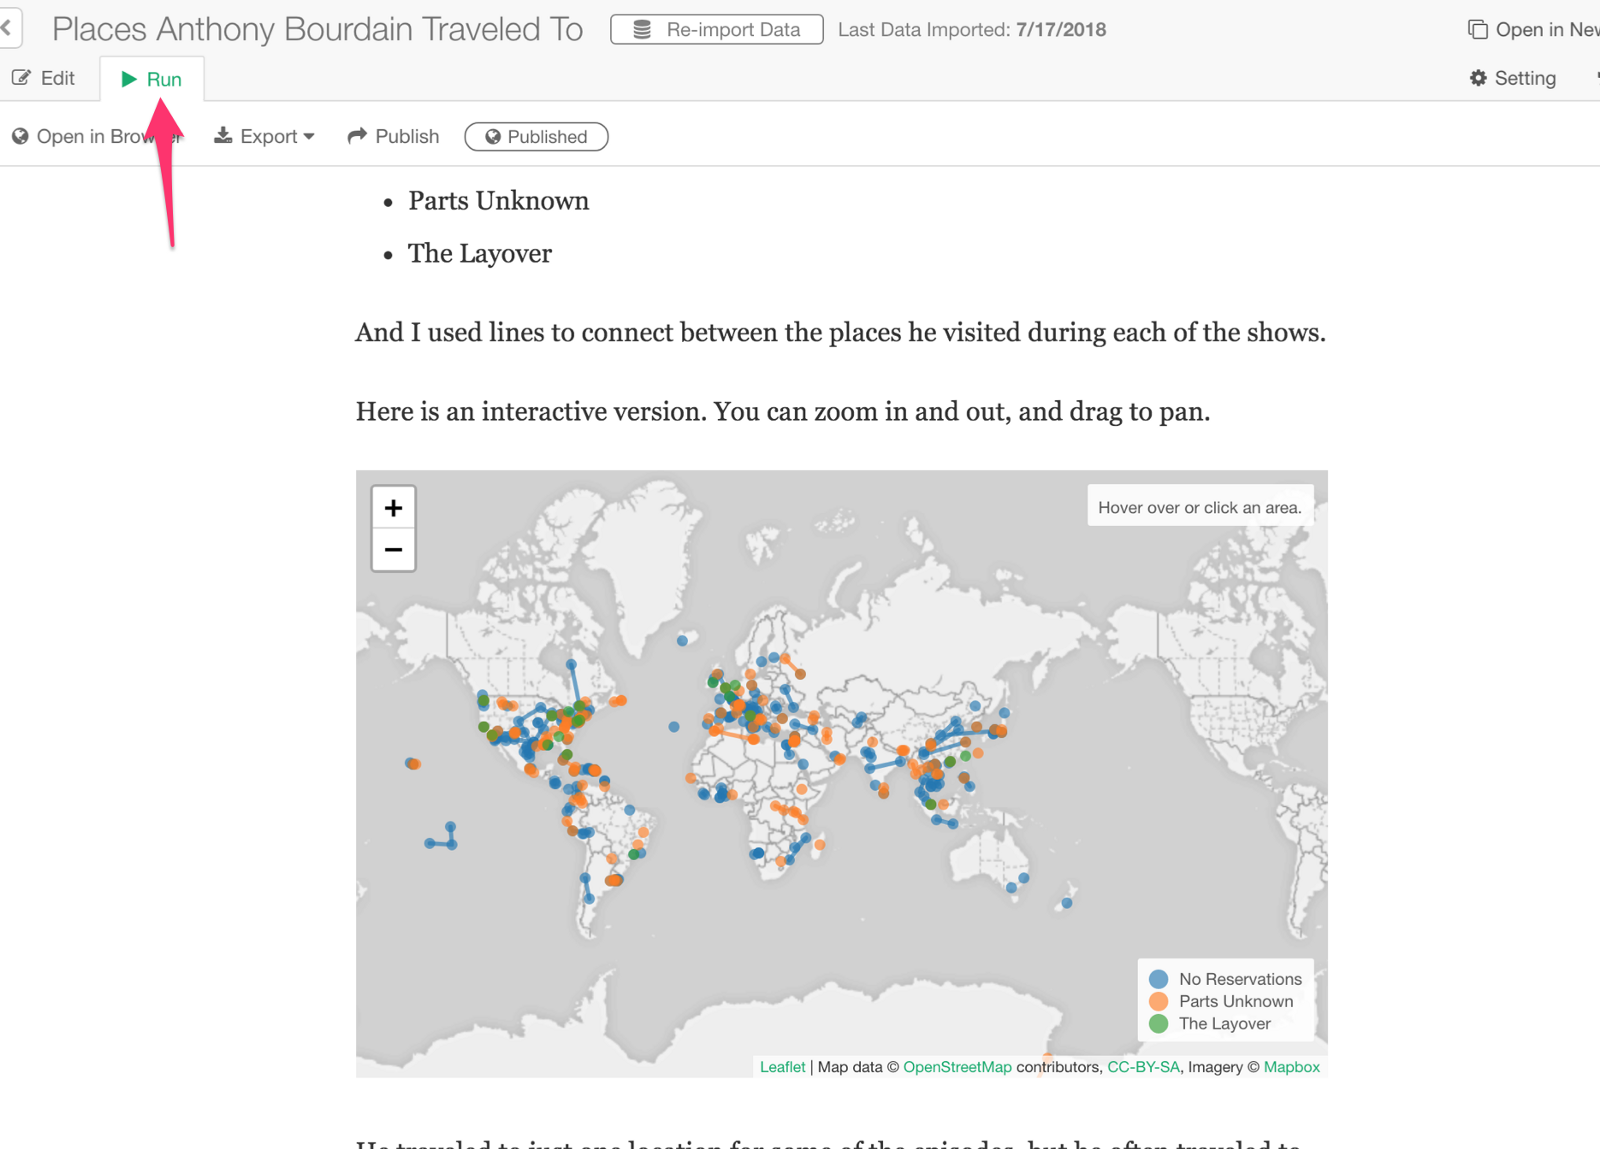
This is the default mode. You can click ‘Run’ tab to see the latest output based on what you have authored under Edit tab.
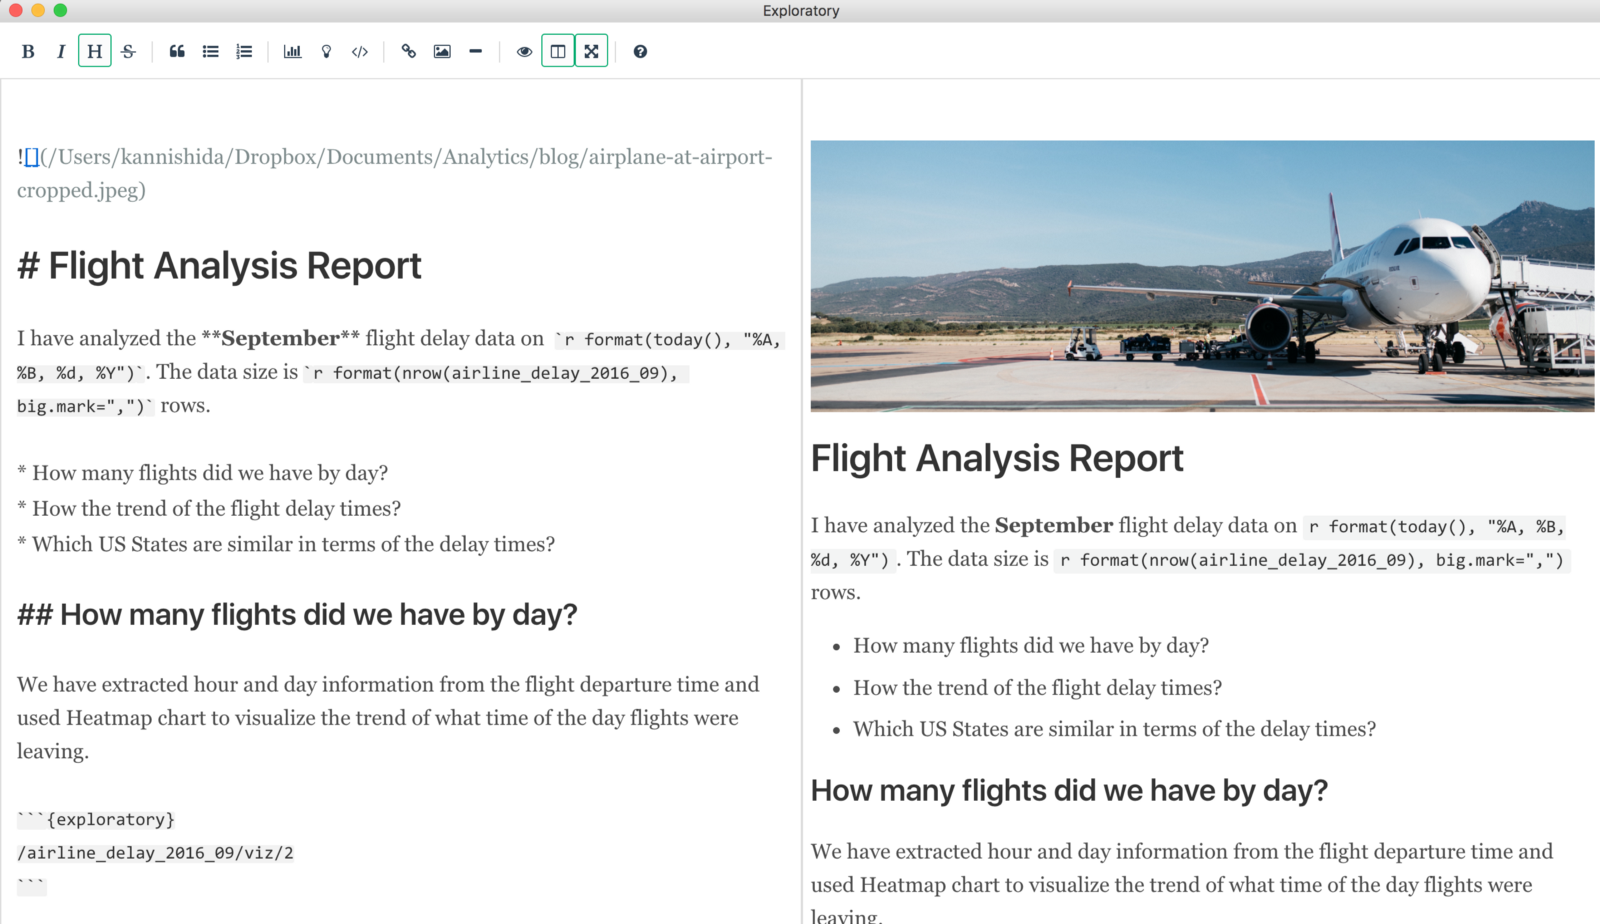
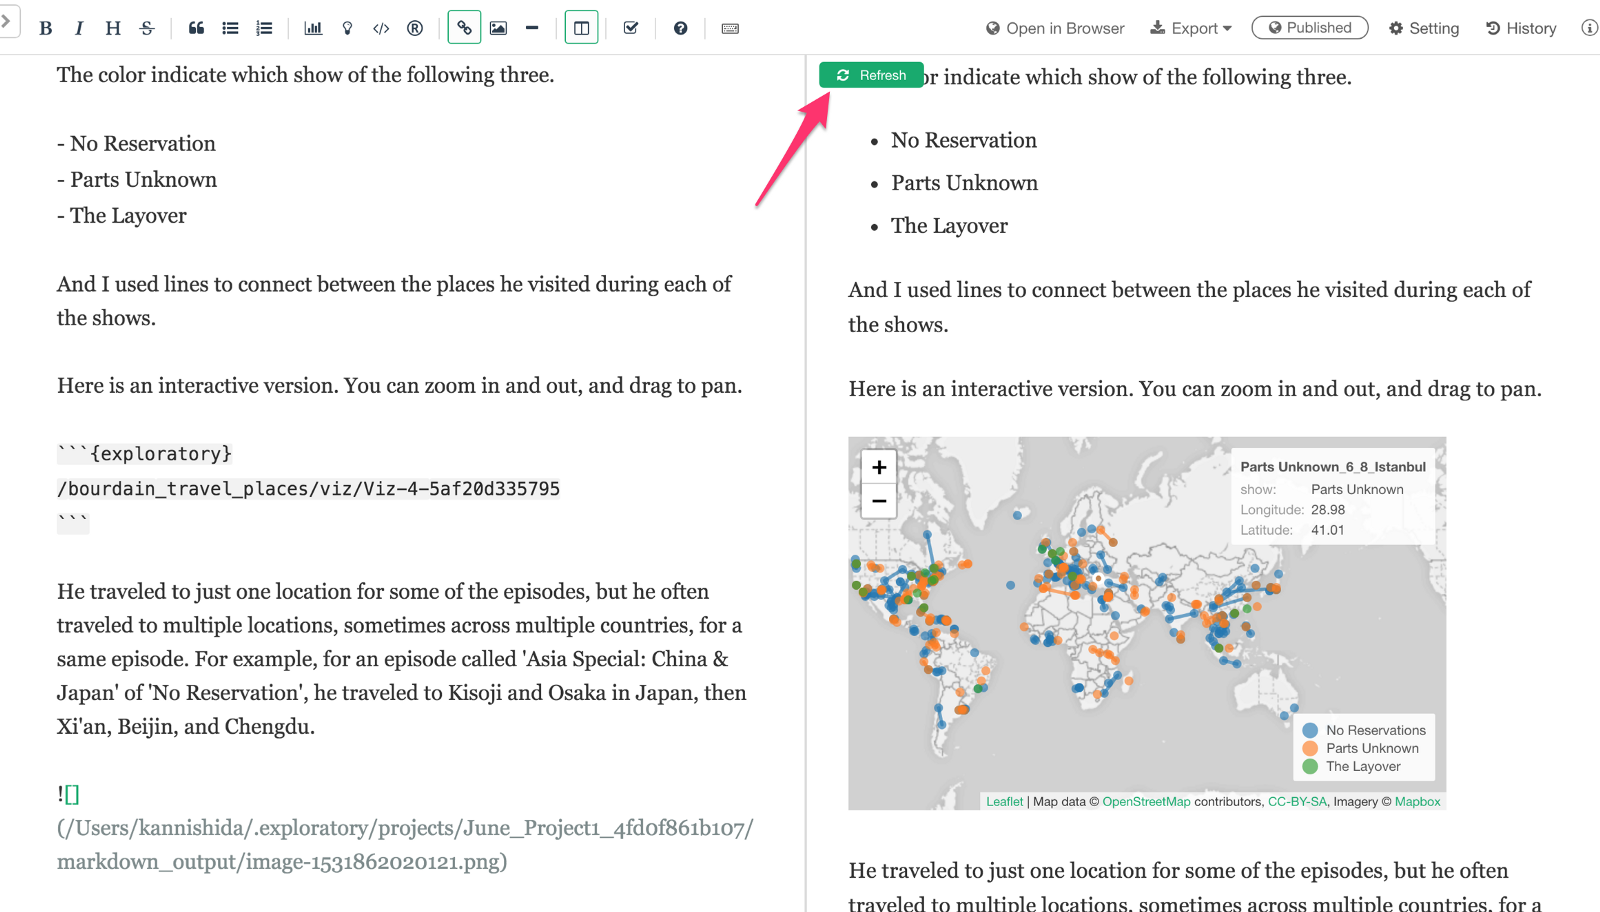
Side-by-Side Mode
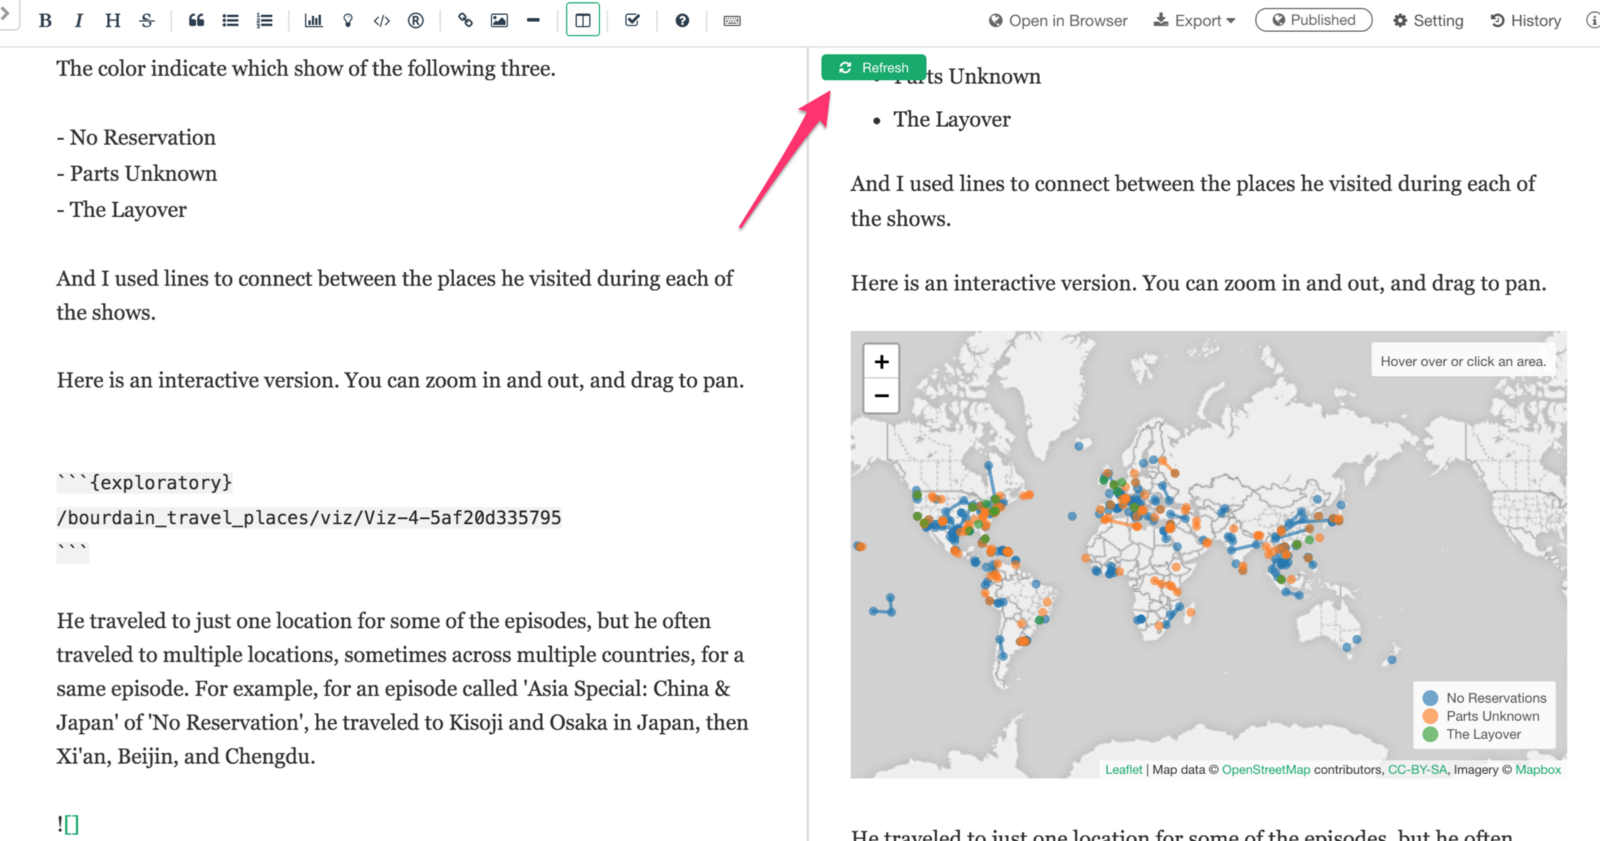
You can click on ‘Side-by-Side’ mode button to show the editing pane at the left hand side and the output at the right hand side.
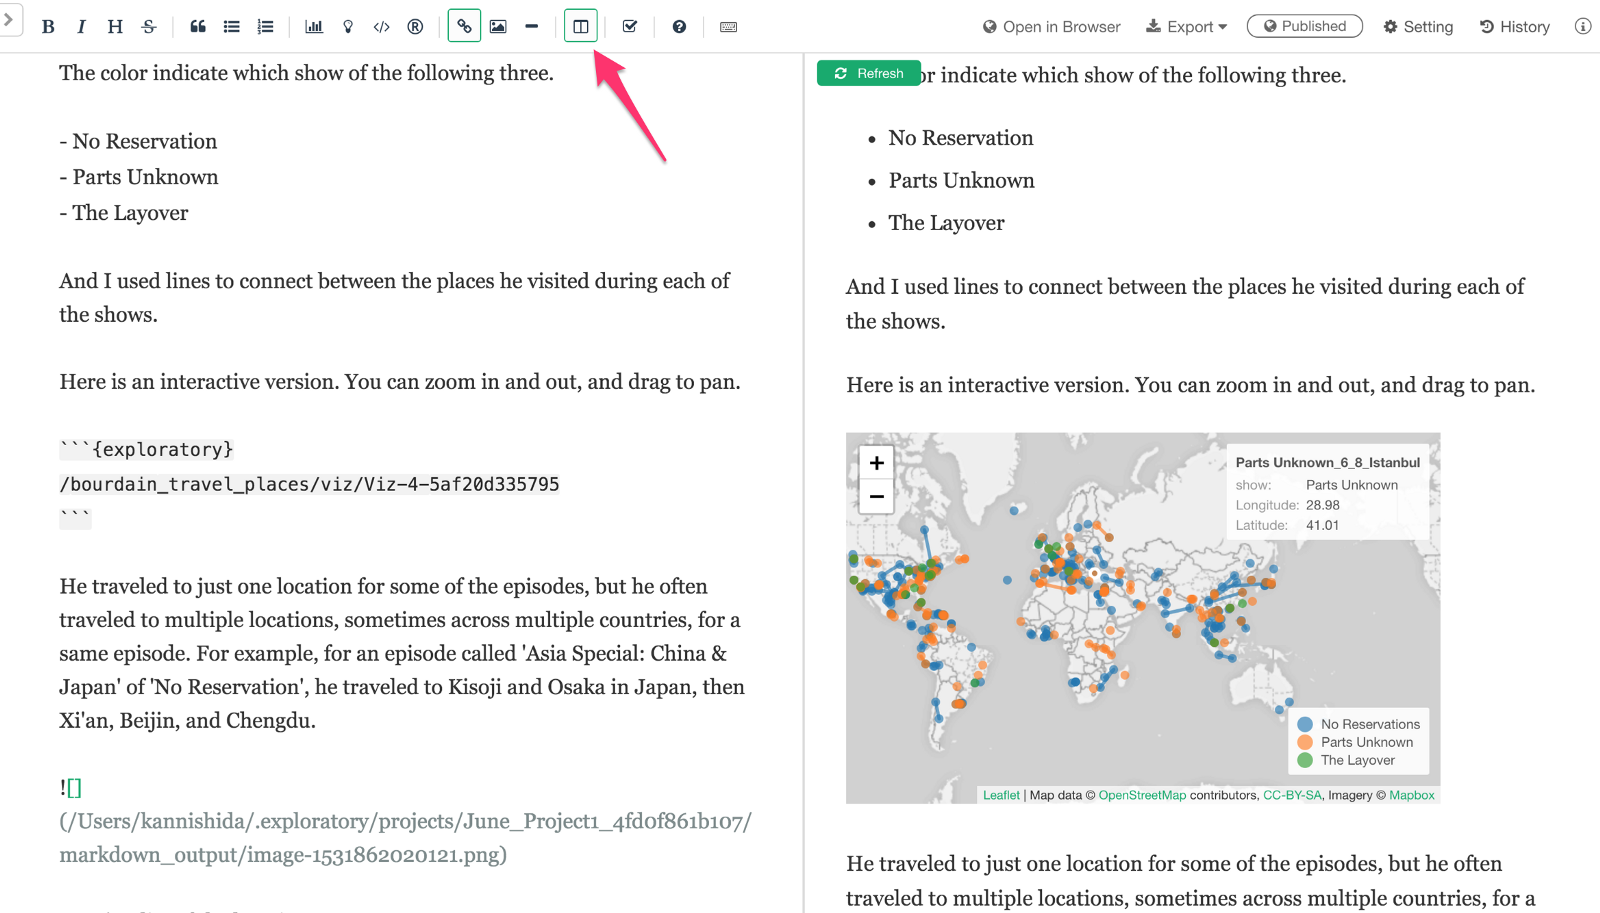
When you edit the content and want to see it showing up in the output pane you can click on the green ‘Refresh’ button at the top of the preview pane.
3. Embed Visualization Charts
You can embed the charts you have created inside the same project.
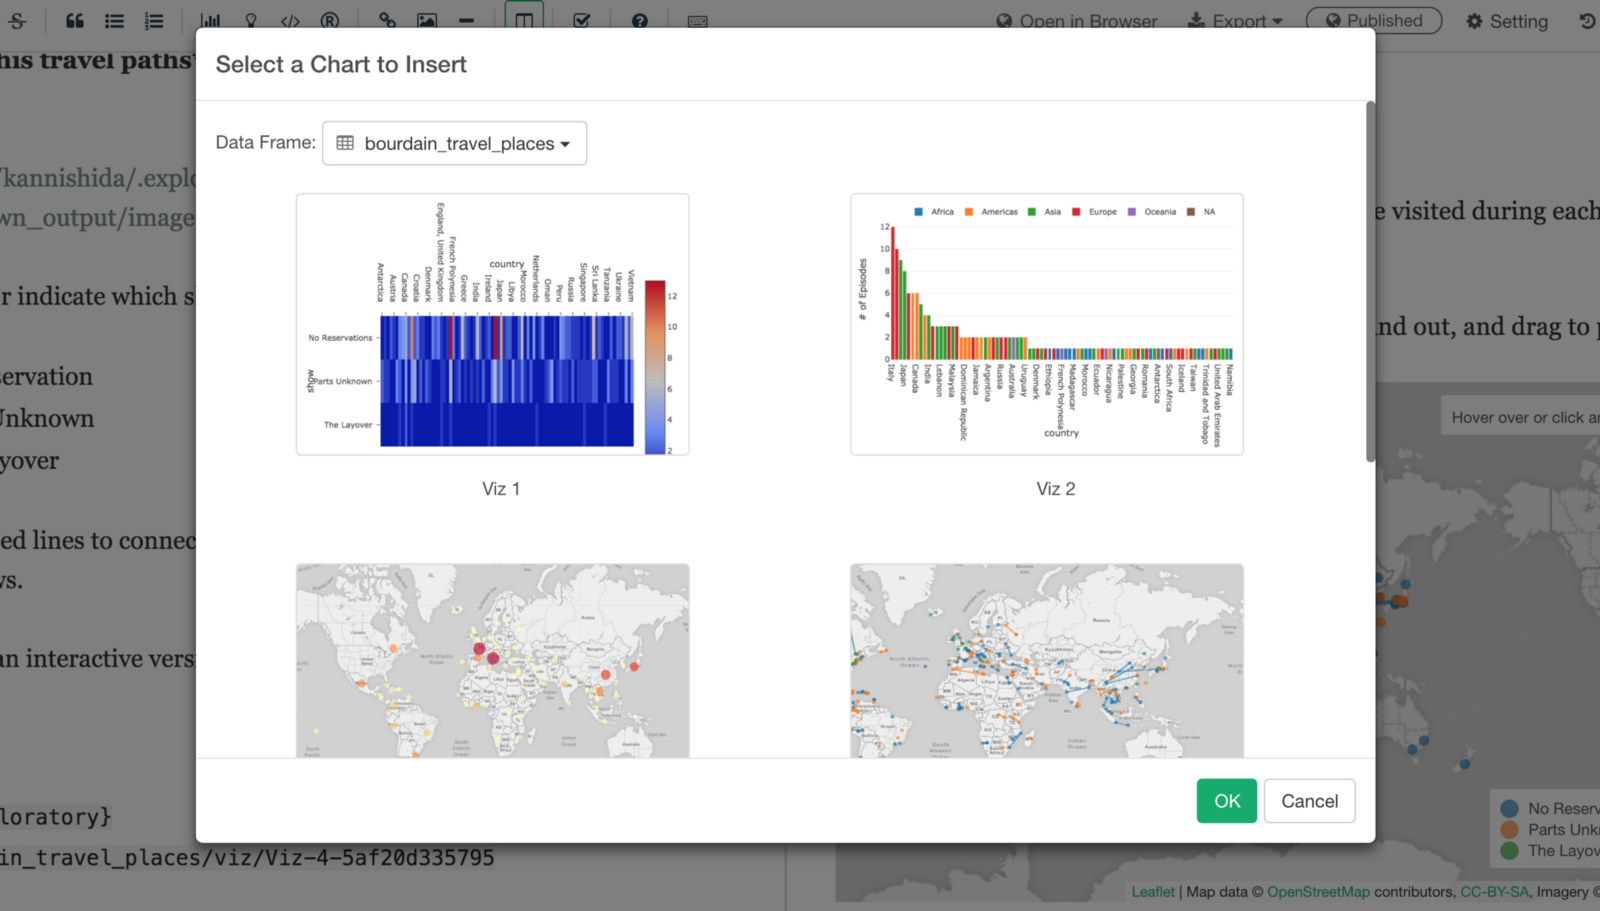
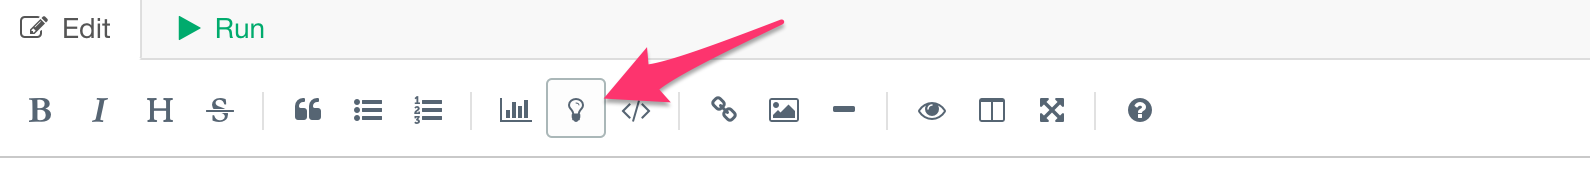
You can simply click on the chart icon in the toolbar to open Chart selection dialog.
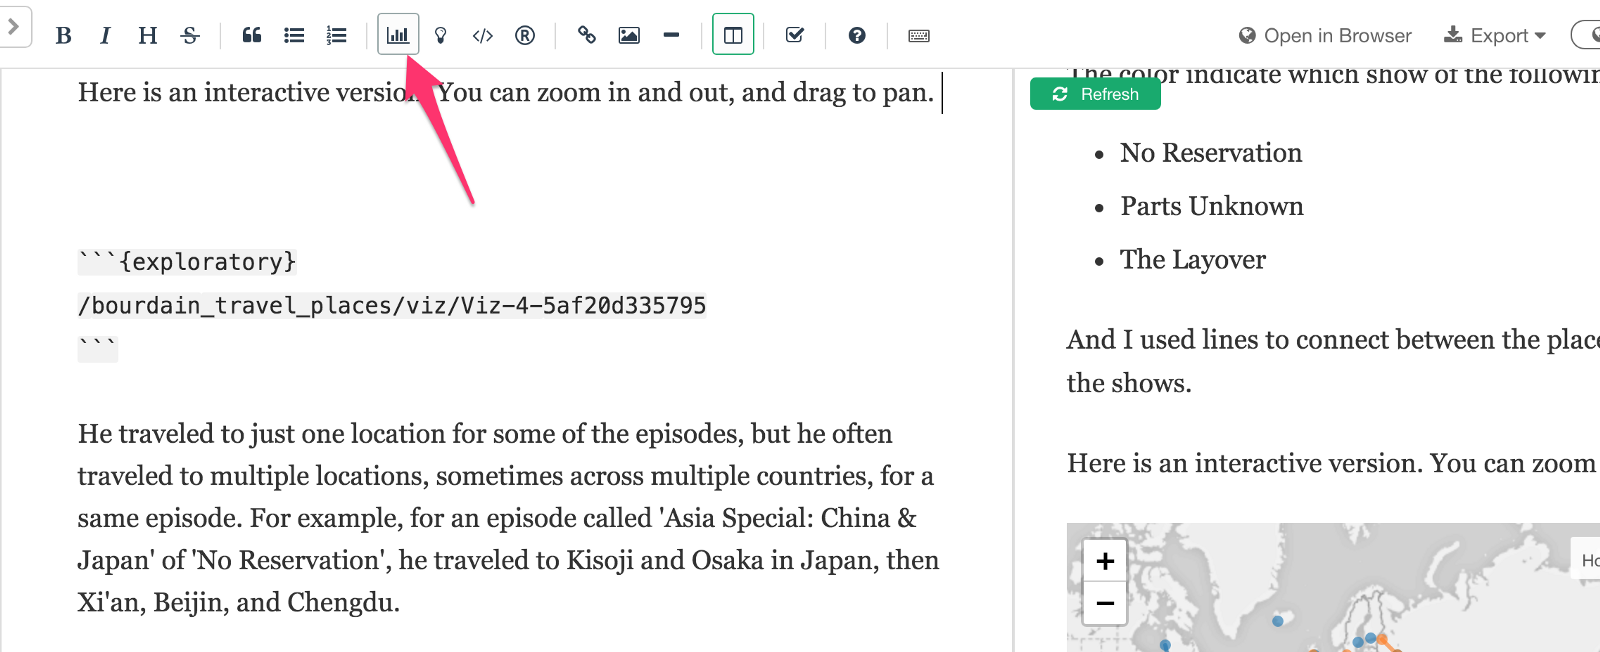
Select a chart you want to embed inside the note.
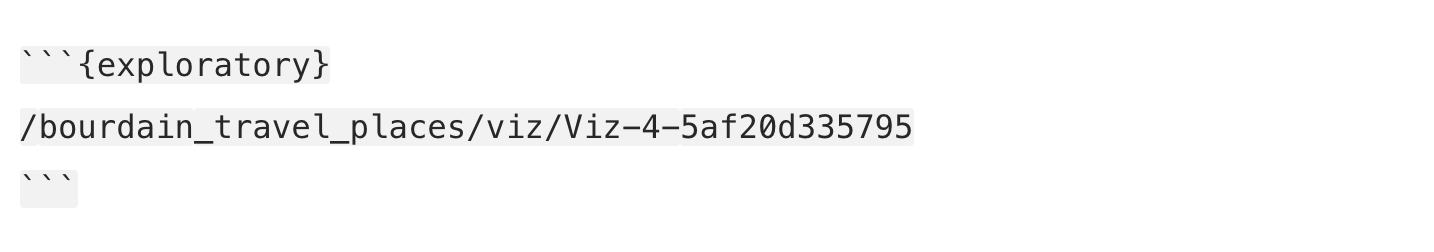
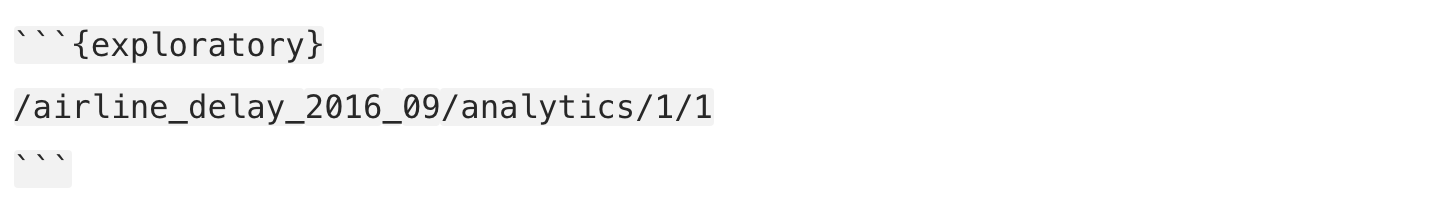
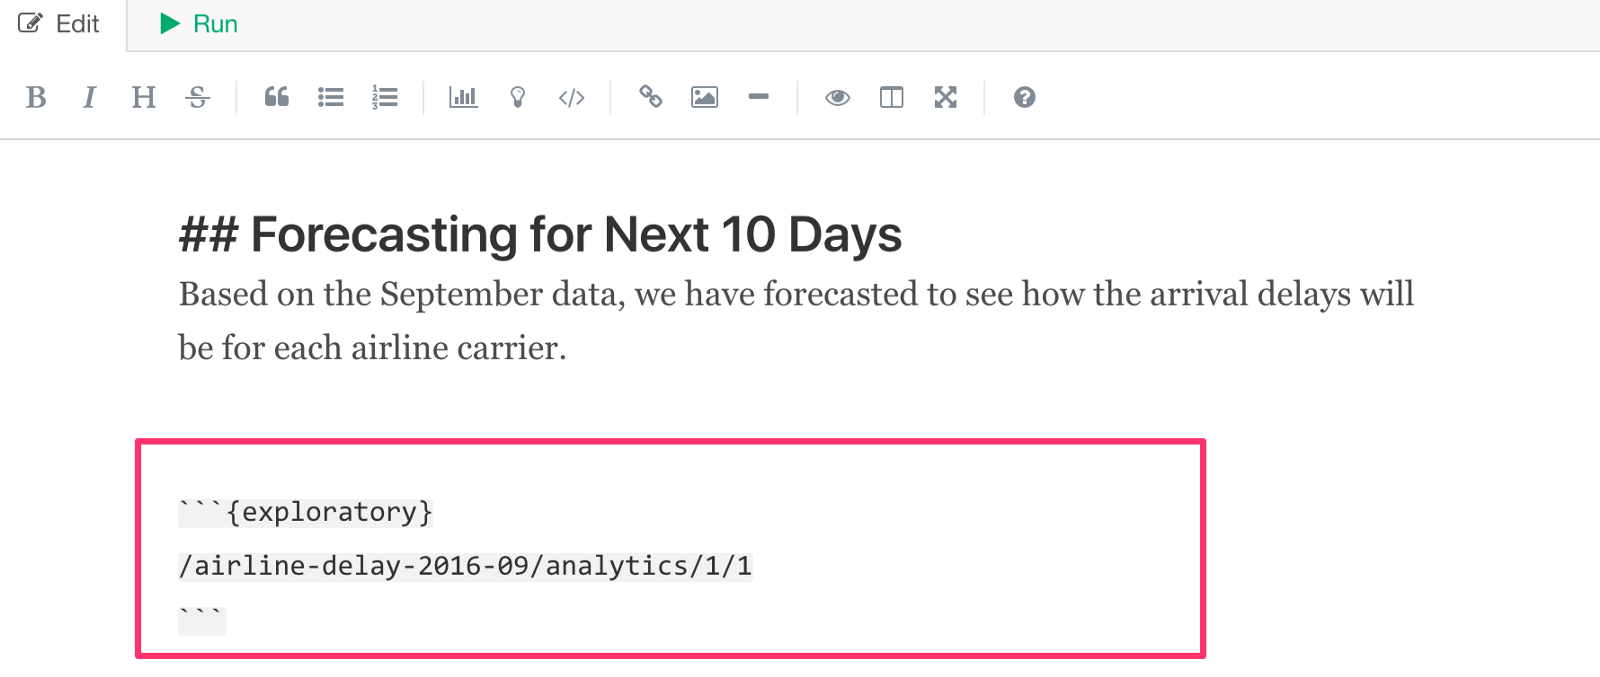
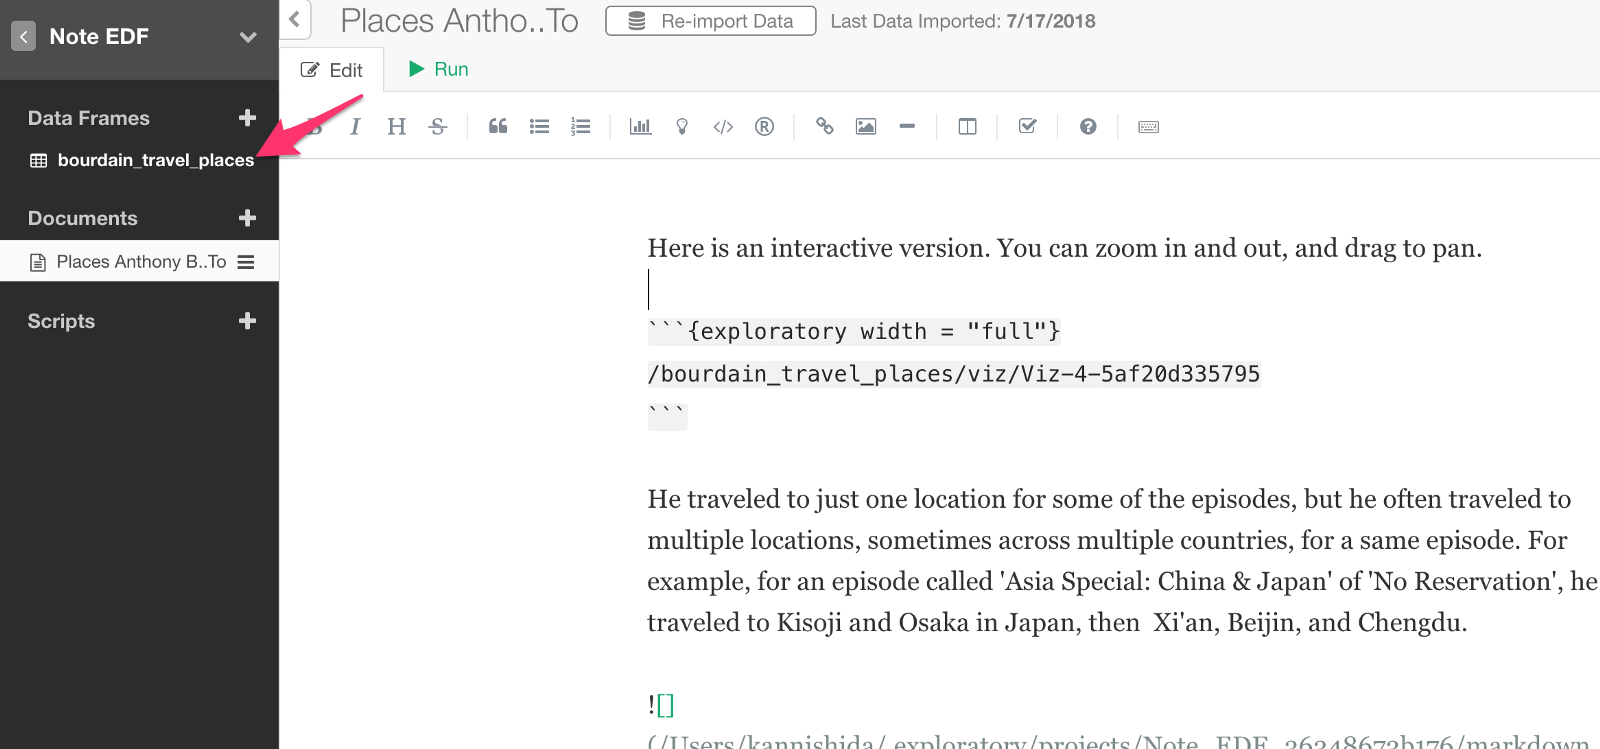
This will insert a code block section with ‘exploratory’ attribute like below.
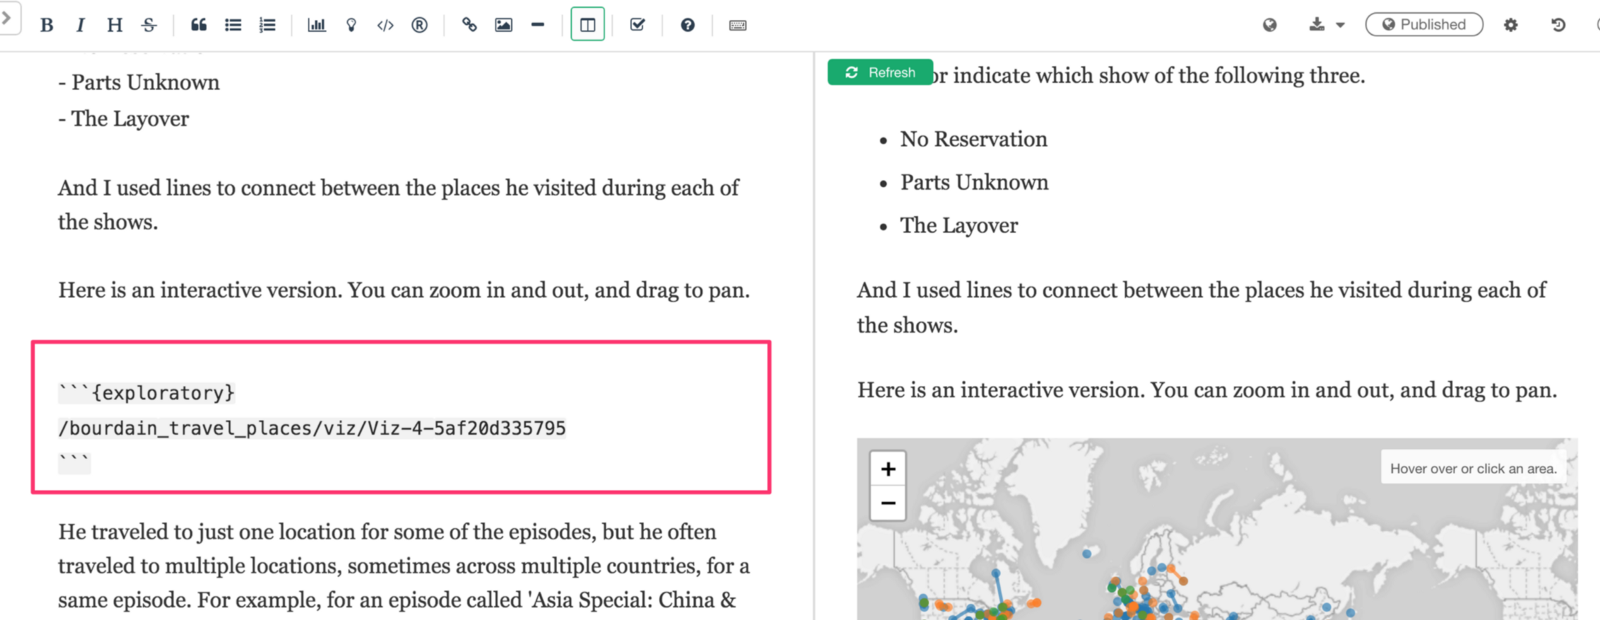
You can generate the report by clicking on Run button when you are in Edit-Run Toggle mode.
You can click ‘Refresh’ button when you are in Side-by-Side mode.
How does the data is generated for all the charts?
When Note tries to generate the embedded charts it actually checks if the underlying data for the chart has already been processed and ready or not. And if not, it takes care of the data processing by automatically running the data wrangling steps that are associated with the charts.
For example, let’s say you have just opened the Note without opening the chart or its corresponding data frame in this session. This means that the data for the chart has not been processed yet. In this case, the Note will automatically process all the required data wrangling steps and get the chart data ready as part of the Note output rendering process. It just works! 💪
4. Embed Analytics Charts
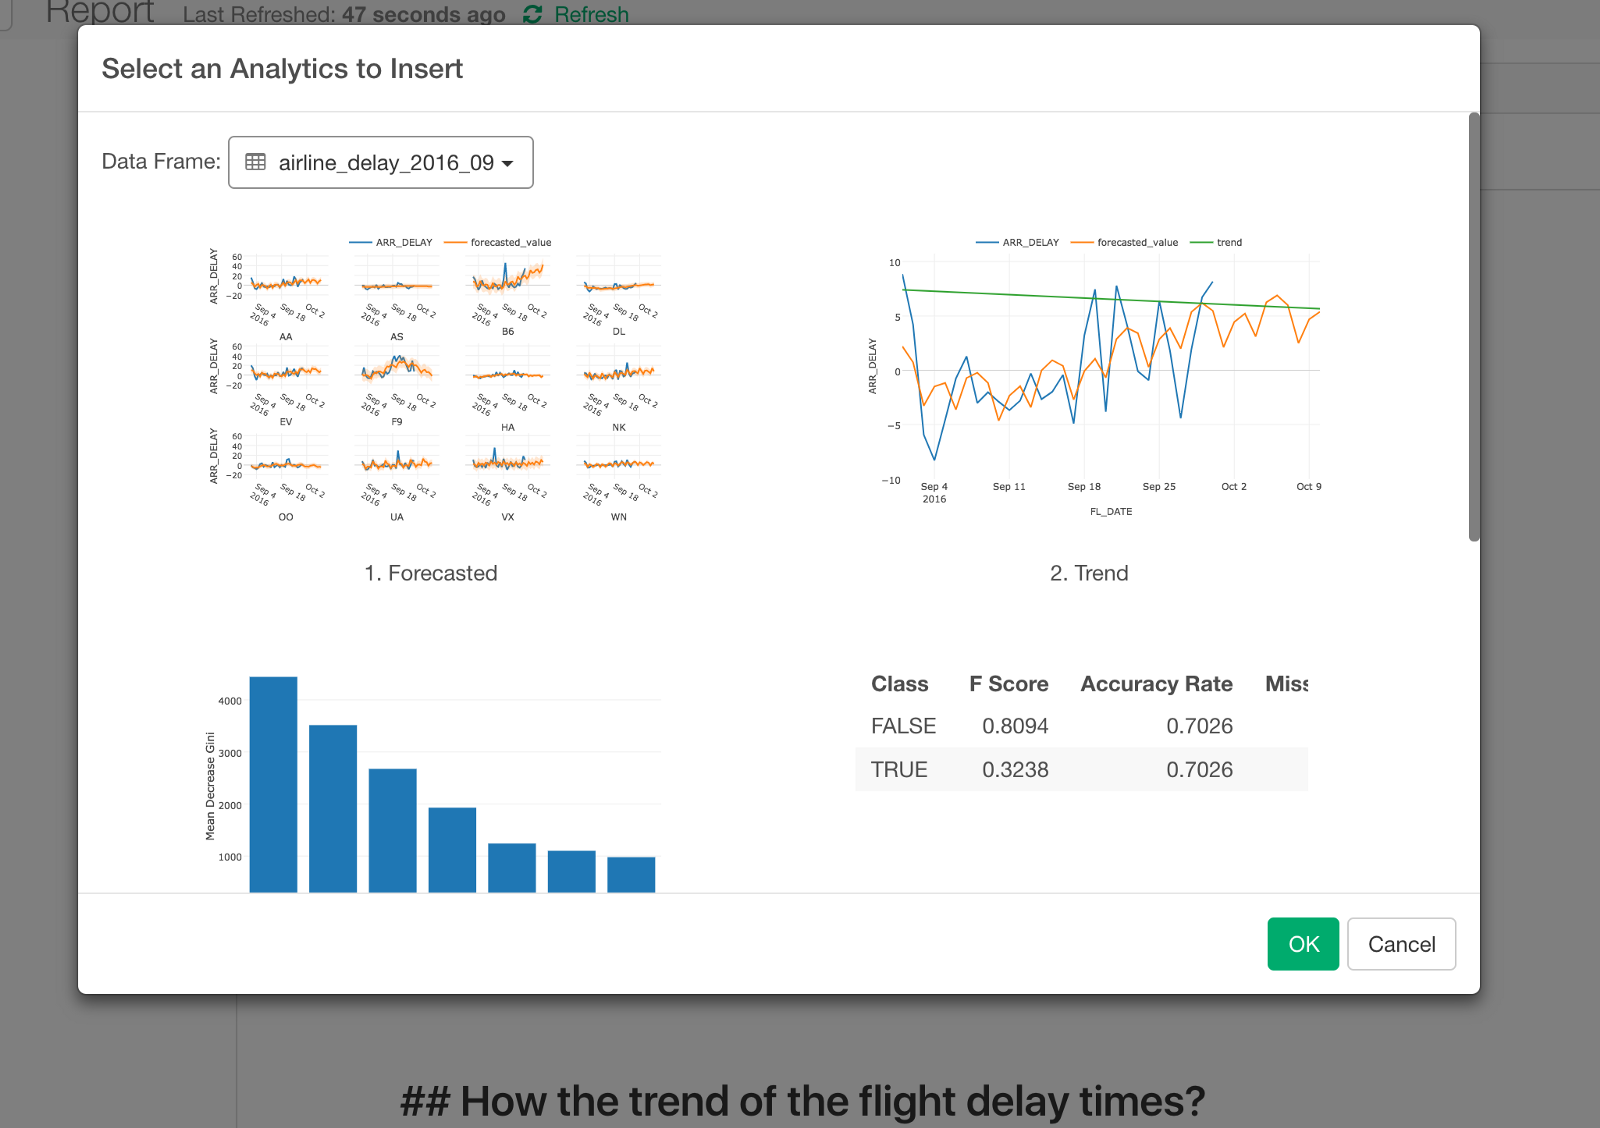
You can embed the Analytics charts into Note as well!
In Note, you can click on ‘Analytic’ icon in the toolbar.
And you can select a particular Analytics view in the dialog.
This will generate a code like below.
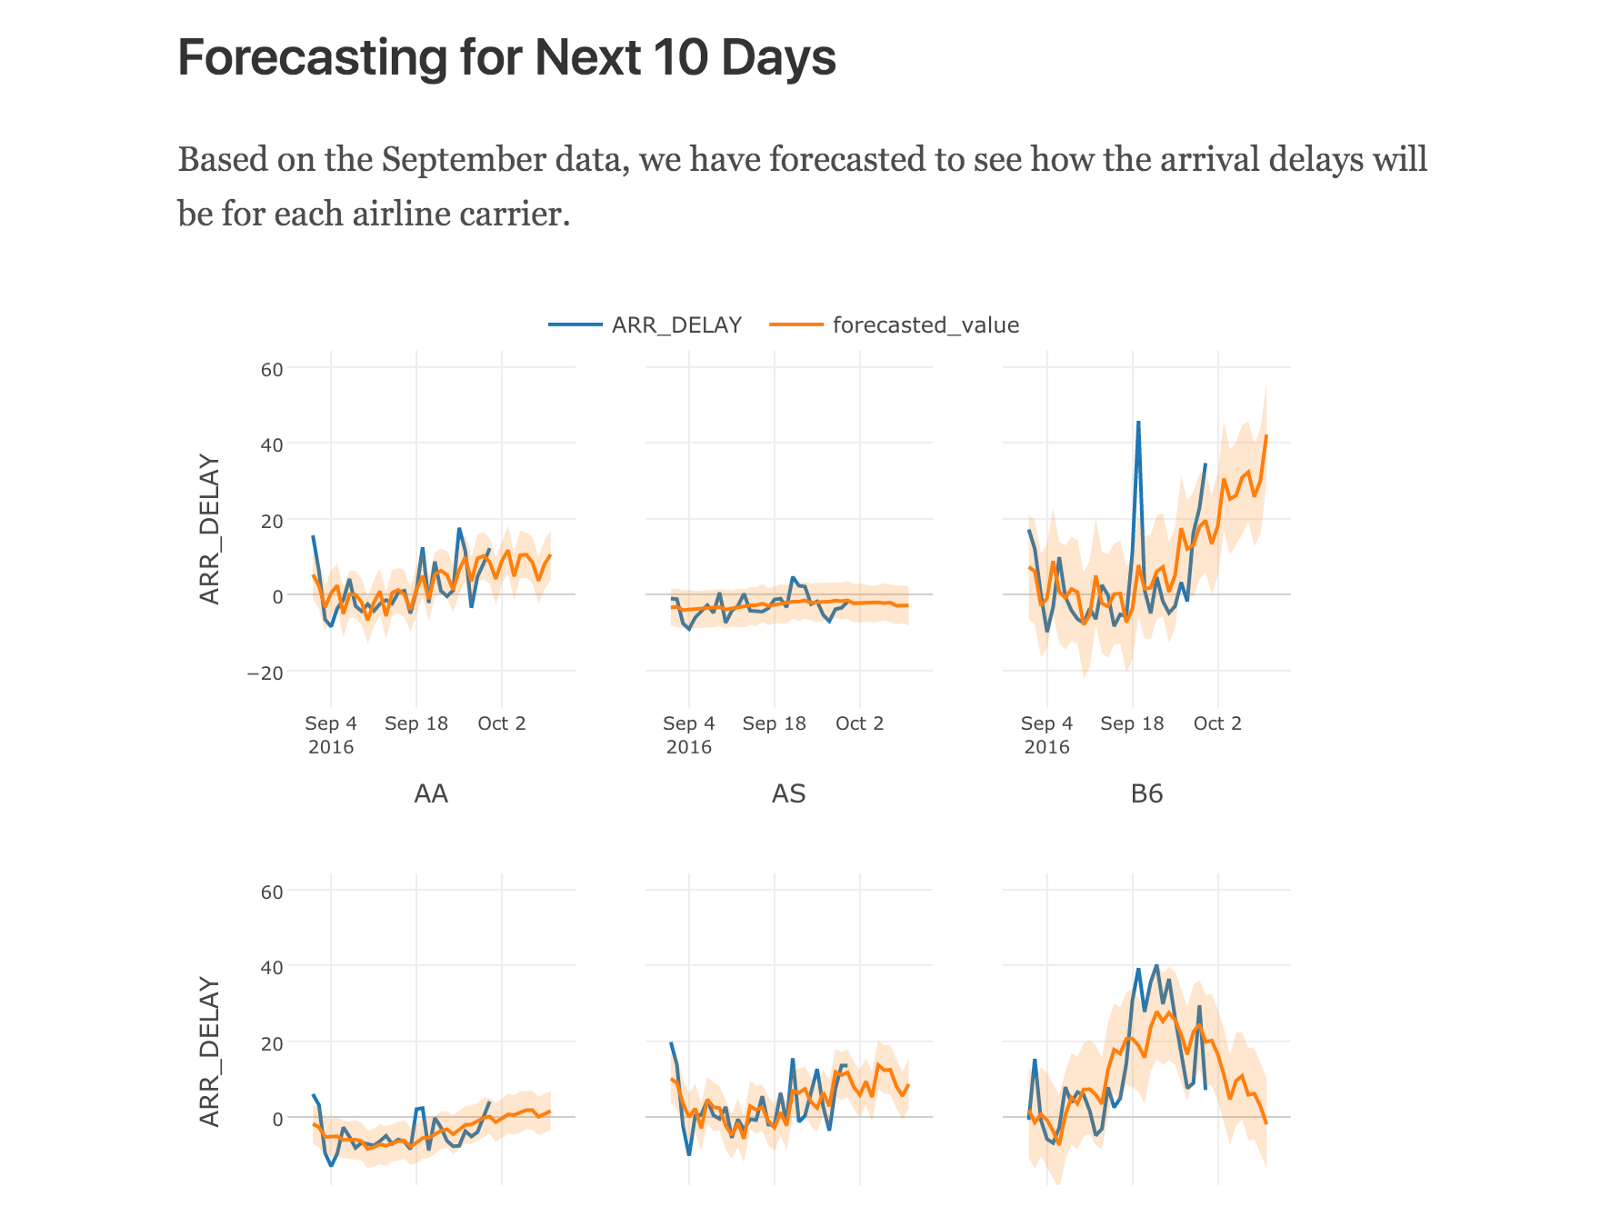
And the chart will be dynamically generated when you click on Run button, just like the charts from Visualization view.
5. Make Chart Size Wider
By default, the charts would be generated as wide as the note body text area.
But you might want some of the charts showing up wider by taking up more space at the right and the left sides.
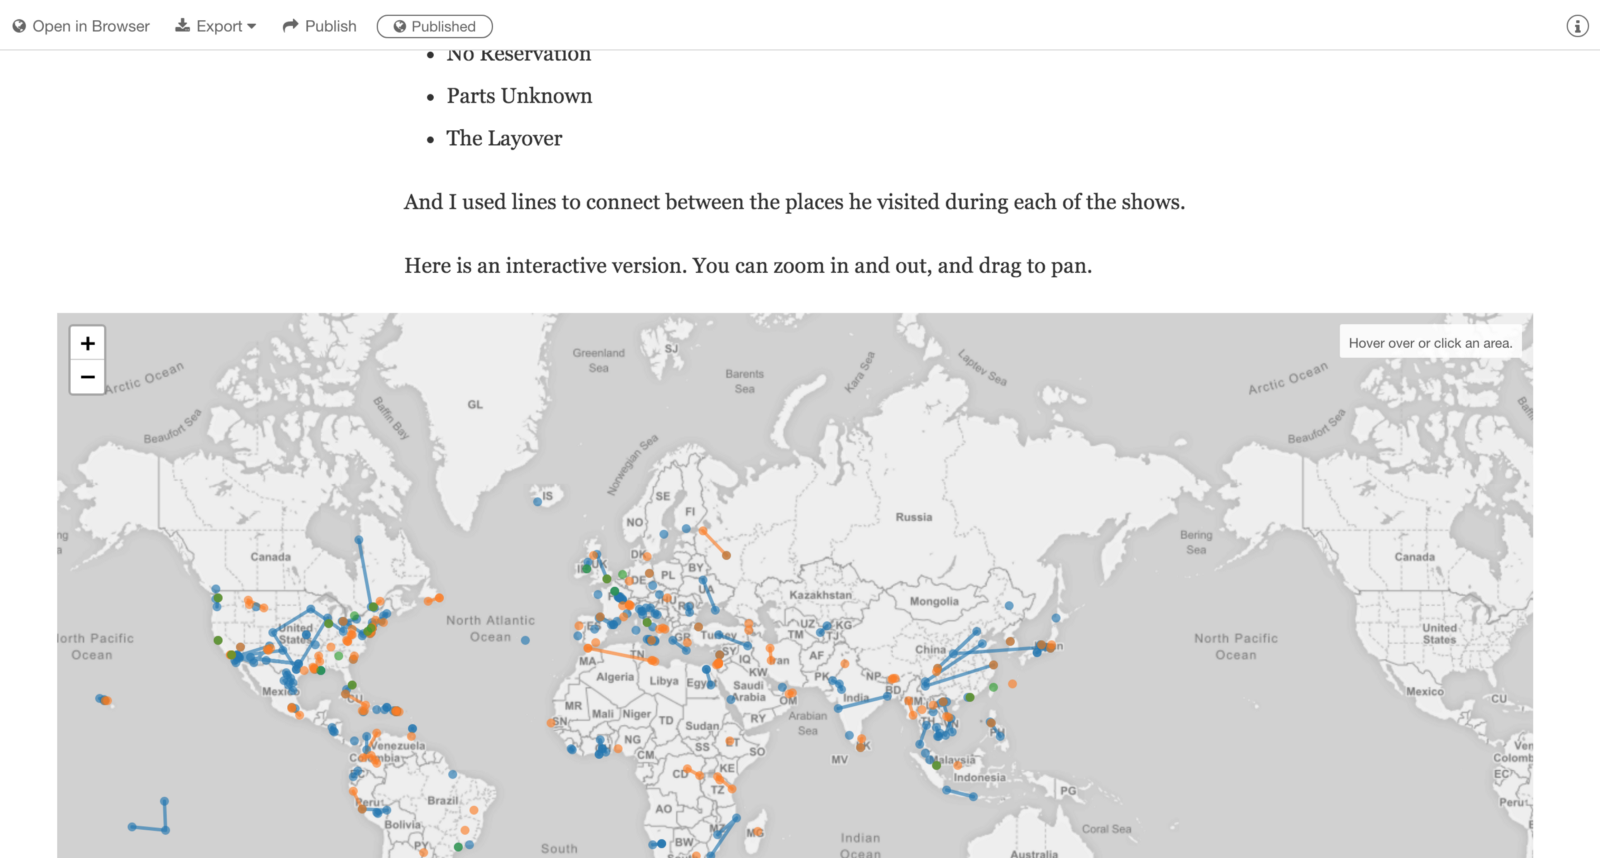
You can do this by setting the ‘width’ attribute to ‘full’ inside the ‘exploratory’ tag like below.
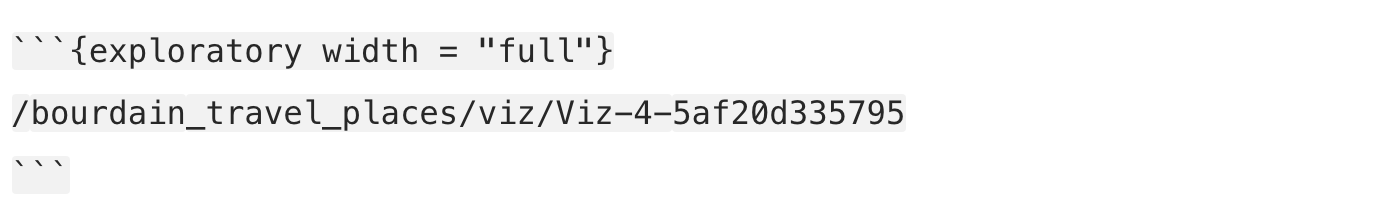
This will show the charts with the full document width.
Showing Pivot, Table, and Small Multiple without Scrollbar
By default, these will have scrollbars at the right hand side when there are more data than the default height.
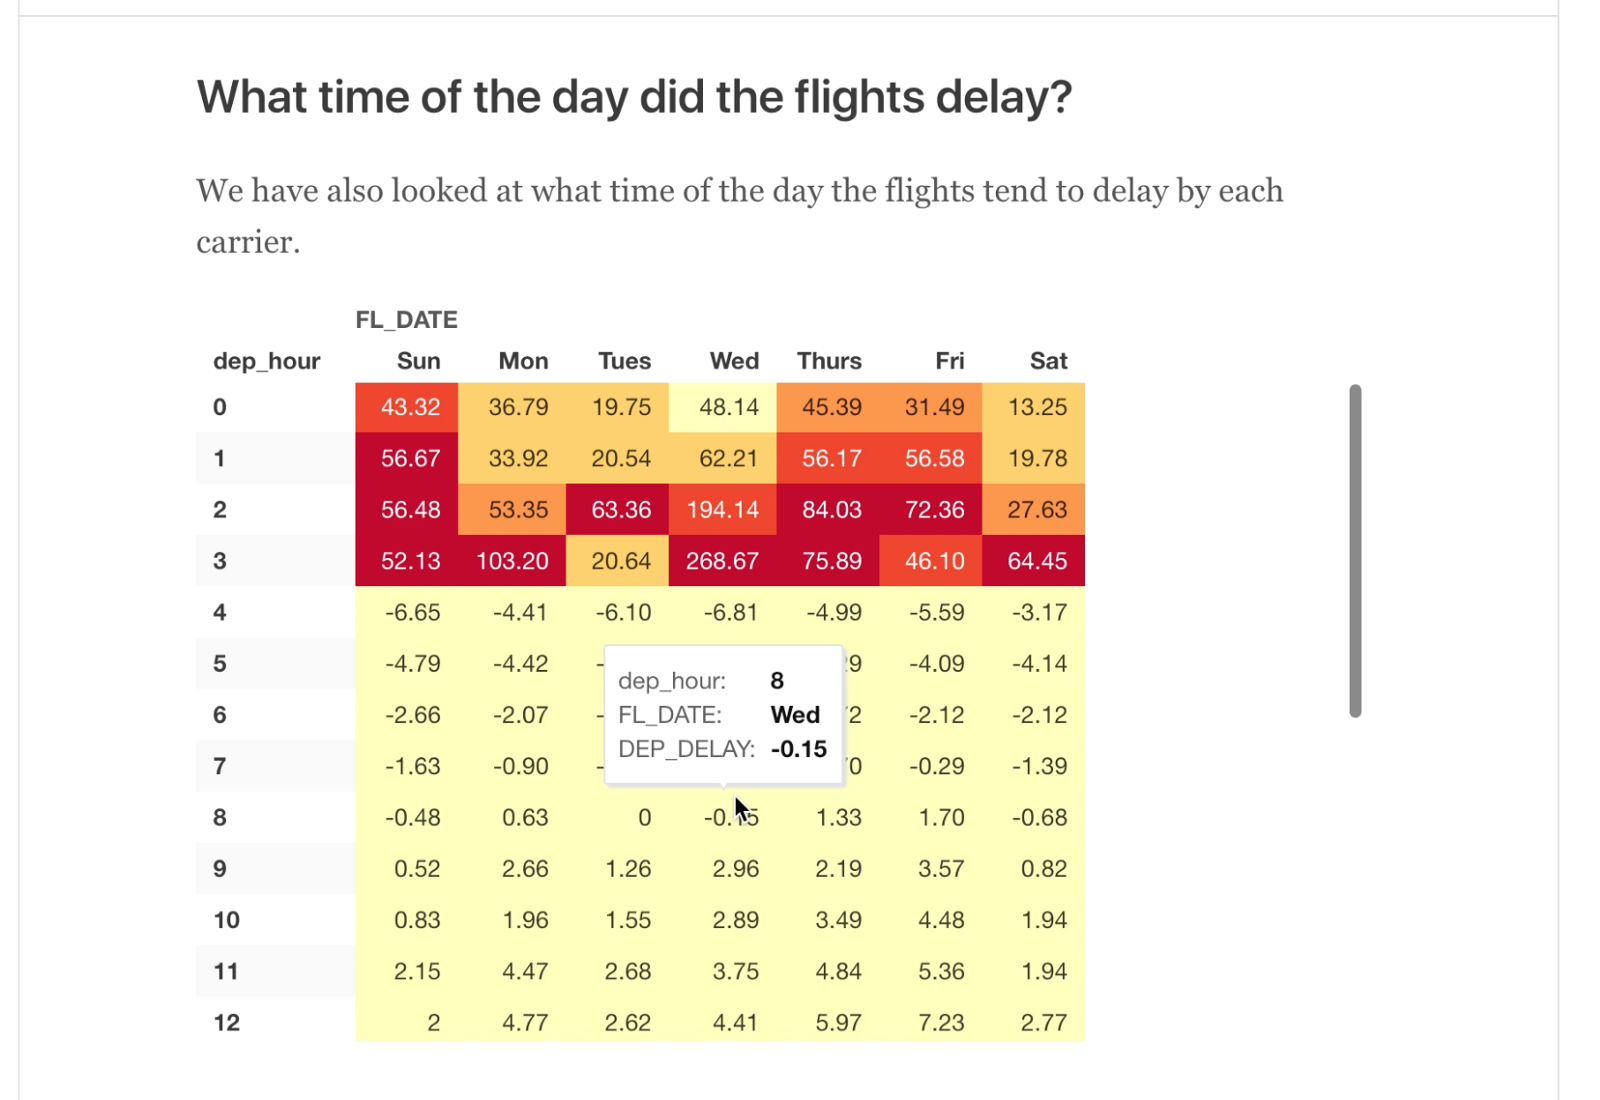
But sometimes, you might want to show the full length of the Pivot Table data. In such case, you can do it by setting the ‘height’ attribute to ‘full’ like below.
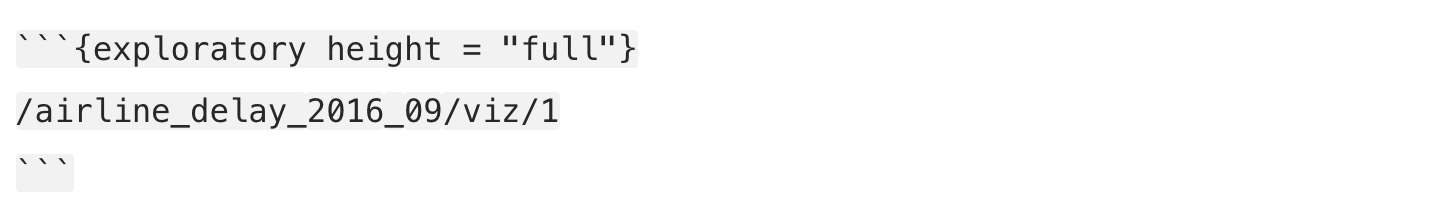
This will show the Pivot table at full length.
6. Embed R Codes
If you are familiar with R Markdown or comfortable with writing R codes then you might want to embed your own R codes and have them generate the outputs as part of your note, thanks to an R Markdown integration.
There are two ways to embed R codes.
- Quote Block
- Inline Text
R Code — Quote Block
Click the ‘circled R’ button in the tool bar to start. This will populate the R code block like below.
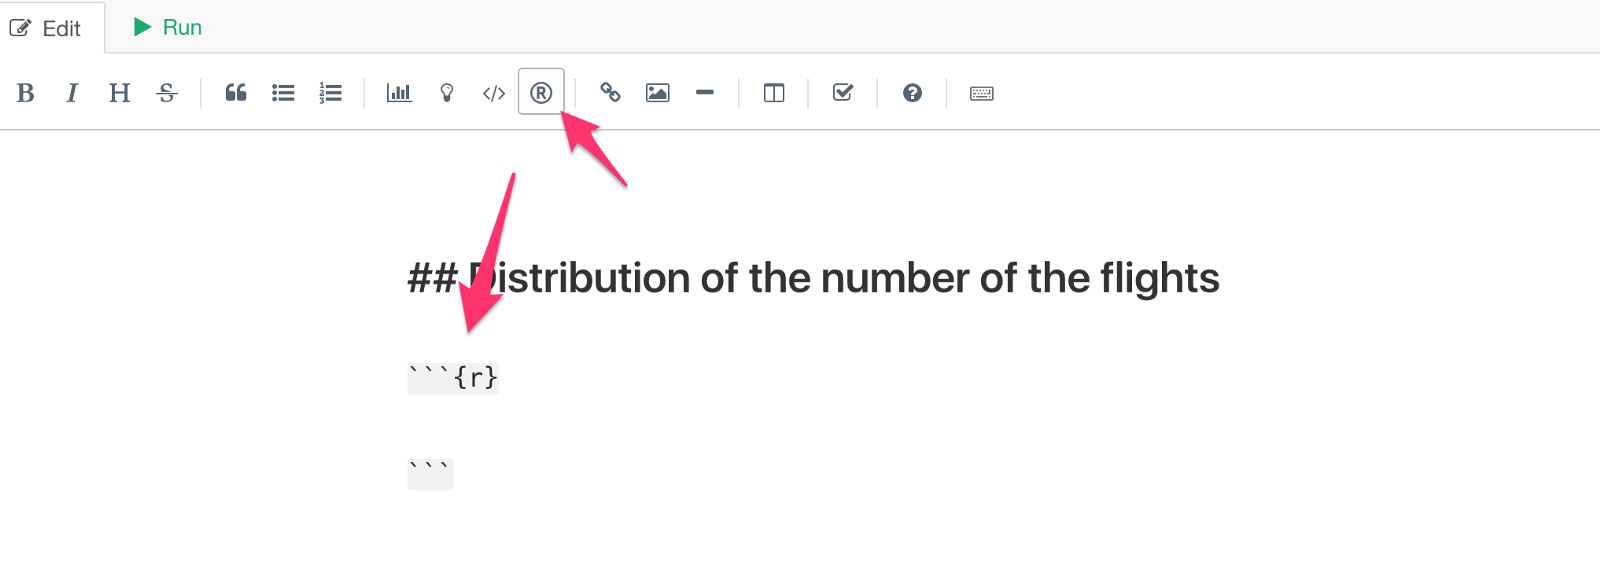
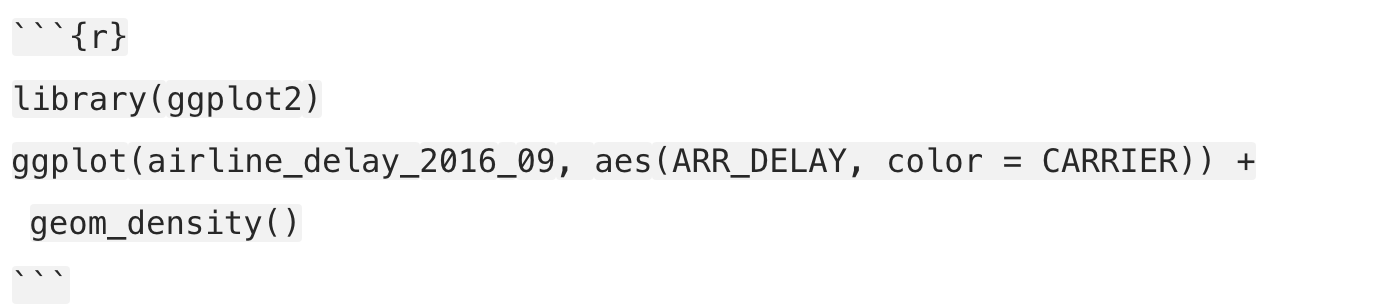
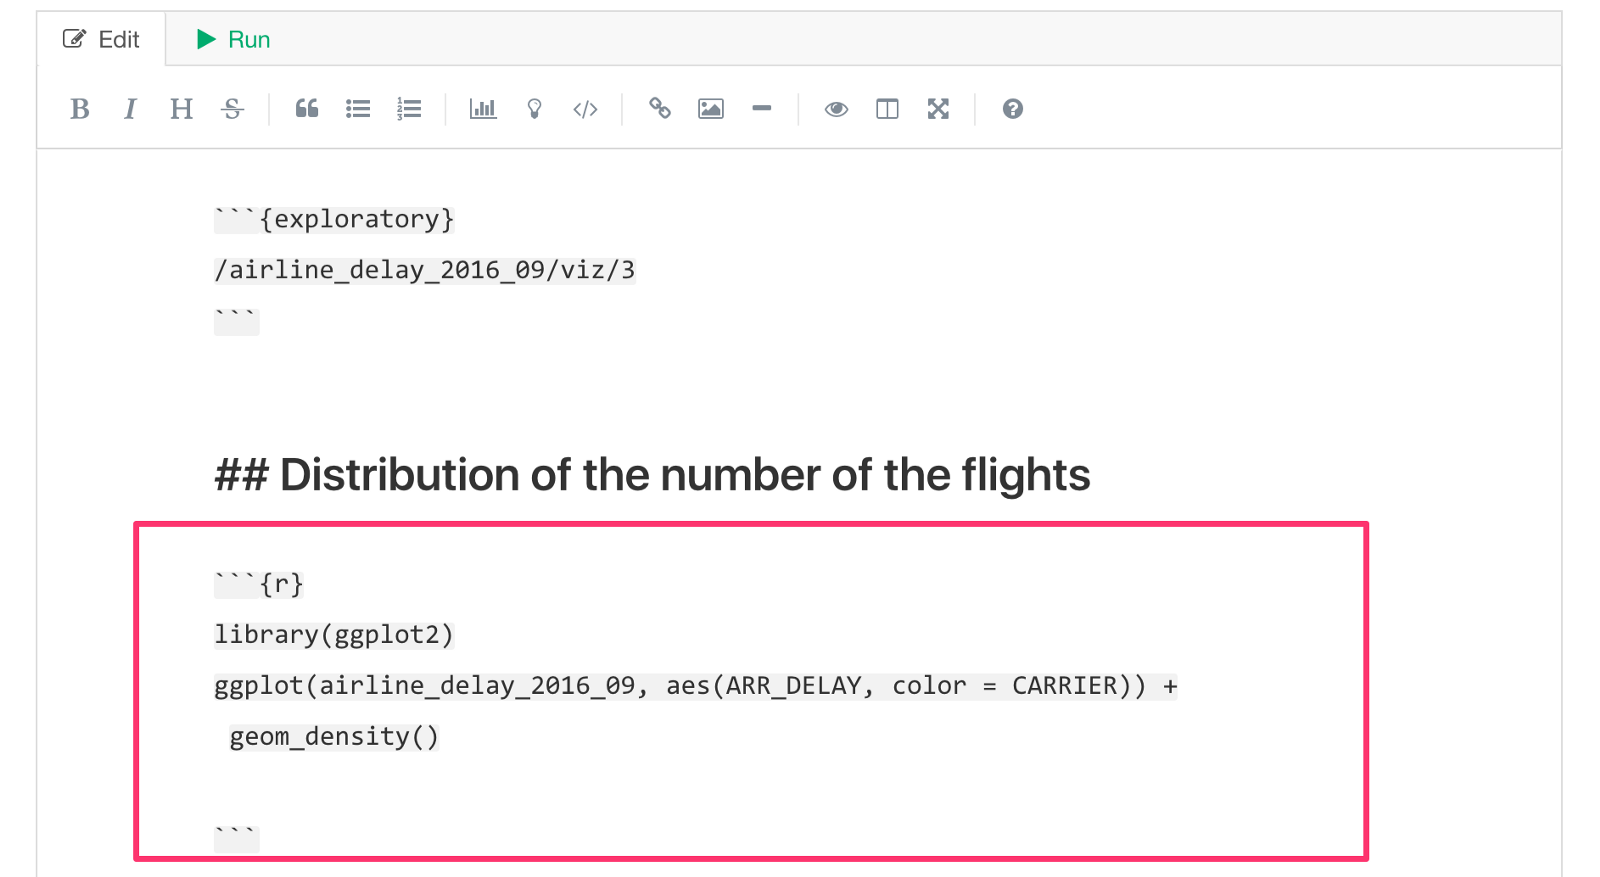
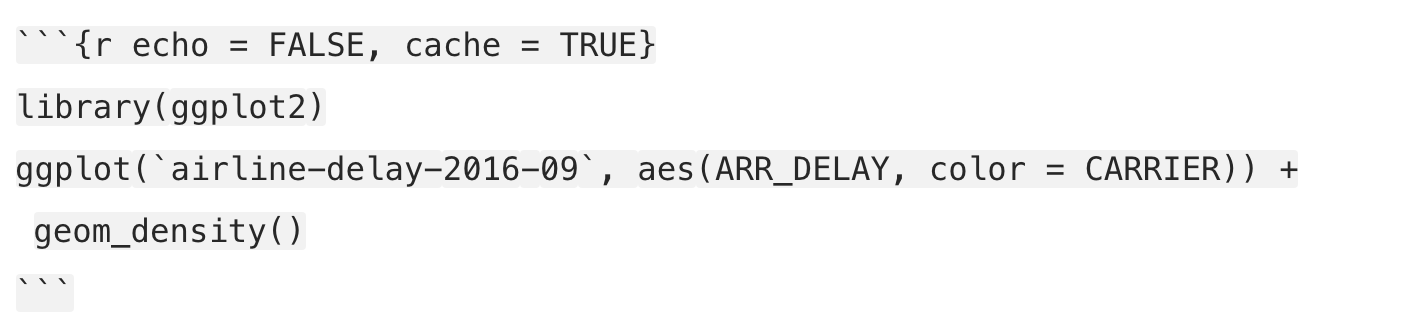
Inside the code block, you can write whatever R codes you like. For example, here I’m writing R code to generate a density plot by using ggplot2 package.
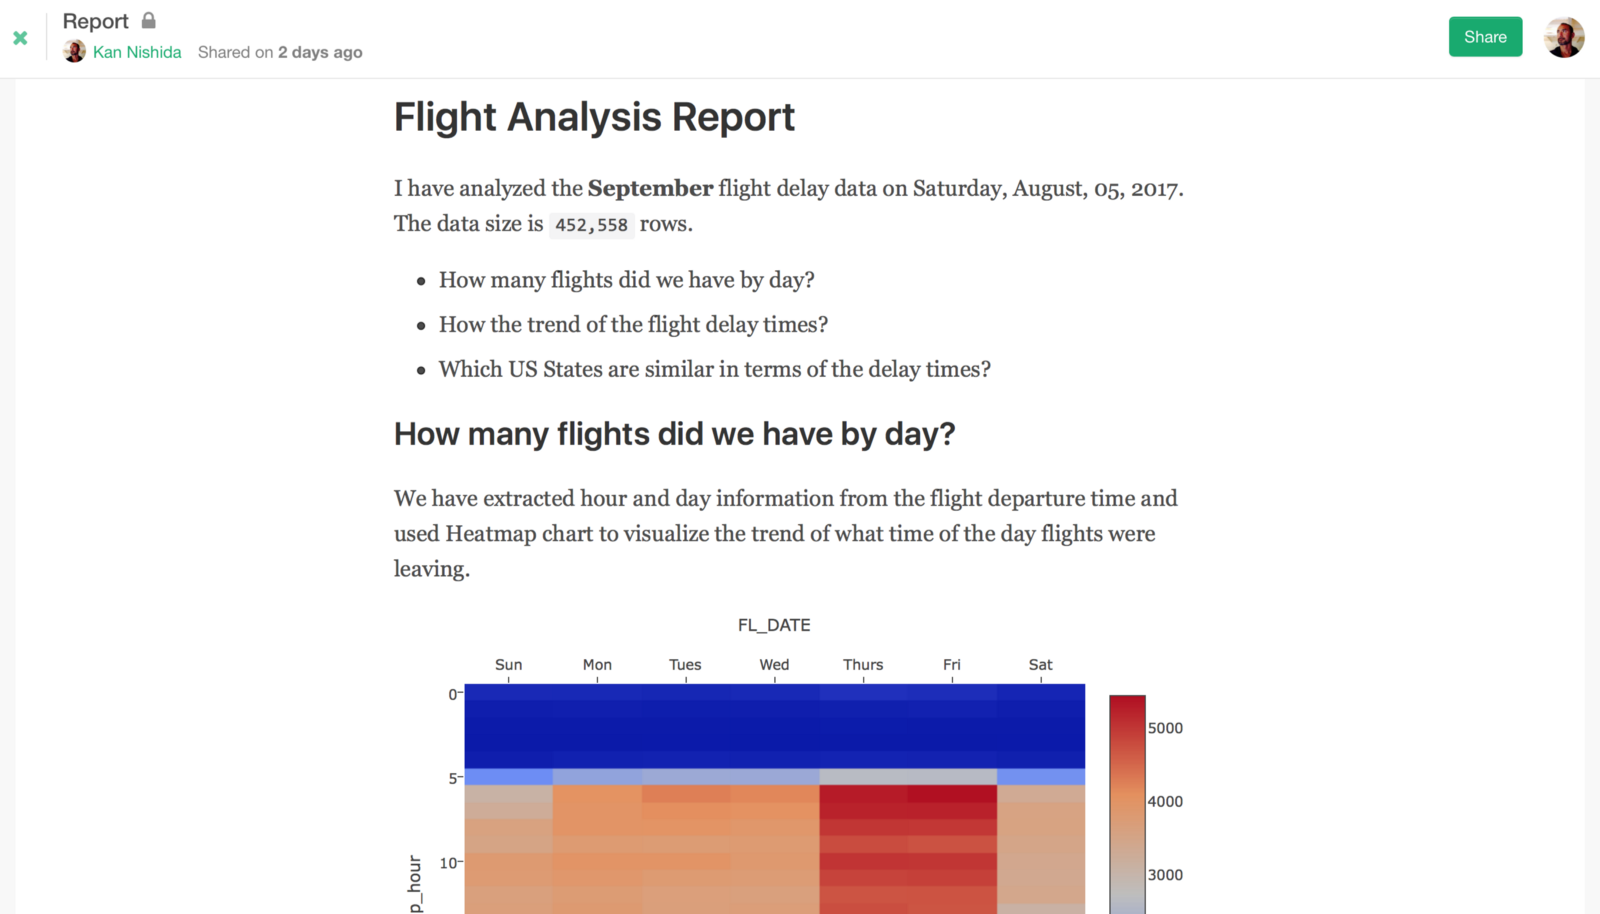
This will generate the output like below when you click on Run button.
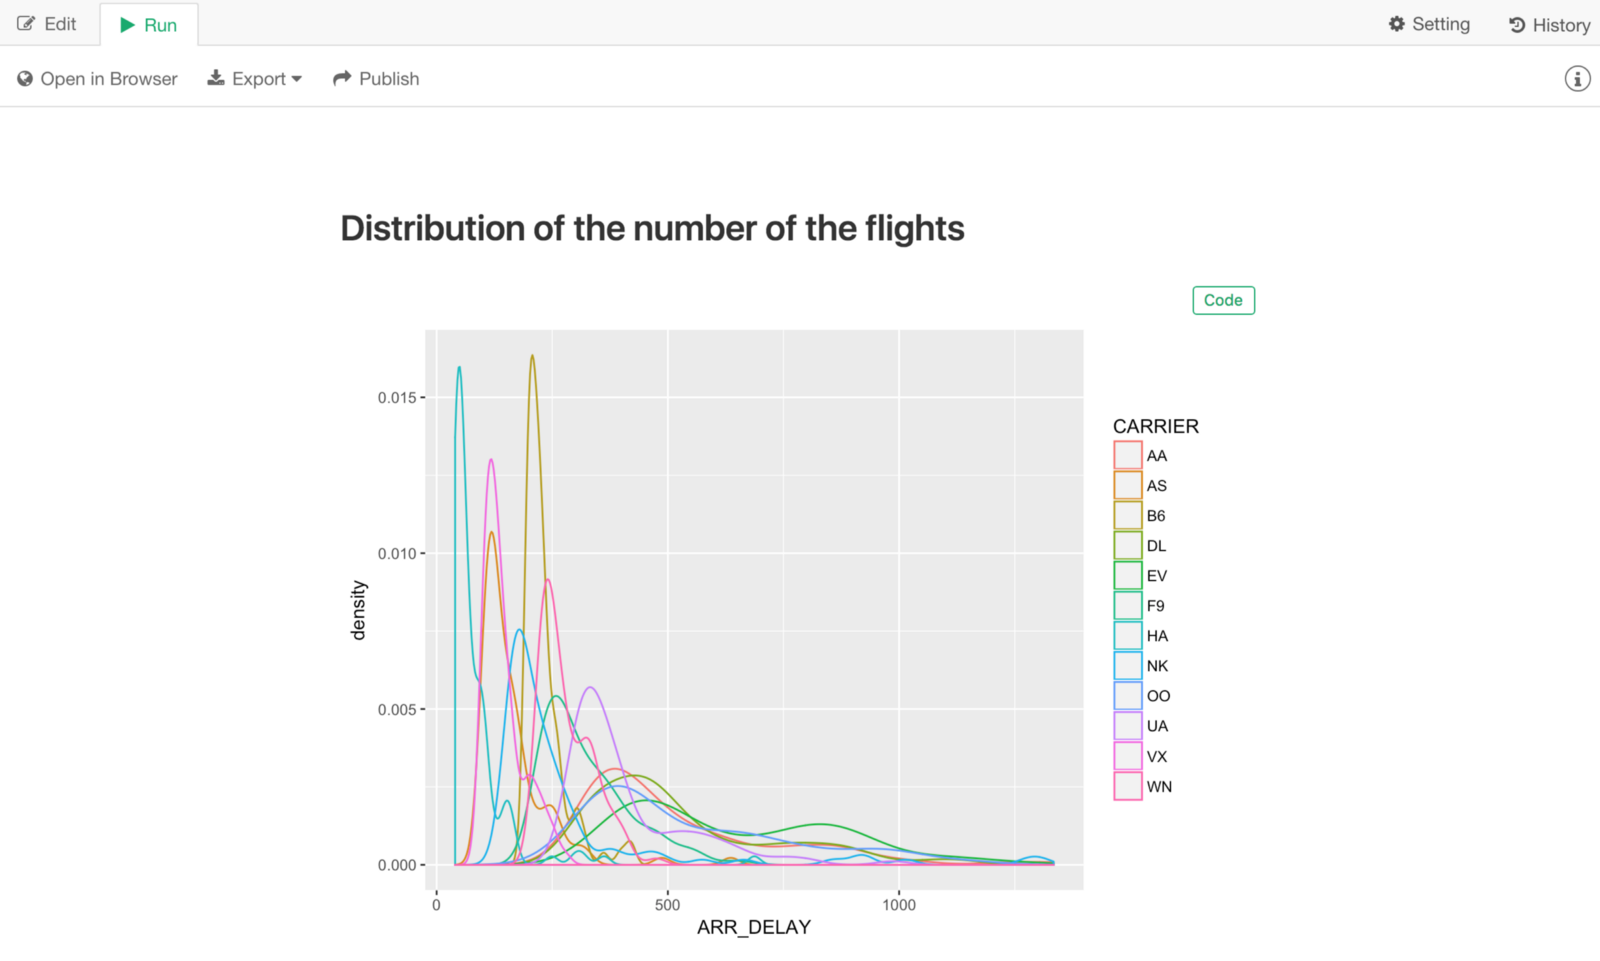
Notice that there is a ‘Code’ button.
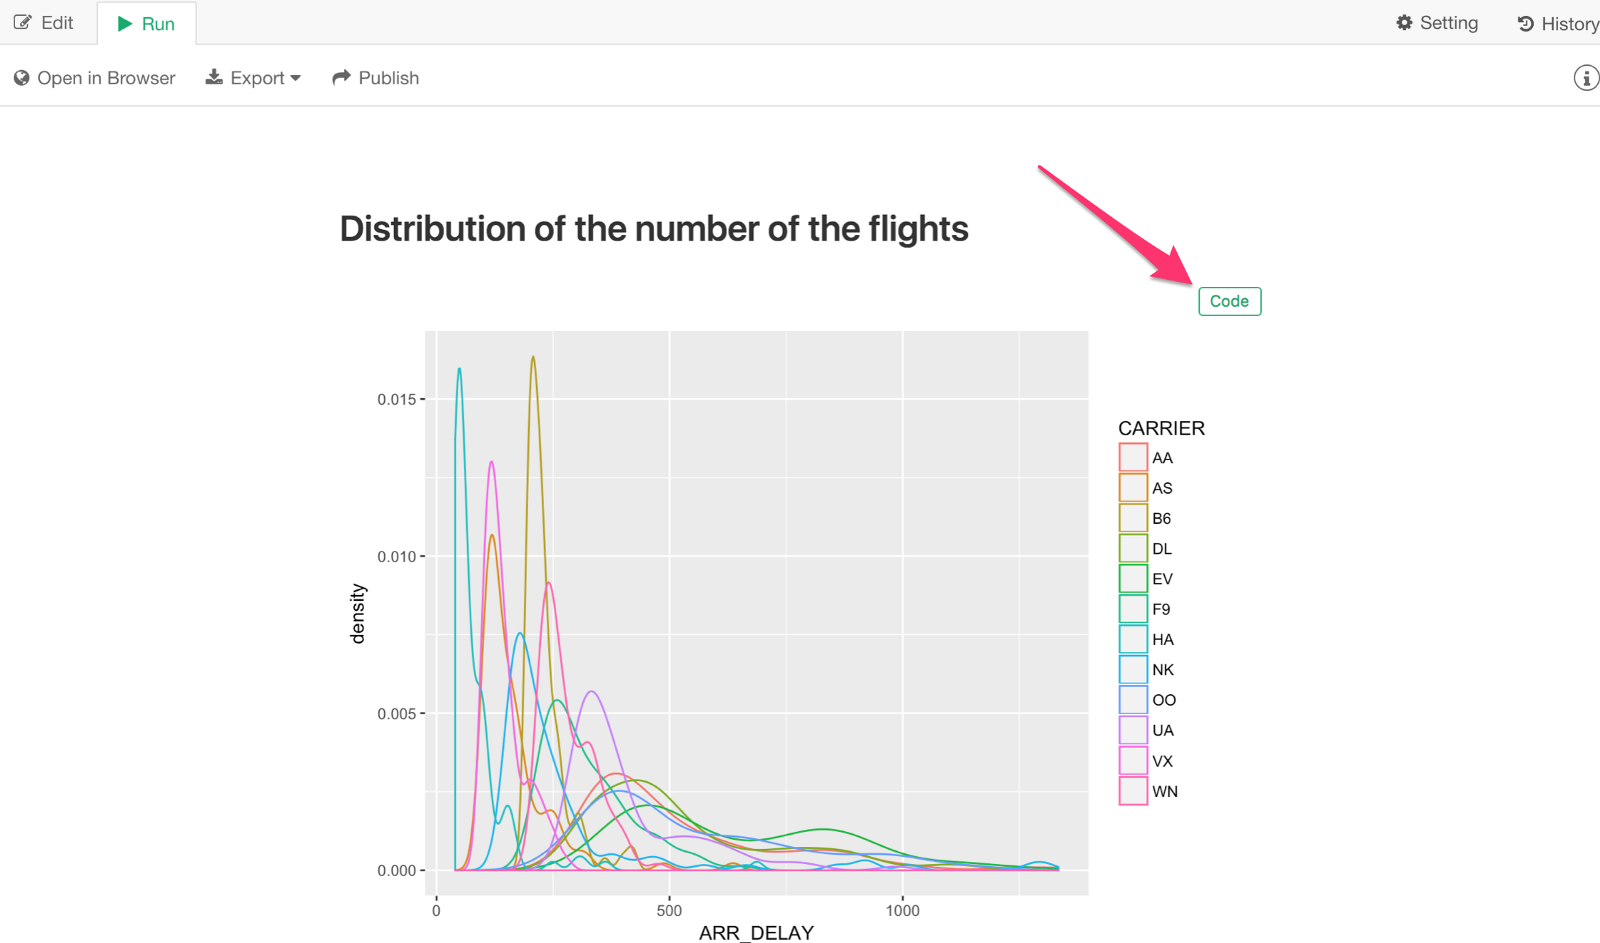
You can click to show the R code that is behind the chart.
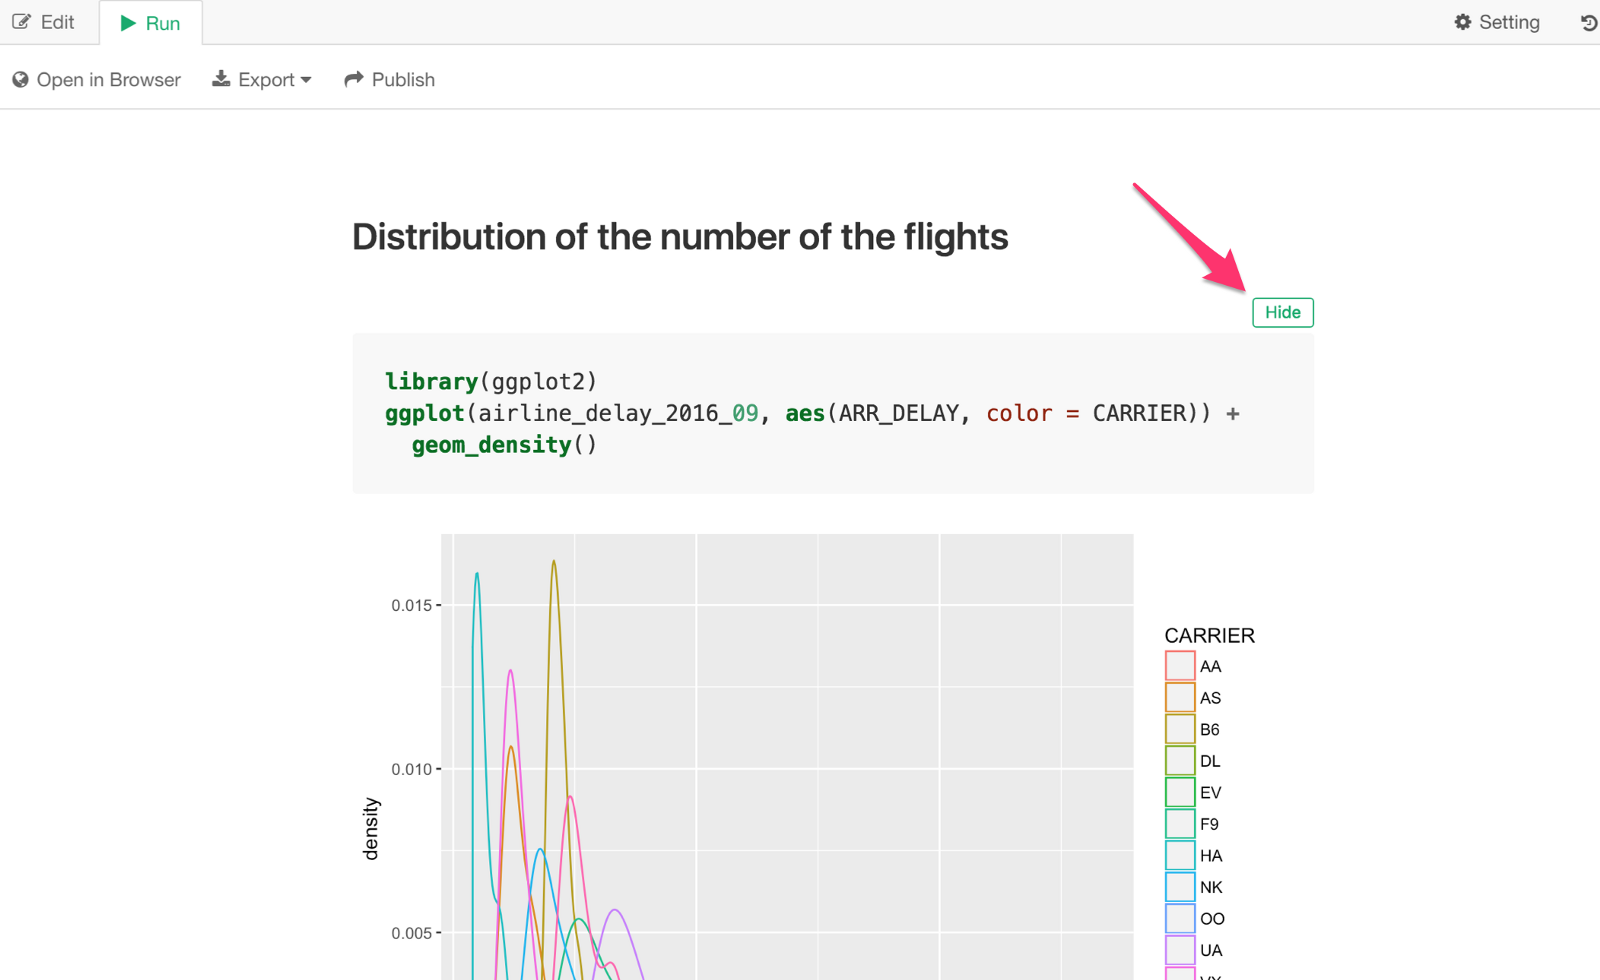
You can change this by setting ‘Code Folding’ to ‘Off’ in Setting dialog.
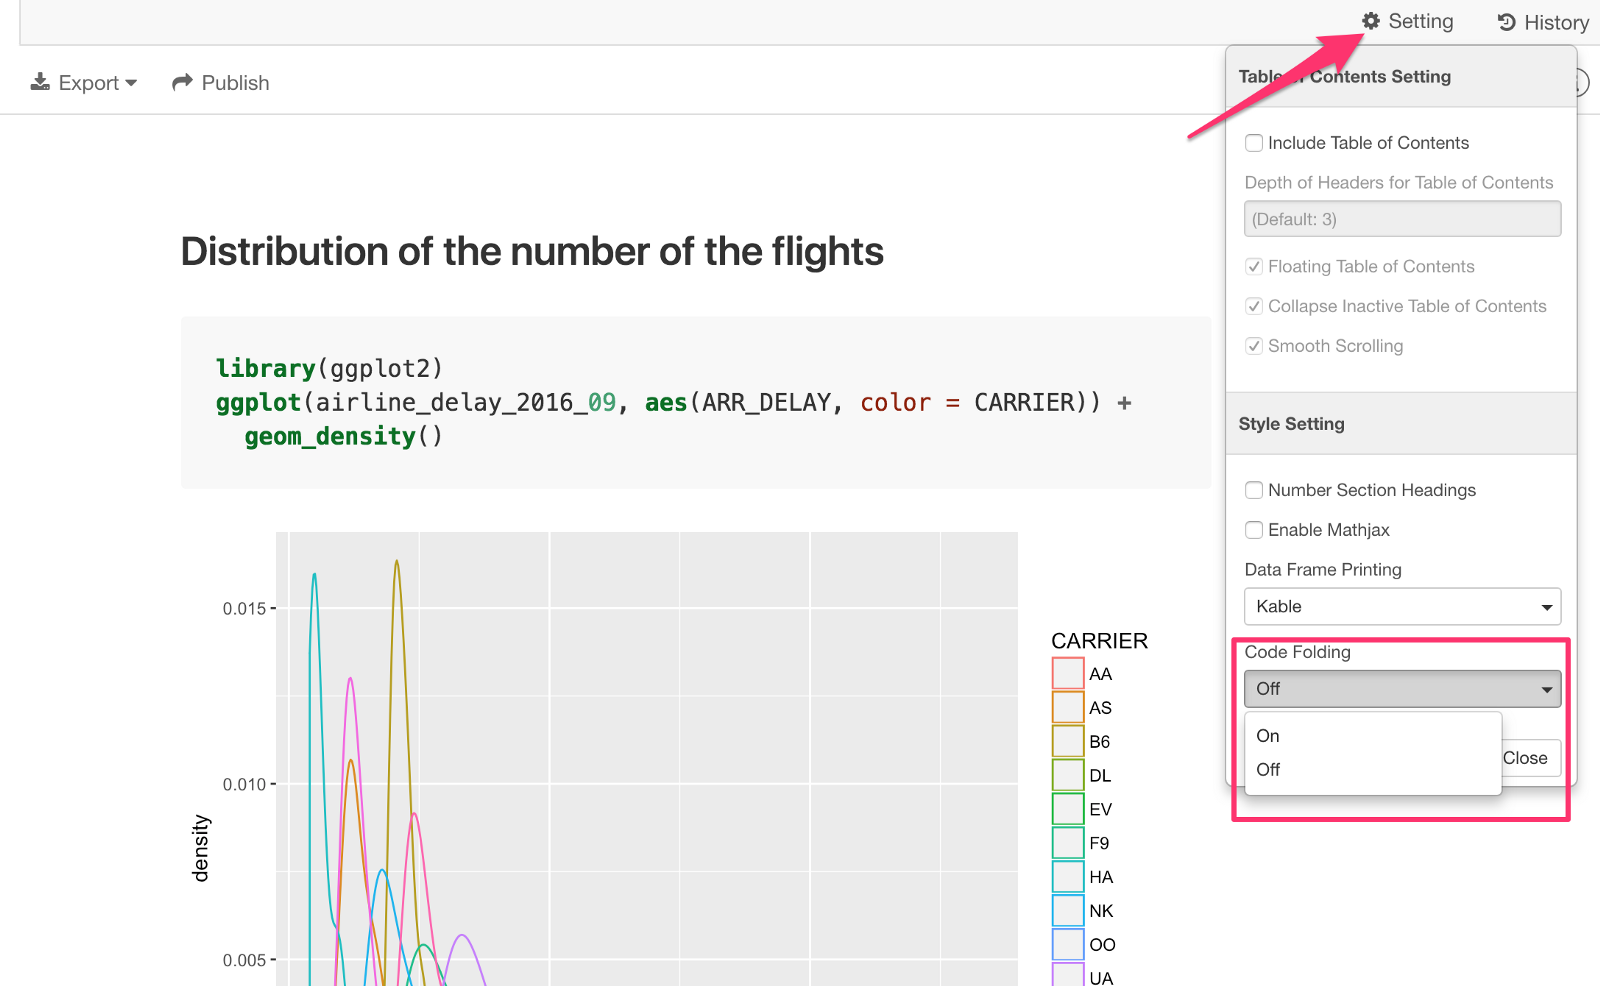
This will show the code always.
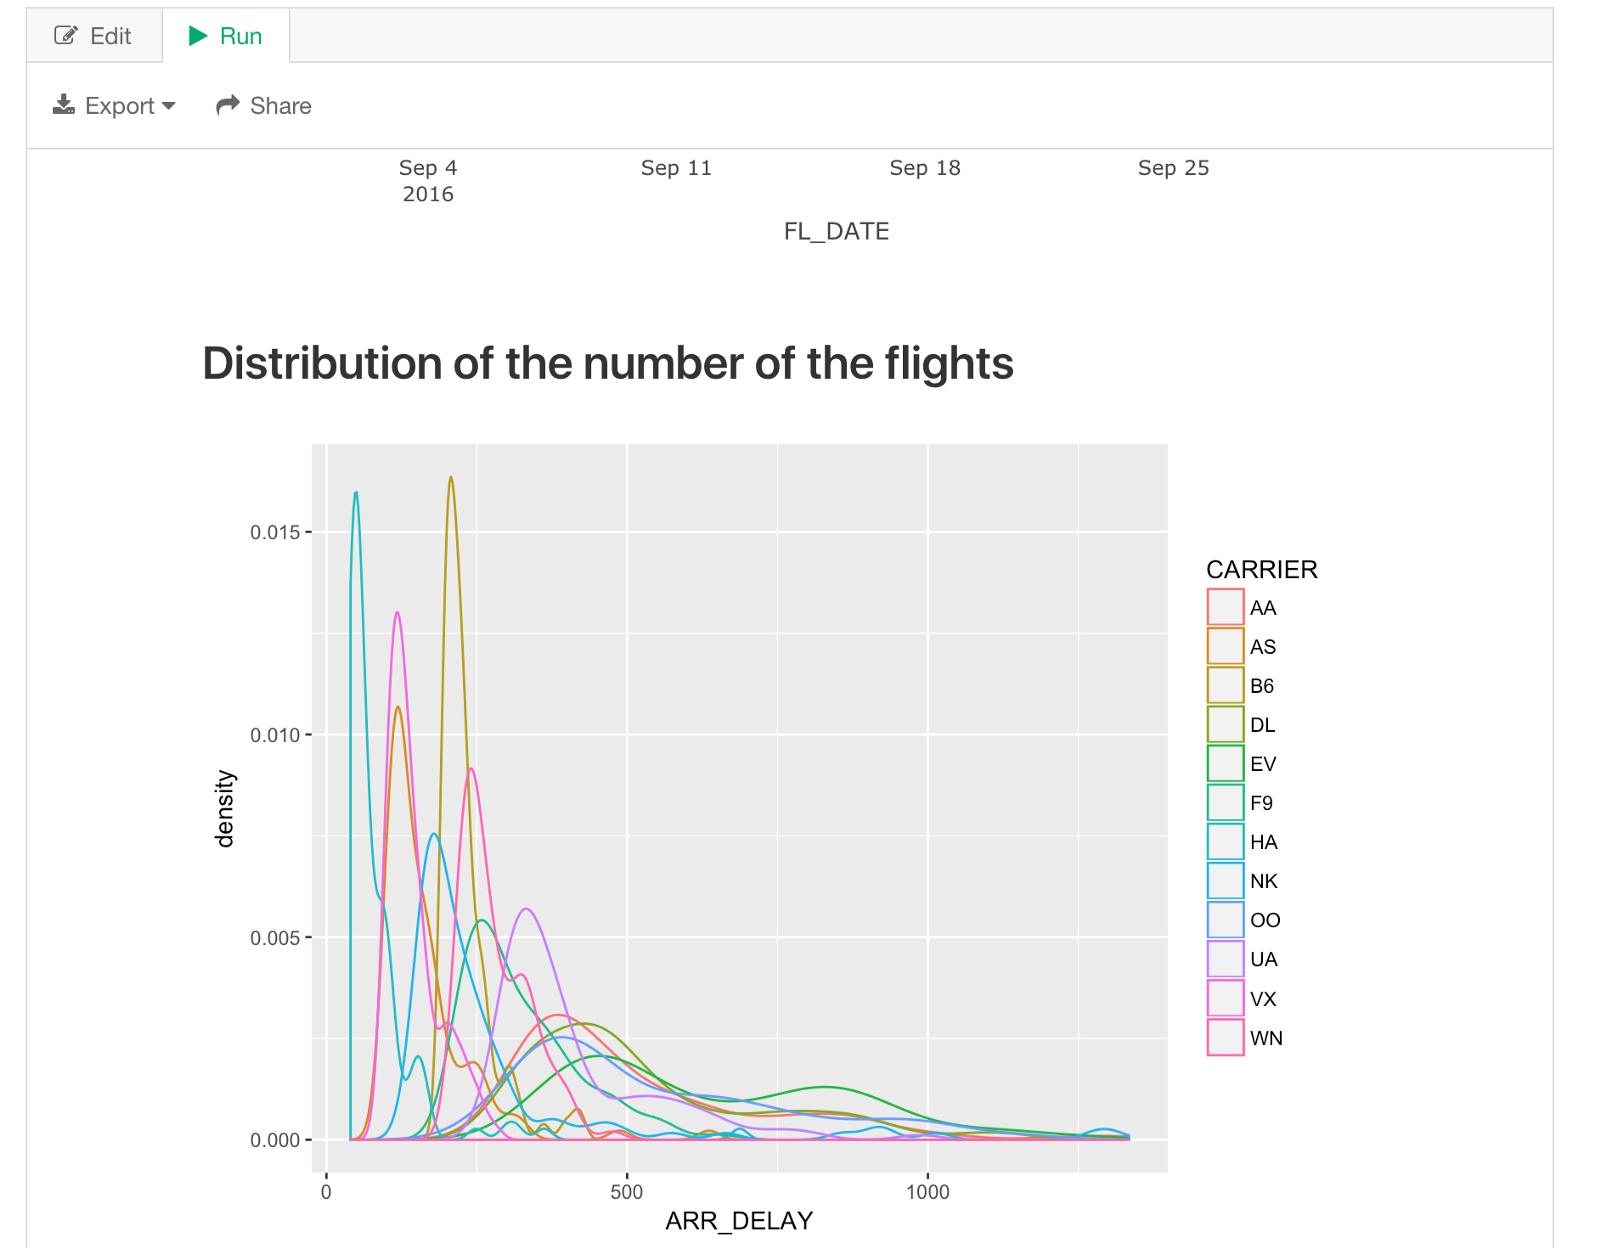
If you want to get rid of this code completely, then you can use ‘echo’ parameter inside ‘r’ section like below.
This will generate only the output like below.
7. Embed Inline R Code
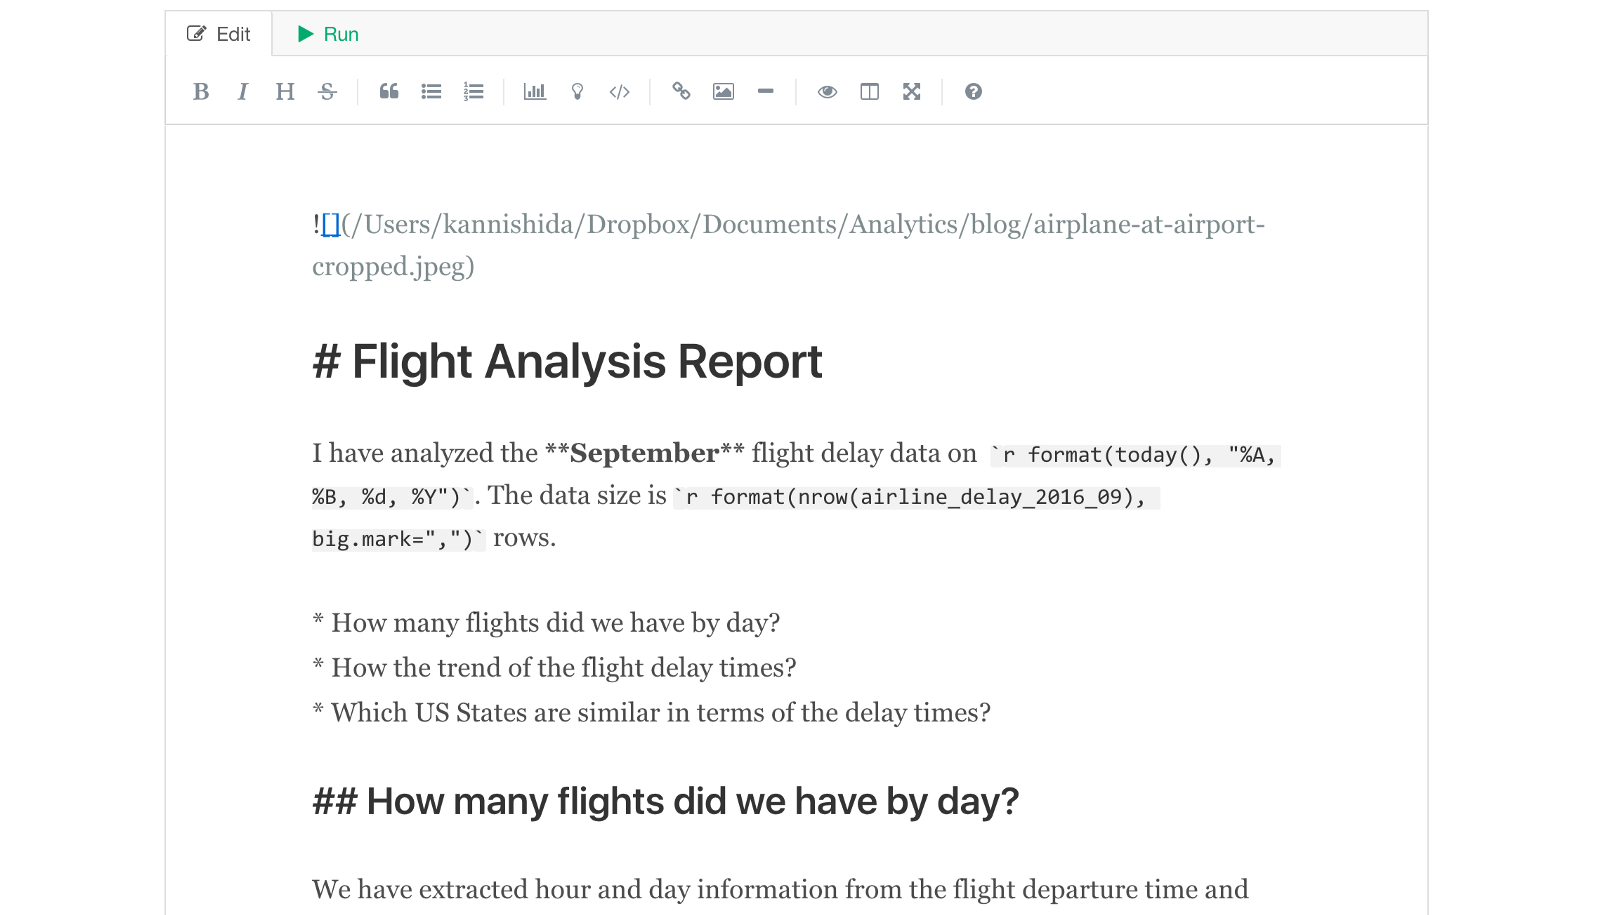
Another cool thing with the R Markdown integration is that you can embed something called ‘inline’ R code. This means that you can make the part of the text sentence dynamically generated by R.
Here, I’m generating today’s time dynamically in the first section by using ‘today()’ function from ‘lubridate’ package. In the next sentence, I’m using ‘nrow()’ function from base R to calculate the number of the rows of the data frame I’m referencing for this report.
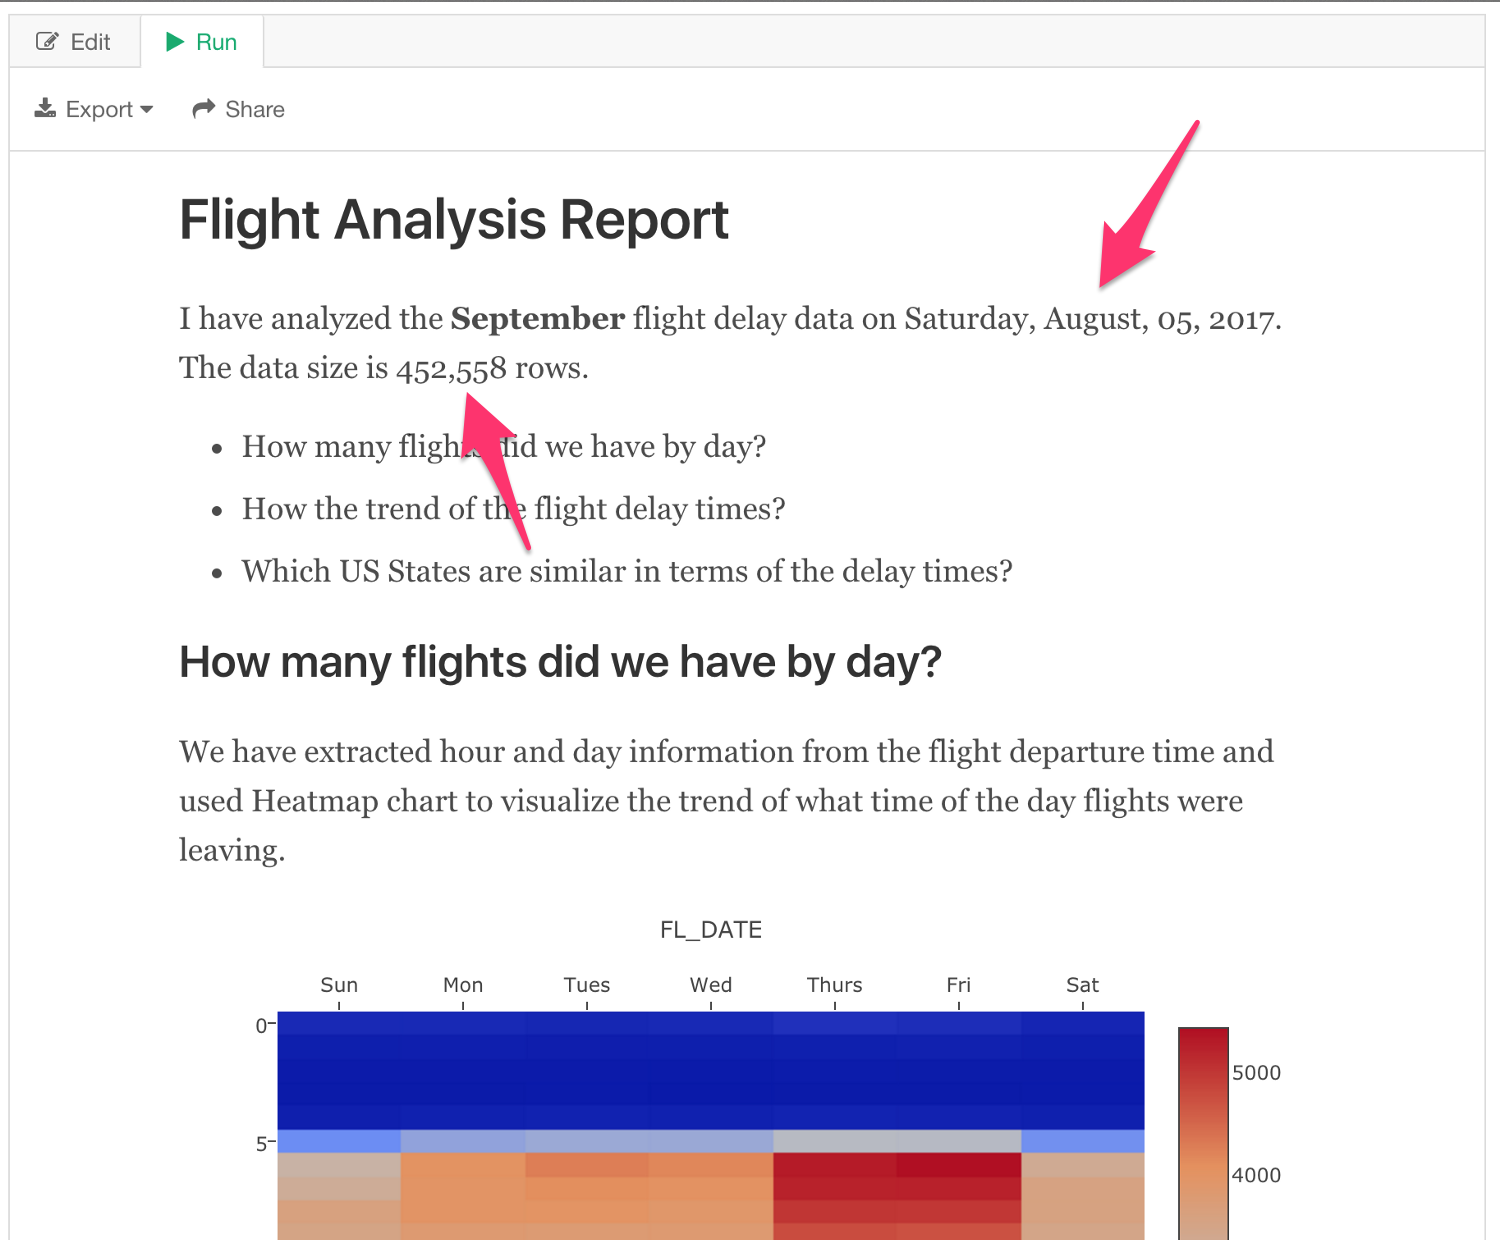
And when I click on Run button we can see those parts are dynamically generated.
There are many other cool things you can do with R codes with R Markdown, which I will write at some other times.
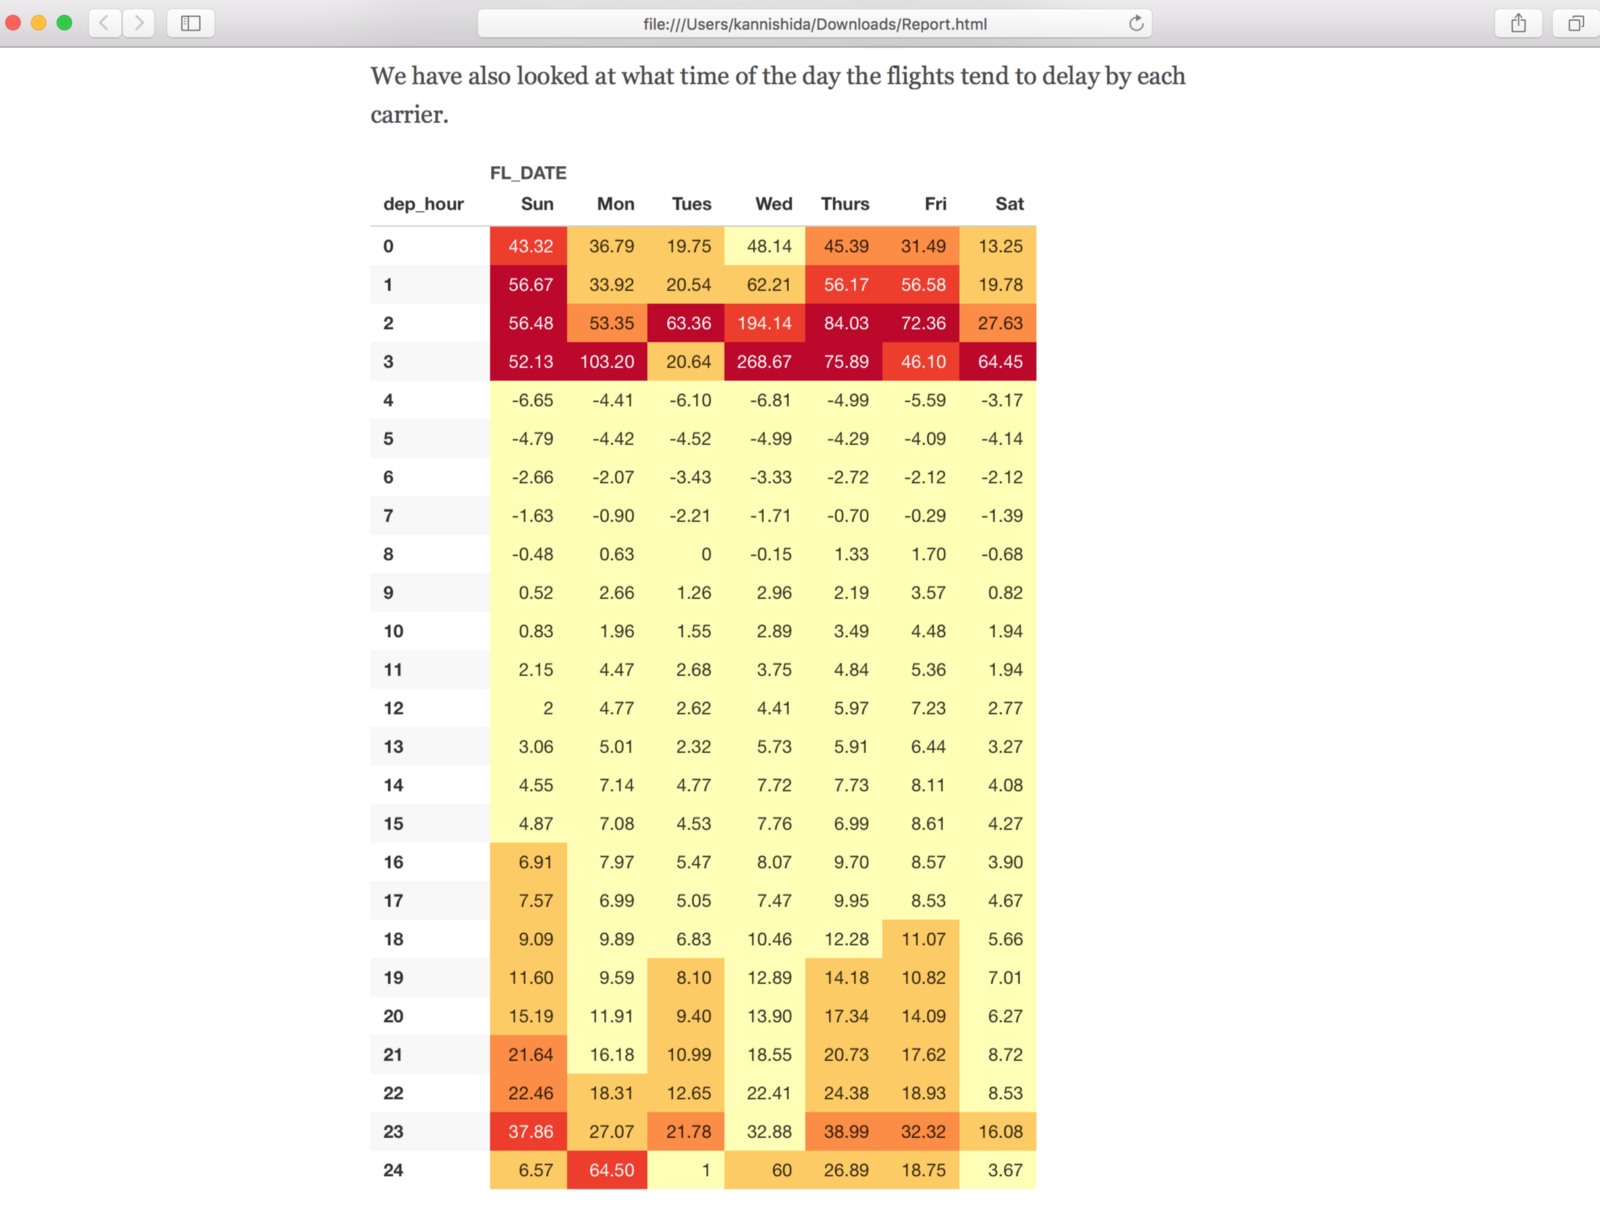
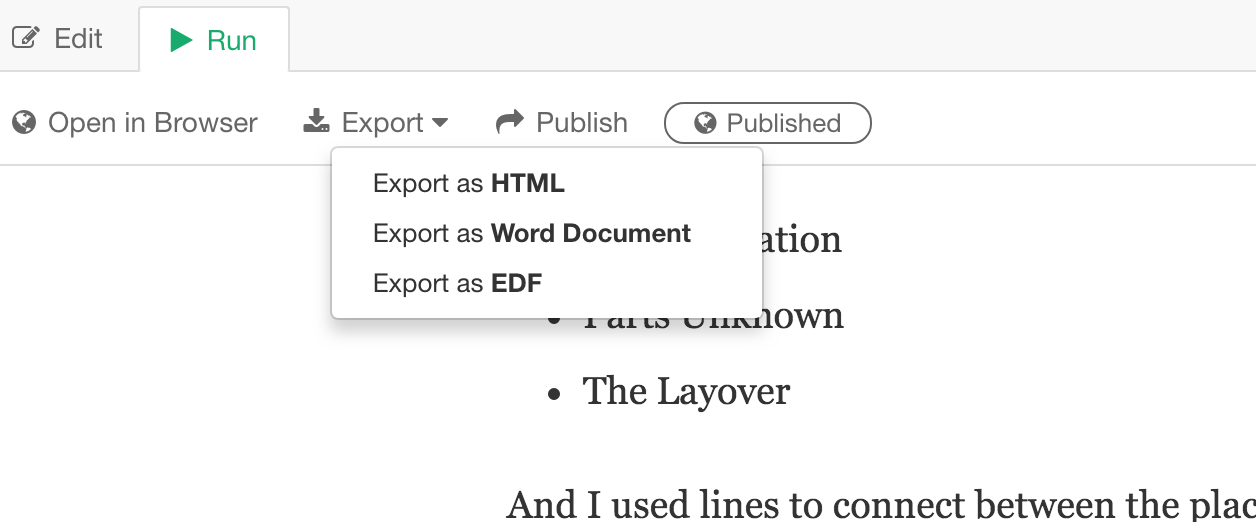
8. Export Documents in HTML, Word, or EDF
You can save this note either as HTML or Word document so that you can send via emails or host at your web or document servers.
HTML Output
For HTML output, it will generate a single HTML file that has everything that is needed for the note. You can also choose either you want to include PNG images for the charts or not. The HTML file will generate the charts with JavaScript, which means the charts will be interactive and support some actions like zoom in/out. But sometimes you might want to send the HTML file attached to emails or host the file at document servers where Java Script is not supported. This is when you want to include PNG for the HTML output so that it will show the images instead of the interactive JavaScript ones.
Word Output
You can select ‘Export as Word Document’ to generate the report in Word (docx) format.
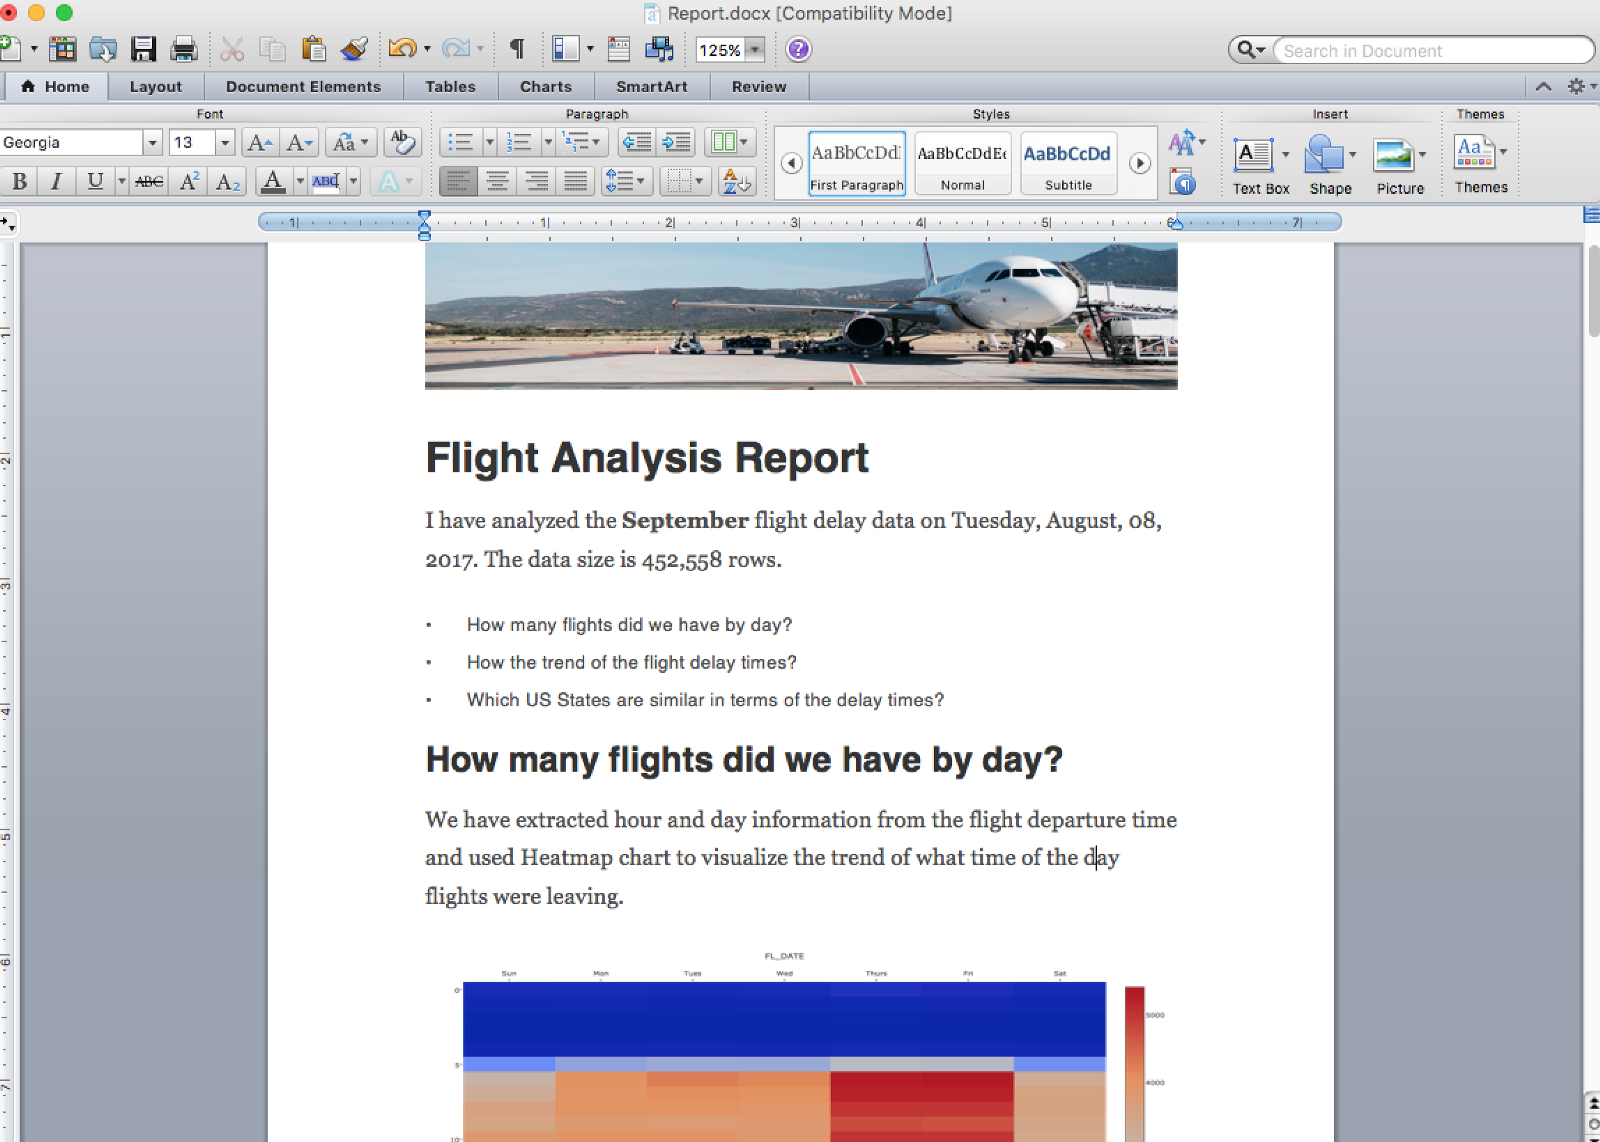
All the charts are generated as images in the document.
EDF — Exploratory Data Format
Do you want to share your Note in a reproducible way?
Use EDF, which stands for Exploratory Data Format and contains everything you need to reproduce the Note such as the underlying data, data wrangling steps, charts, etc.
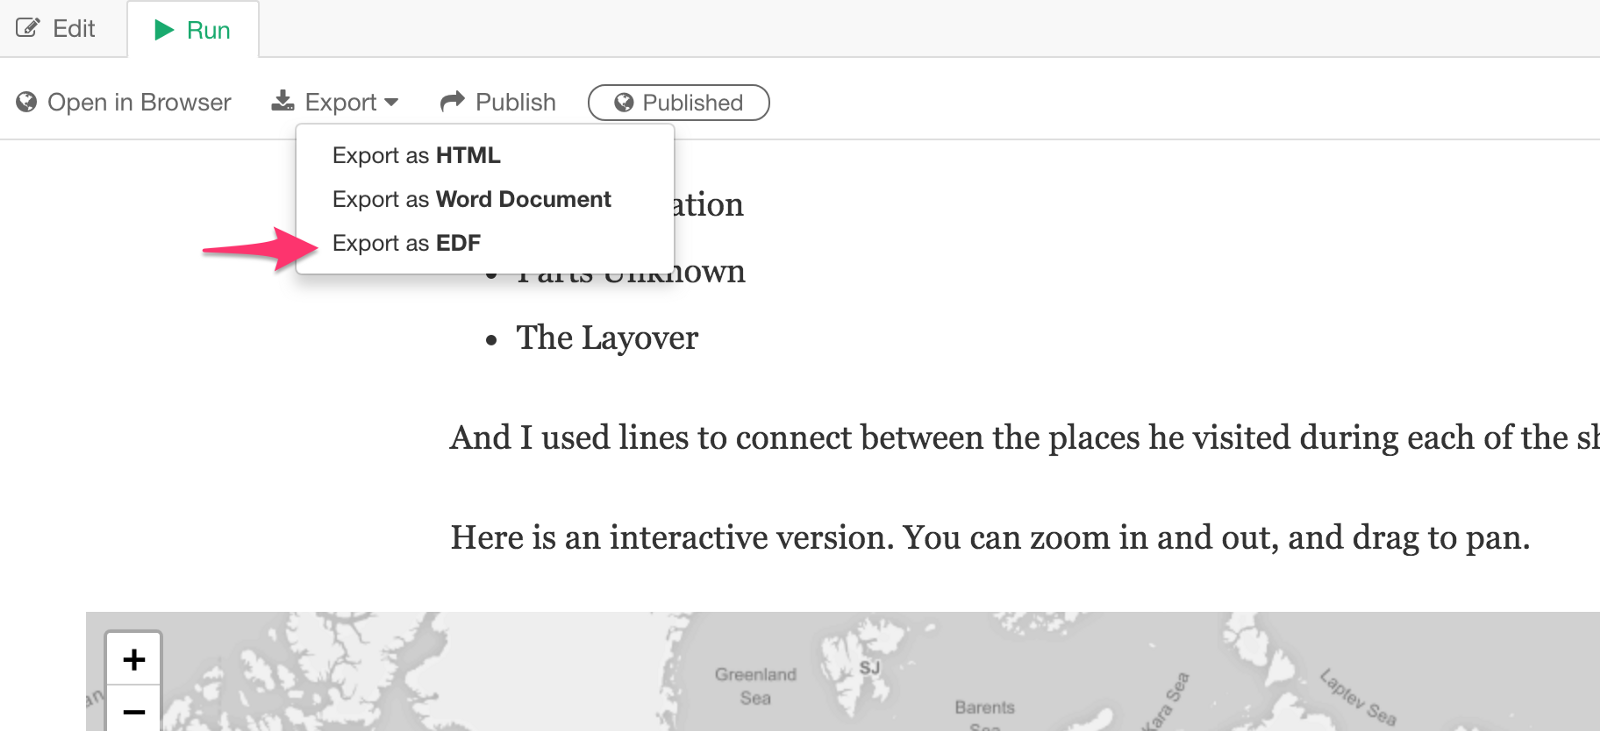
Once you export your Note as EDF, then you can give it to other people with Exploratory or you can import it into different projects or Exploratory at different machines.
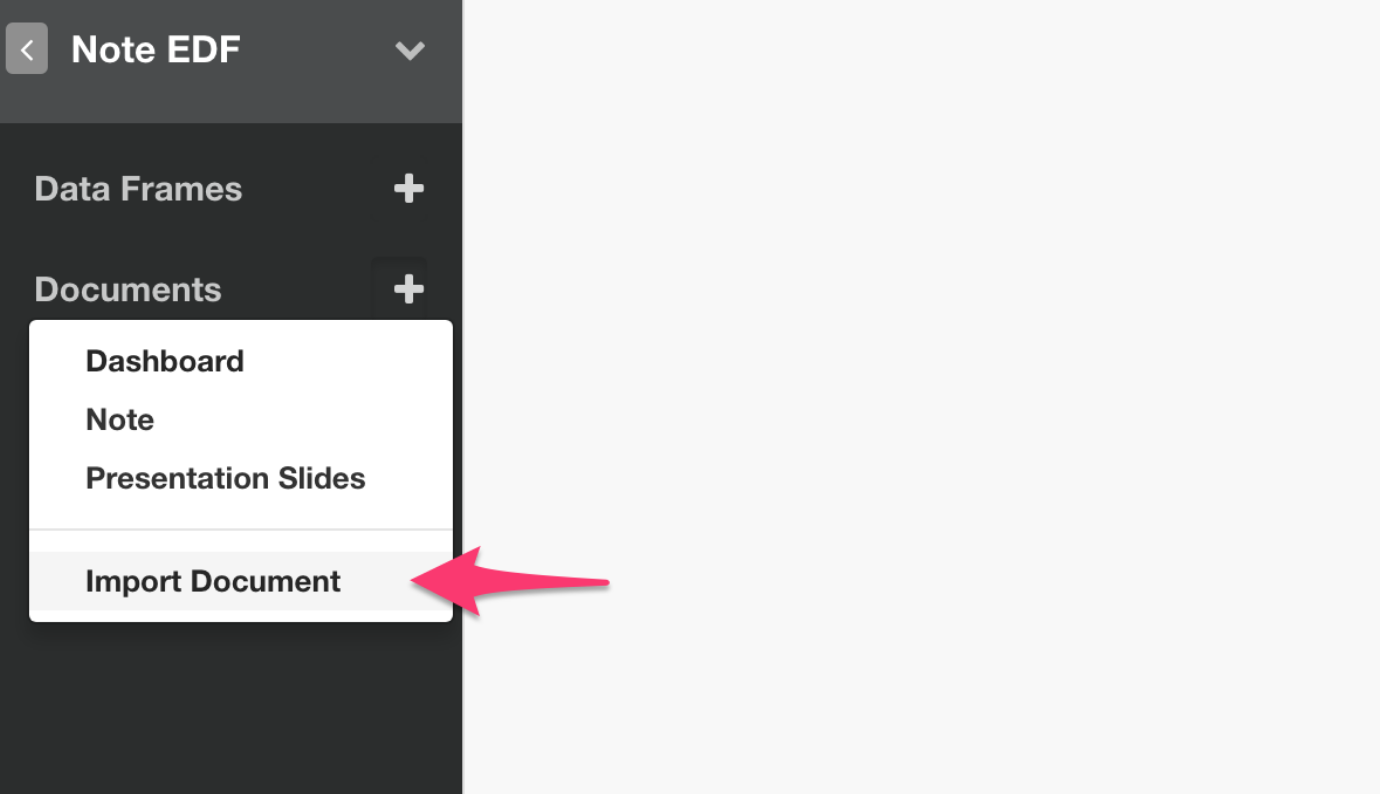
In a different project, you can select ‘Import Document’ under Documents to import the exported EDF.
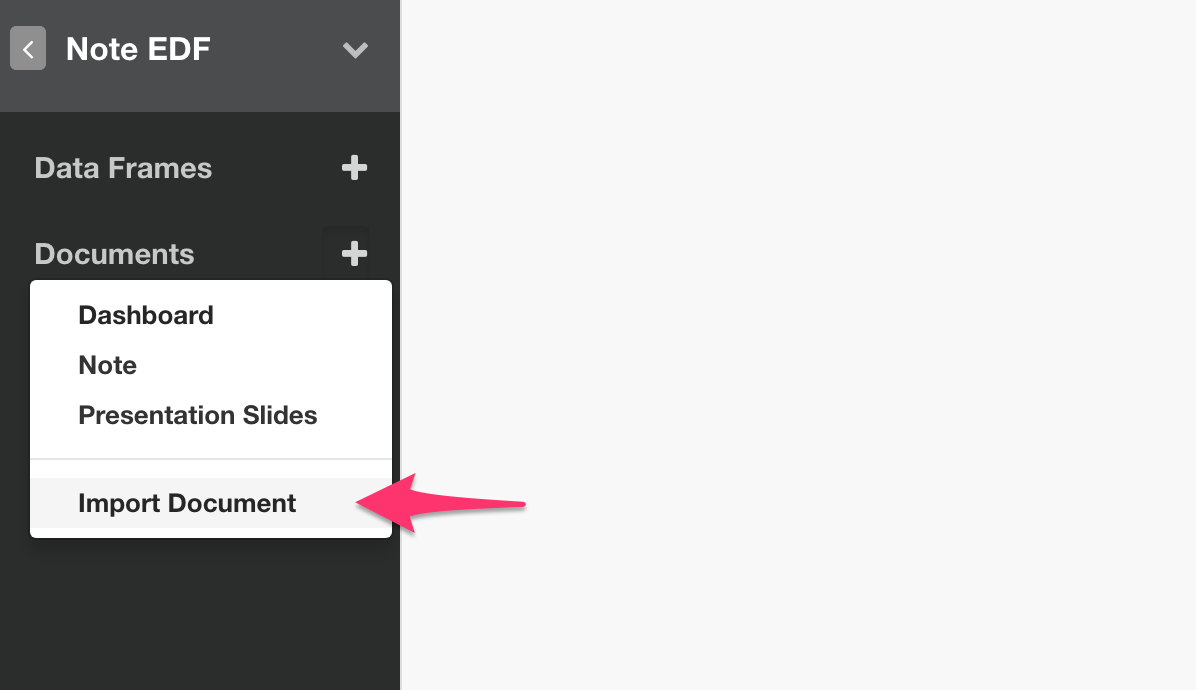
Note that you don’t want to import this as EDF data that can be found from Data Frames menu. Make sure you select ‘Import Documents’ from Documents menu.
Once it is imported, you will see not only the Note itself, but also all the data frames that were associated with the Note.
This will allow the Note to be fully reproducible including the data wrangling steps.
Imagine if you shared your Note as EDF with others on your team. They can see how you prepare the data for your Note. That’s the power of Reproducibility!
9. Publish and Share Notes
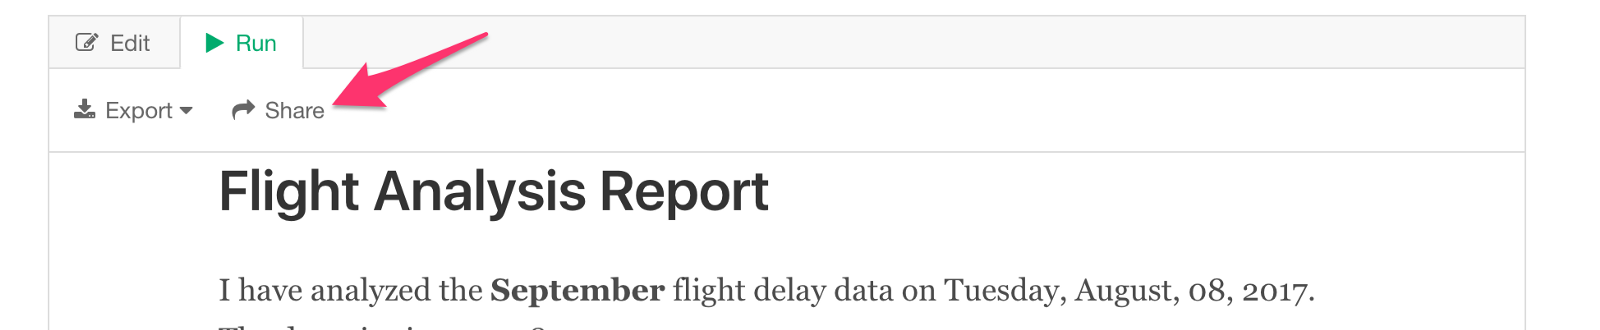
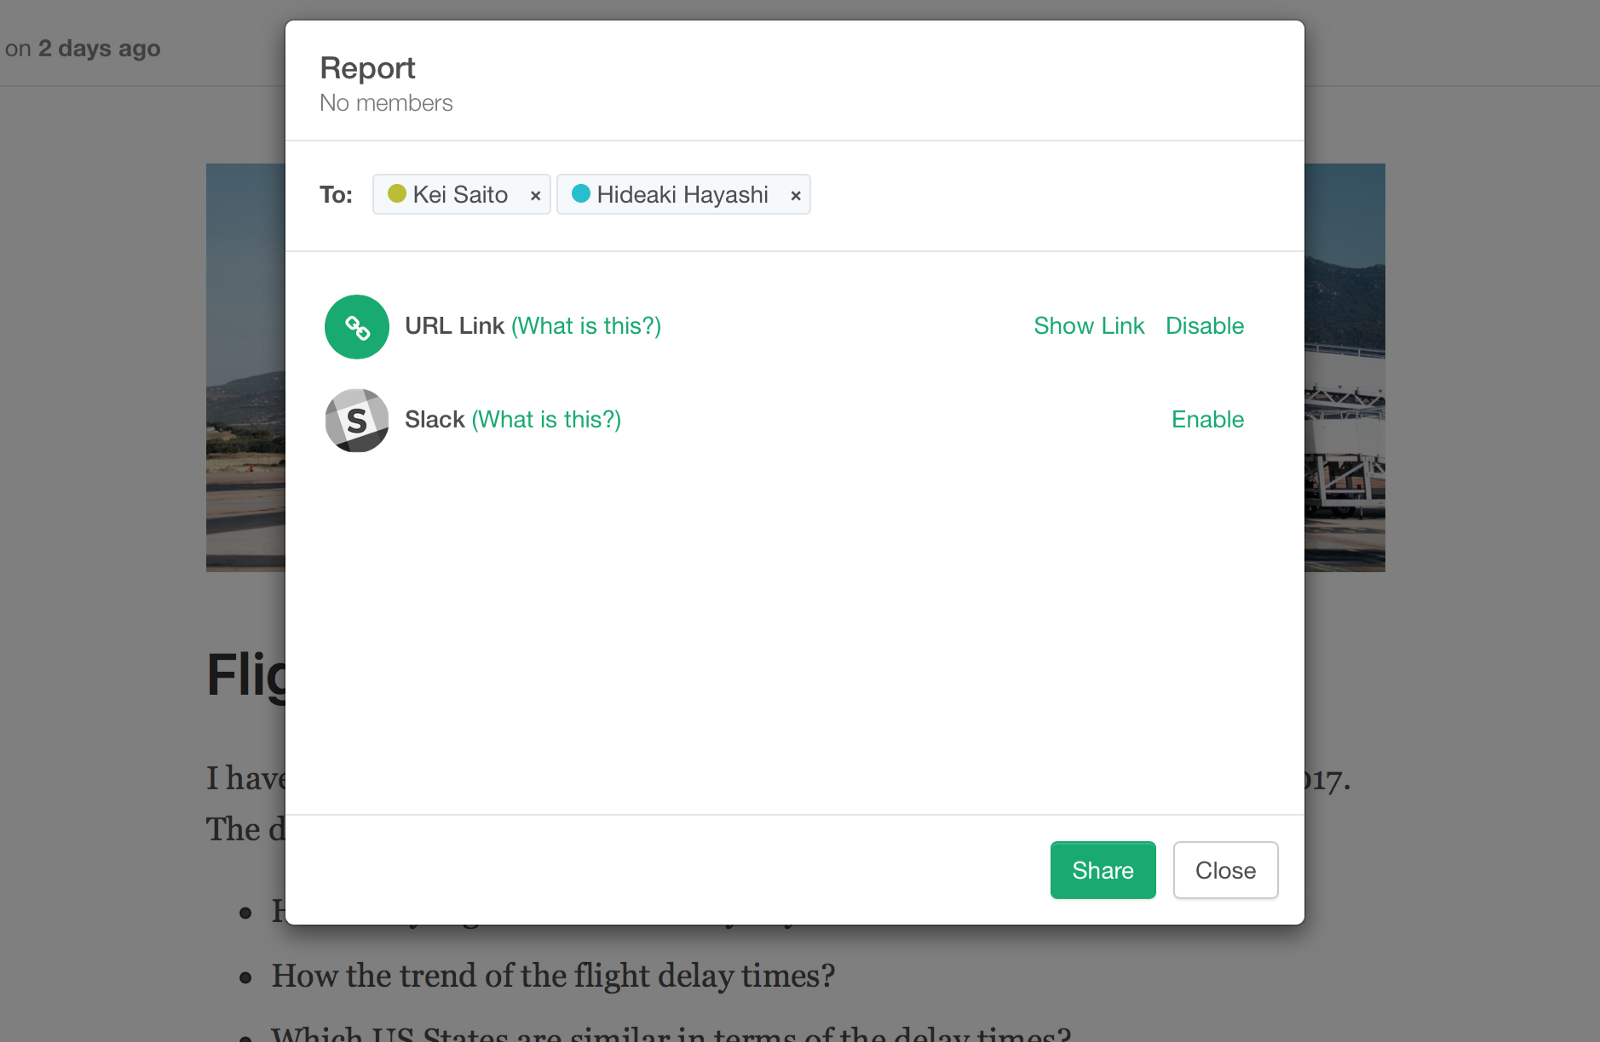
You can also easily share your Note with others by publishing them to Exploratory’s cloud server (exploratory.io). You can simply click on the Share button to publish.
You can share it either publicly or privately.
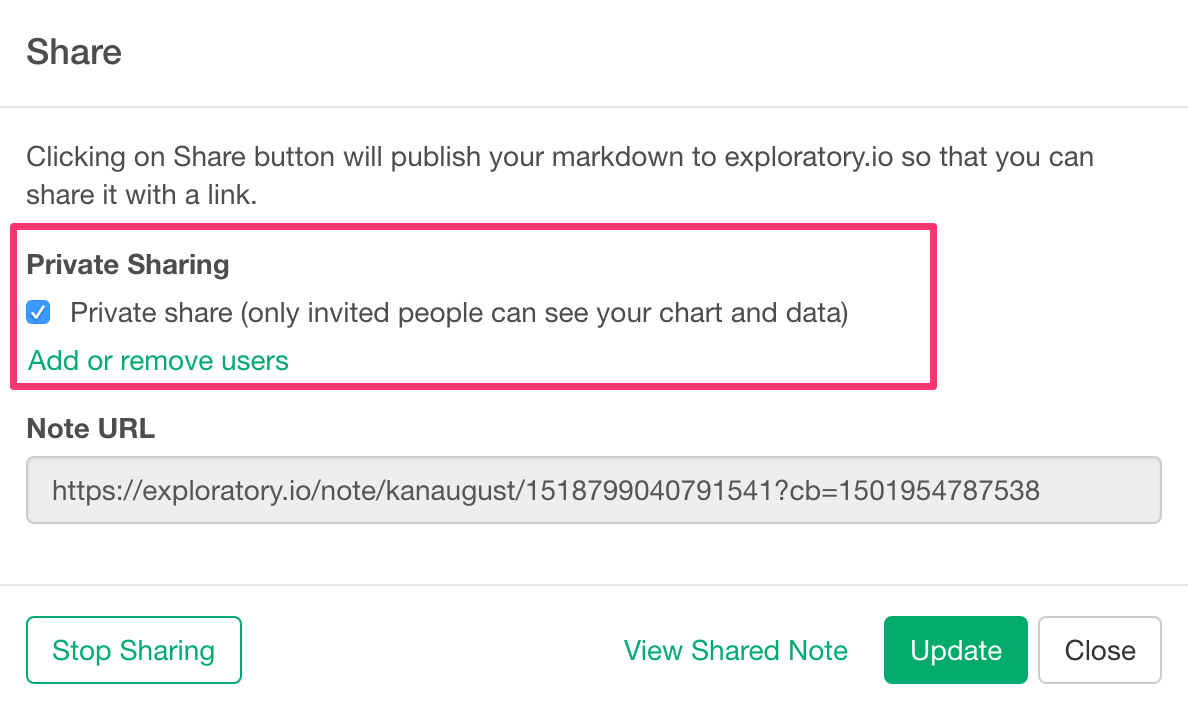
When you share privately, you can set who can access the notes by entering their email addresses or generate a unique URL for each note.
Share EDF
Do you want to share your Note in a reproducible way?
Use EDF, which stands for Exploratory Data Format and contains everything you need to reproduce the Note such as the underlying data, data wrangling steps, charts, etc.
By checking ‘EDF’ download option, it will package the Note and all the associated data frames, which are needed to produce the charts in the Note, together.
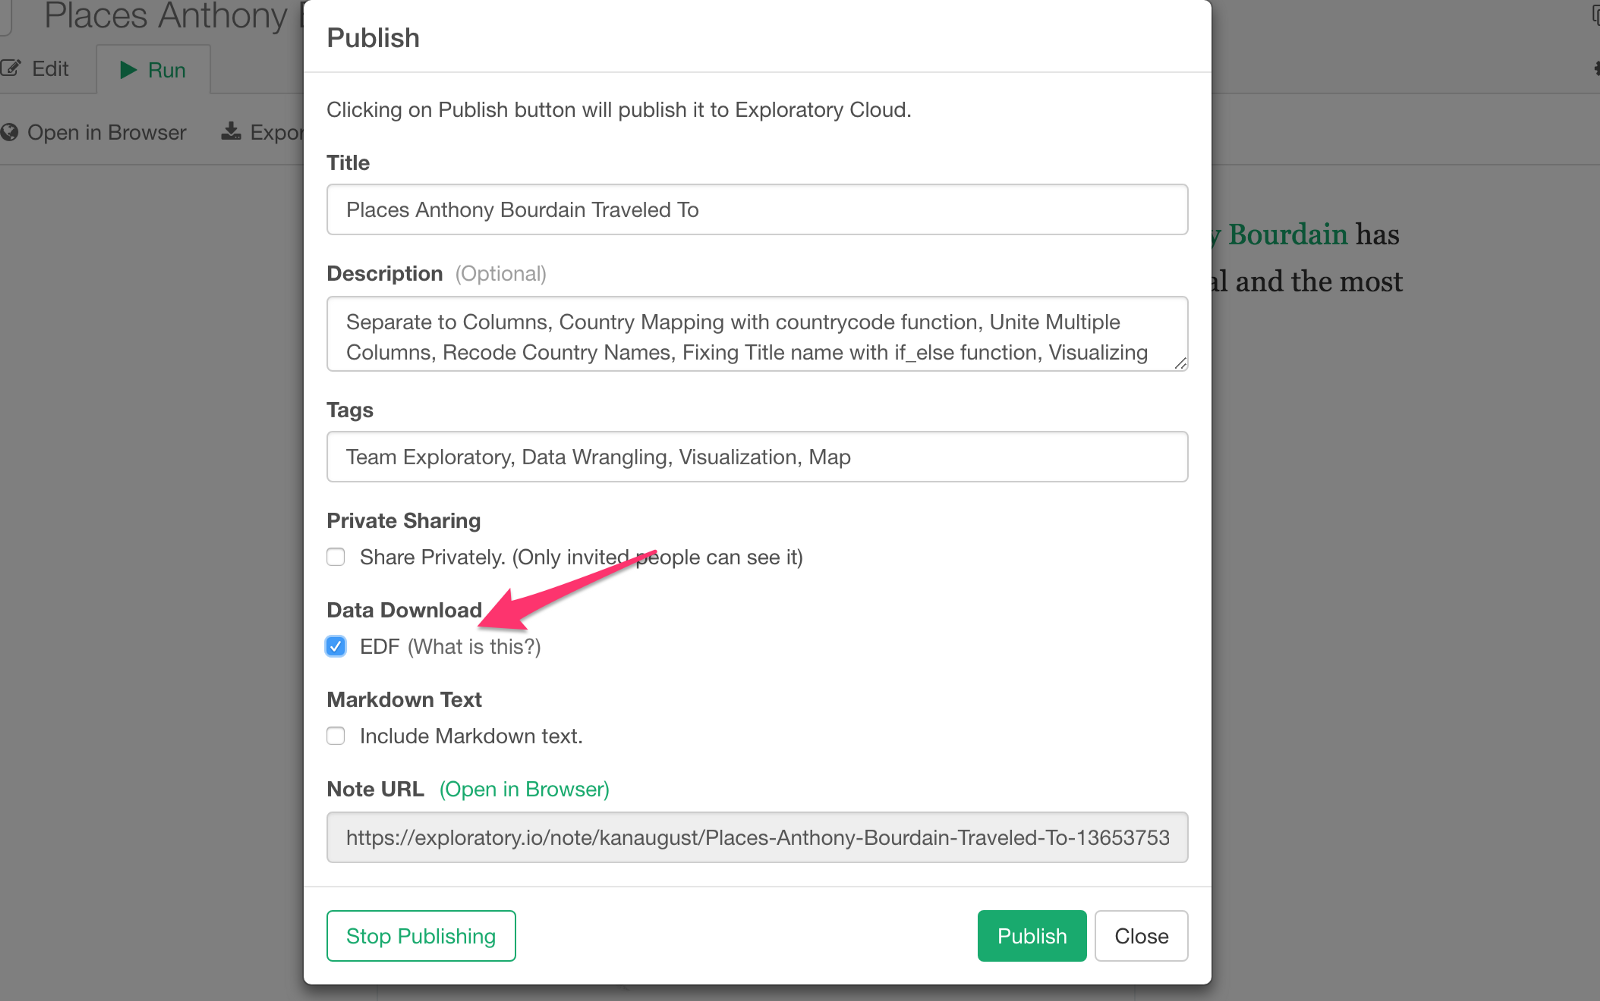
Then, the person who is shared can click on Download button and download the EDF.
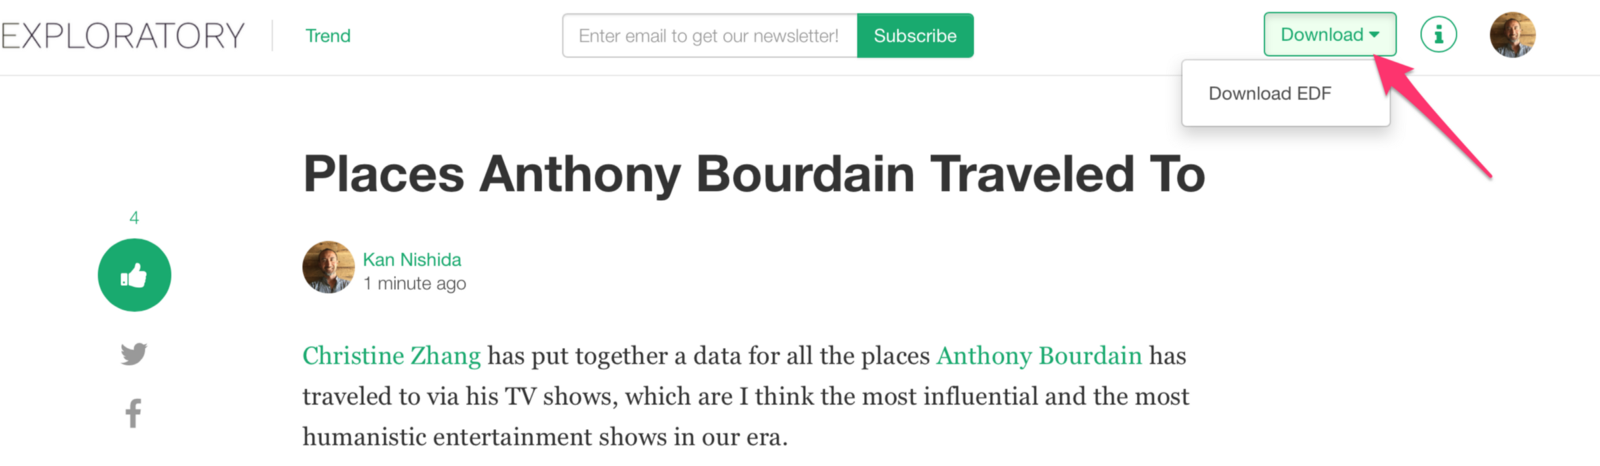
Then she can import into her Exploratory Desktop to reproduce the Note!
10. Restore Old Versions
What? Have you just accidentally lost your Note content?
Somehow, there was a bug in Exploratory that wiped your content? (sorry if that happens to you, please contact as quickly!)
Even if you didn’t lose your content sometimes you might want to restore the old versions of your Note.
You can open History dialog to do just that!
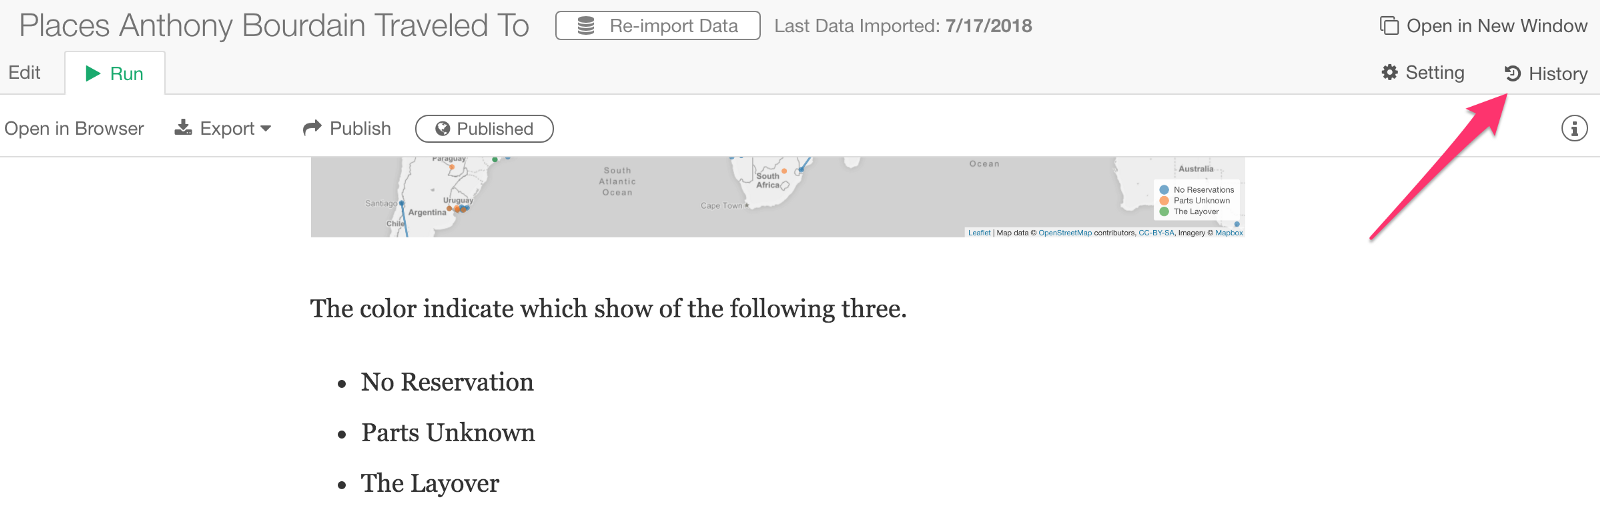
In the History dialog, select the version you want to restore and click ‘Restore This State’ button.
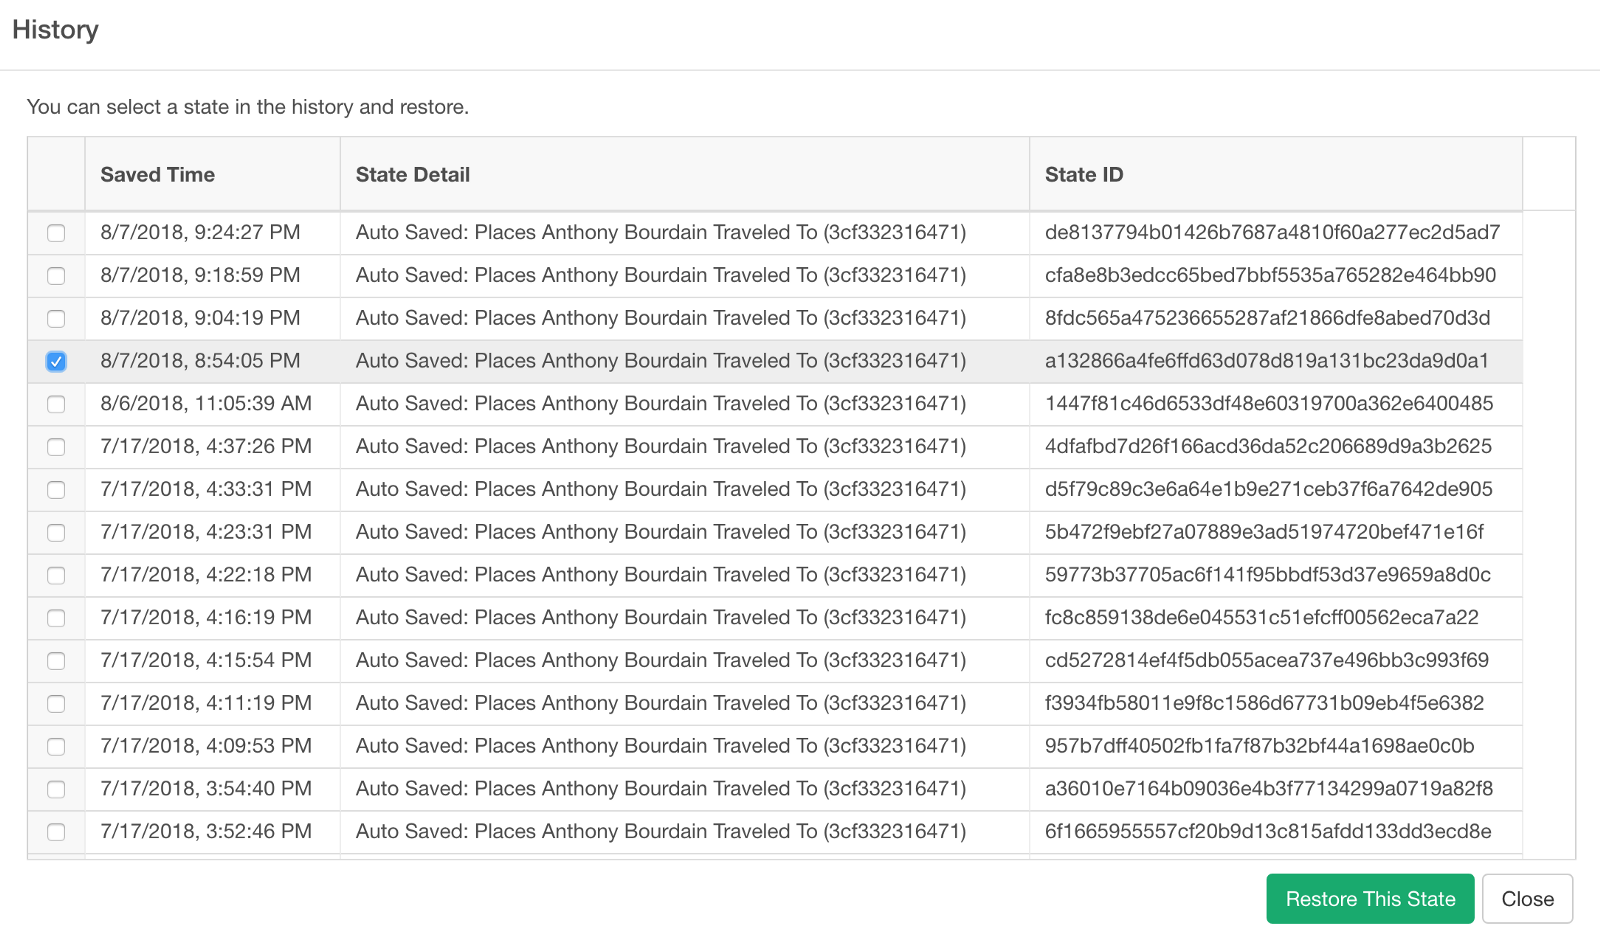
This will bring the Note back to the version.
If you want to go back to the version before restoring, then you can simply open this History dialog and select the previous version.
Communicating your insights to other folks on your team is a key success factor of any data analysis projects. With Note, not only you can produce production level quality reports easily, but also you can take advantage of many of R packages to make your story even more powerful and more effective.