An Introduction to Parameter in Exploratory
You can use Parameter to make your data wrangling pipeline dynamic or more interactive.
For example, you might want to make your SQL queries dynamic (Parameterized Queries), your filter step dynamic, and Dashboard to be more interactive so that the users of the Dashboard can change the data based on their interests.
You will learn how the Parameter works and how you can use it in Exploratory in this note.
Getting Started with Parameter
Let’s take a look at how Parameter works quickly. I’ll demonstrate on the following points.
- Create a Parameter
- Use it inside Filter step
- Change the Parameter values to update the result at Data Frame level.
- Change the Parameter values at Dashboard level.
Background
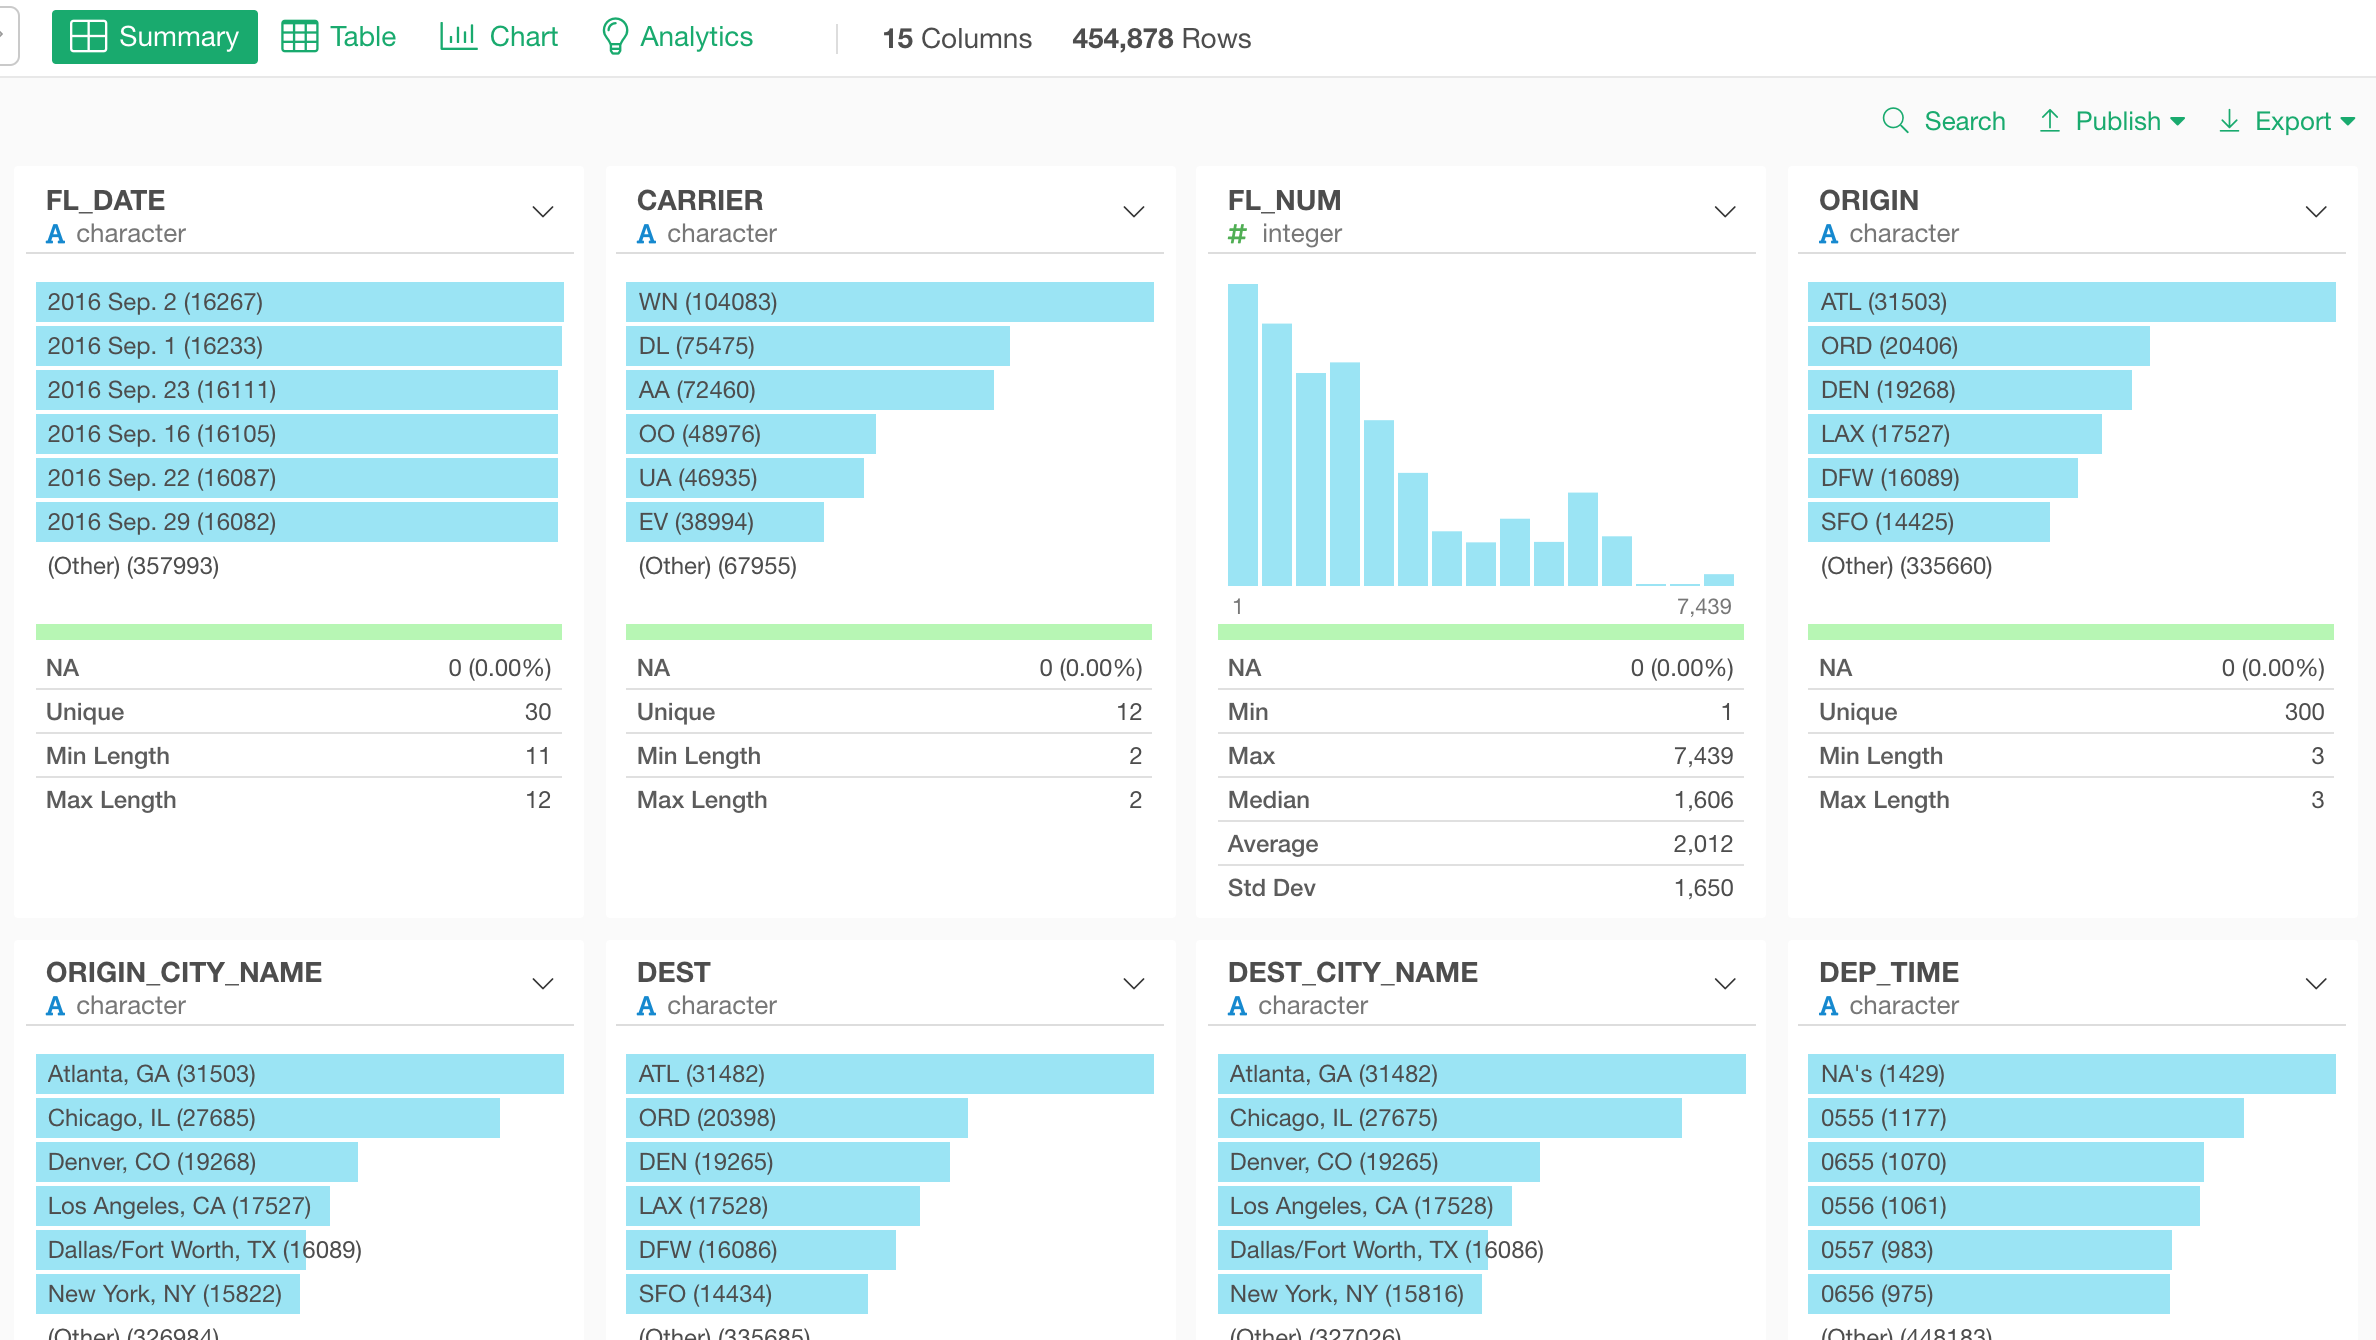
We have a flight delay data as our example data set. Each row represent a flight and includes information like, what is the carrier name, which airport it departed from and arrived at, what time it did, how long (minutes) it delayed at the departure or at the arrival, etc.
Create a Parameter
Now, let’s say we want to filter the data by the carrier code, and instead of making the filter static, we want to make it dynamic by using the parameter.
First, we can create a filter step.
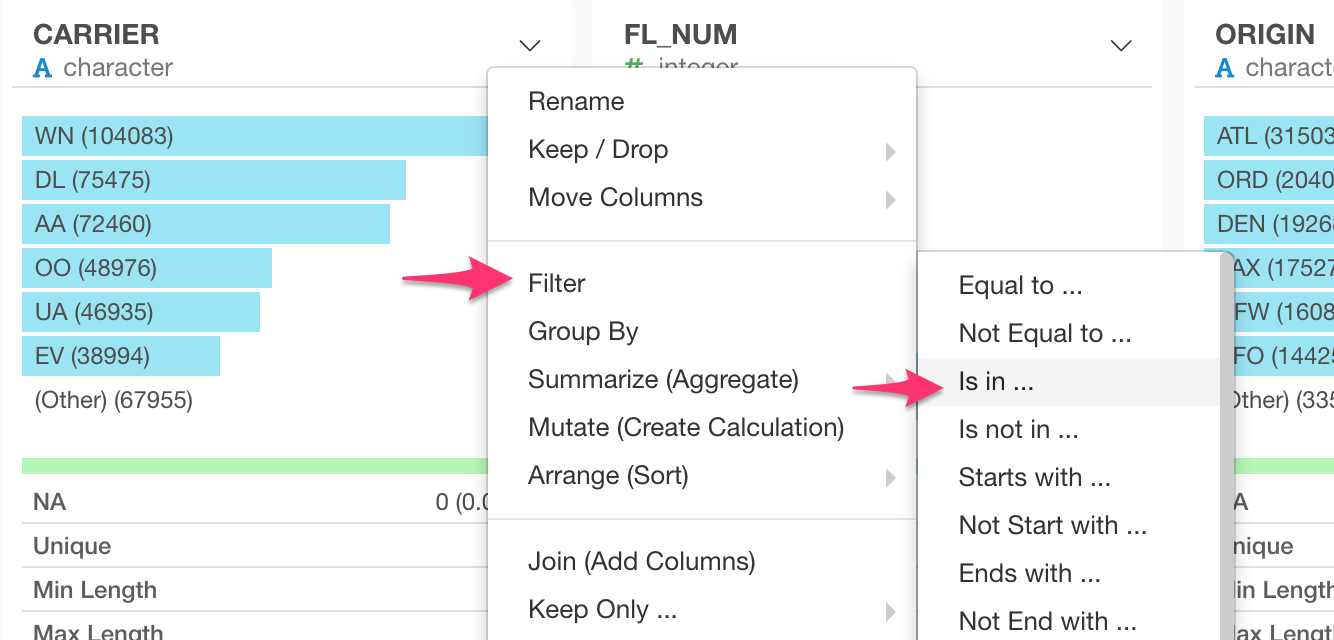
Since we want to select multiple carrier codes, we can select
Filter -> Is in
from the column header of ‘CARRIER’ column.
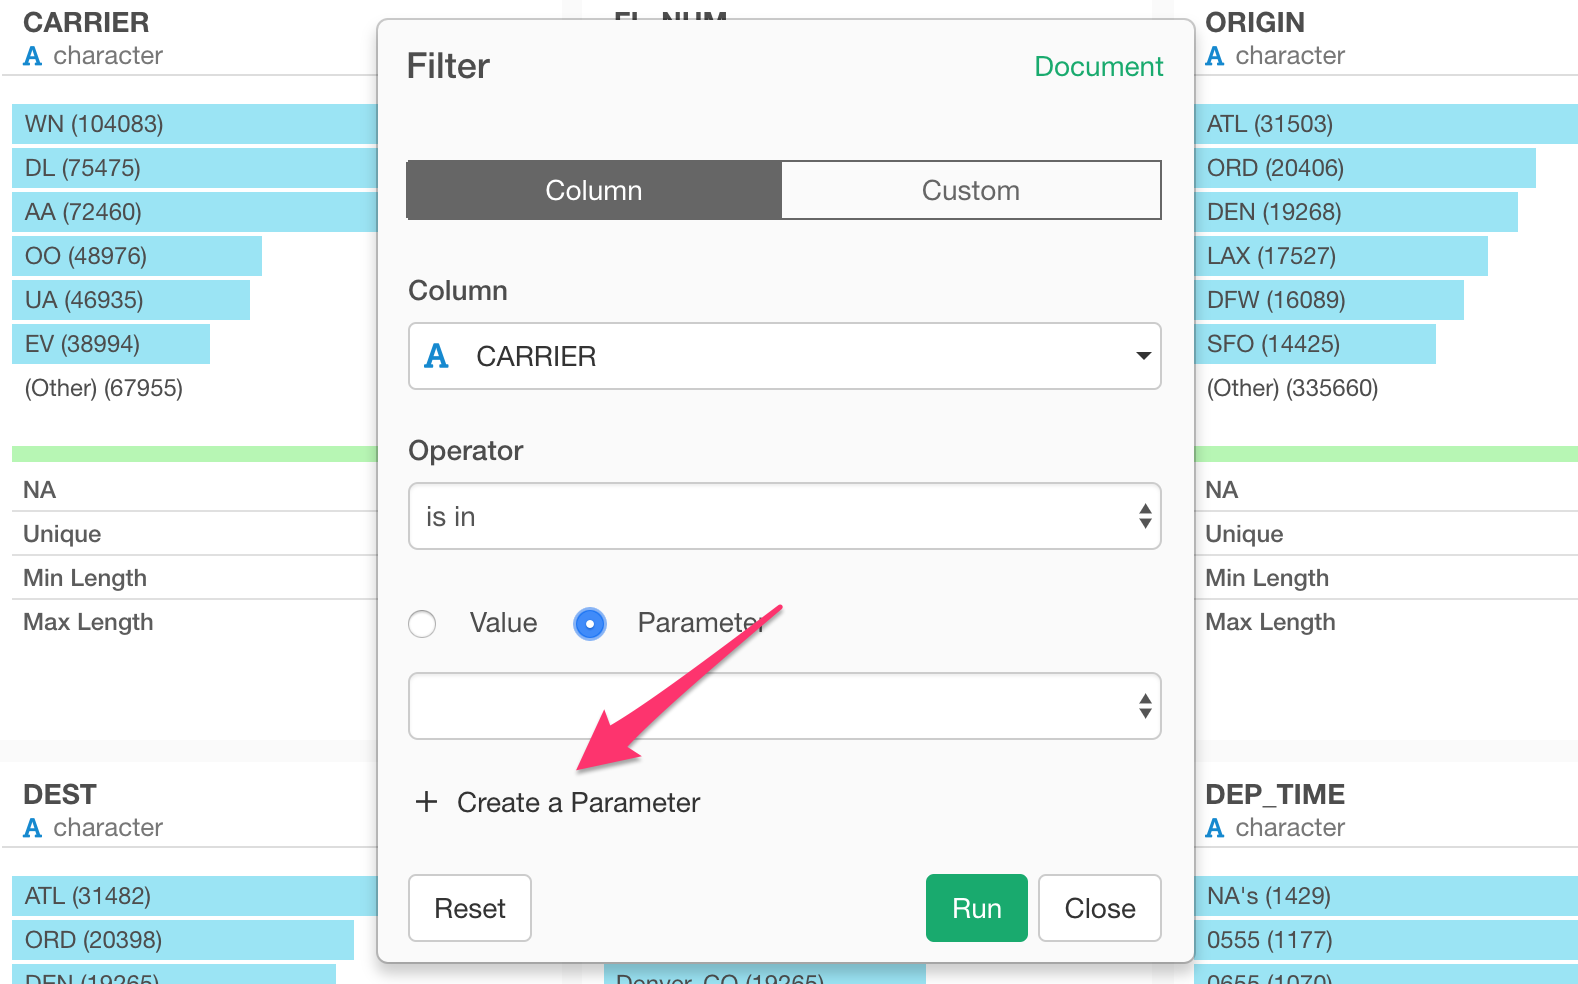
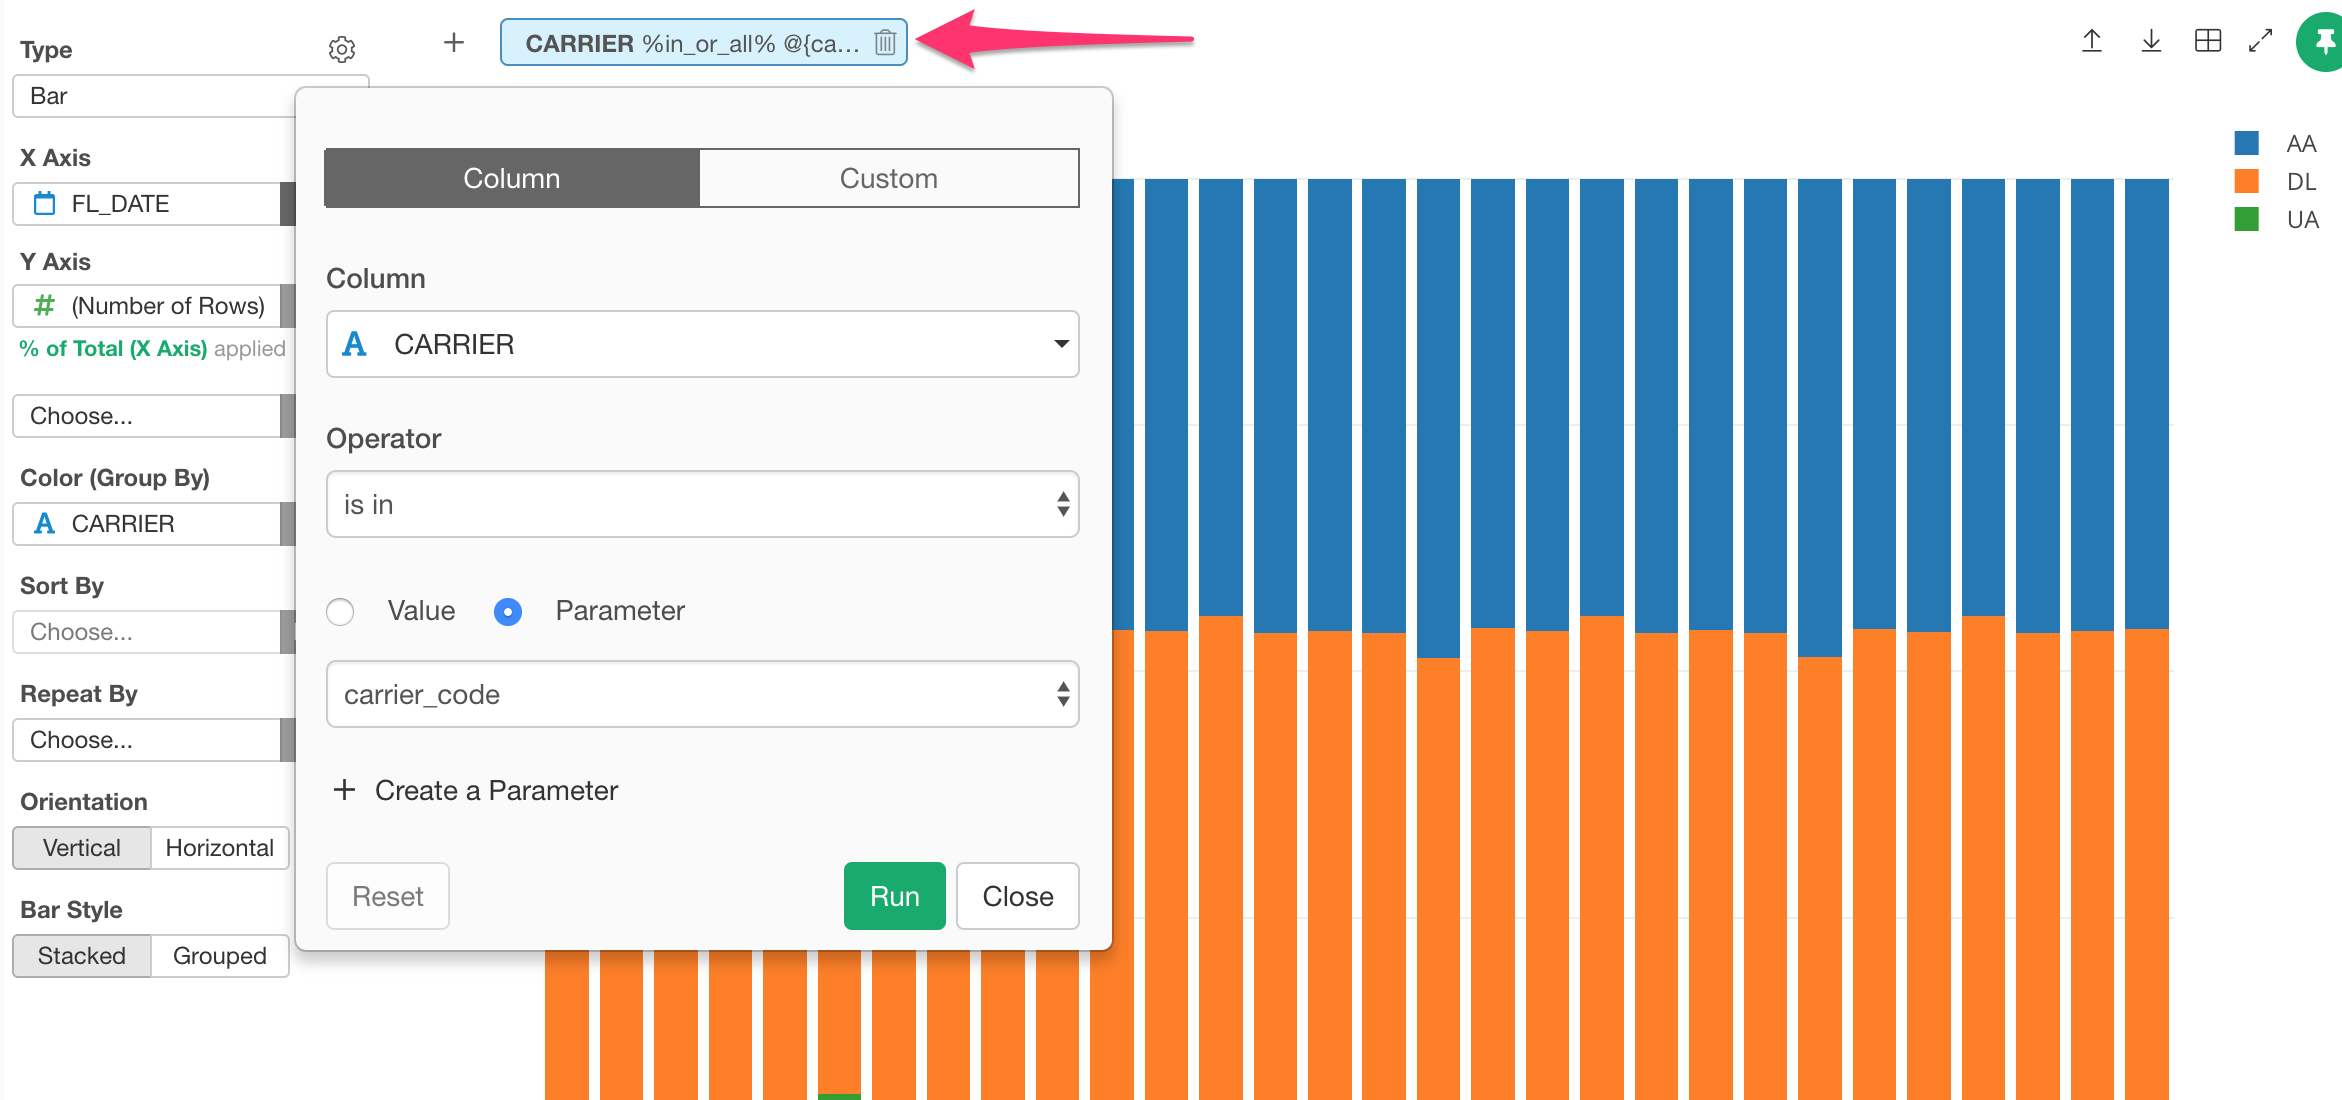
In the Filter dialog, click on Parameter checkbox.
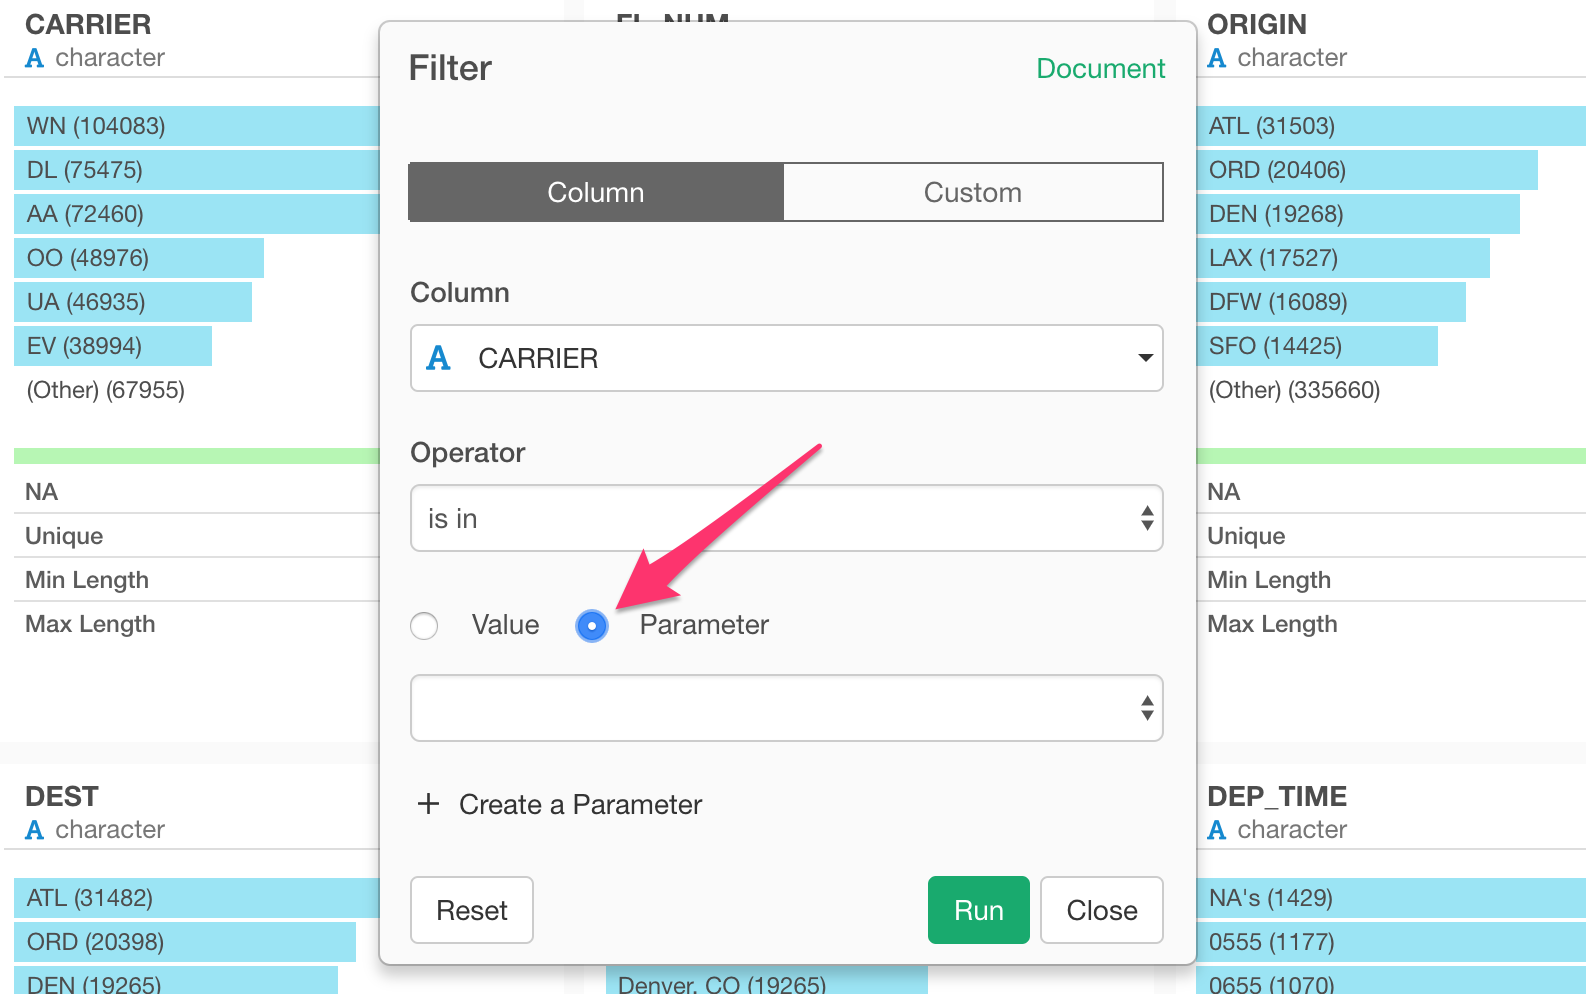
At this point we haven’t created a parameter yet, we can click ‘Create a Parameter’ menu.
We have an empty Parameter dialog.
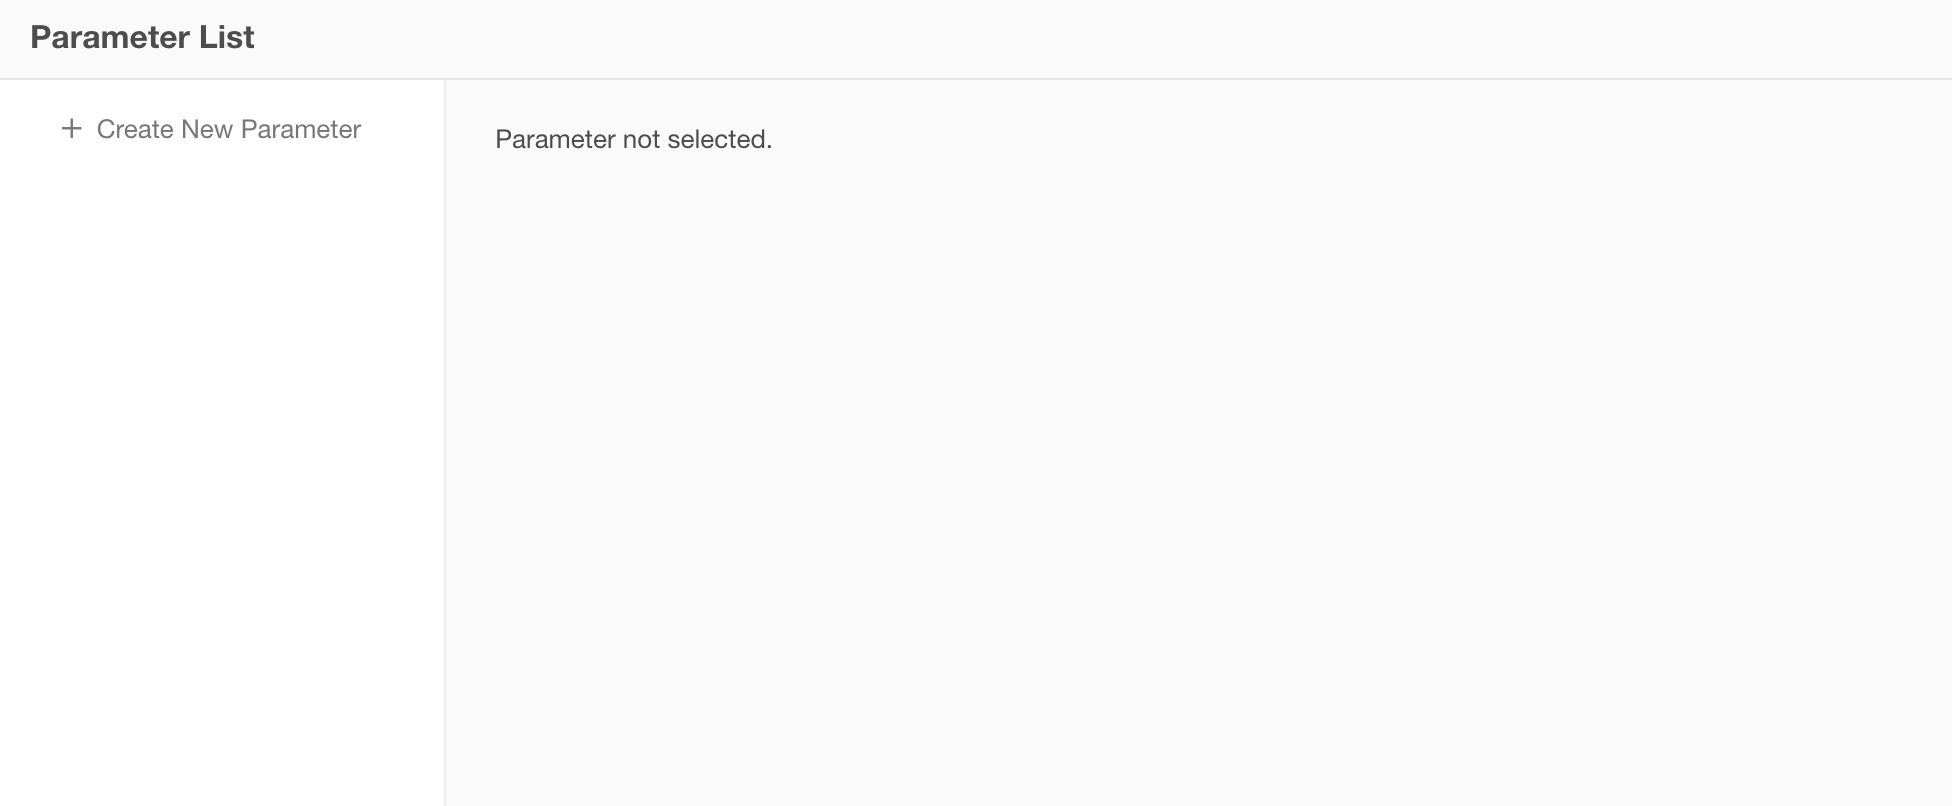
Click ‘Create a New Parameter’ button.
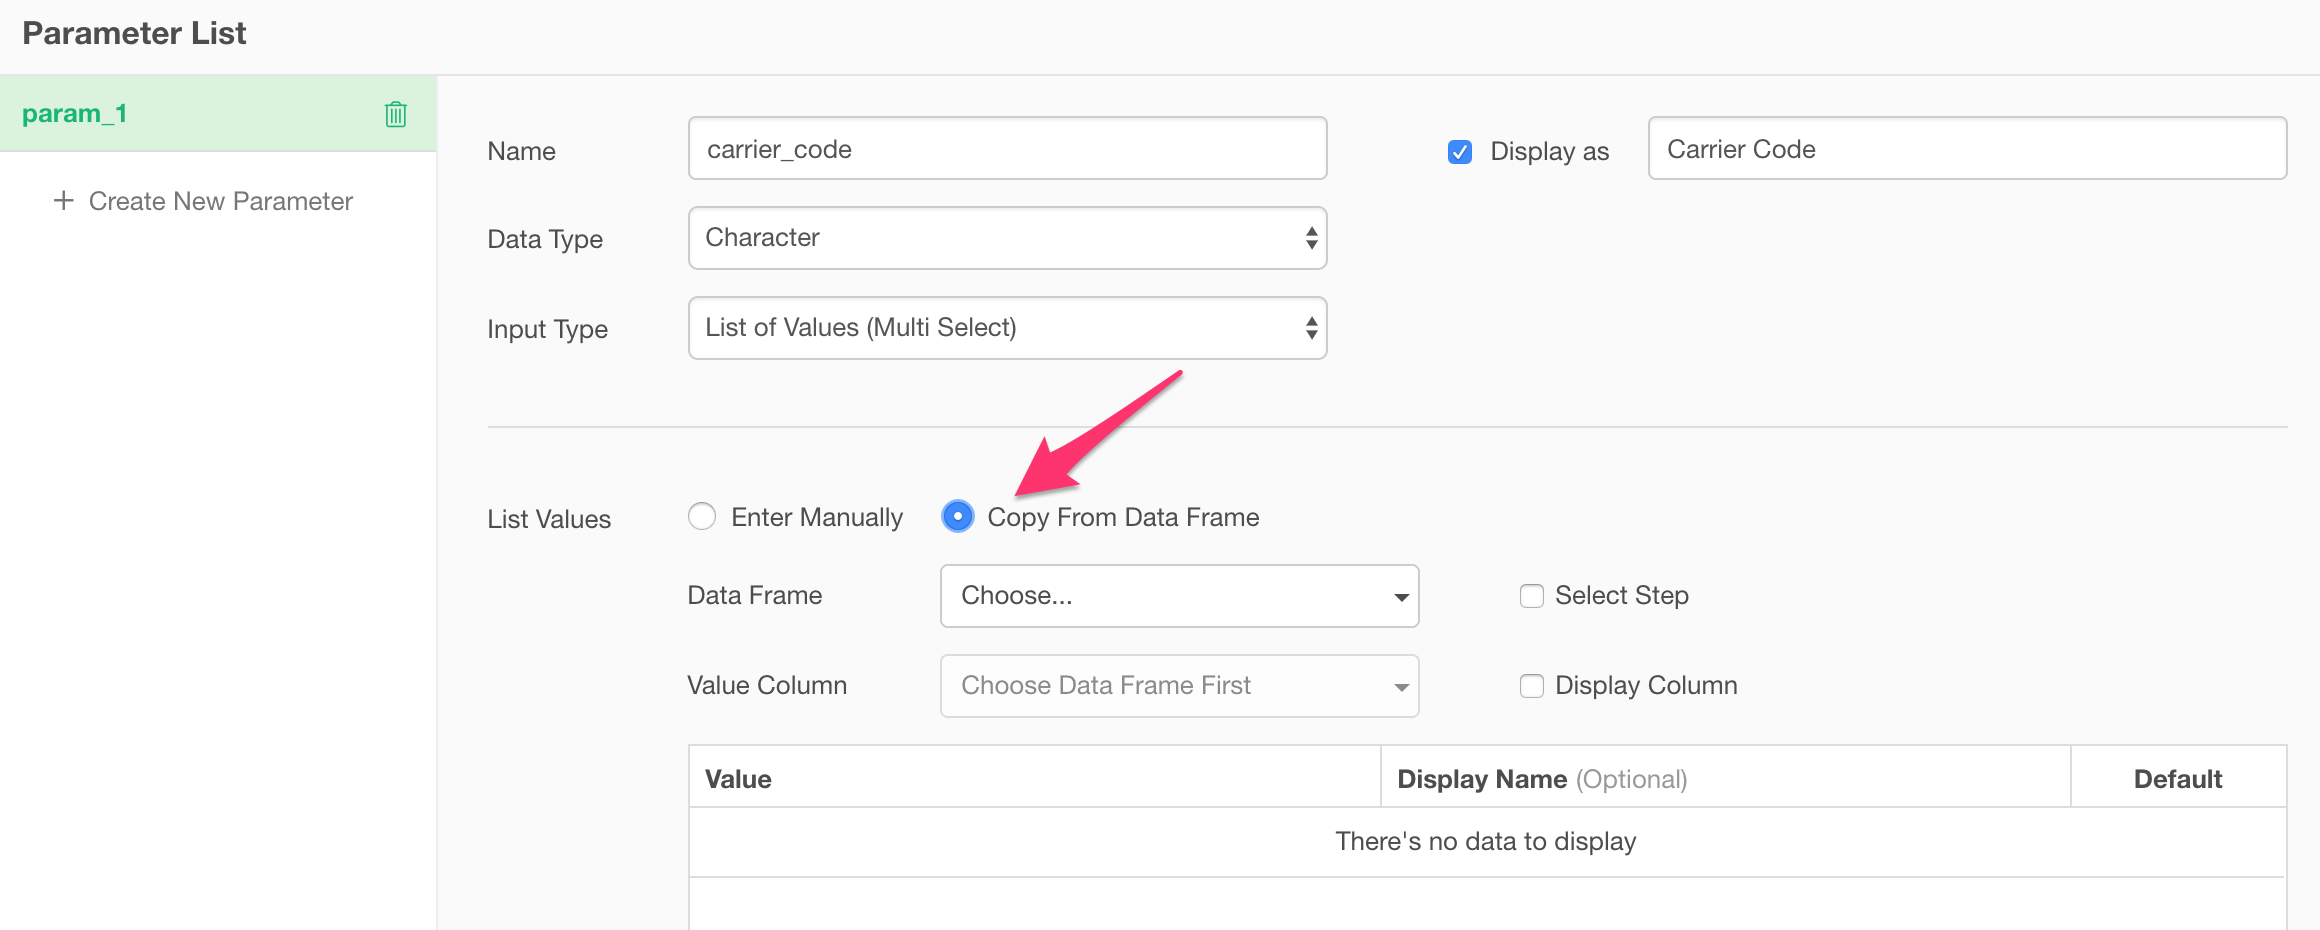
At the right-hand side pane, you can setup the parameter.
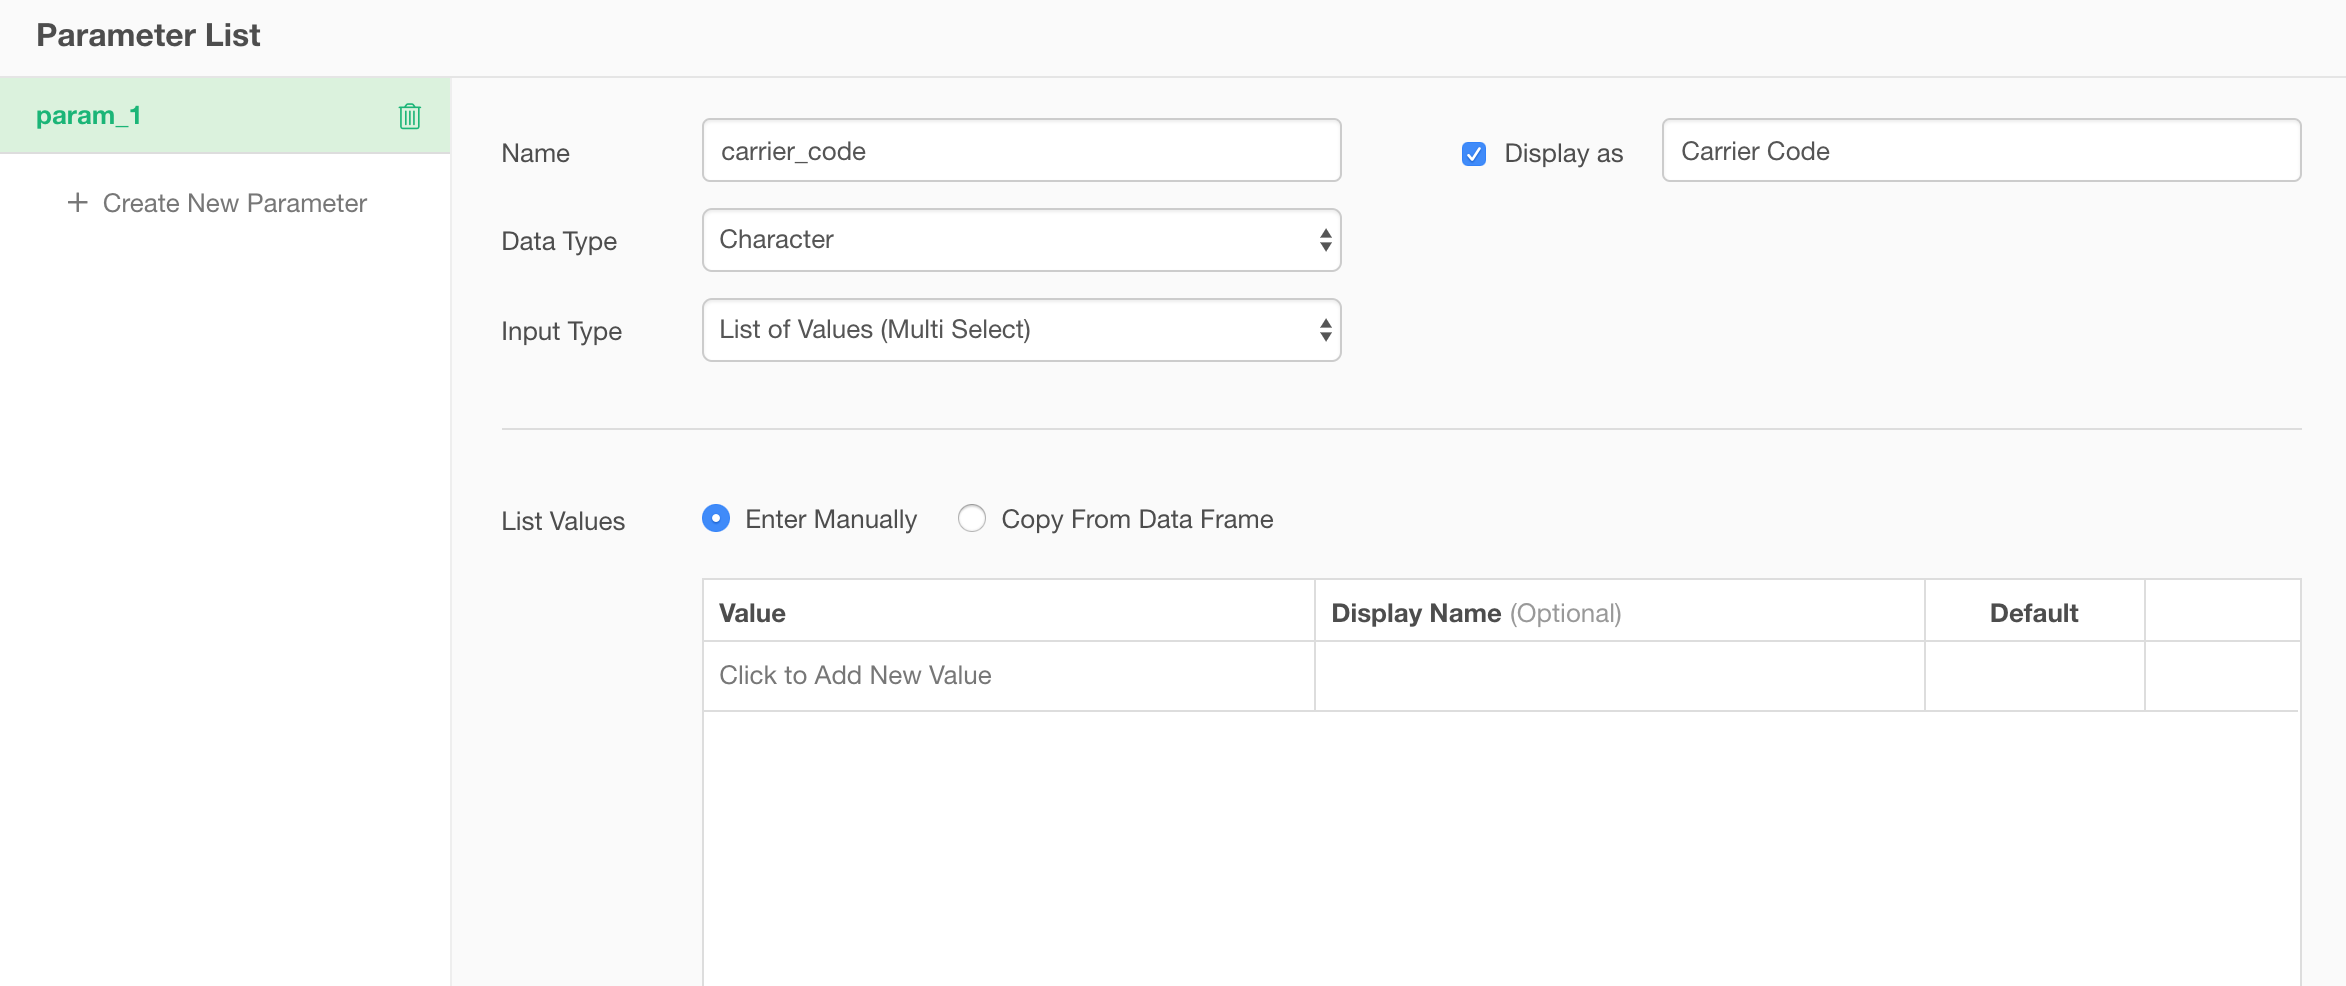
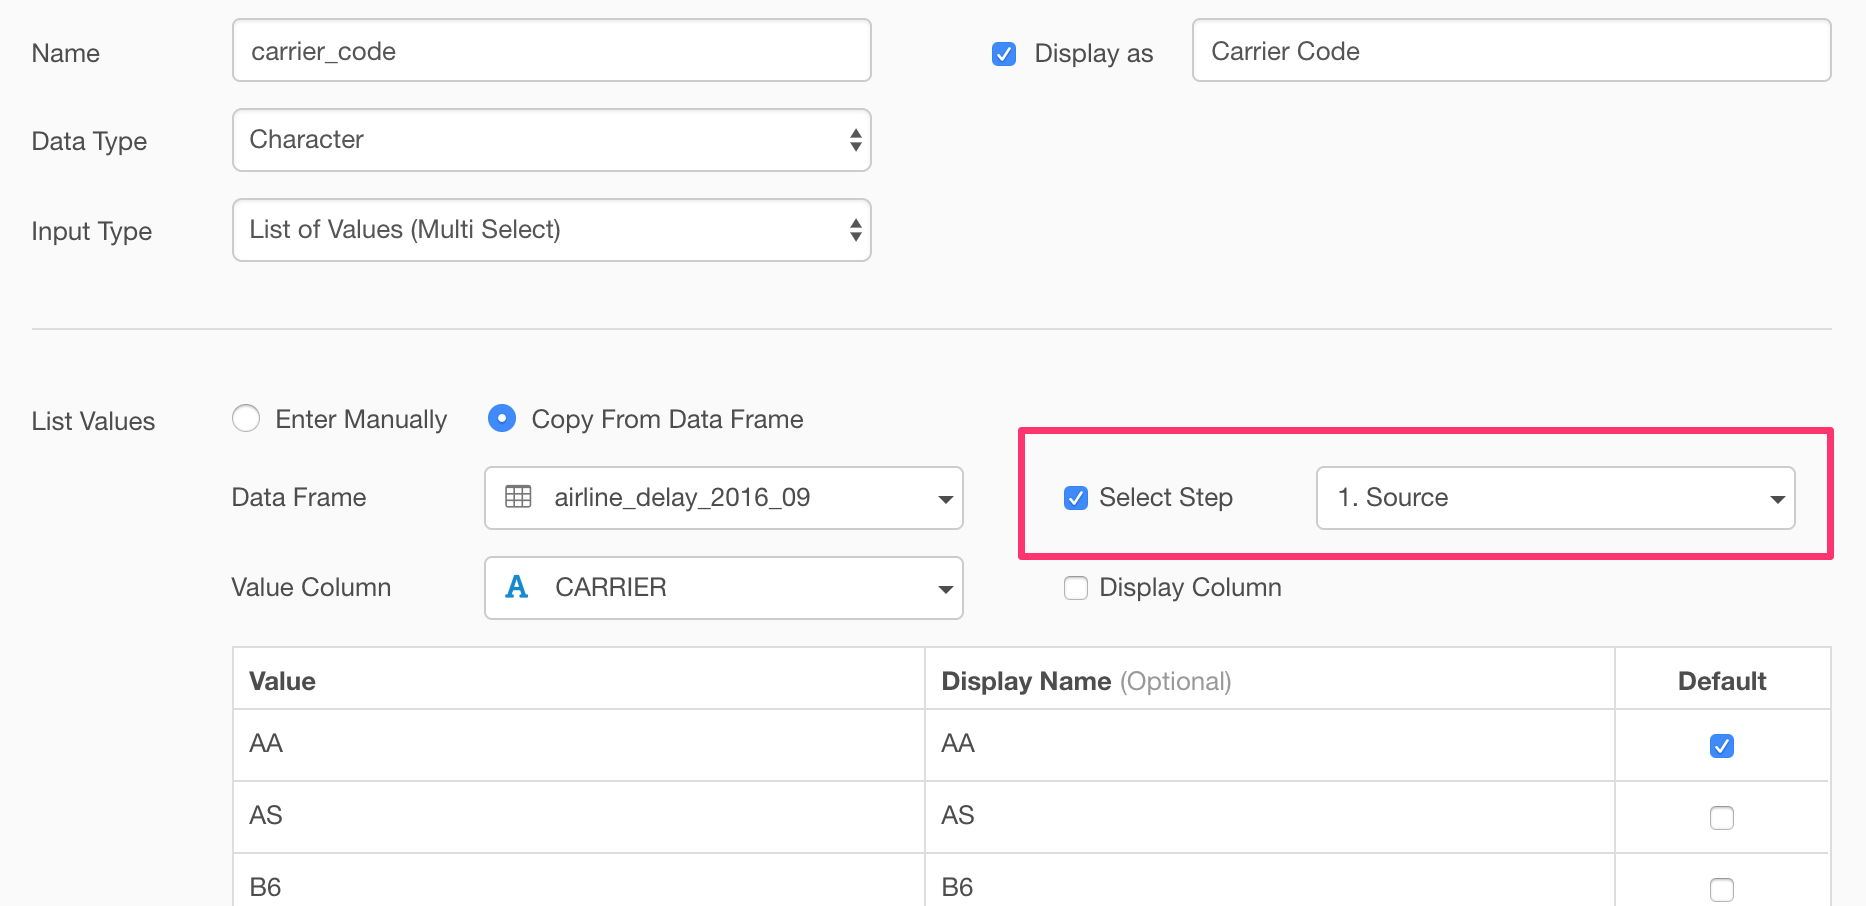
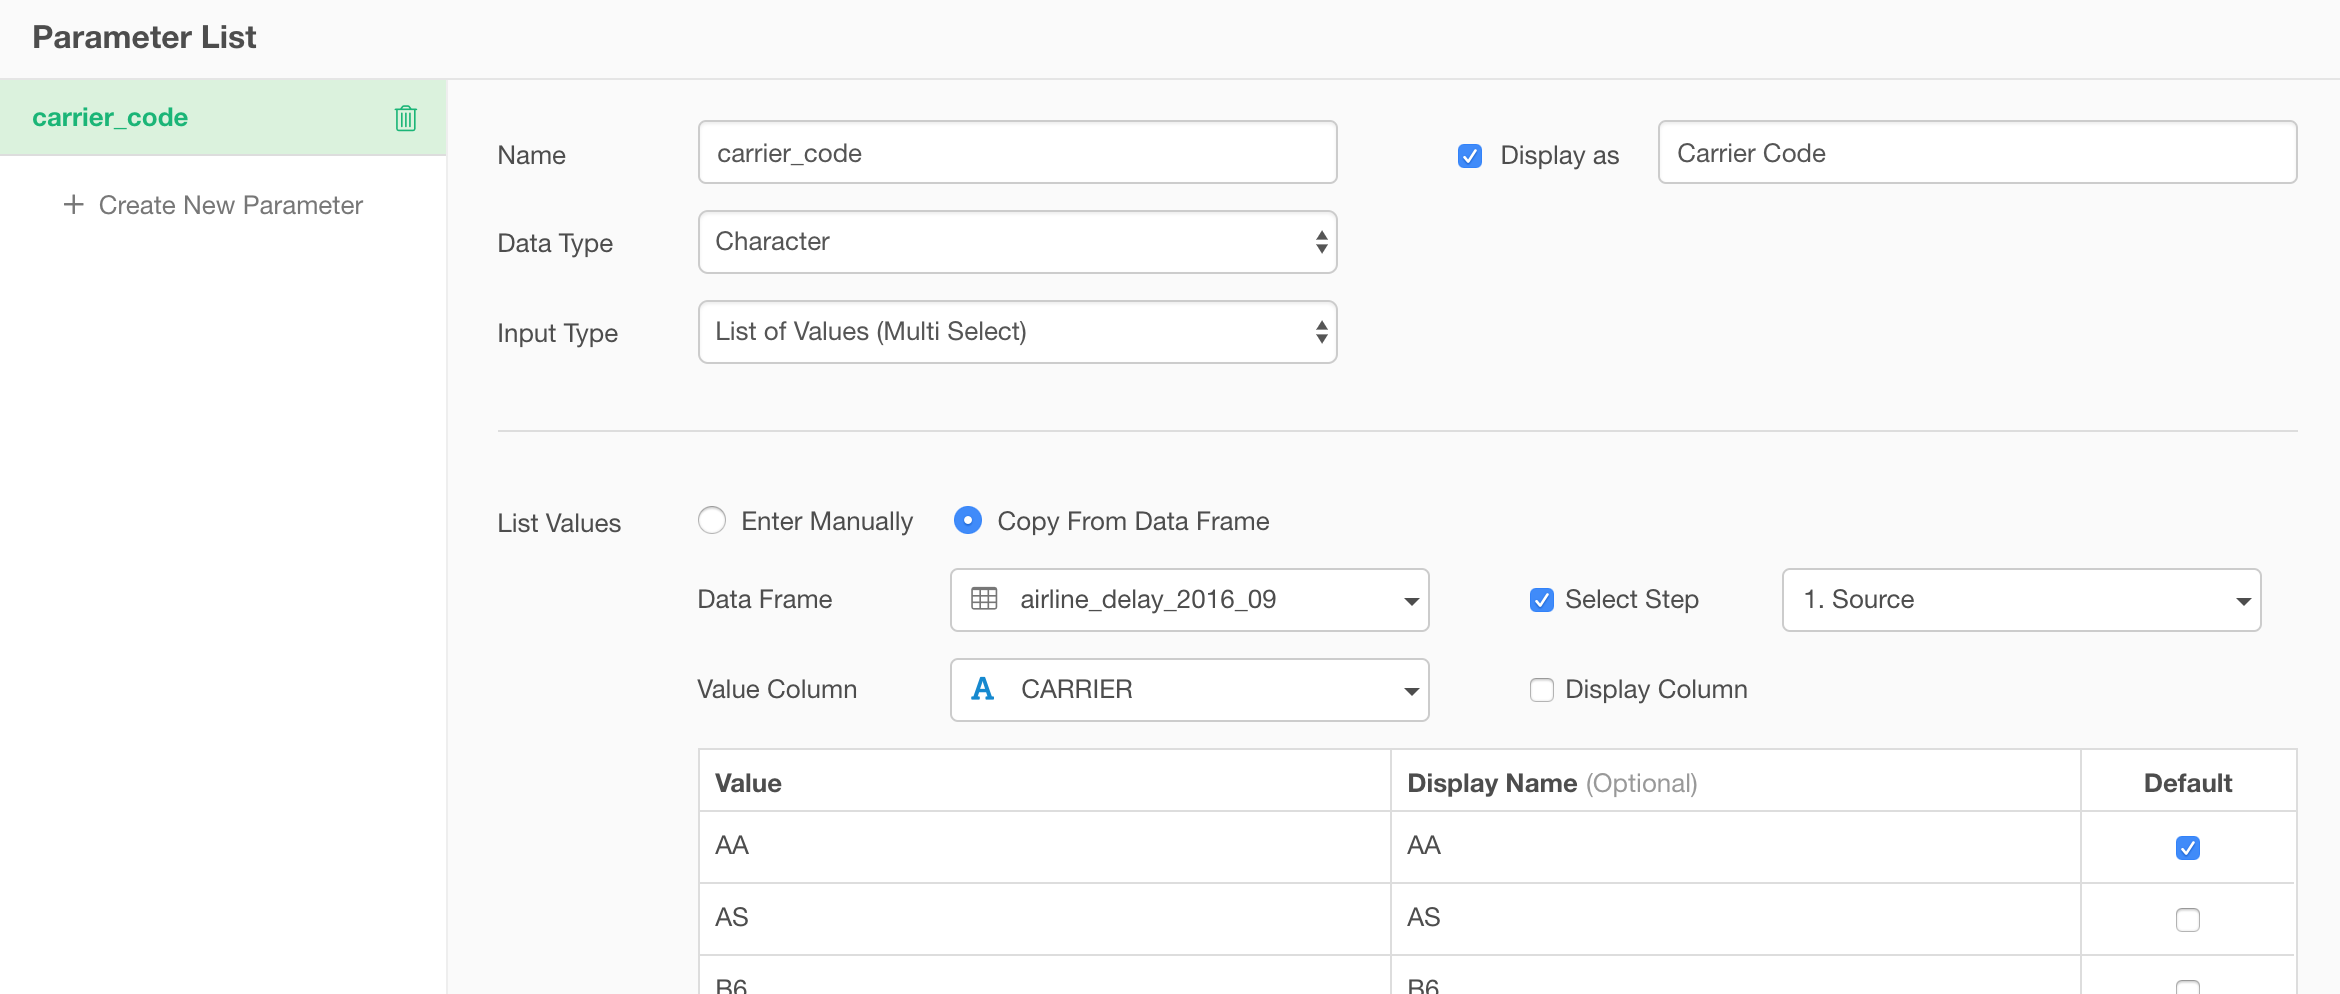
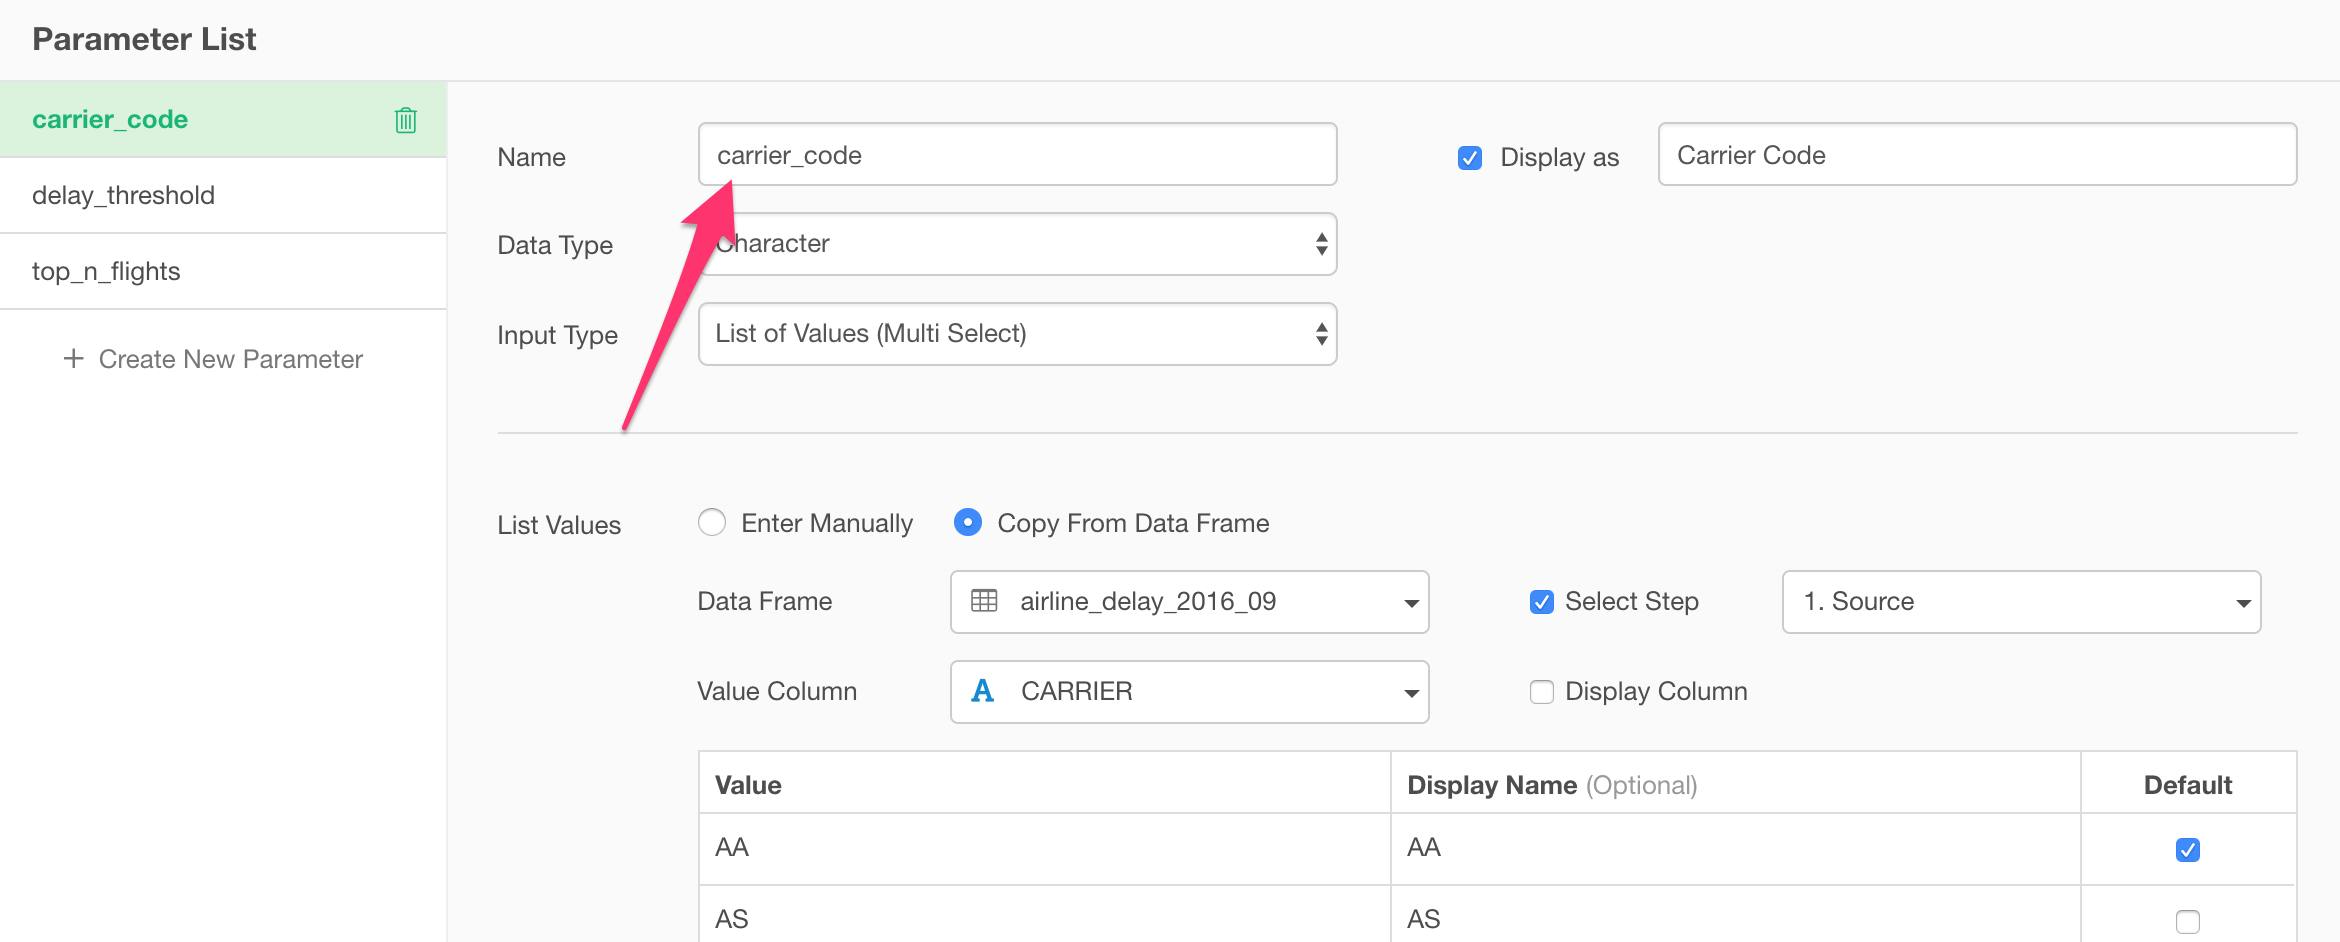
I’m creating a parameter called ‘carrier_code’. Note that it can’t have special characters like space, dash, etc. Only alphabets/numbers and underscores. If you want to use such characters for the display purpose then click on ‘Display as’ checkbox, then you can type a user-friendly name.
Also, I’m setting up the parameter as ‘Character’ data type and selecting ‘List of Values (Multi Select)’ as the parameter type.
List of Values
This parameter type allows you to select multiple values, hence you want to use it with something that can take an input of multiple values such as Filter’s ‘Is In / Is Not In’ operator.
I wanted to create a ‘Carrier Code’ parameter with which I can filter the data for a set of airline companies (e.g. AA, UA, etc.), so this ‘List of Values’ parameter type is the perfect choice.
You can either enter the list of values manually or select an existing column of a particular data frame. Here, I want to use the ‘CARRIER’ column of the flight data frame, so I’m selecting ‘Copy From Data Frame’ checkbox.
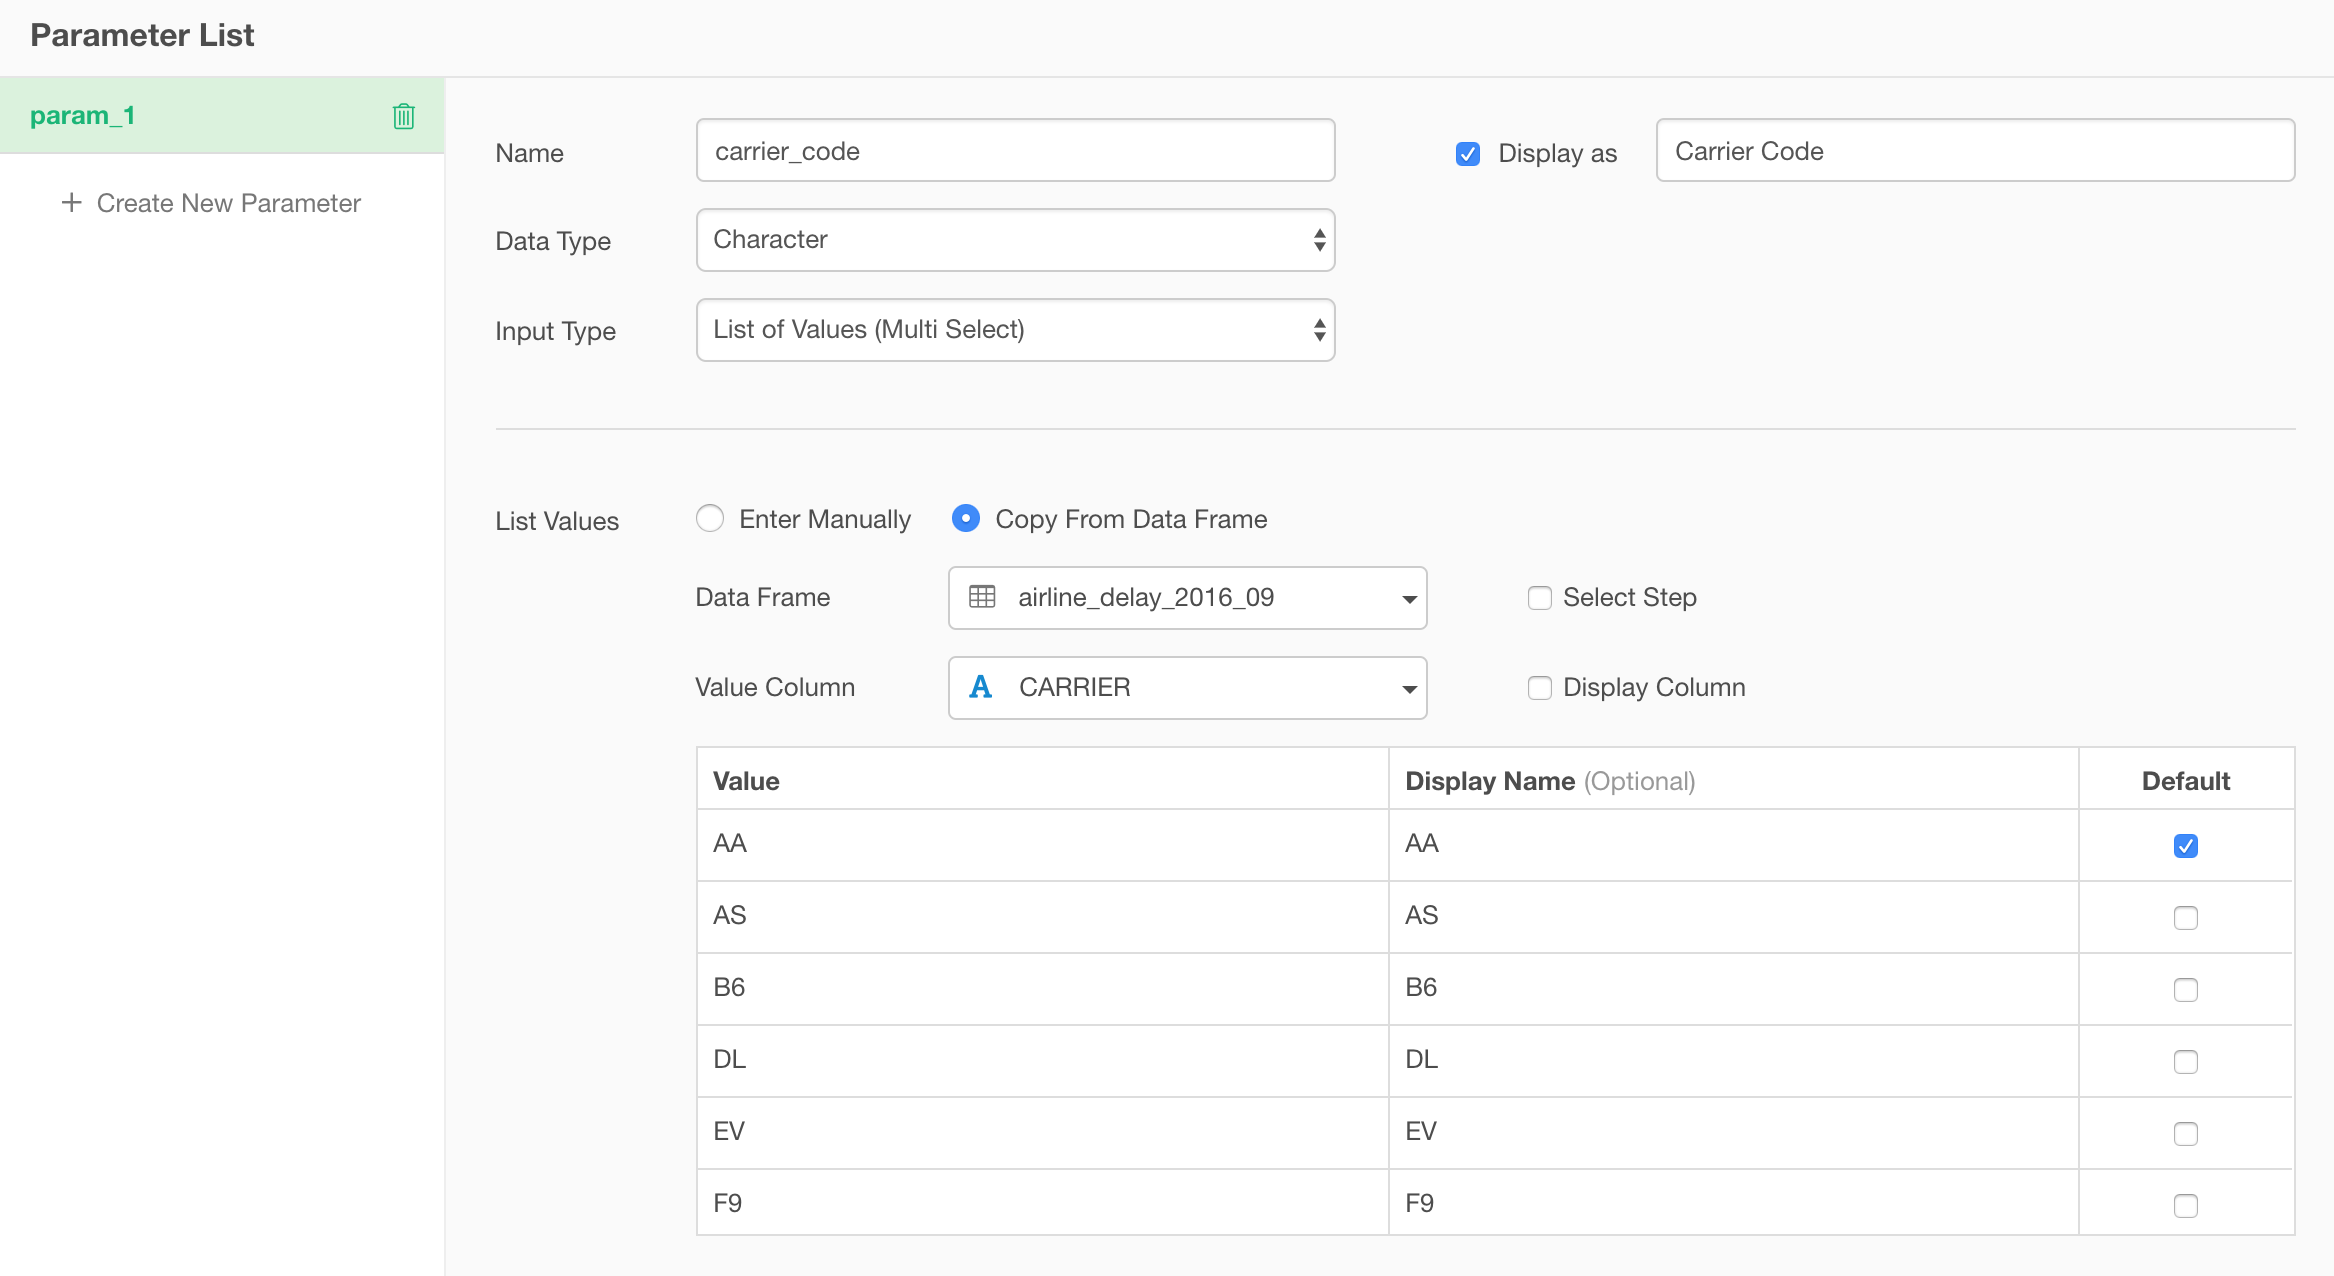
Select the ‘flight’ data frame for Data Frame and select a column ‘CARRIER’ for Value Column.
Now, here is one thing.
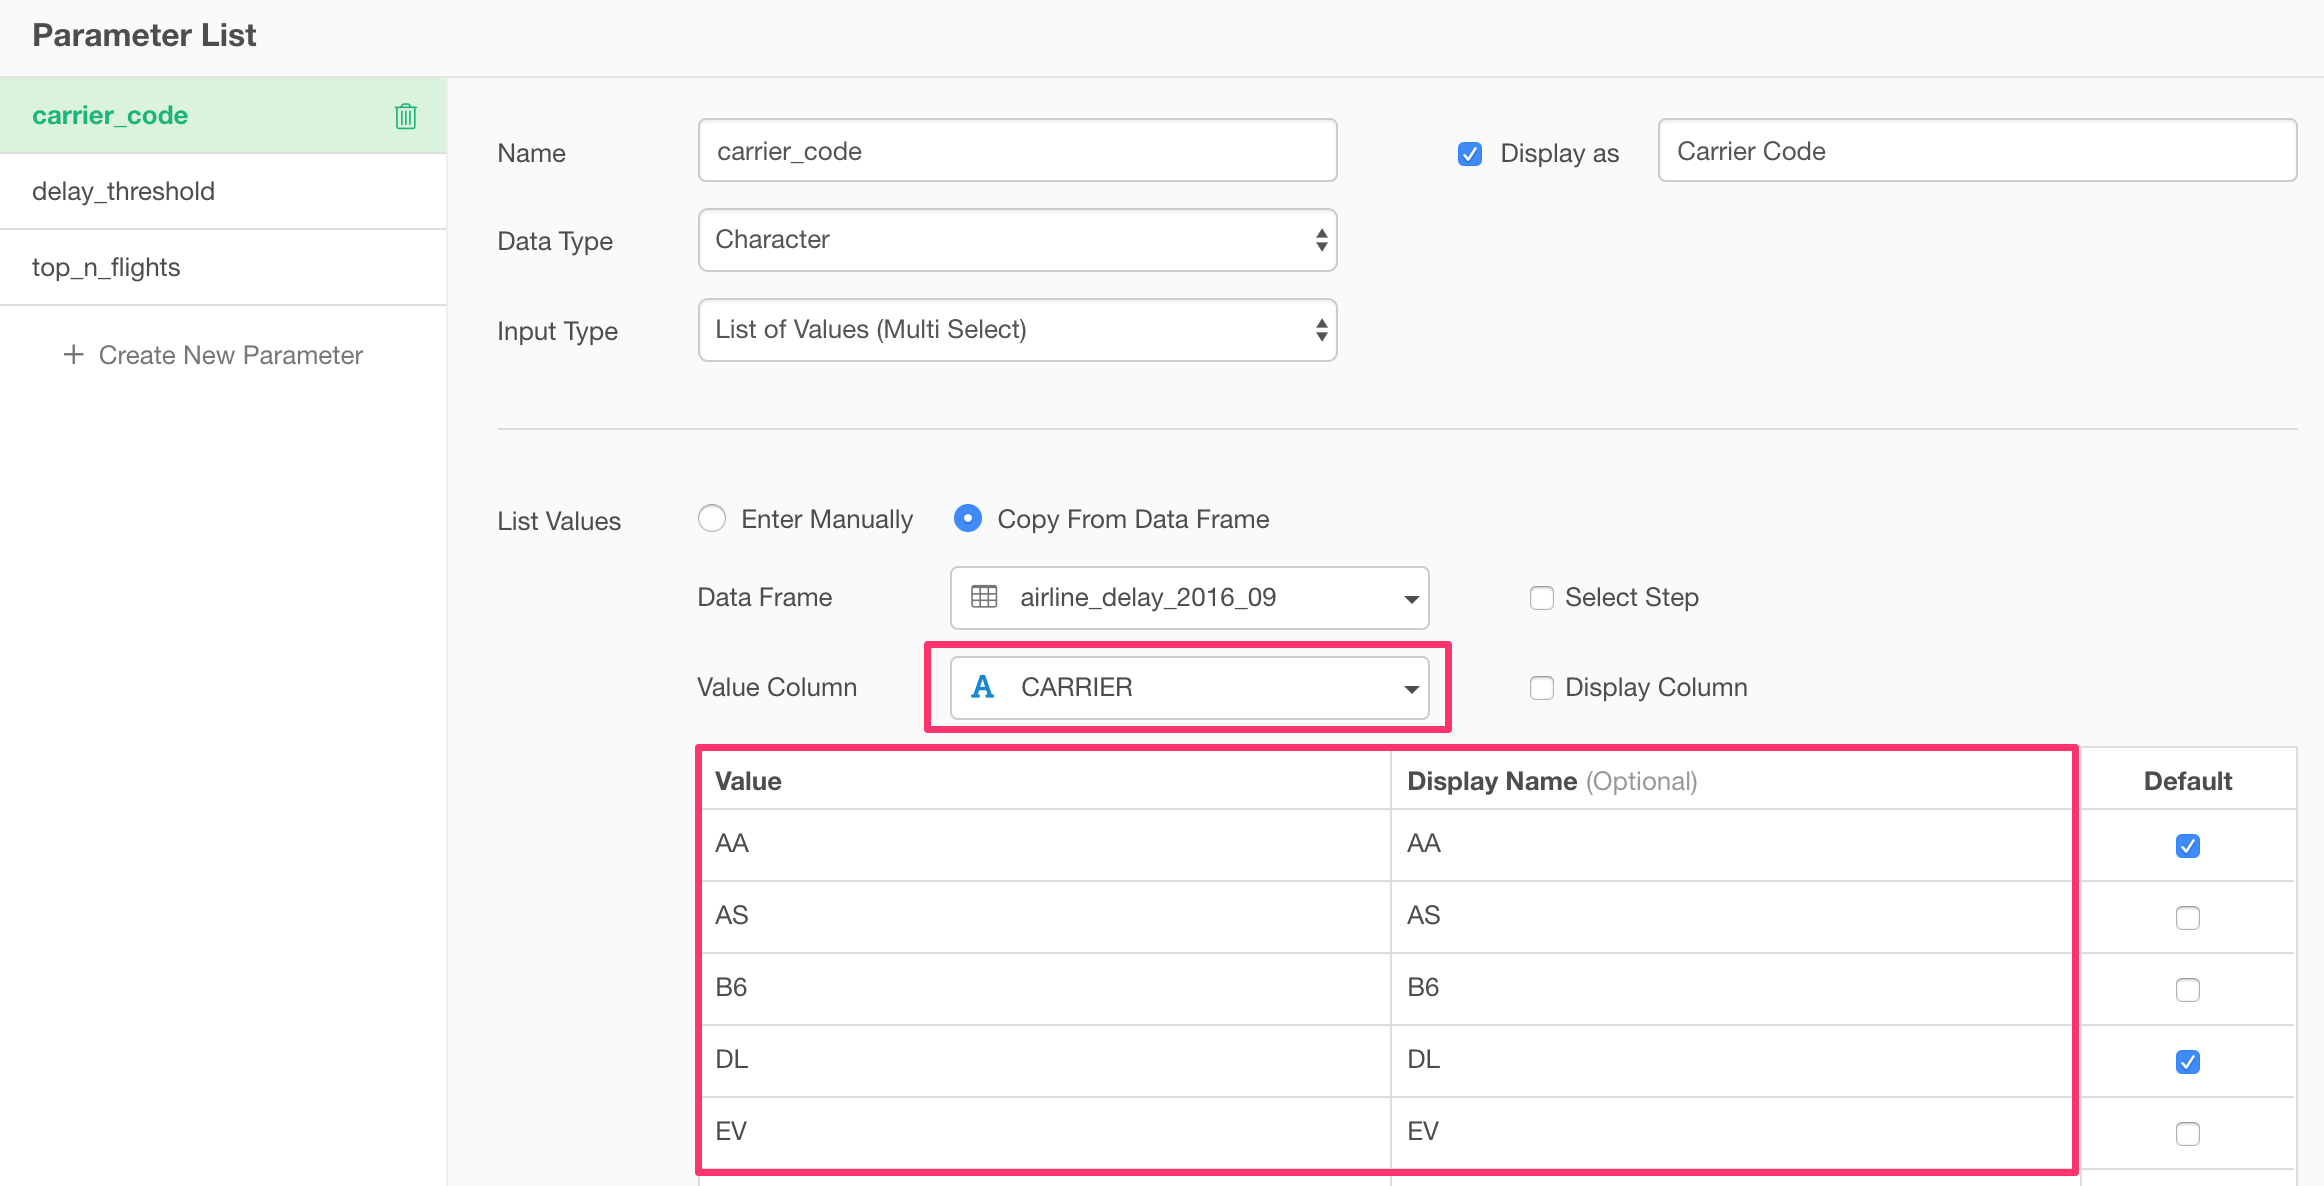
This column list for Value Columns and the values under the table are coming from the very last step of the selected data frame.
But, you might want to get the data from a particular step of the data wrangling step (the steps that are shown at the right-hand side of each data frame.).
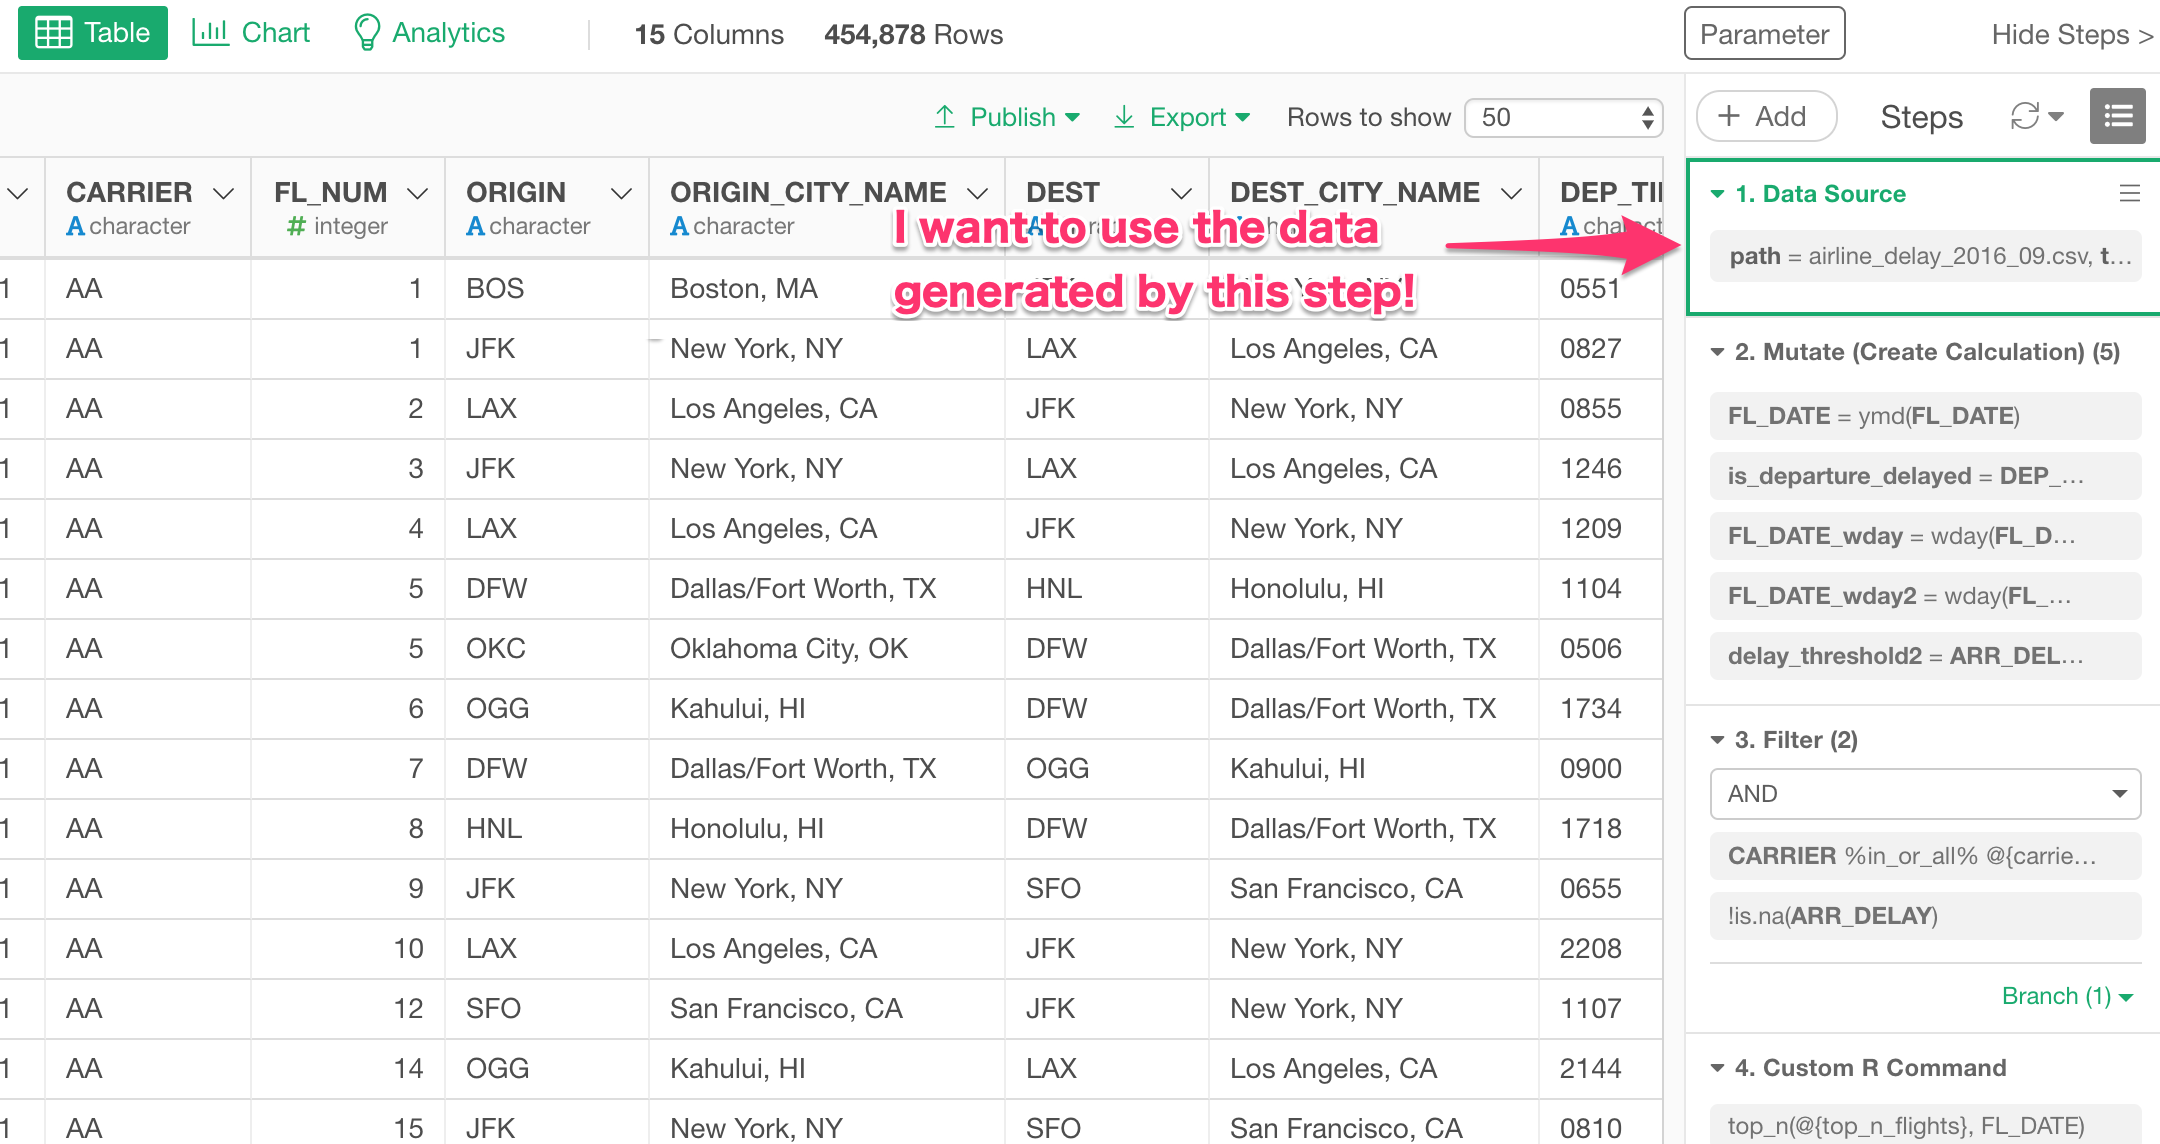
In this example, I want to create the list of values based on the data from the ‘1. Data Source’ step.
For this, we can click the checkbox next to ‘Select Step’ and select ‘Source’ step from the dropdown.
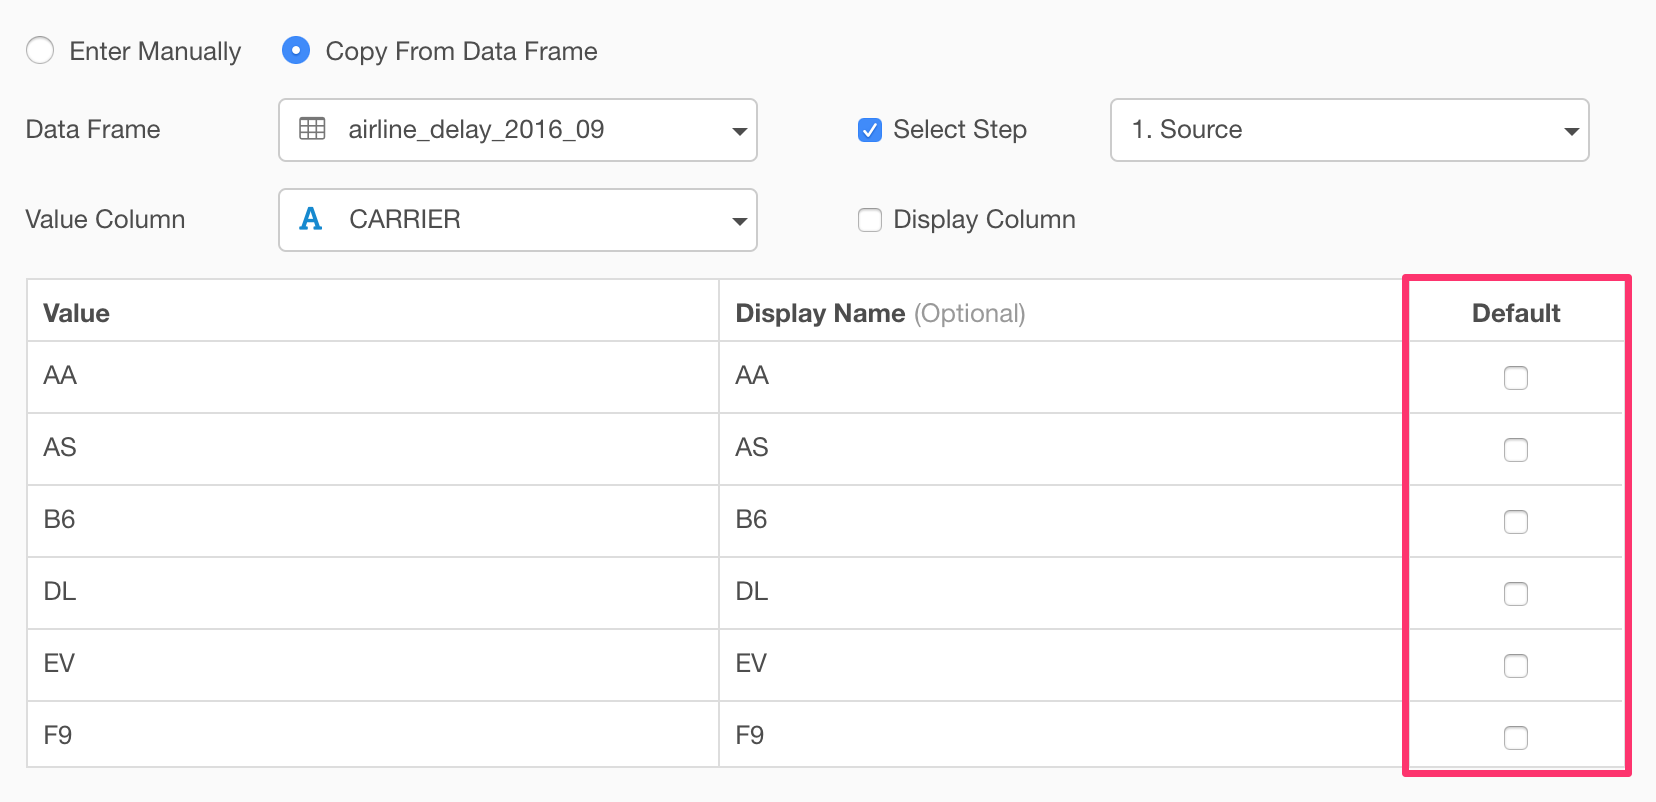
You can also set which values are the default values by clicking the check boxes next the values. Here, I’m setting ‘AA (American Airline)’ and ‘DL (Delta Airline)’ as the default values.
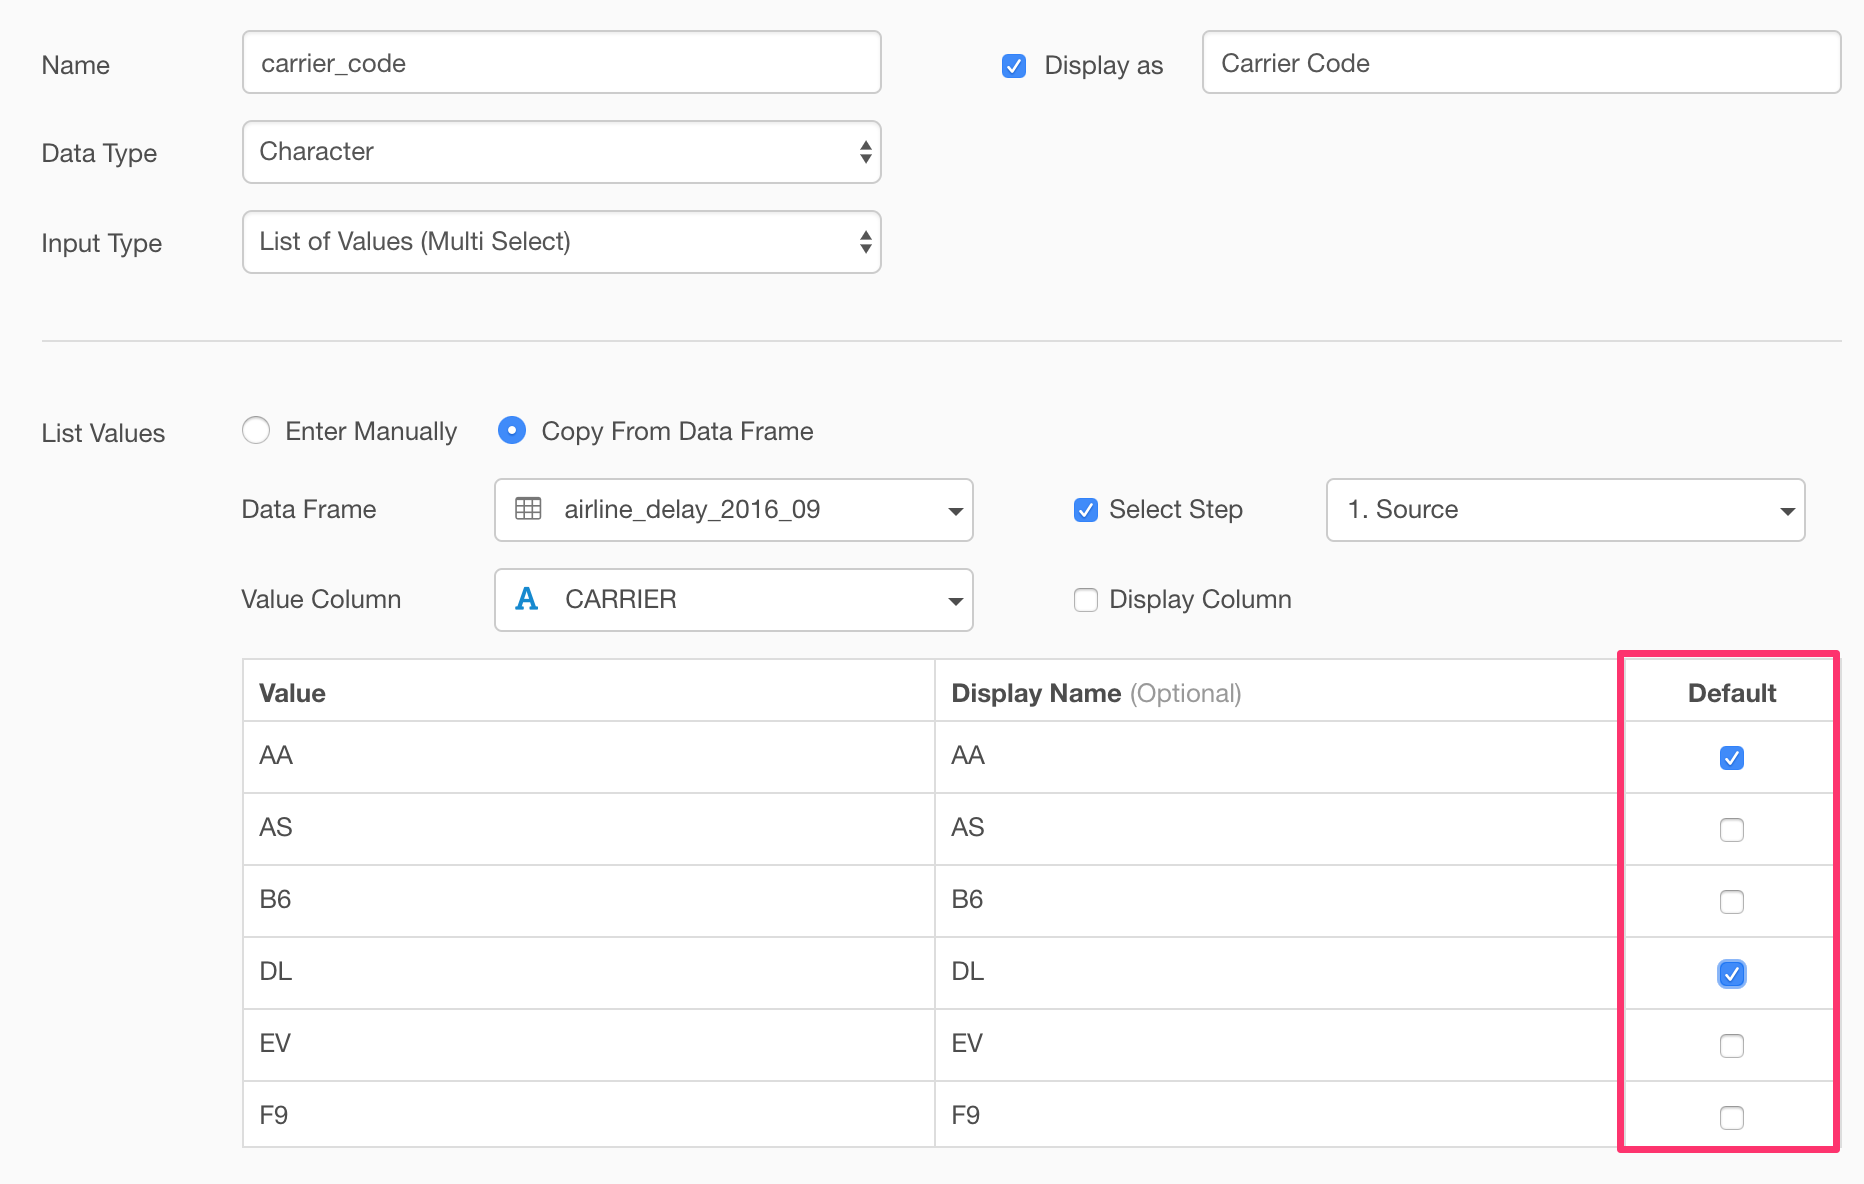
By the way, you can choose to not select any default values. In this case, if the parameter is used with ‘Is In’ or ‘Is Not In’ operator of Filter step, it will be considered as ‘All’ values selected.
Once it’s ready, then you can close the dialog. It automatically saves the information you have set.
Use the Parameter in Filter Step
Now that the new parameter is created, we can use it. In this example, we want to set the parameter in the Filter step so that the filter condition will become dynamic based on the user’s input.
In the Filter dialog, select the parameter that we have just created.
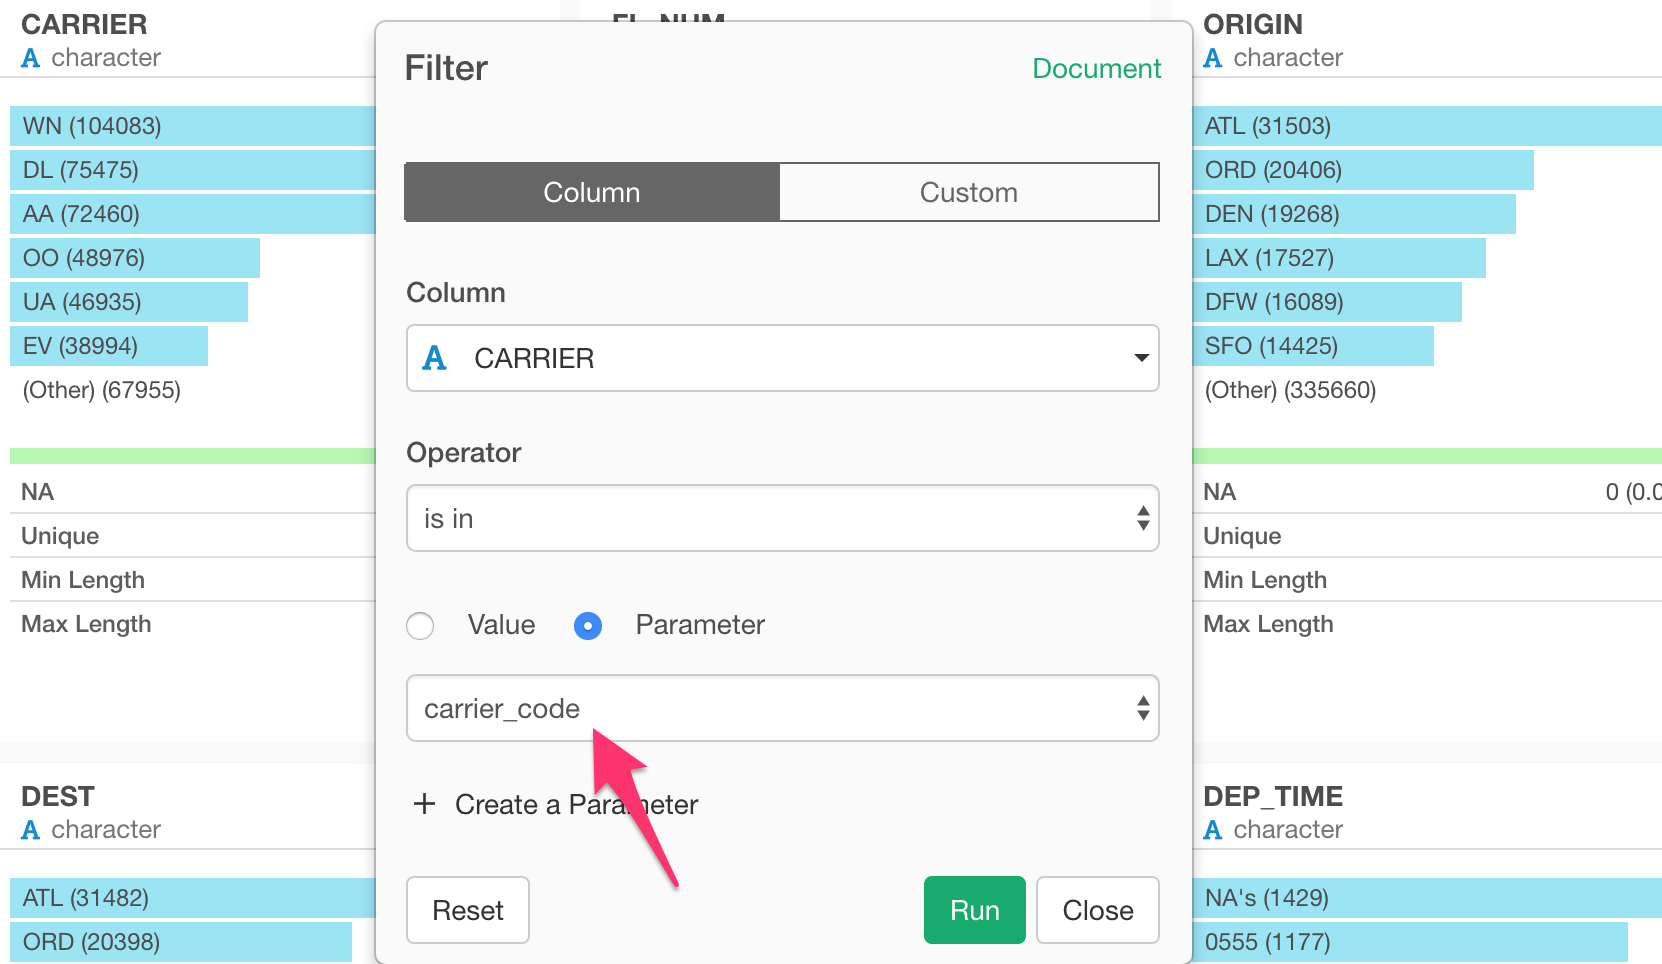
By running the Filter step, you can see the data including only ‘AA’ and ‘DL’.
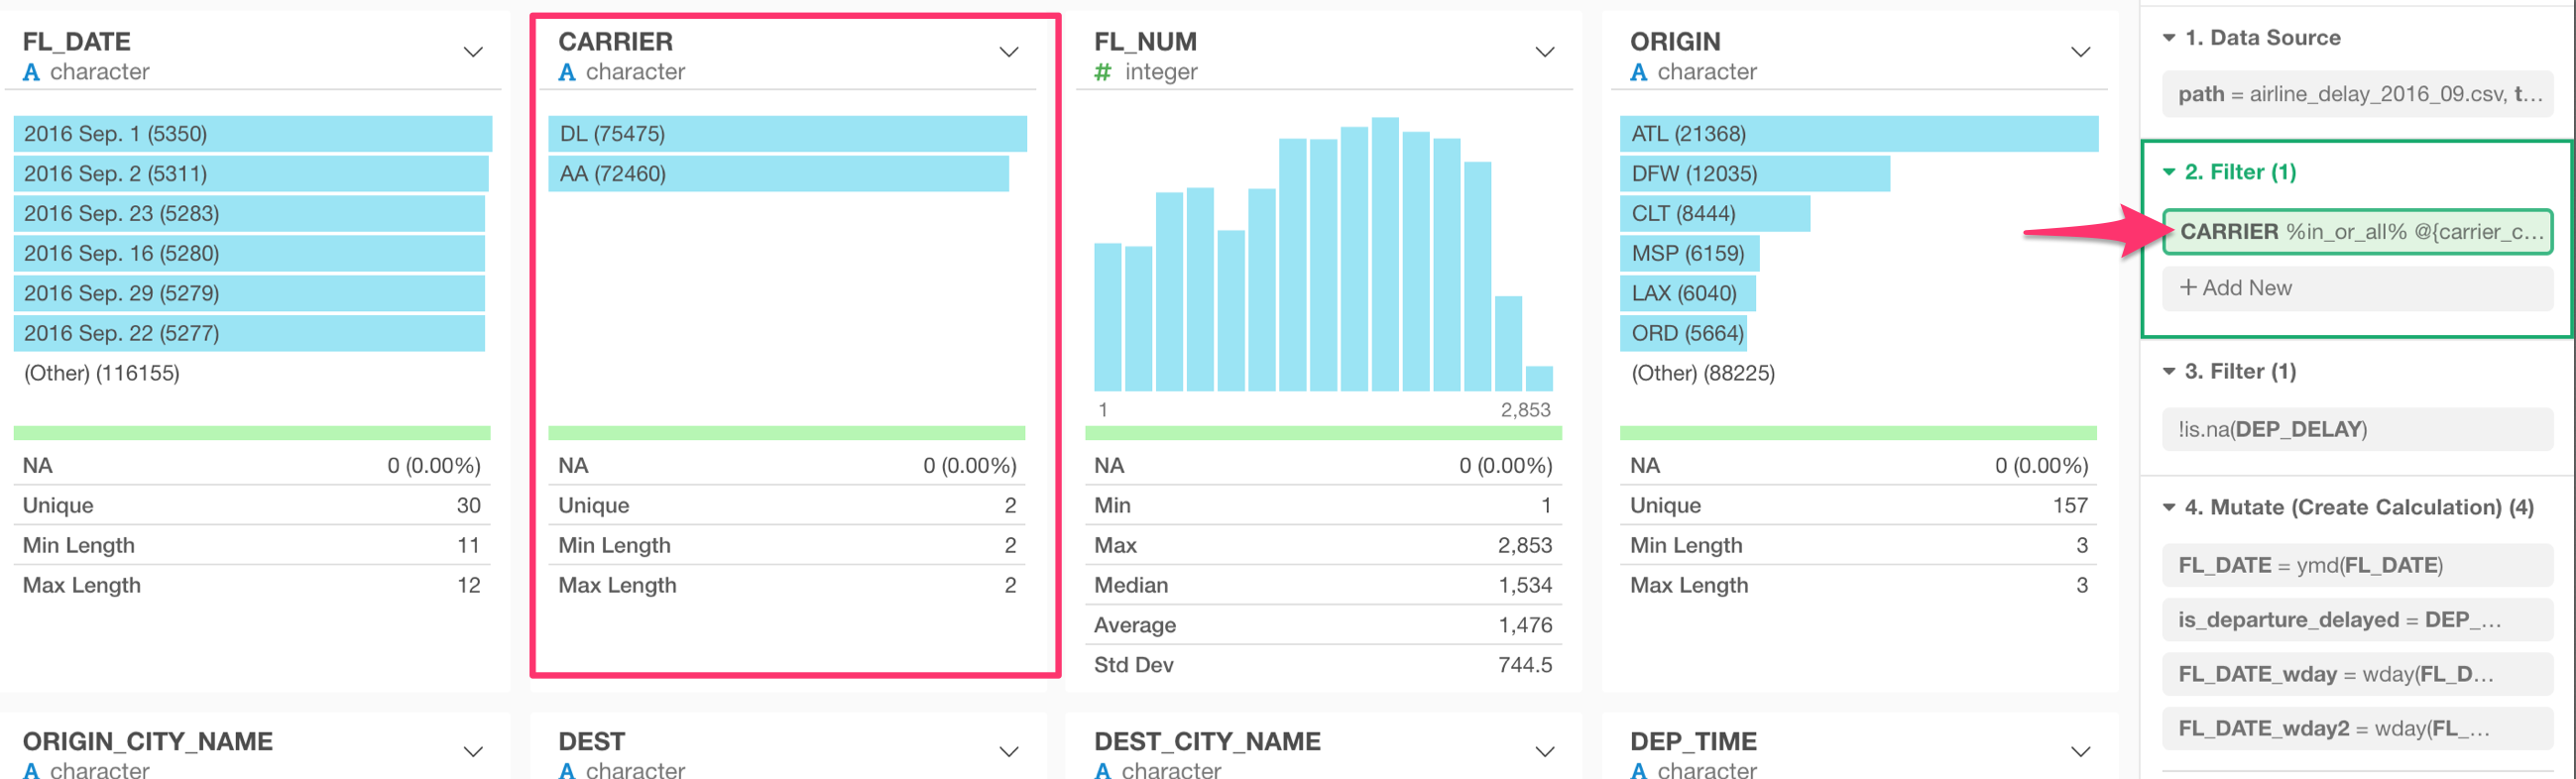
Interact with the Parameter at Data Frame level
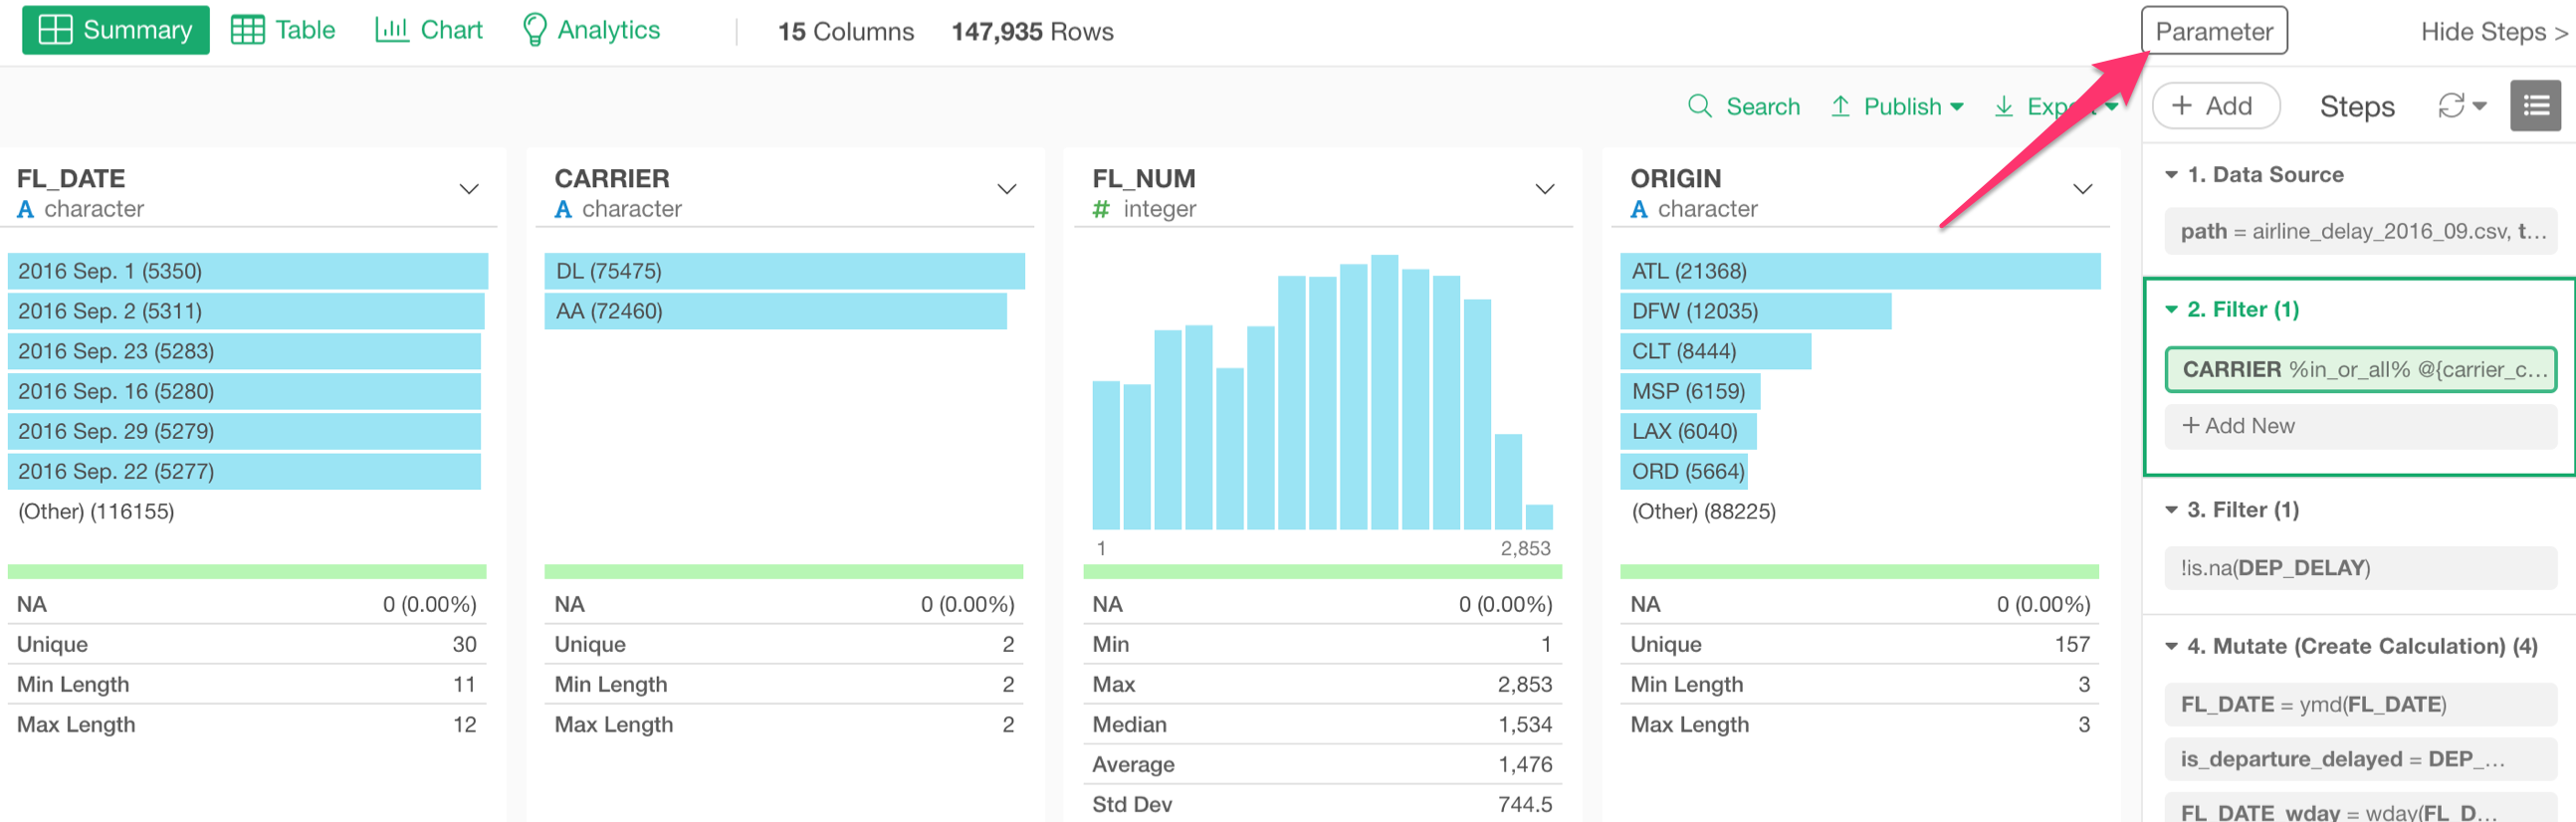
If you want to change the parameter values interactively, you can click on Parameter button.
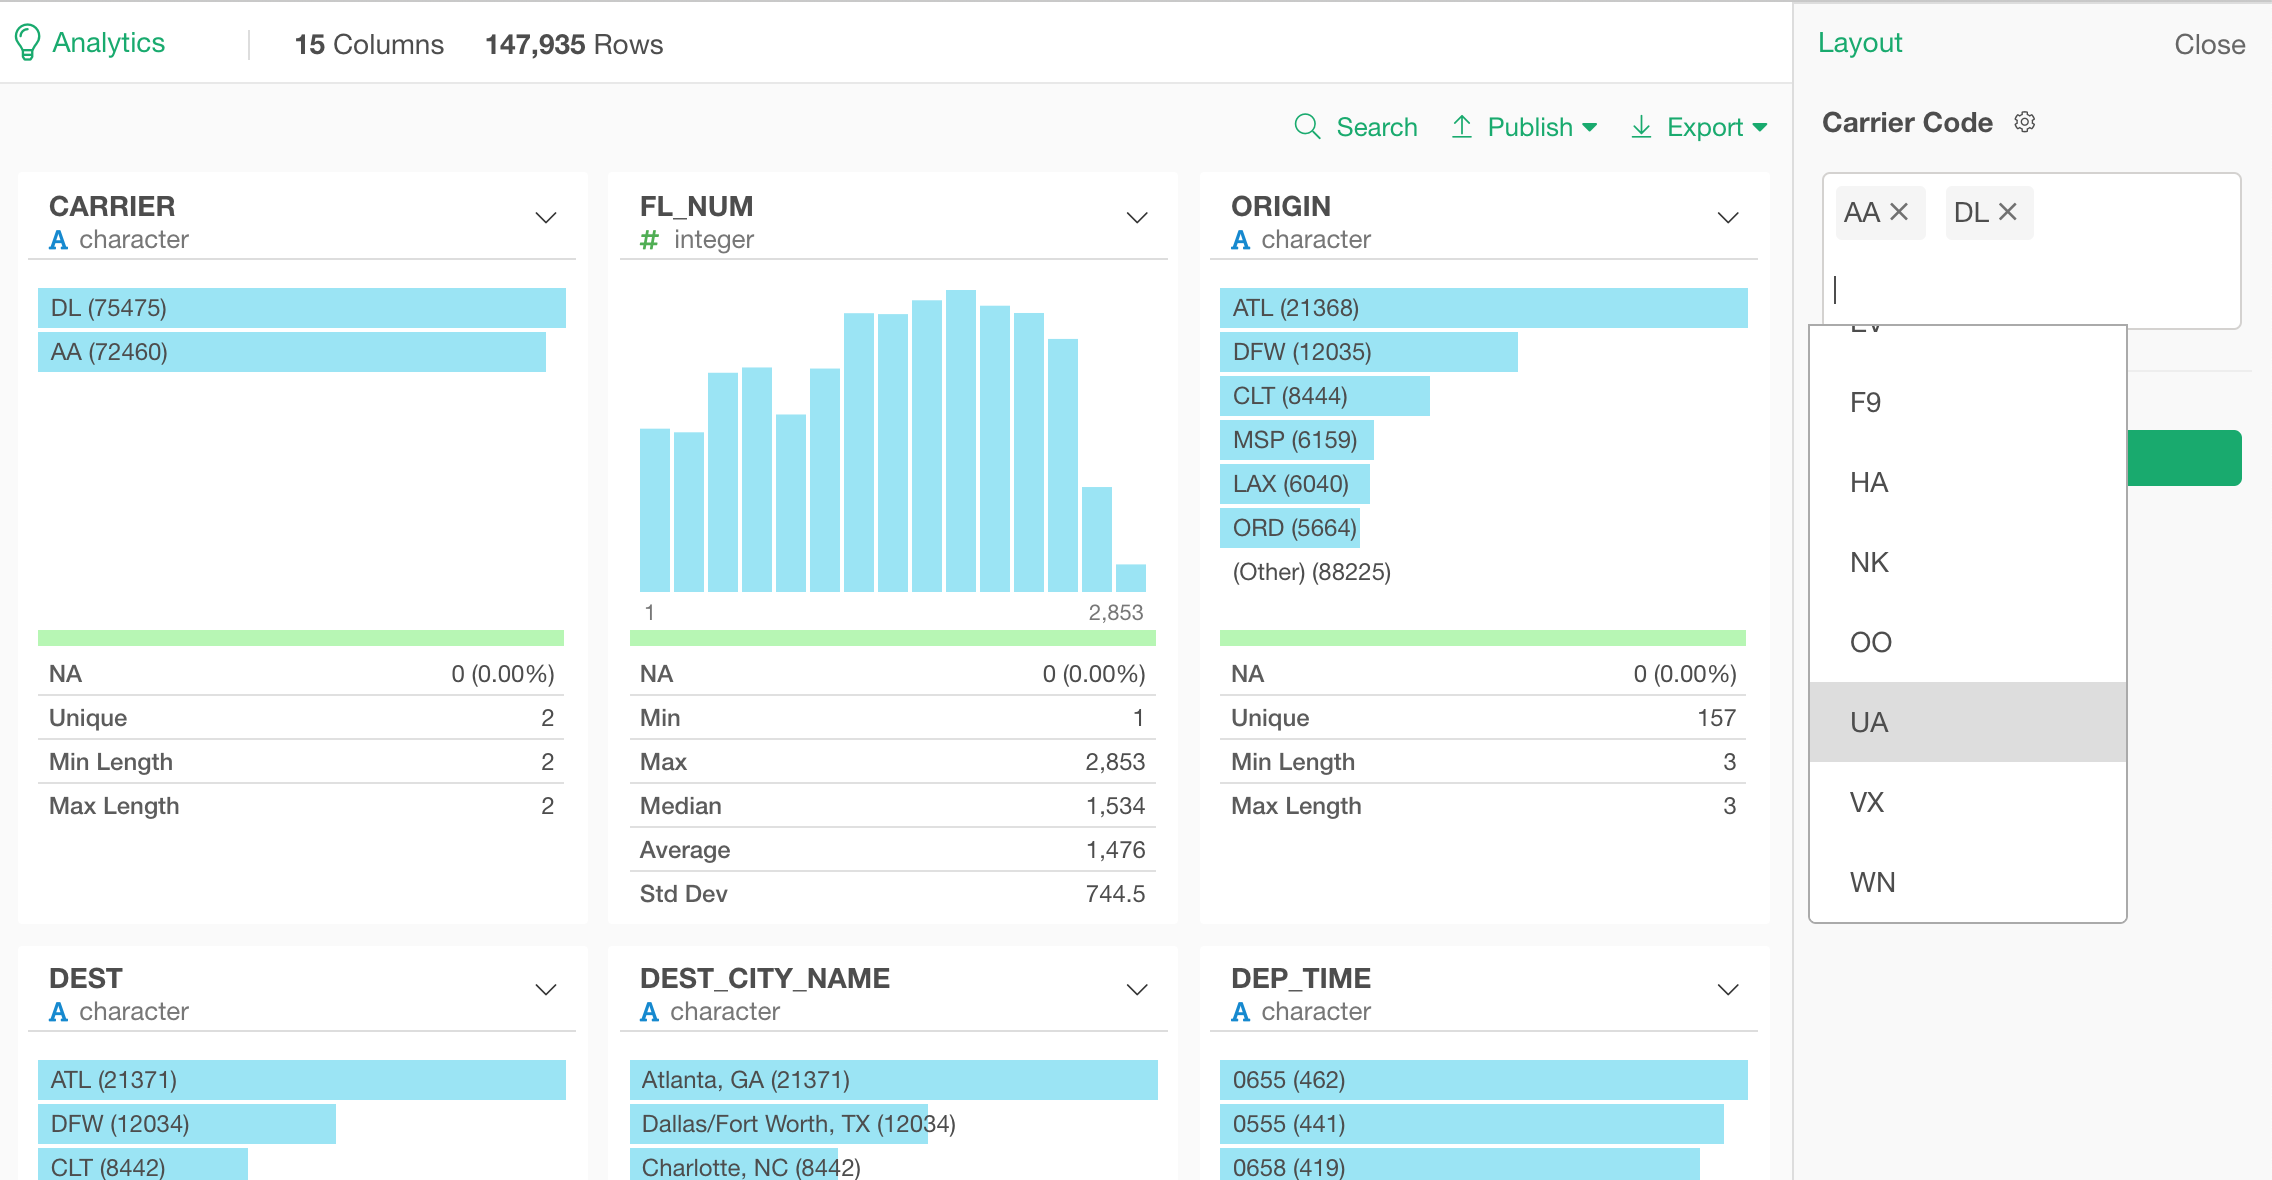
And select the values you want in the Parameter pane, and click ‘Run’ button.
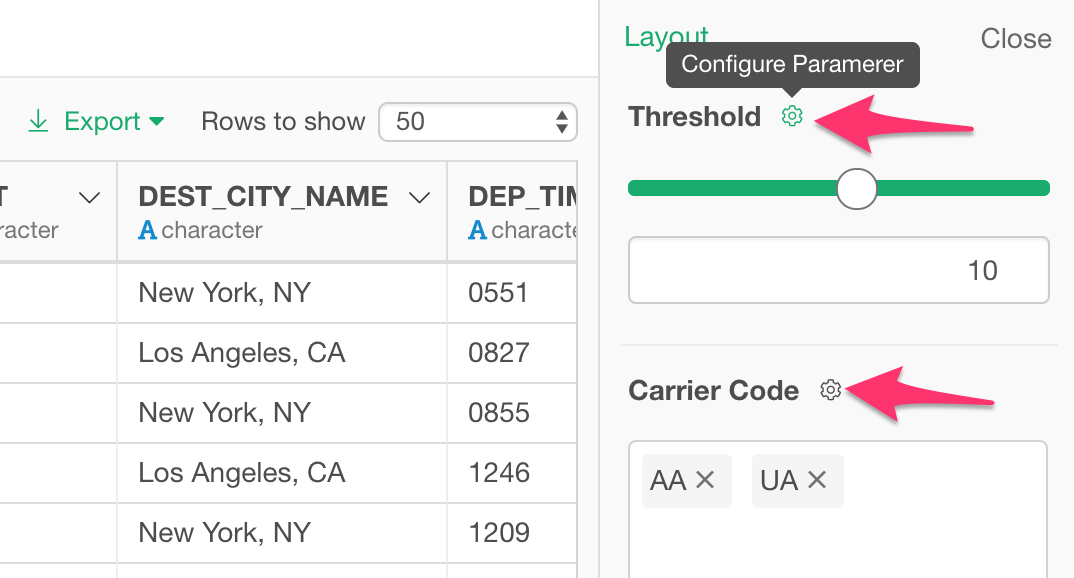
If you want to update the parameter configuration you can click on the gear icon next to the parameter.
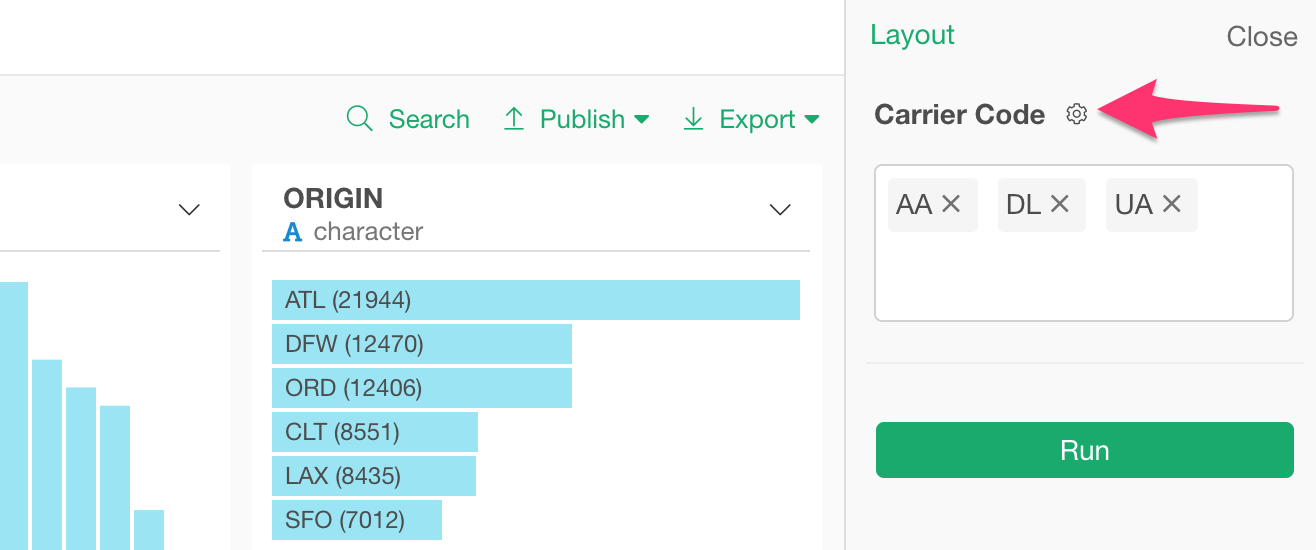
This will open the Parameter configuration dialog.
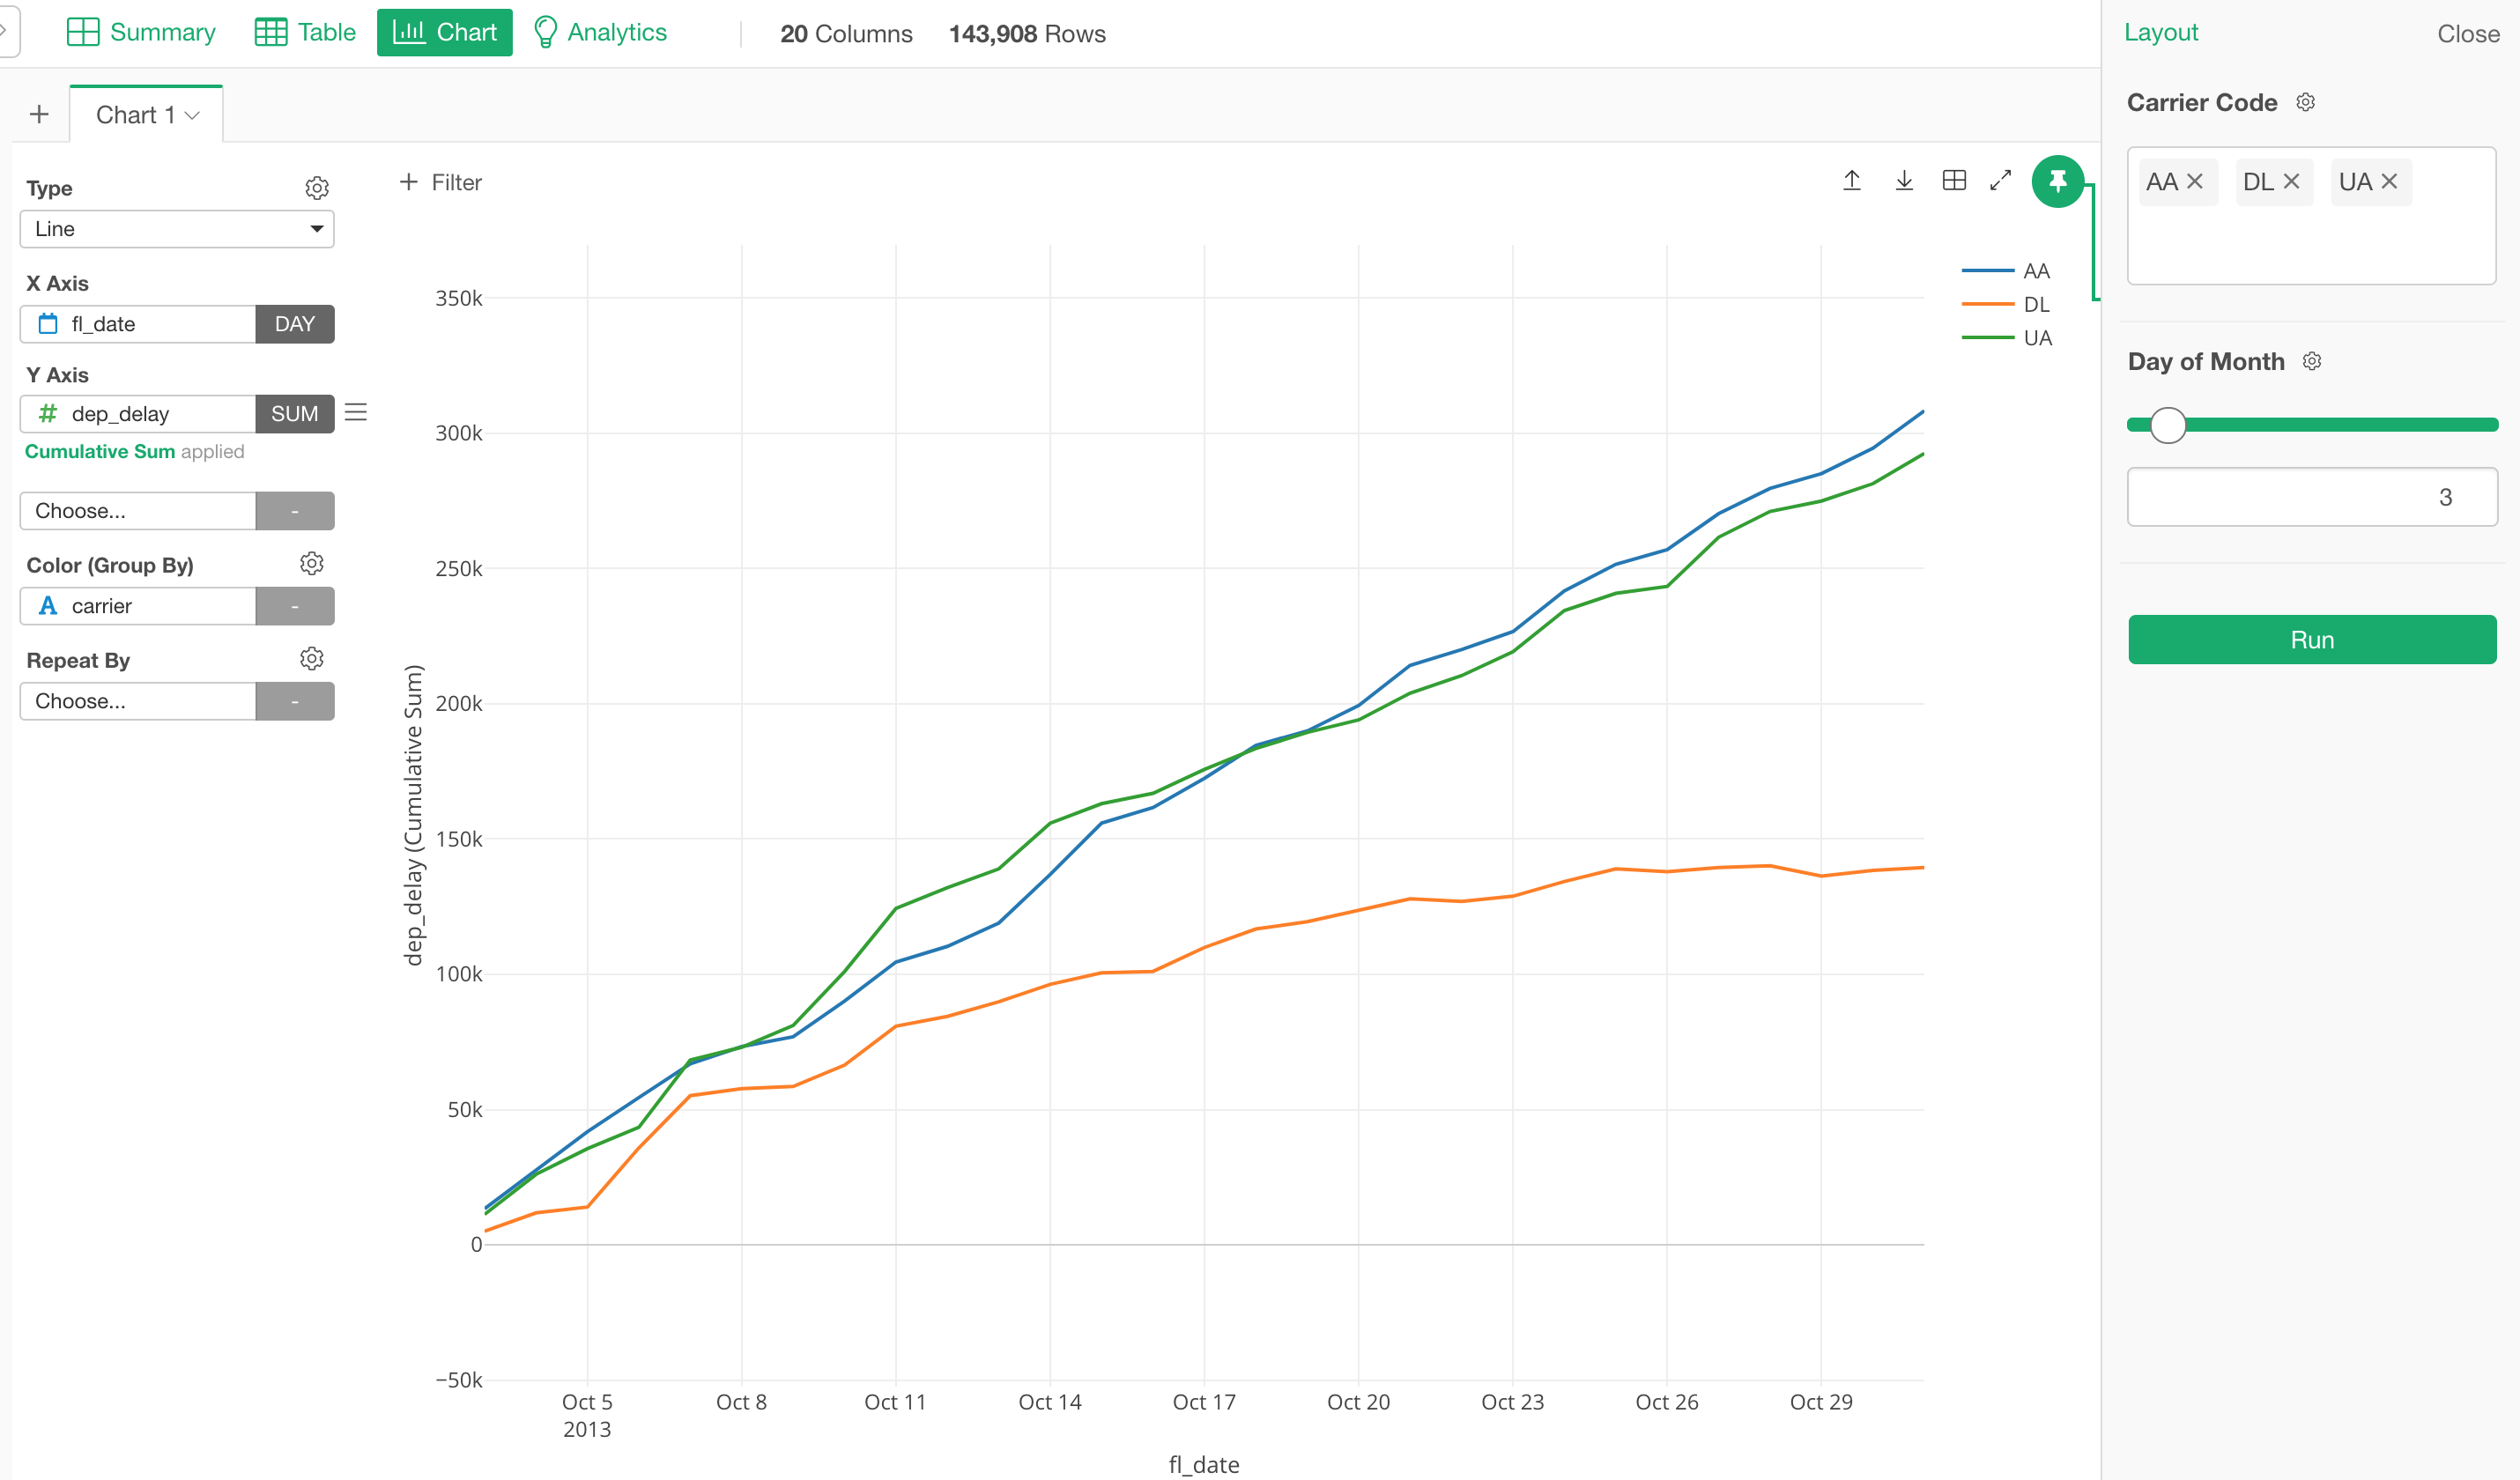
Use Parameter with Dashboard inside Desktop
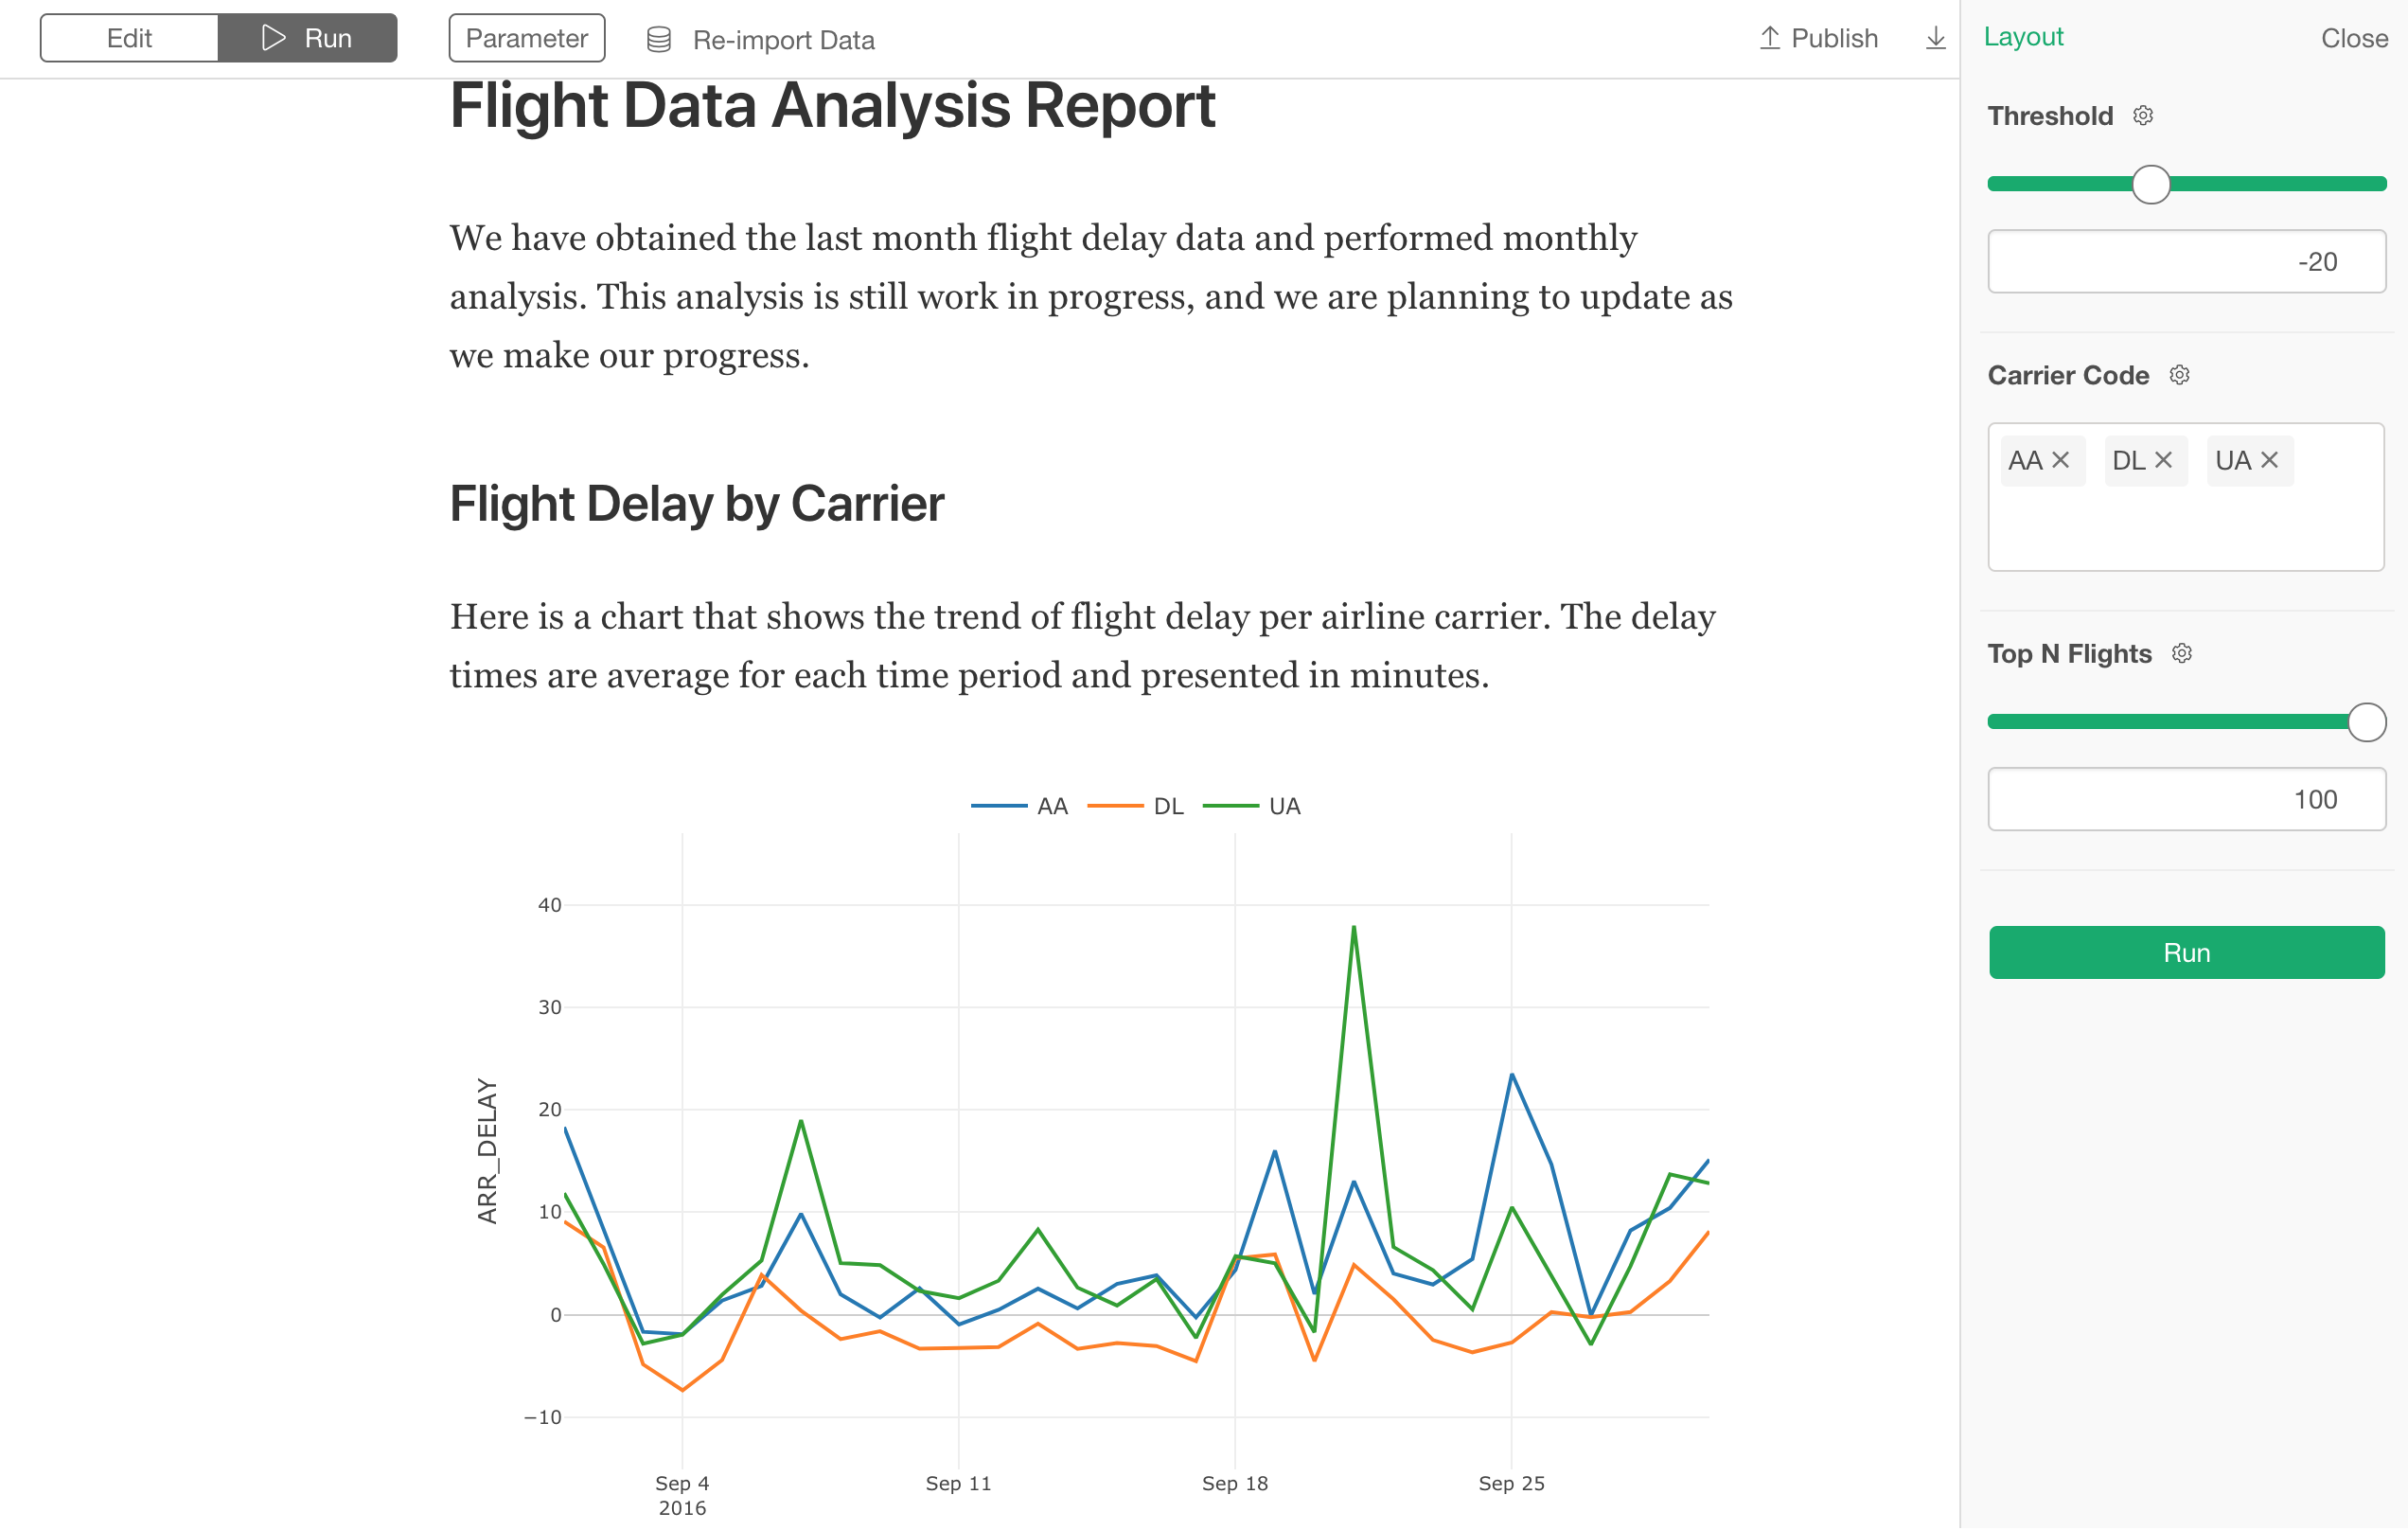
When you include charts inside Dashboard, Note, and Slides, Exploratory automatically detects all the parameters that are used for producing the charts and lists them in the parameter pane.
So you don’t need to do anything to enable the parameters at Dashboard, Note, and Slides level. Just click ‘Parameter’ button at the top, this will open the parameter pane.
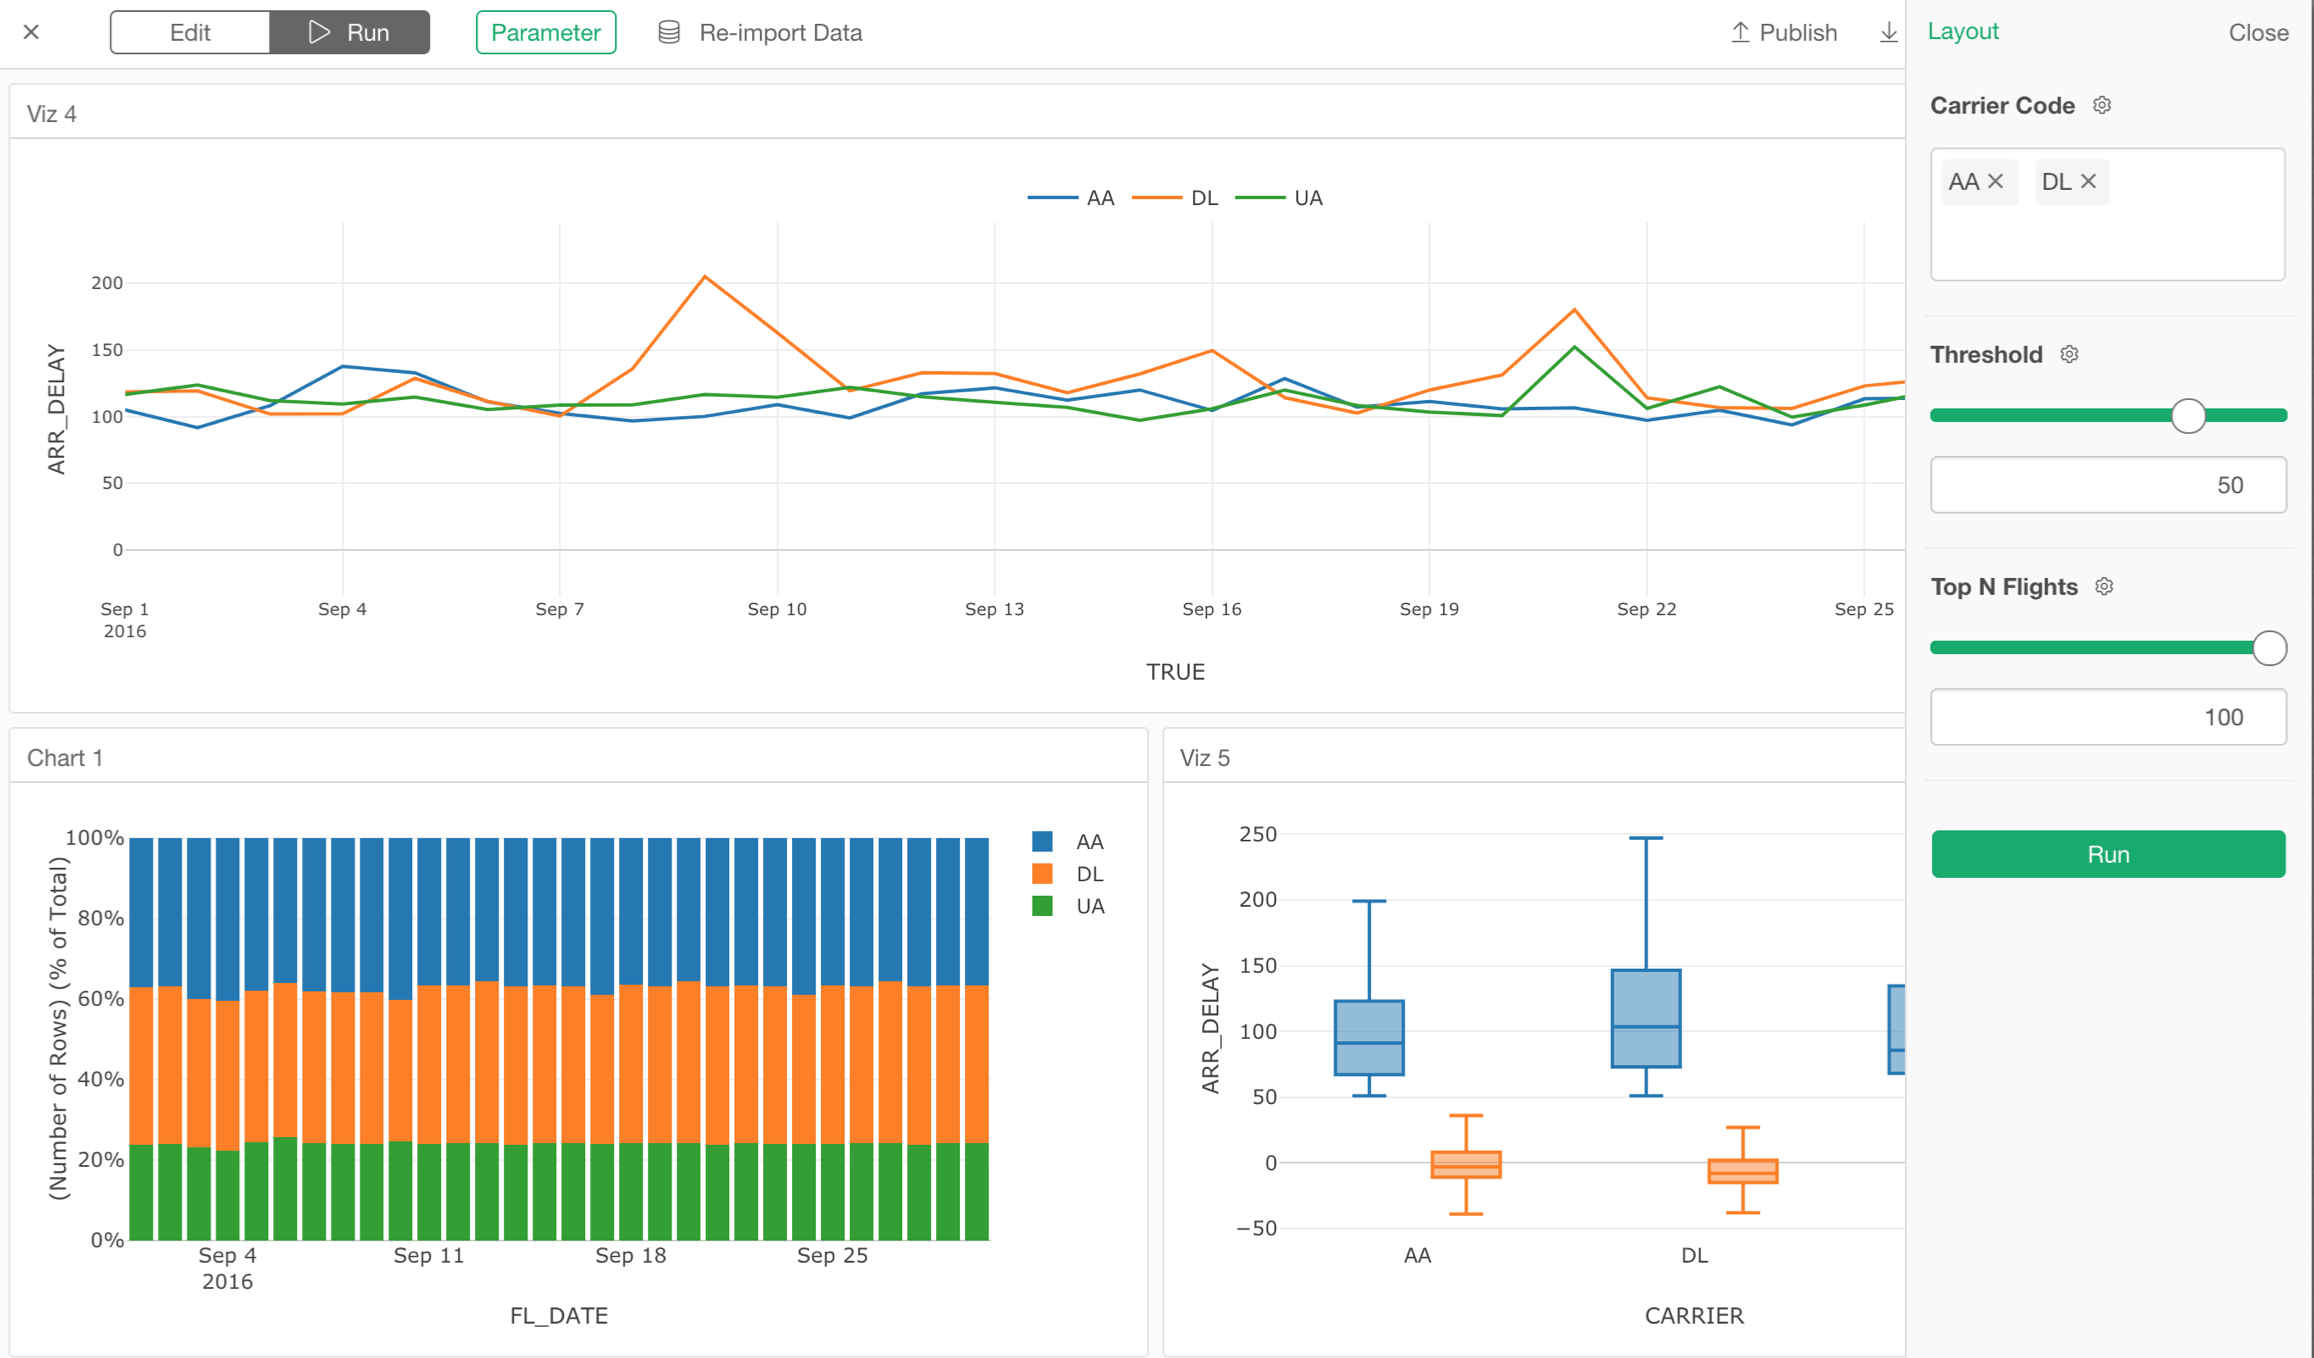
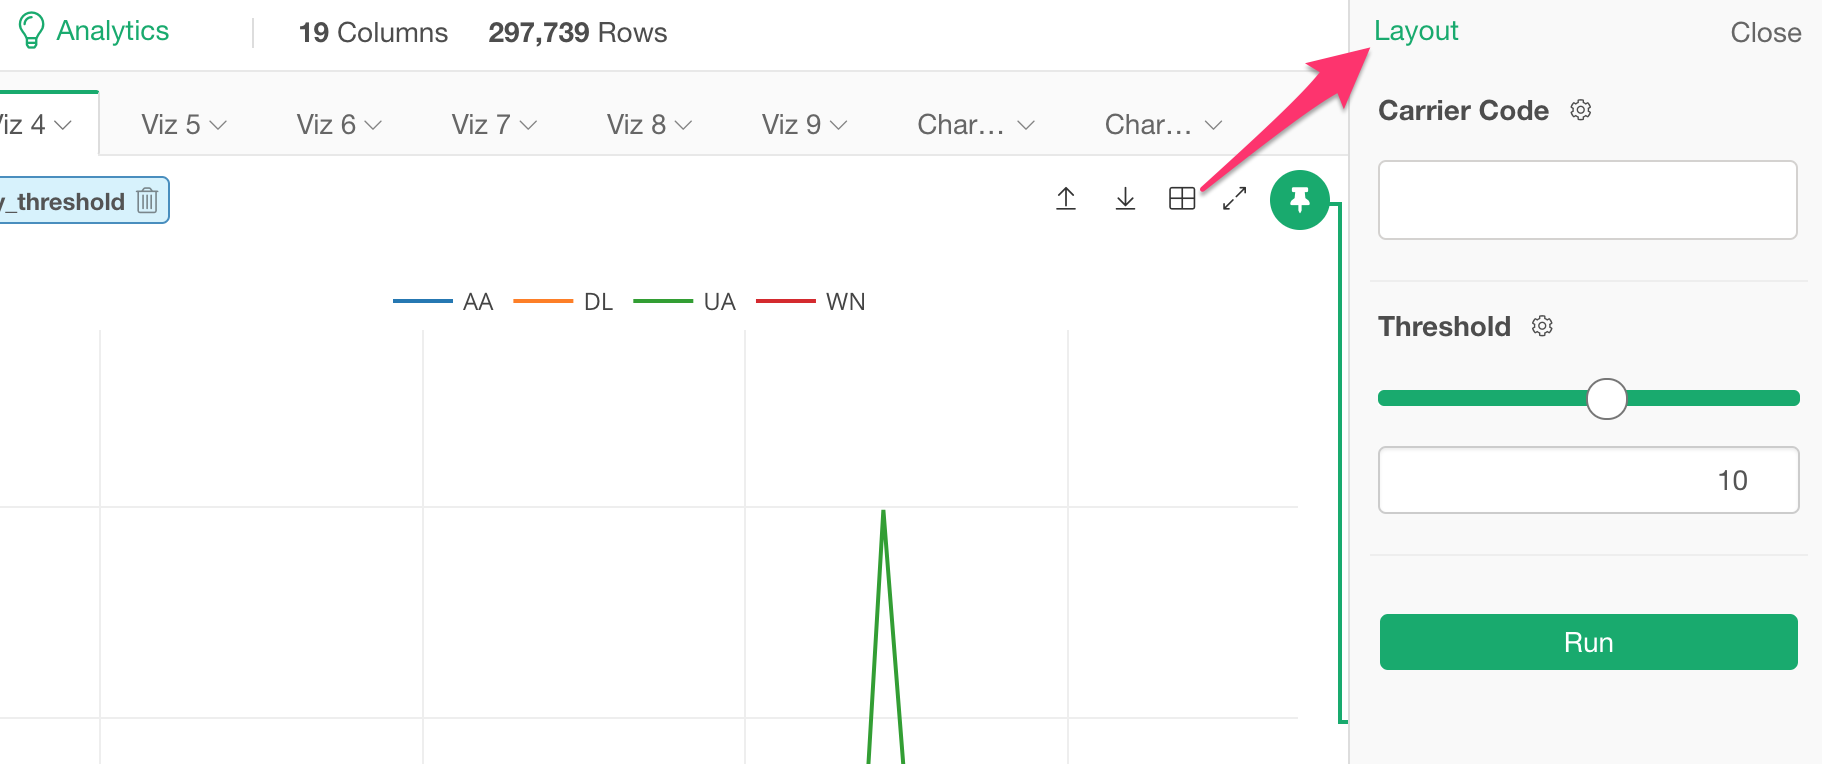
If you like to change the order of the parameters you can do so by clicking on Layout button at the left-hand side top.
Also, the parameter values you select in Dashboard are saved inside the Dashboard. This means, the next time you open the same Dashboard it will generate the data with the parameter setting.
Here are examples of Dashboard and Note.
Dashboard
Note
Use Parameter with Published Dashboard
One of the main reasons you would want to use the Parameter is that you want to share your reports such as Dashboard, Note, and Slides with others and have them being able to update the data based on their interests.
You can publish your Dashboard, Note, Slides, and Charts to either Exploratory Cloud (exploratory.io) or Exploratory Collaboration Server and share with others.
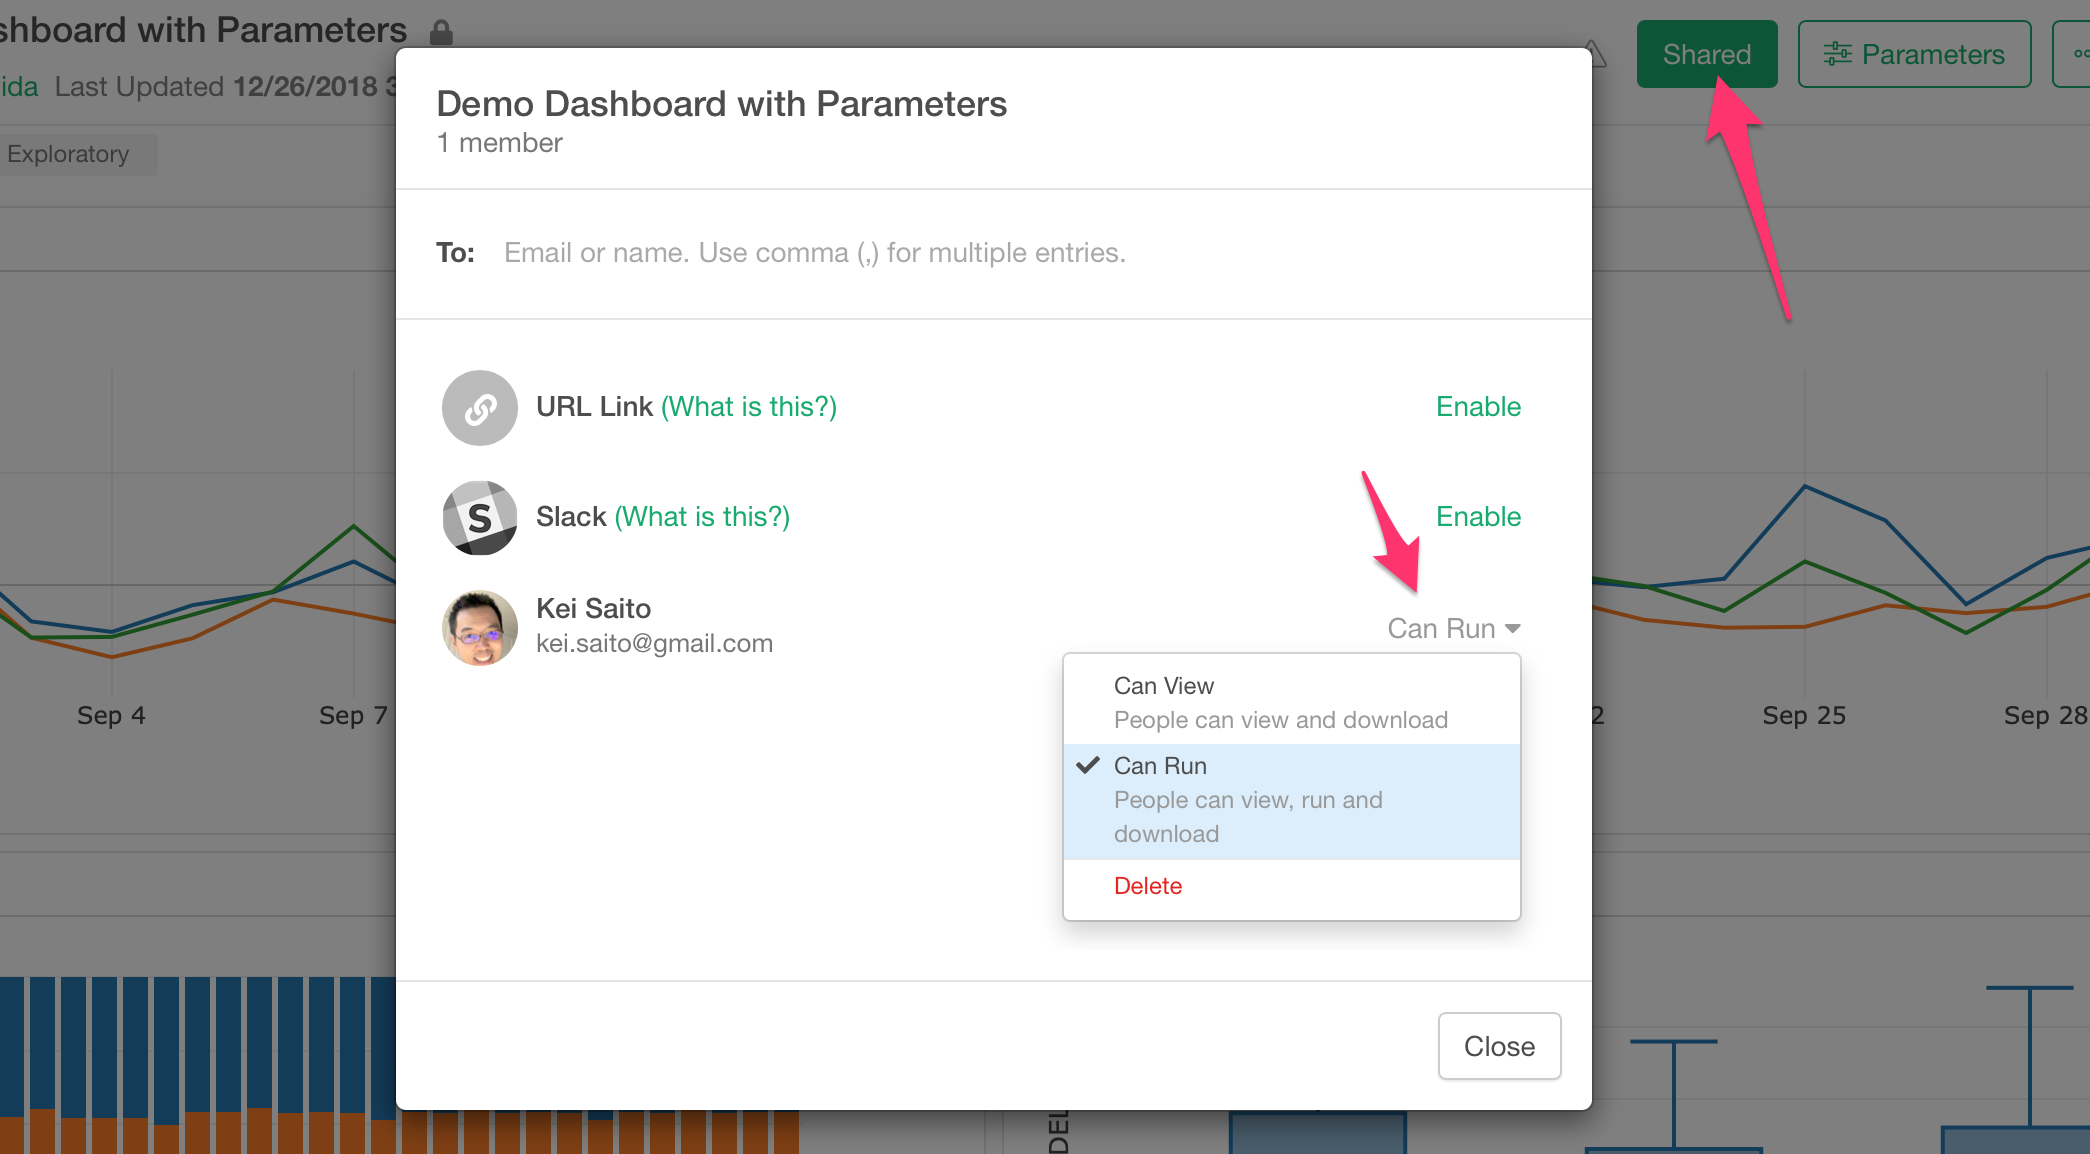
Since changing the parameter values and updating the Dashboard will need to process the data at the server (exploratory.io or Collaboration Server), you want to selectively decide who can run the Dashboard with the parameter carefully.
You can give ‘Can Run’ permission in the Share / Permission dialog.
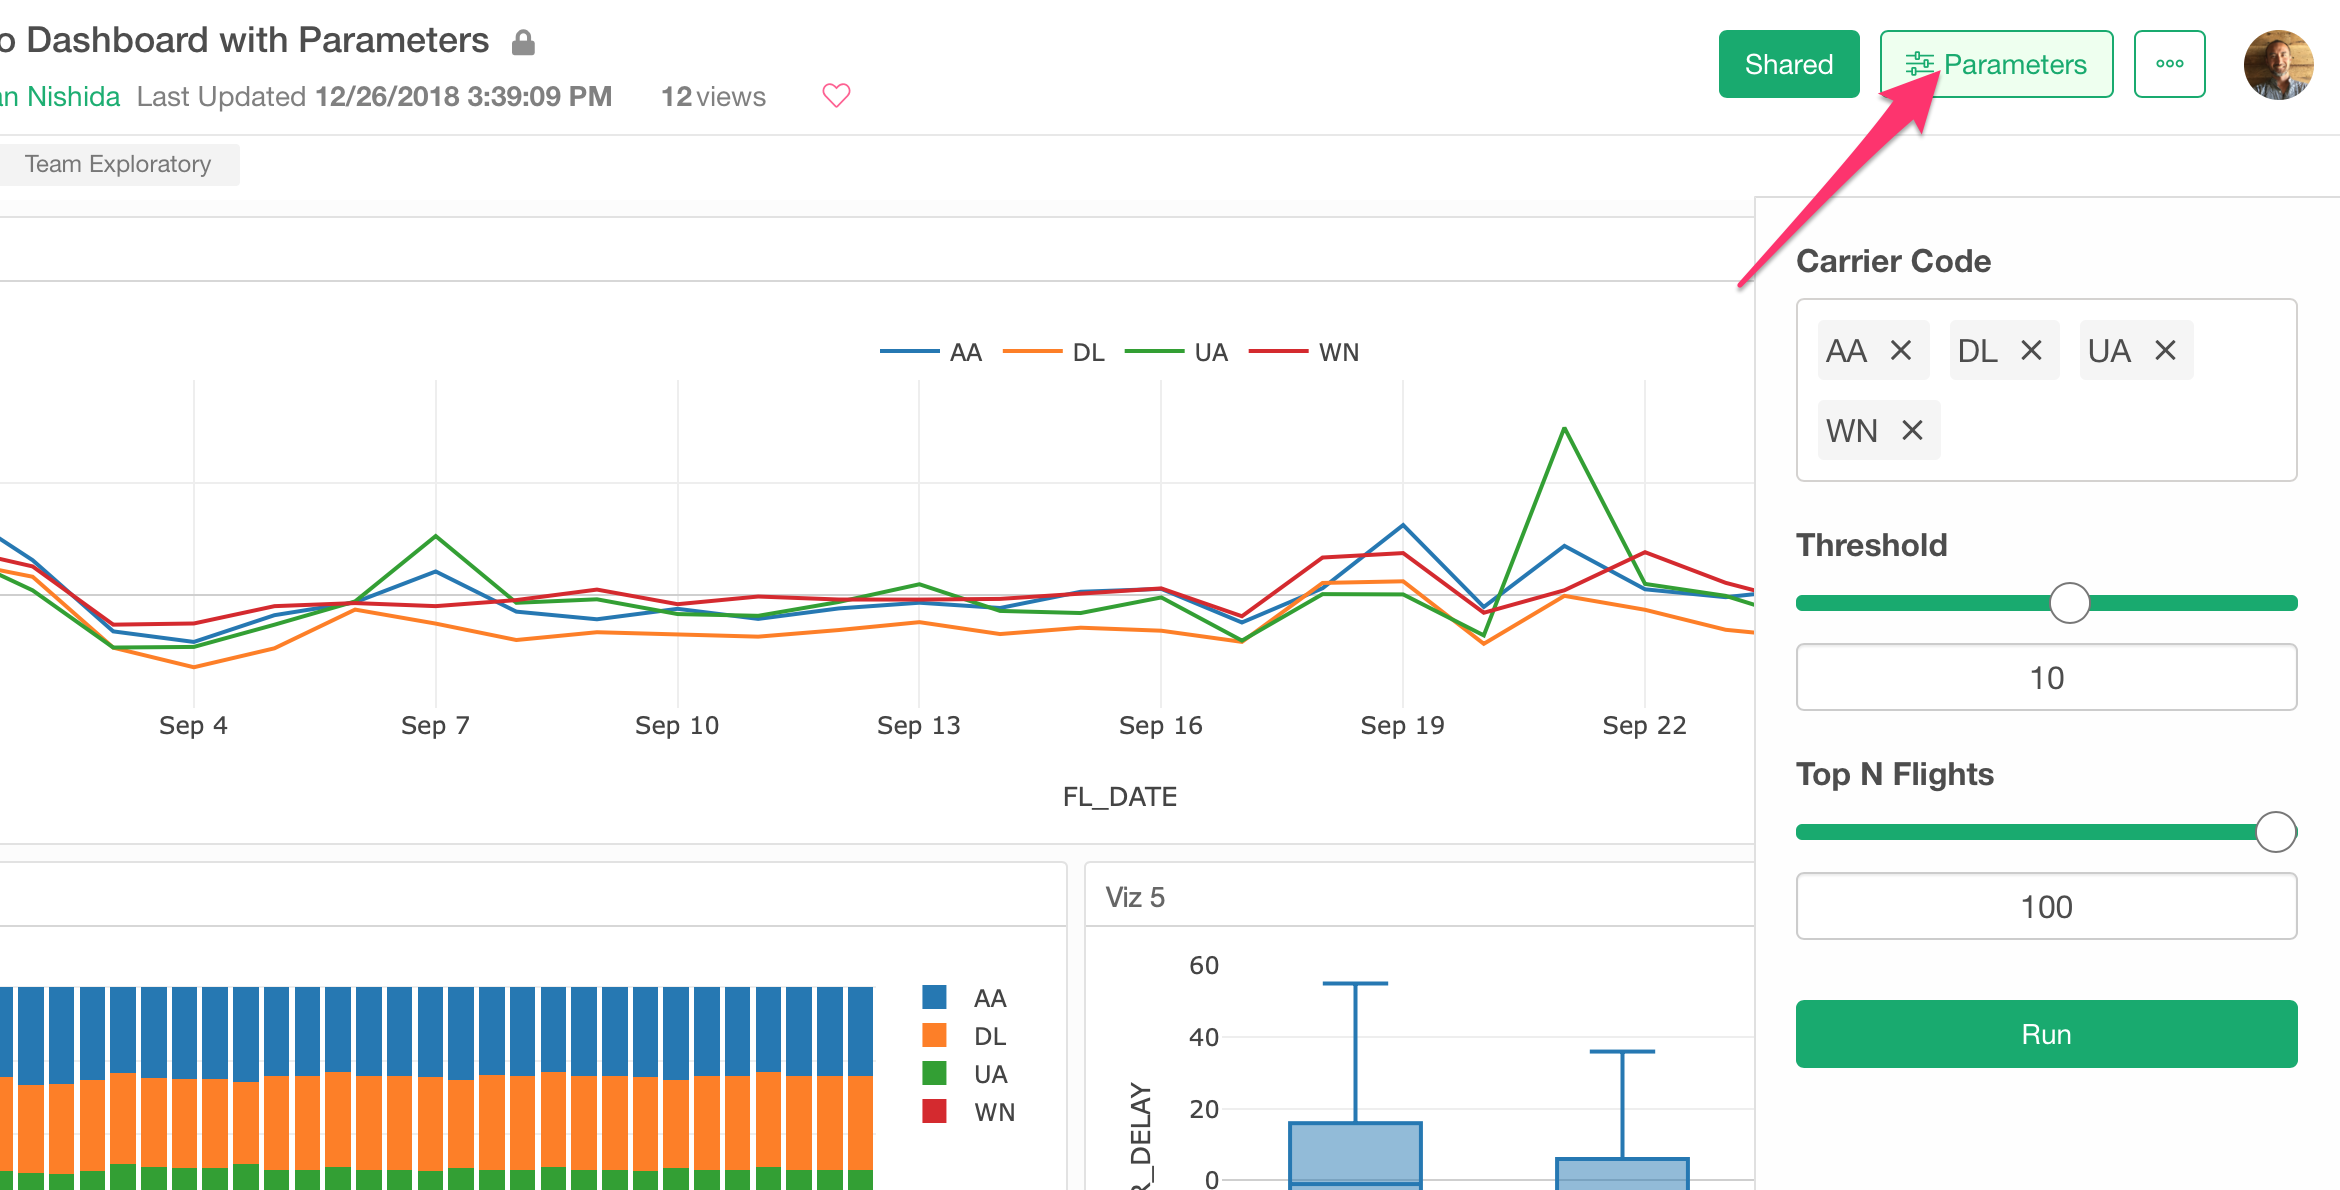
People with ‘Can Run’ permission will see a parameter button in the shared Dashboard.
And open the parameter pane to change the parameter valeus and click on ‘Run’ button.
The initial running will try to connect to the server instance, which might take a bit of time.
Once it’s connected, then you can change the parameter values and expect a decent response time depending on the amount of the processing that is required by the change of the parameter values.
That’s the basic of how the Parameter works in Exploratory.
Now, there are a lot more things you can do with the Parameter.
Let’s take a look.
Parameter Types
These are the types of parameters that are currently supported.
- Character
- Numeric
- Date / Time
1. Character Type
You can make this parameter type presented as Text Input, Single Value Select, Multiple Values Select.
Text Input
Single Value Select
Multiple Values Select
2. Number Type
You can make this parameter type presented as Text Input or Slider.
Slider
You can select ‘Slider’ as Input Type.
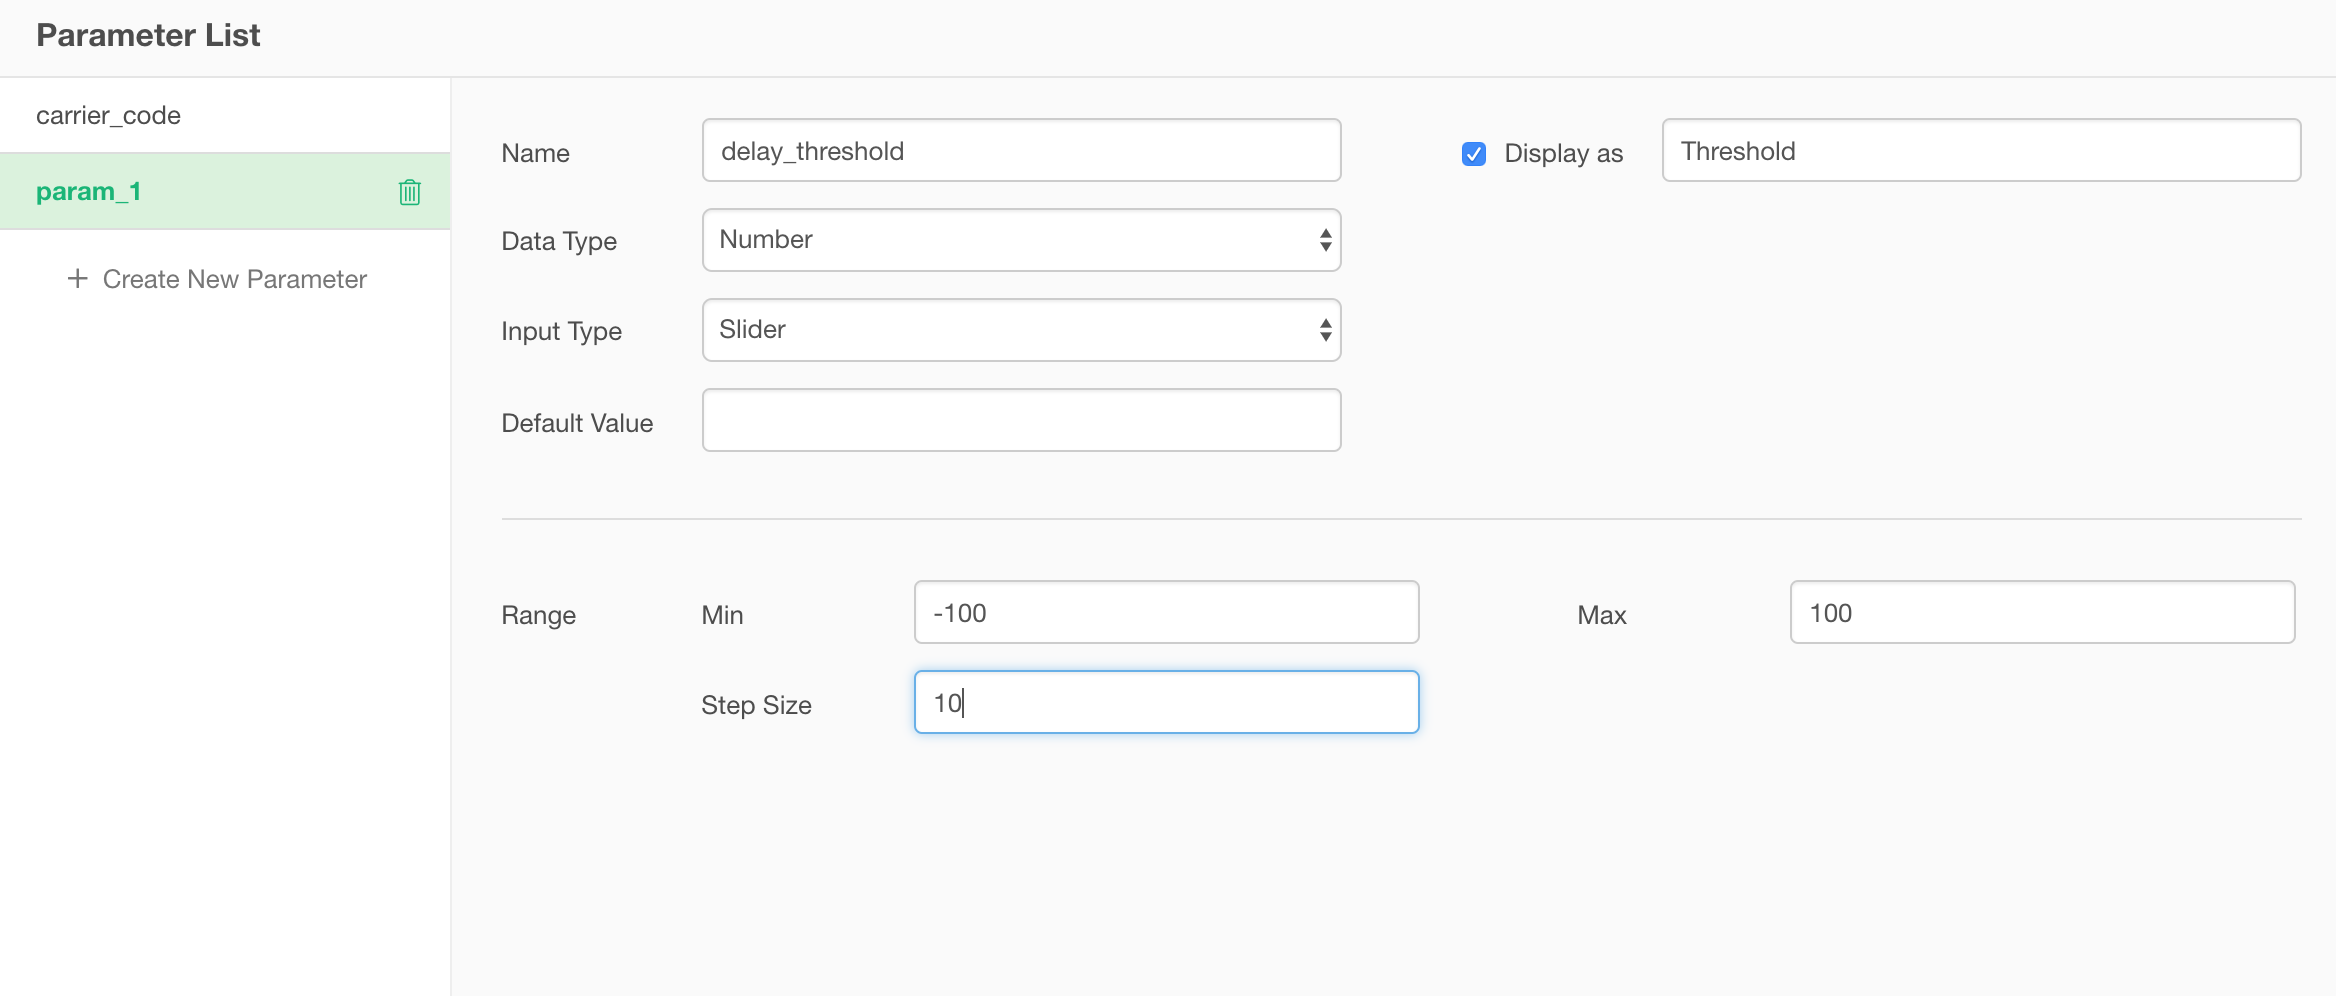
You want to set the min and the max values. You can also set the skip (or incremental) size to decide how moving the slider increase or decrease the values.
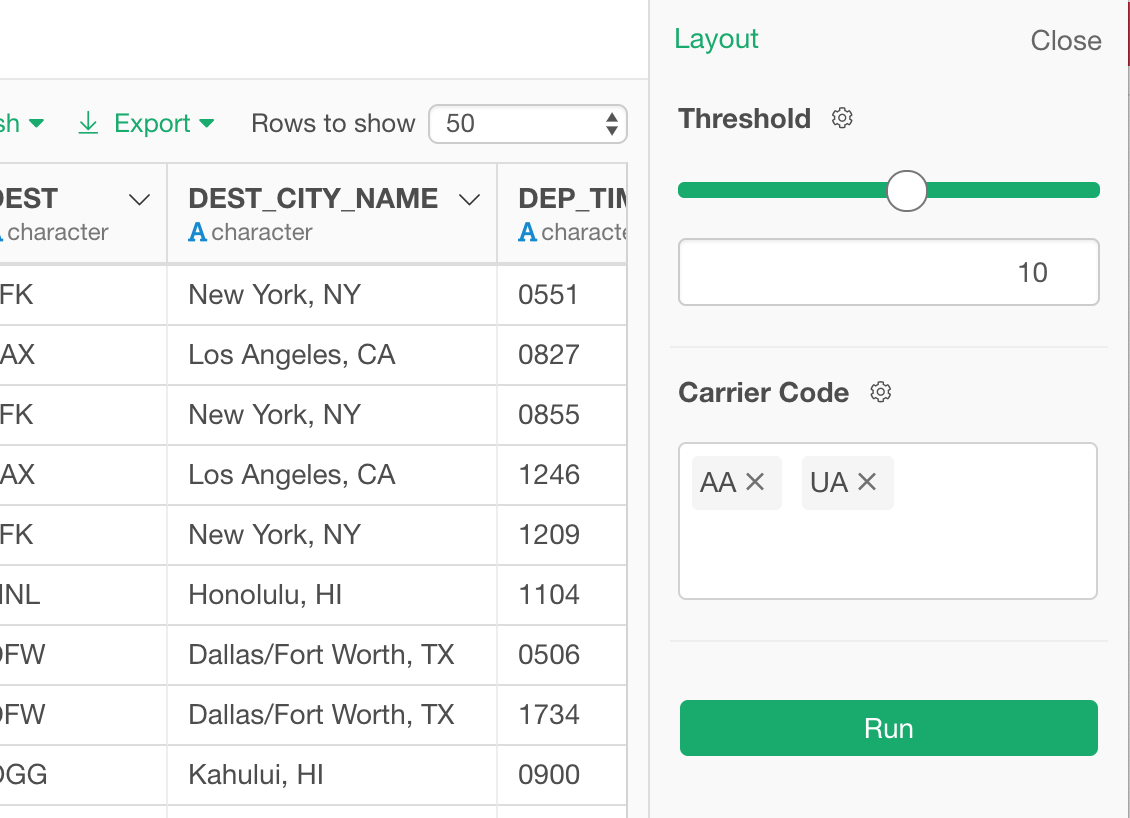
Here is how the Slider looks at the runtime.
3. Date / Time Type
Parameter Pane Layout
You can configure the parameter pane layout by clicking on ‘Layout’ button at the left-hand side top.
In the Layout Edit mode, you can change the order of the parameters and set whether you want to hide or show the parameters.
1. Change the Order
You can drag and drop to change the order of the parameters listed in the parameter pane.
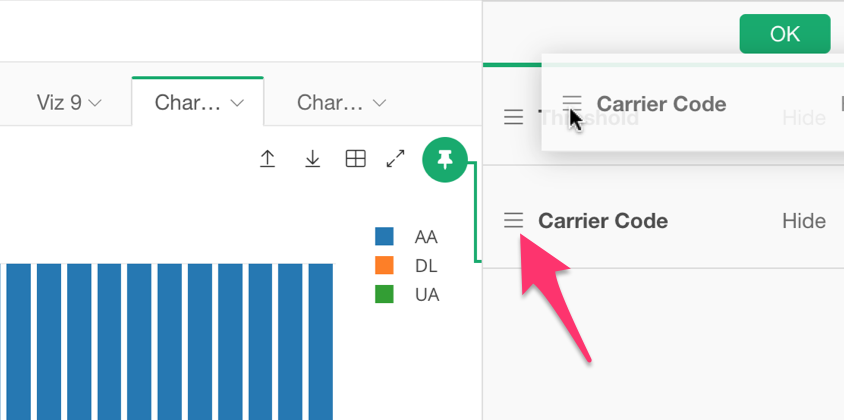
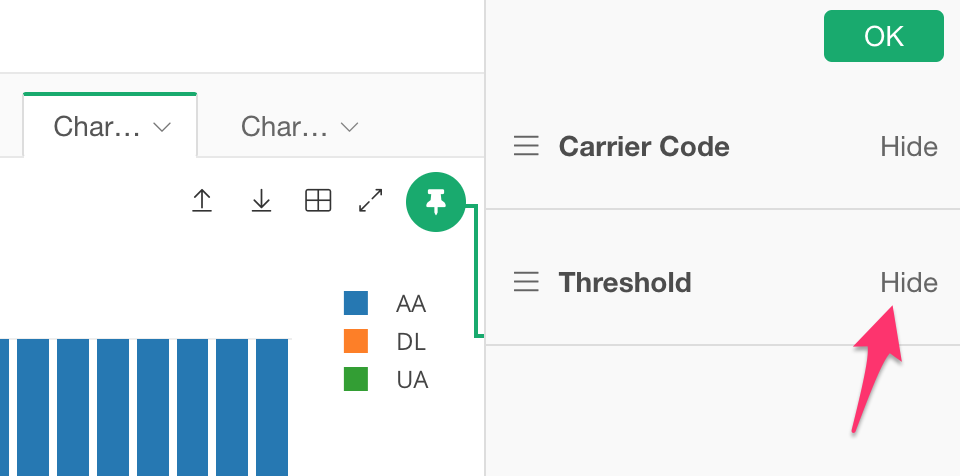
2. Hide the Parameters
You can hide certain parameters from being shown in the parameter pane. This would be useful when you want to set a pre-defined value that only you should see, such as password, API key, etc.
Where Can I Use Parameters?
There are two ways to use the parameter.
One is to use it to setup. For example, you might want to set the parameter in Filter step, Mutate step, SQL queries, etc.
Another is to use it to interact. For example, you or others might want to interact with Dashboard, Note, etc. to get the data dynamically updated by changing the parameter values.
Use to Setup
You can use the parameter by typing the parameter name with the following syntaxt.
@{parameter_name}This parameter name is the one you set as Name, not the Display Name.
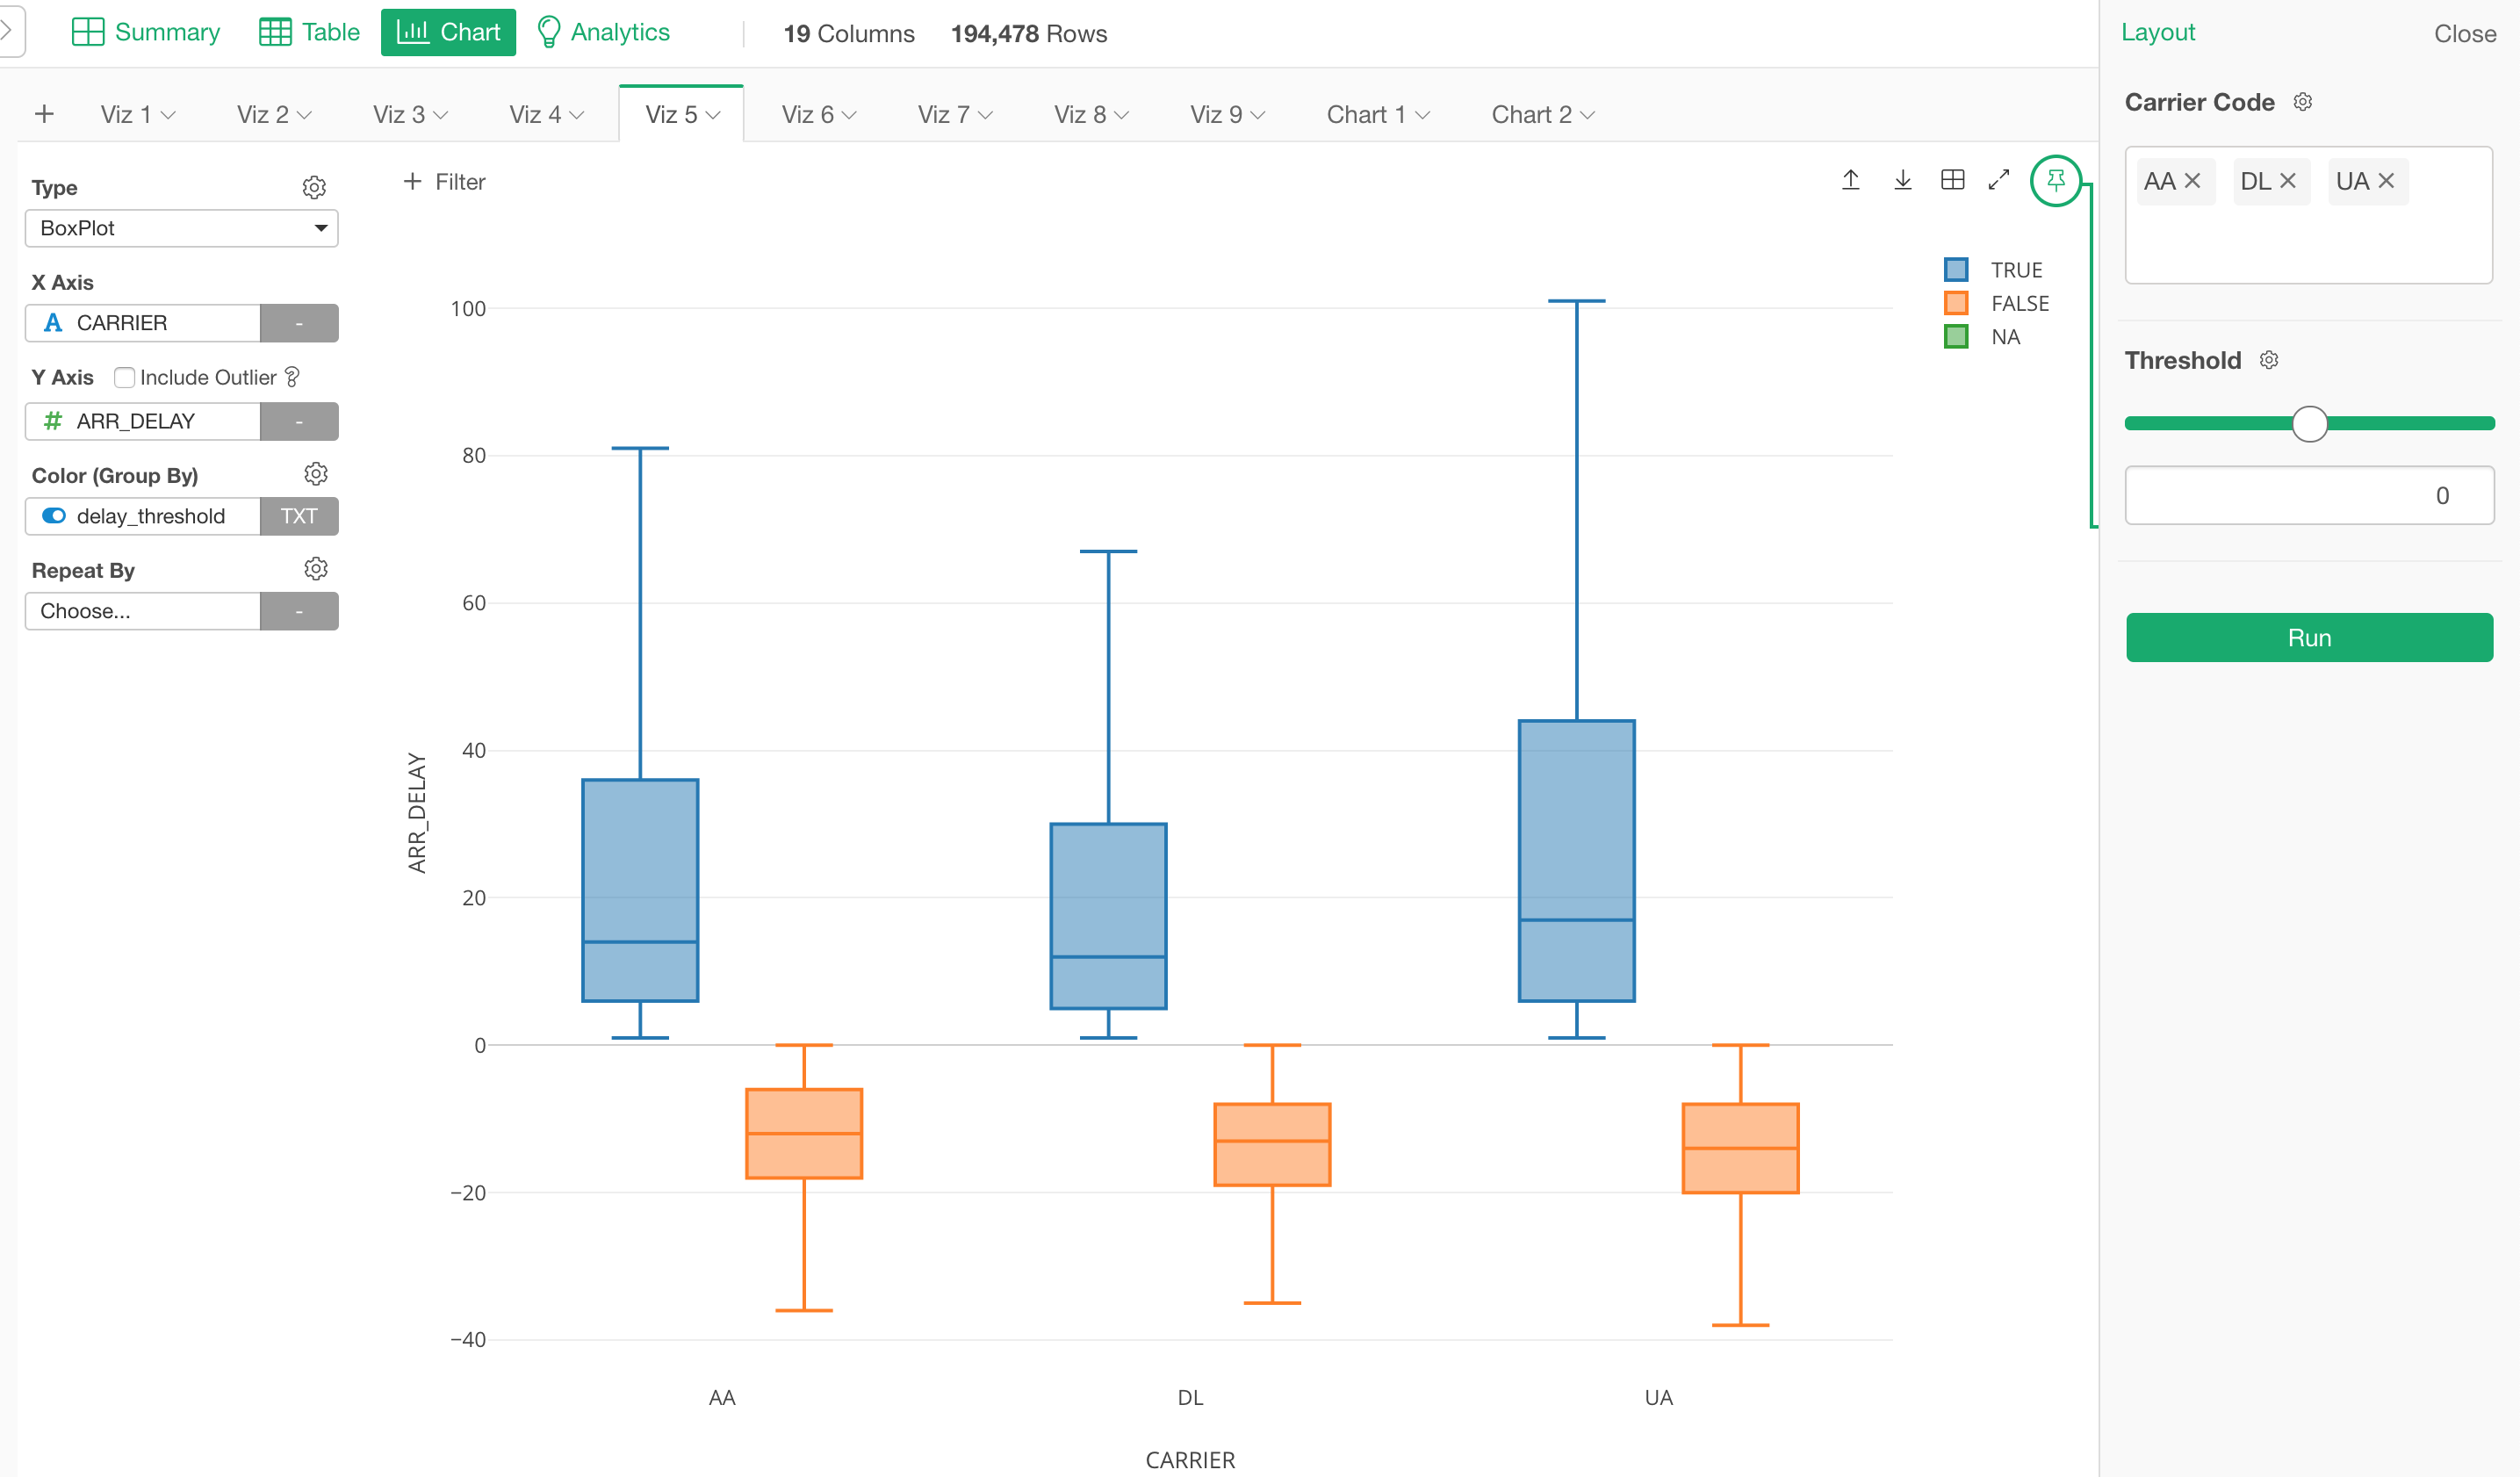
Filter
In the Filter dialog, select a parameter from the parameter list.
By running the Filter step, you can see the data including only ‘AA’ and ‘DL’.
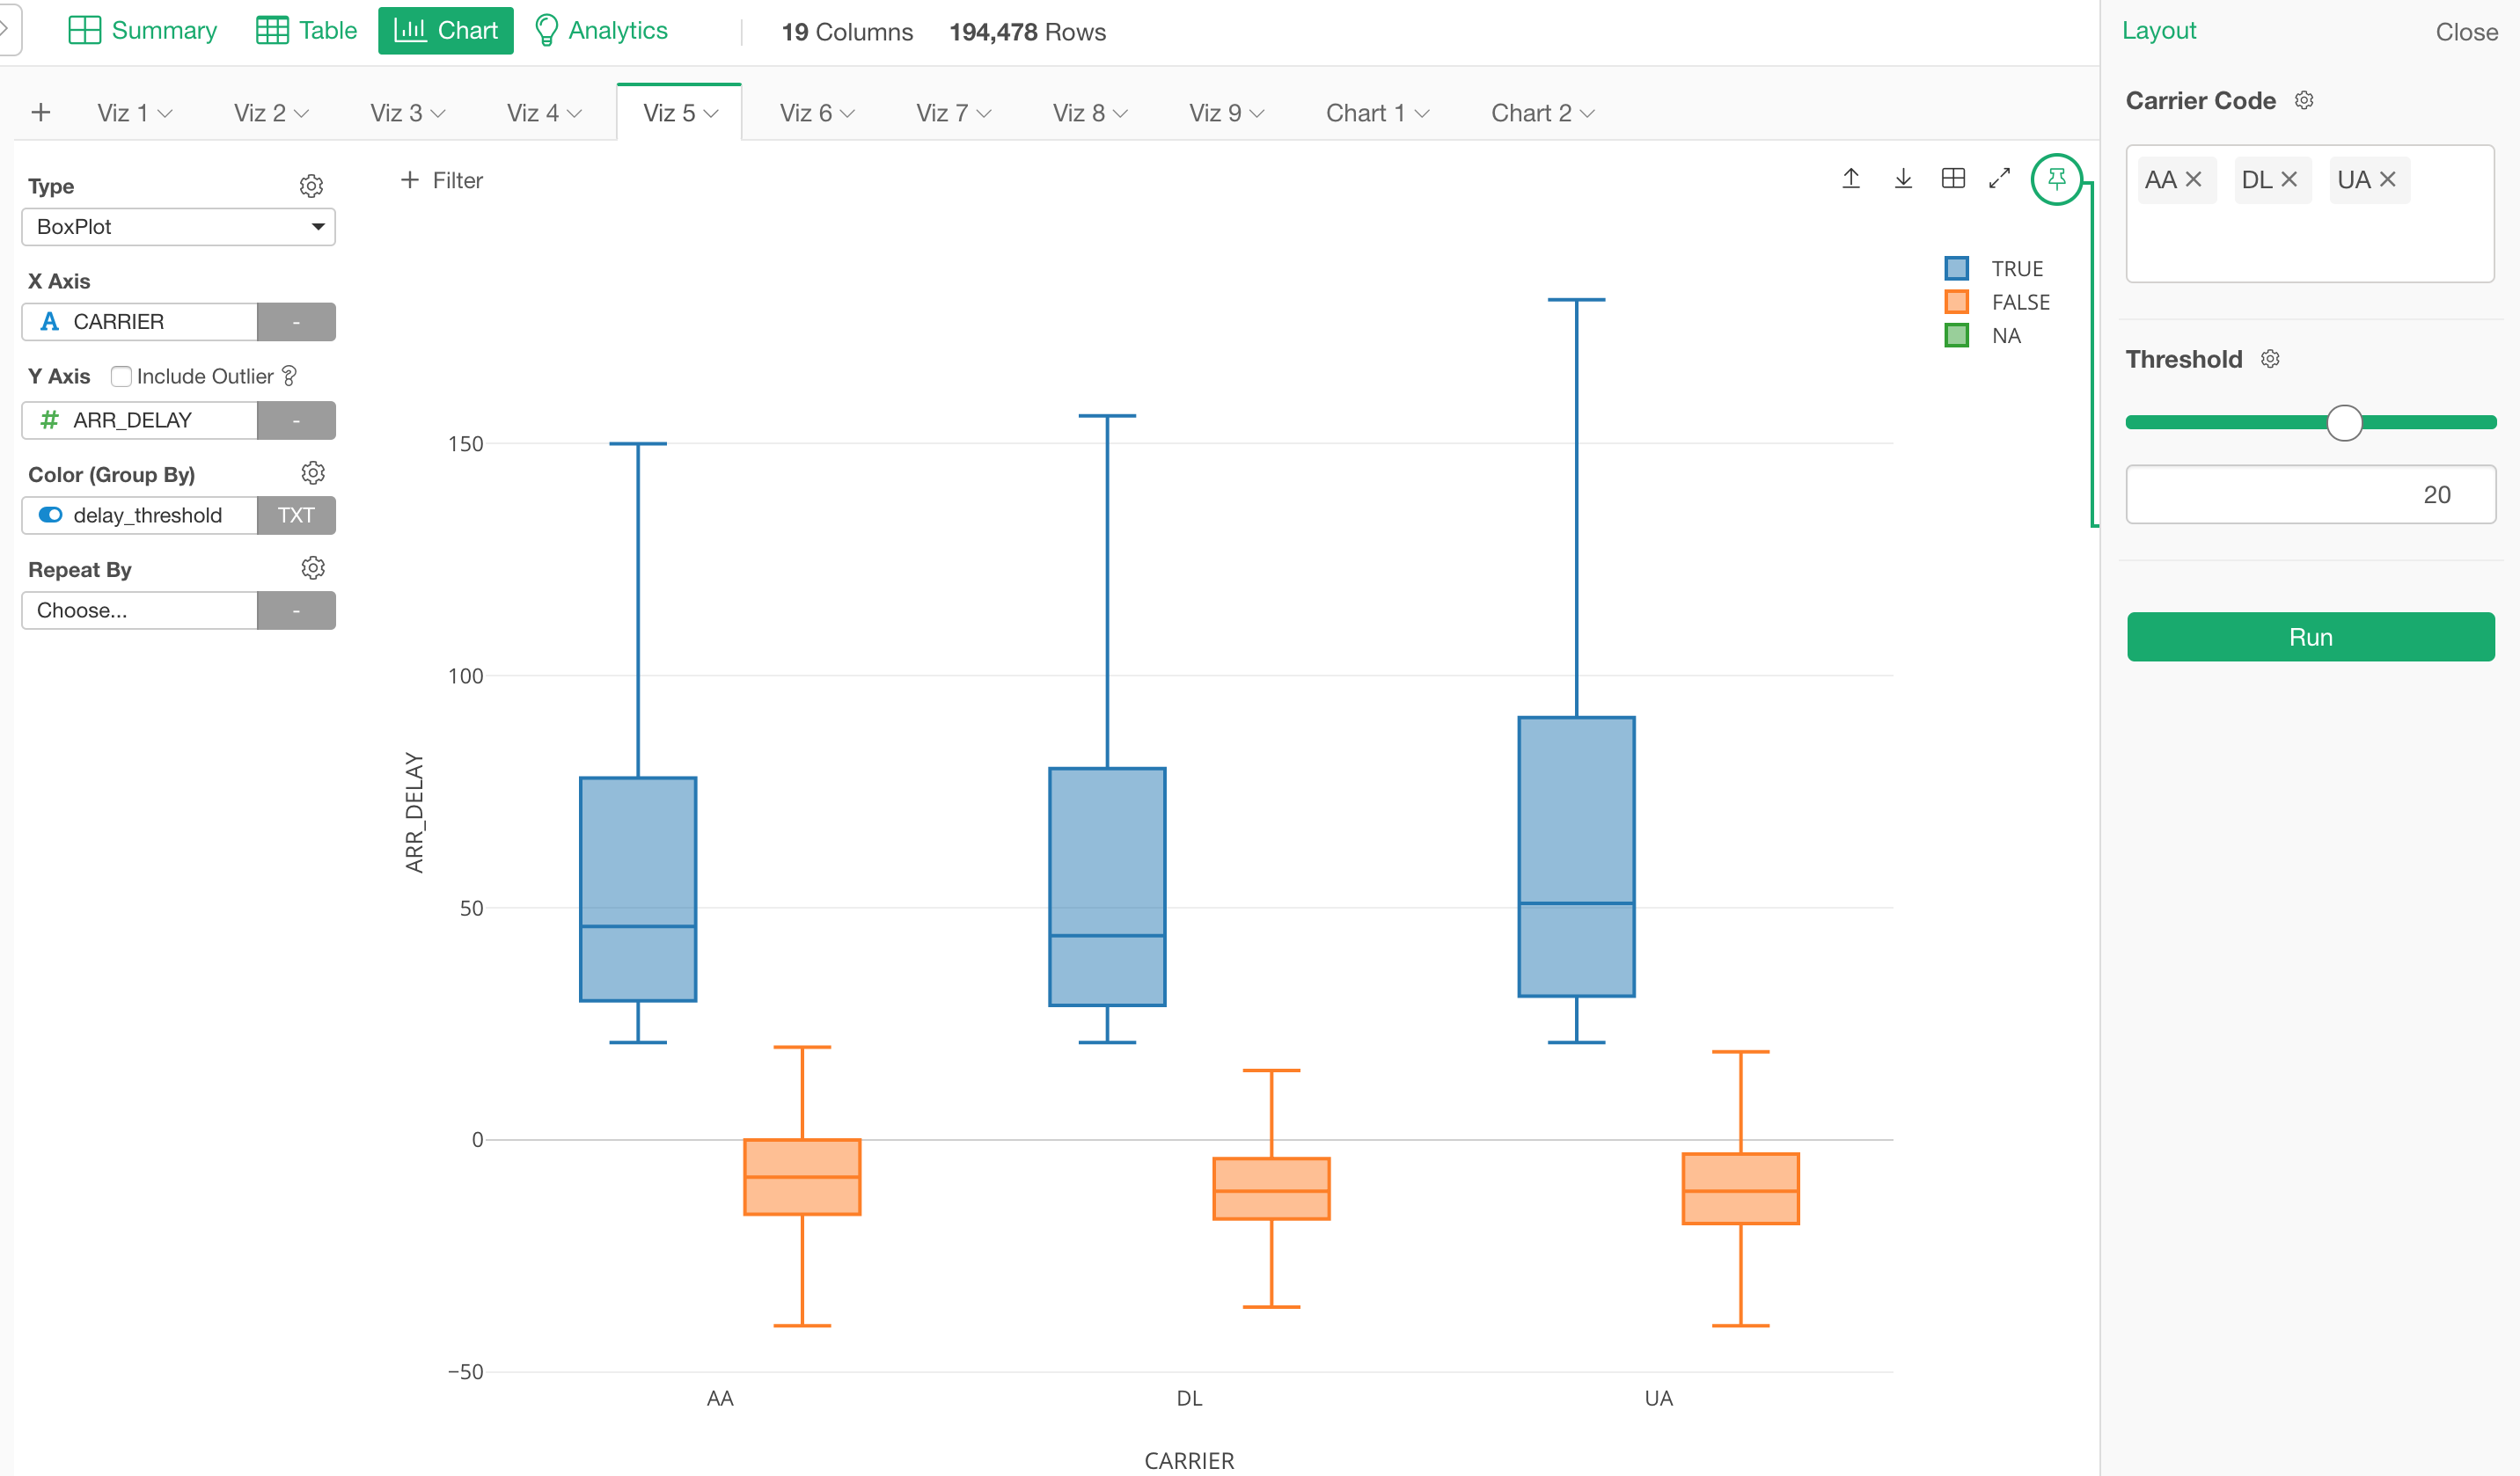
Mutate
Typing ‘@{’ will show you a list of the parameters.
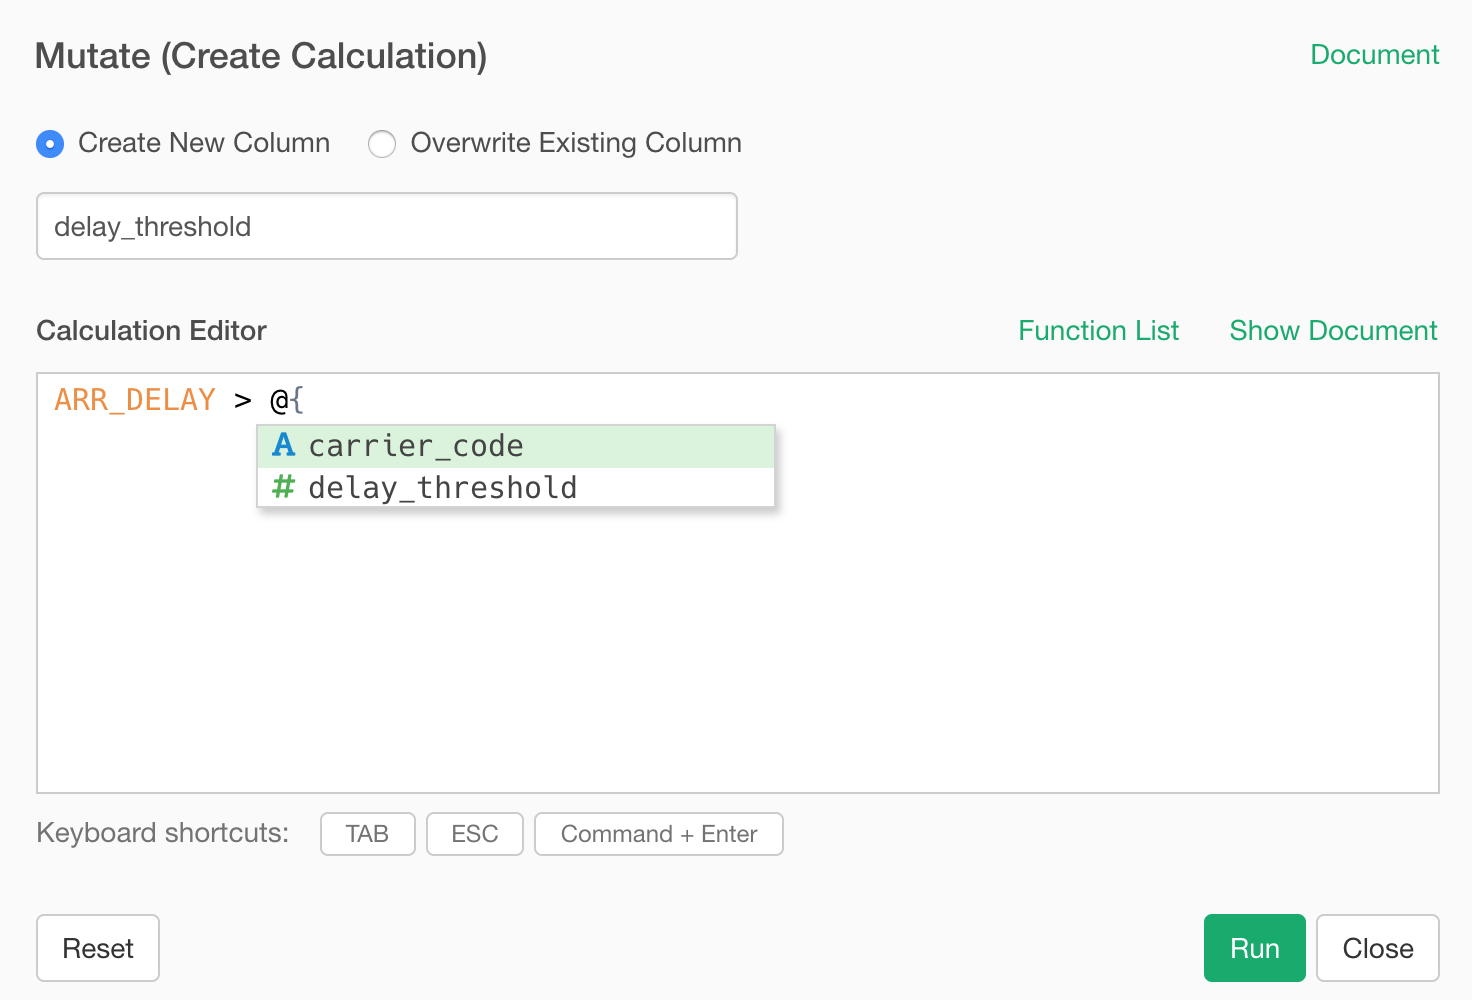
By changing the threshold to 20, the max values of the orange boxplots are 20 so as the min values of the blue boxplots.
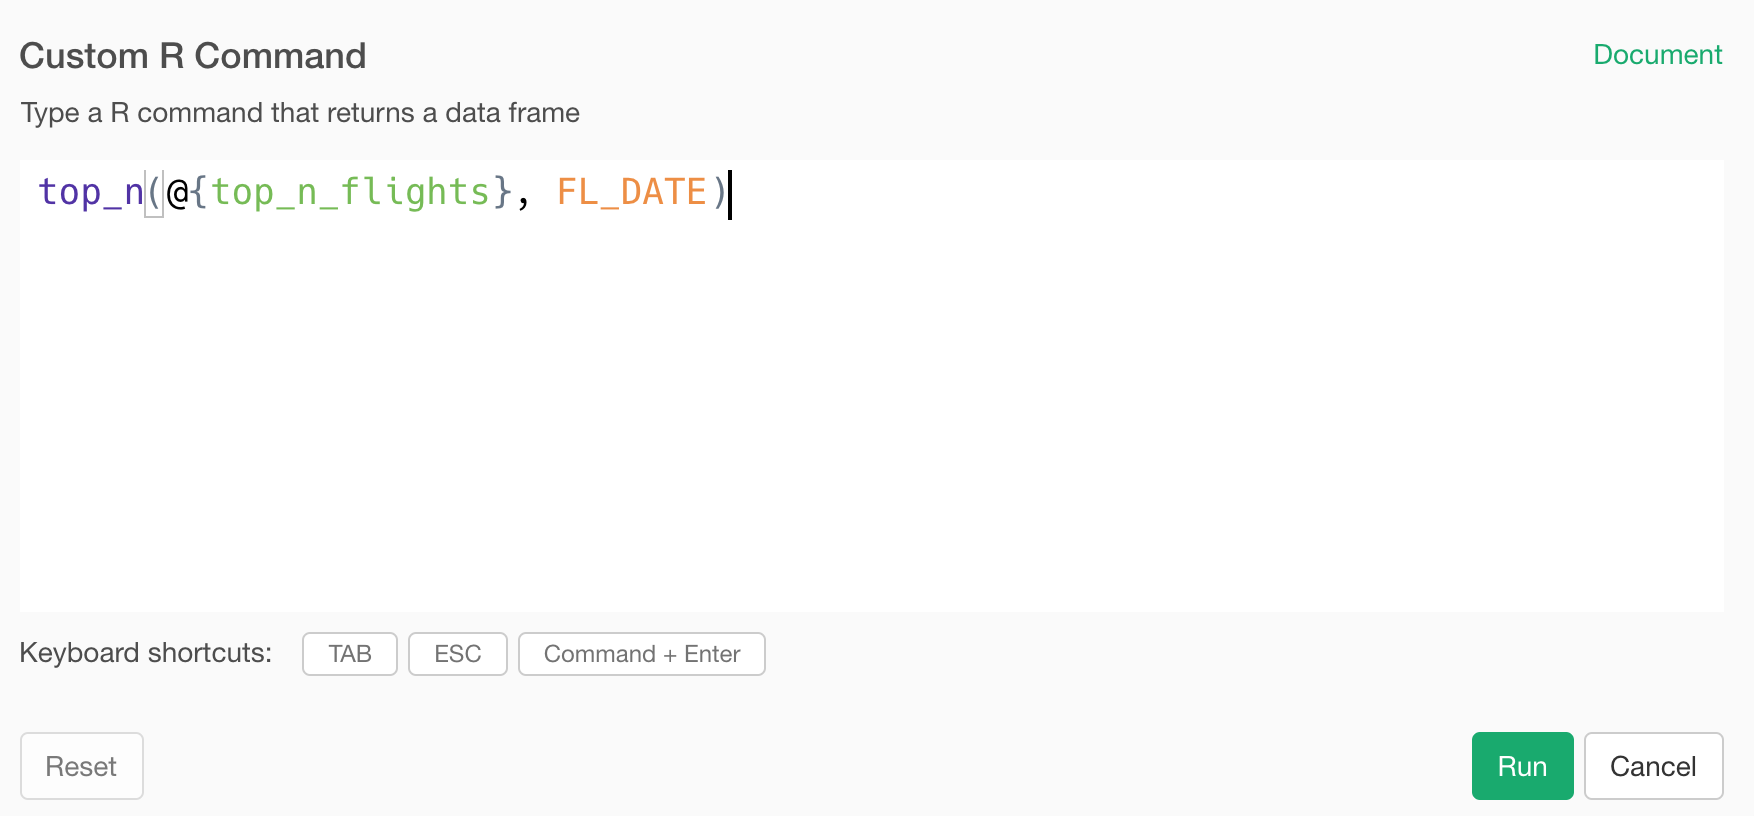
Custom R Command Step
Custom R Data Source
You can use the parameter in Custom R Script data source as well.
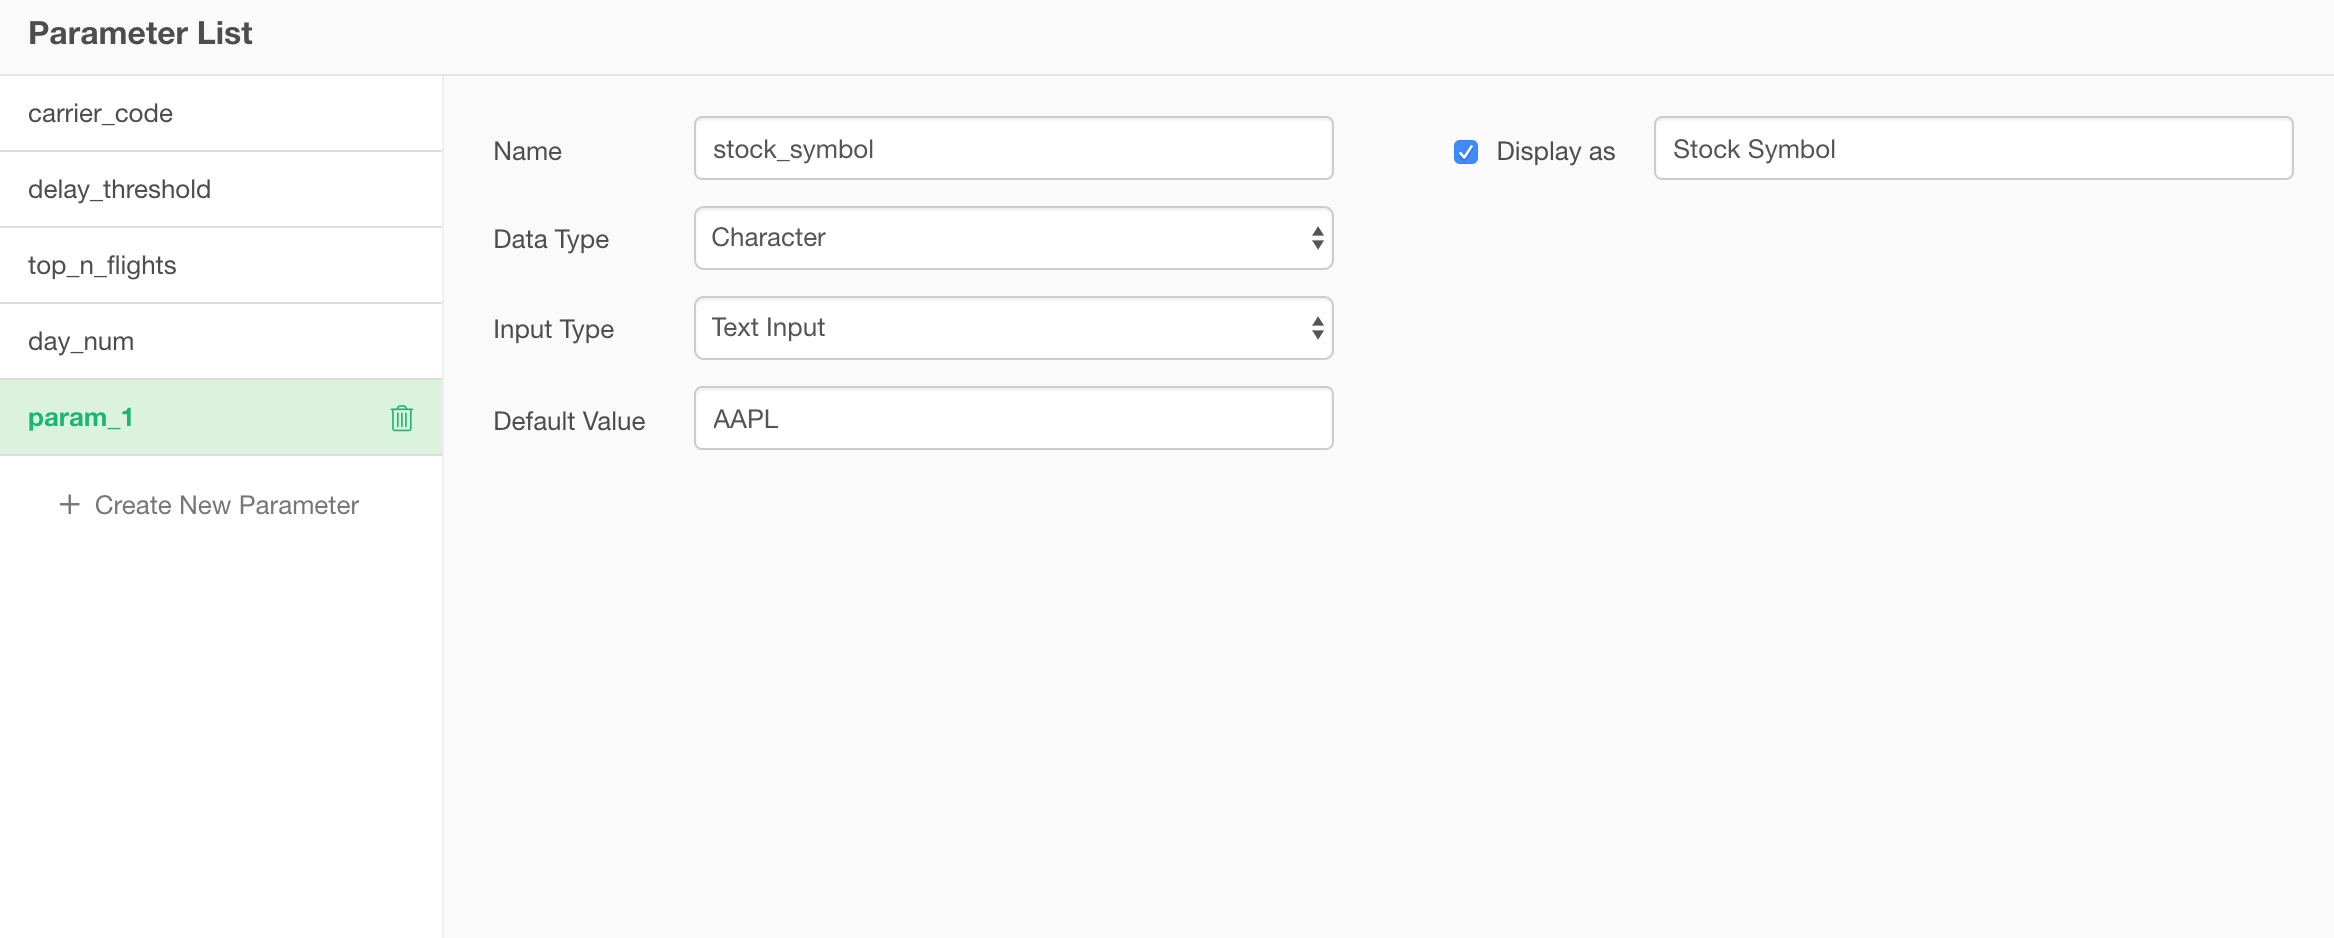
Here is an example of using ‘tidyquant’ R package to get the historical stock price data with an R script below.
library(tidyquant)

stock_prices  <- tq_get(c(@{stock_symbol}), get = "stock.prices", from = @{stock_date})
I’m using ‘stock_symbol’ parameter for binding the stock symbols. This parameter is set as ‘List of Values (Multi-Select)’ so that I can set multiple stock symbols such as GOOG (Google), AAPL (Apple), etc.
Also, I’m using ‘stock_date’ parameter for setting the date for ‘from’ argument of the function ‘tq_get’.
Here is how it looks in the Custom R Script Data Editor.
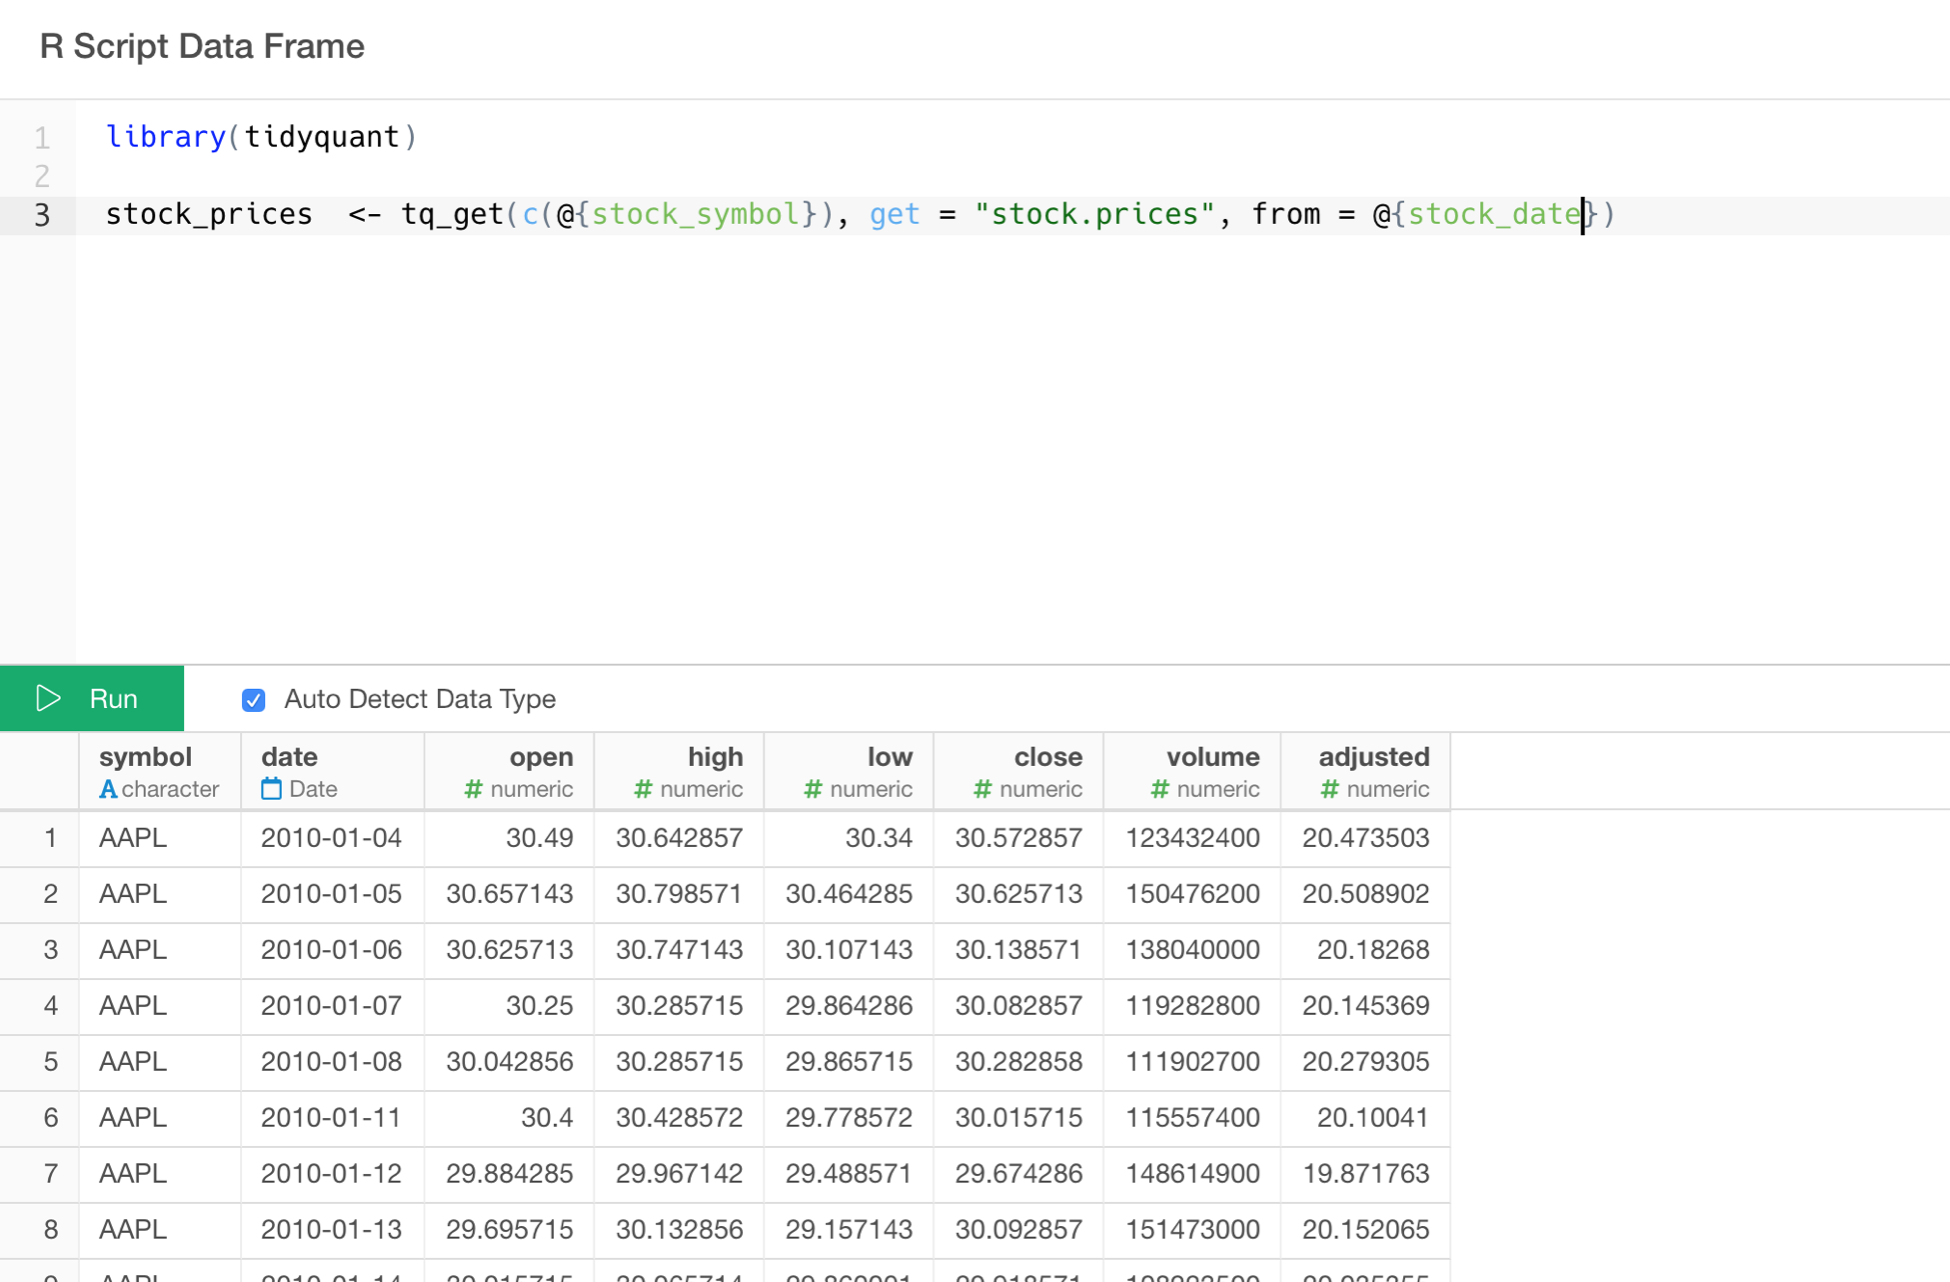
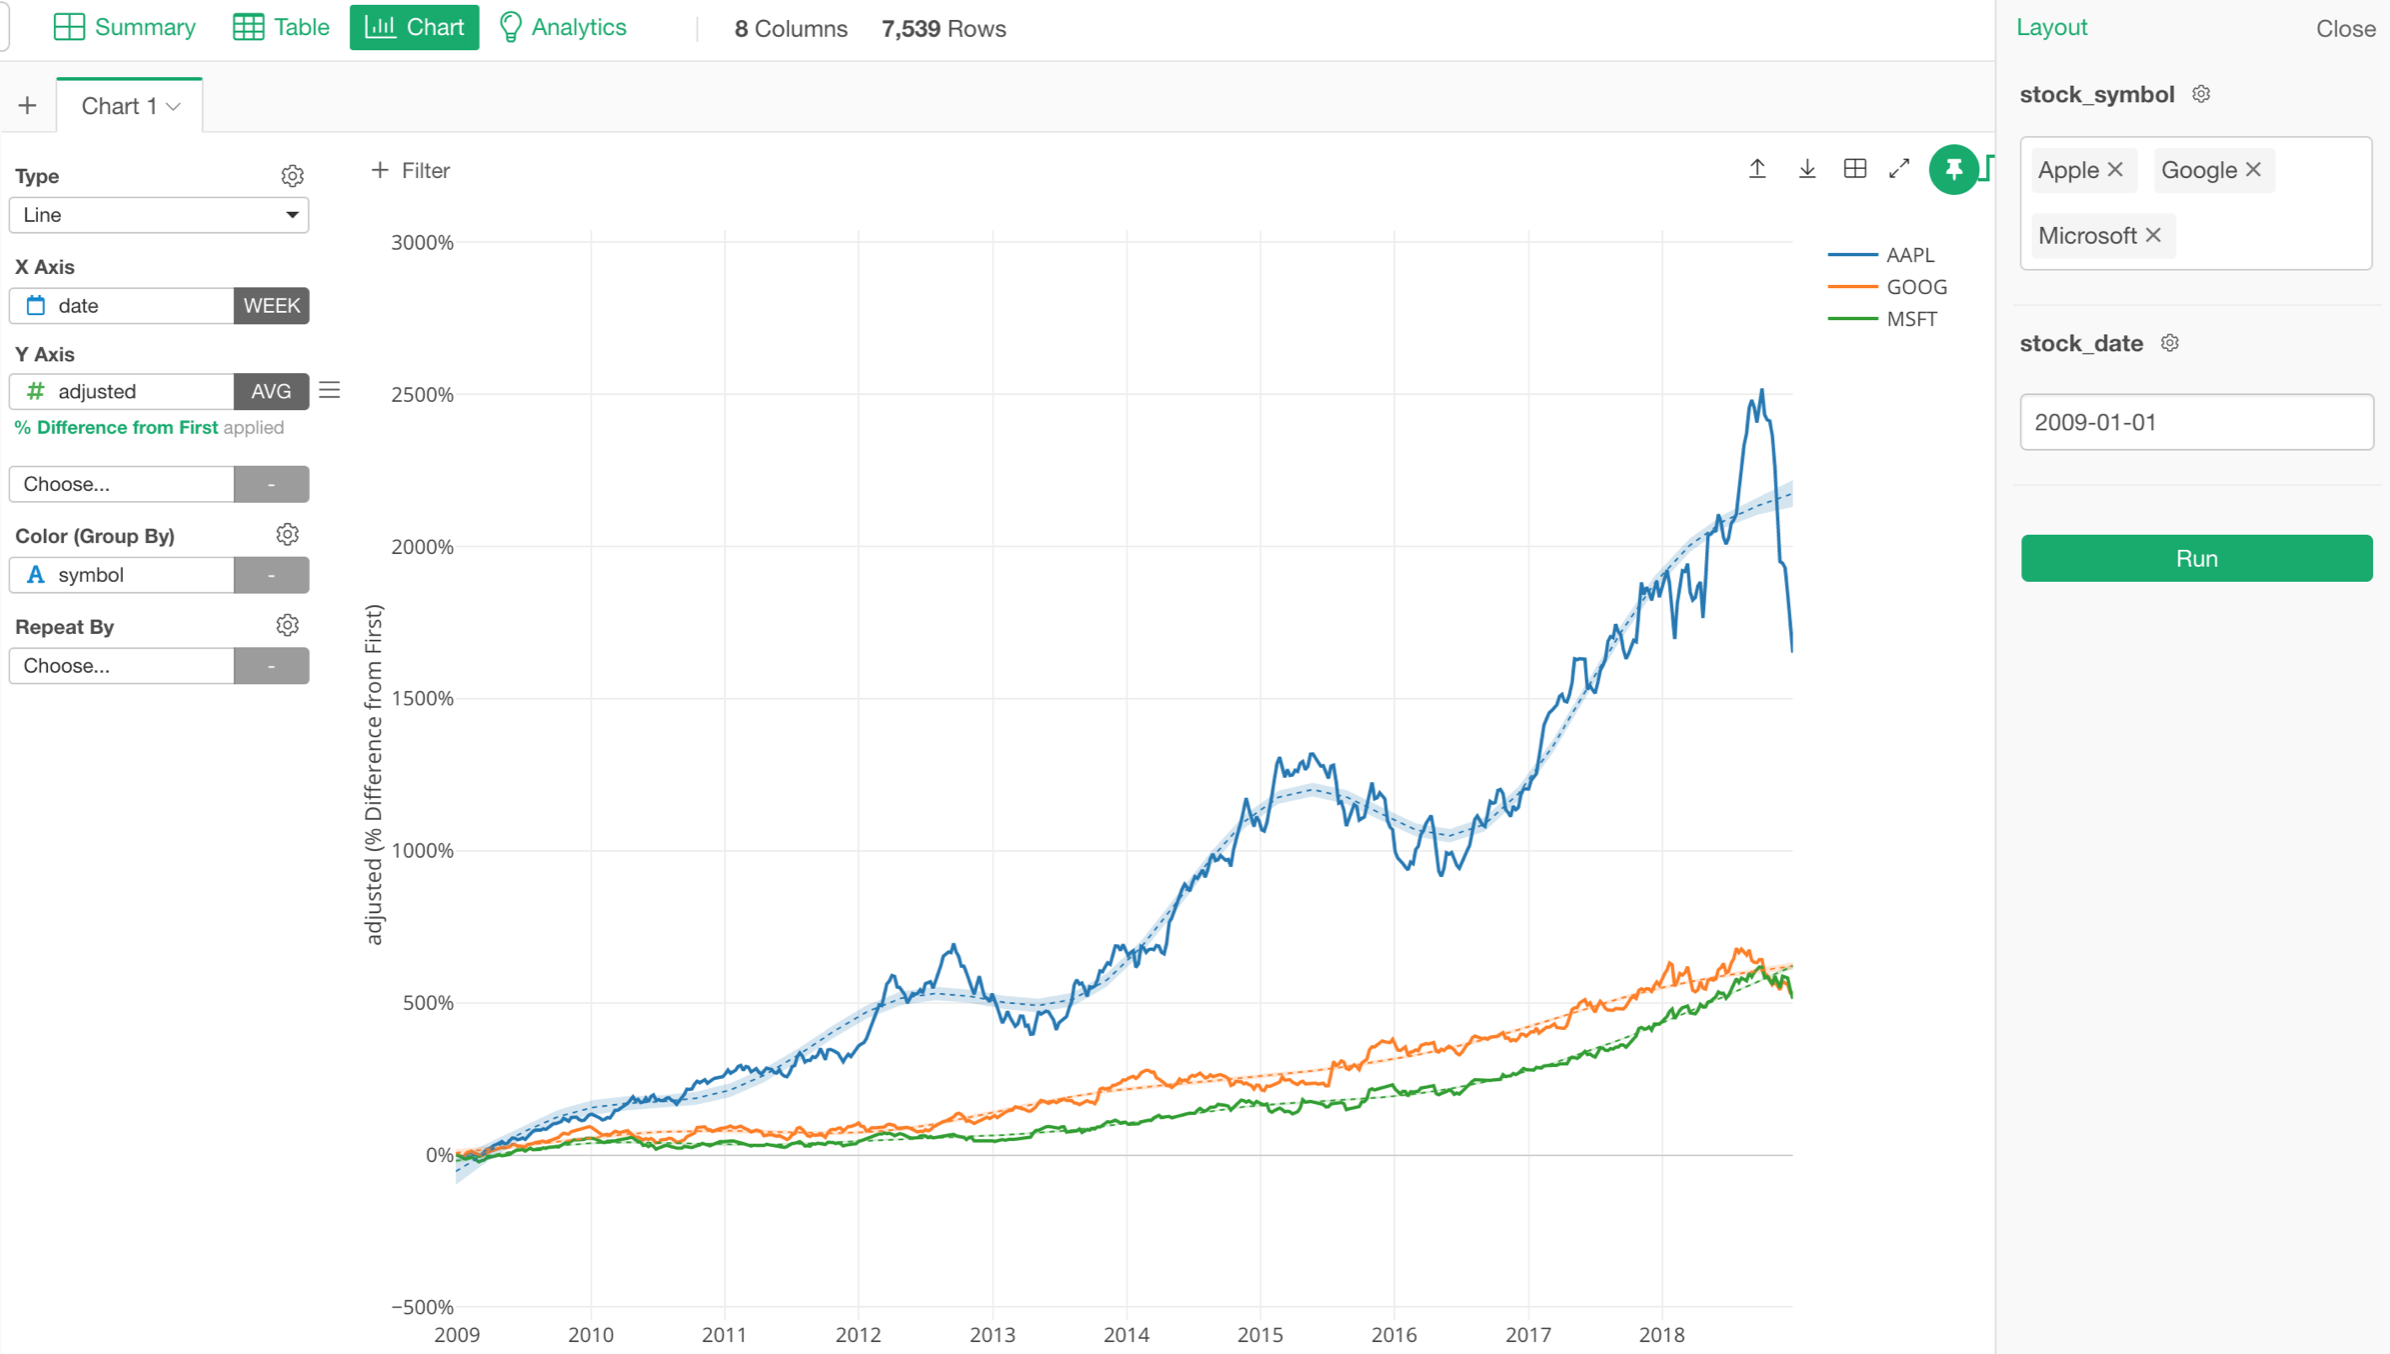
By using these two parameters, I can update the script dynamically to get the data from the data source while I’m viewing the chart.
SQL Query
This is one of my favorites. You can parameterize your SQL queries!
You can use the following parameter syntax to embed the parameters inside your queries.
@{carrier_code}And your query would look like this, for example.
select * from testdb.flights
where carrier IN (@{carrier_code})
and day_of_month >= @{day_num}
And here is how it looks with a SQL query for getting the flight data from MySQL database.
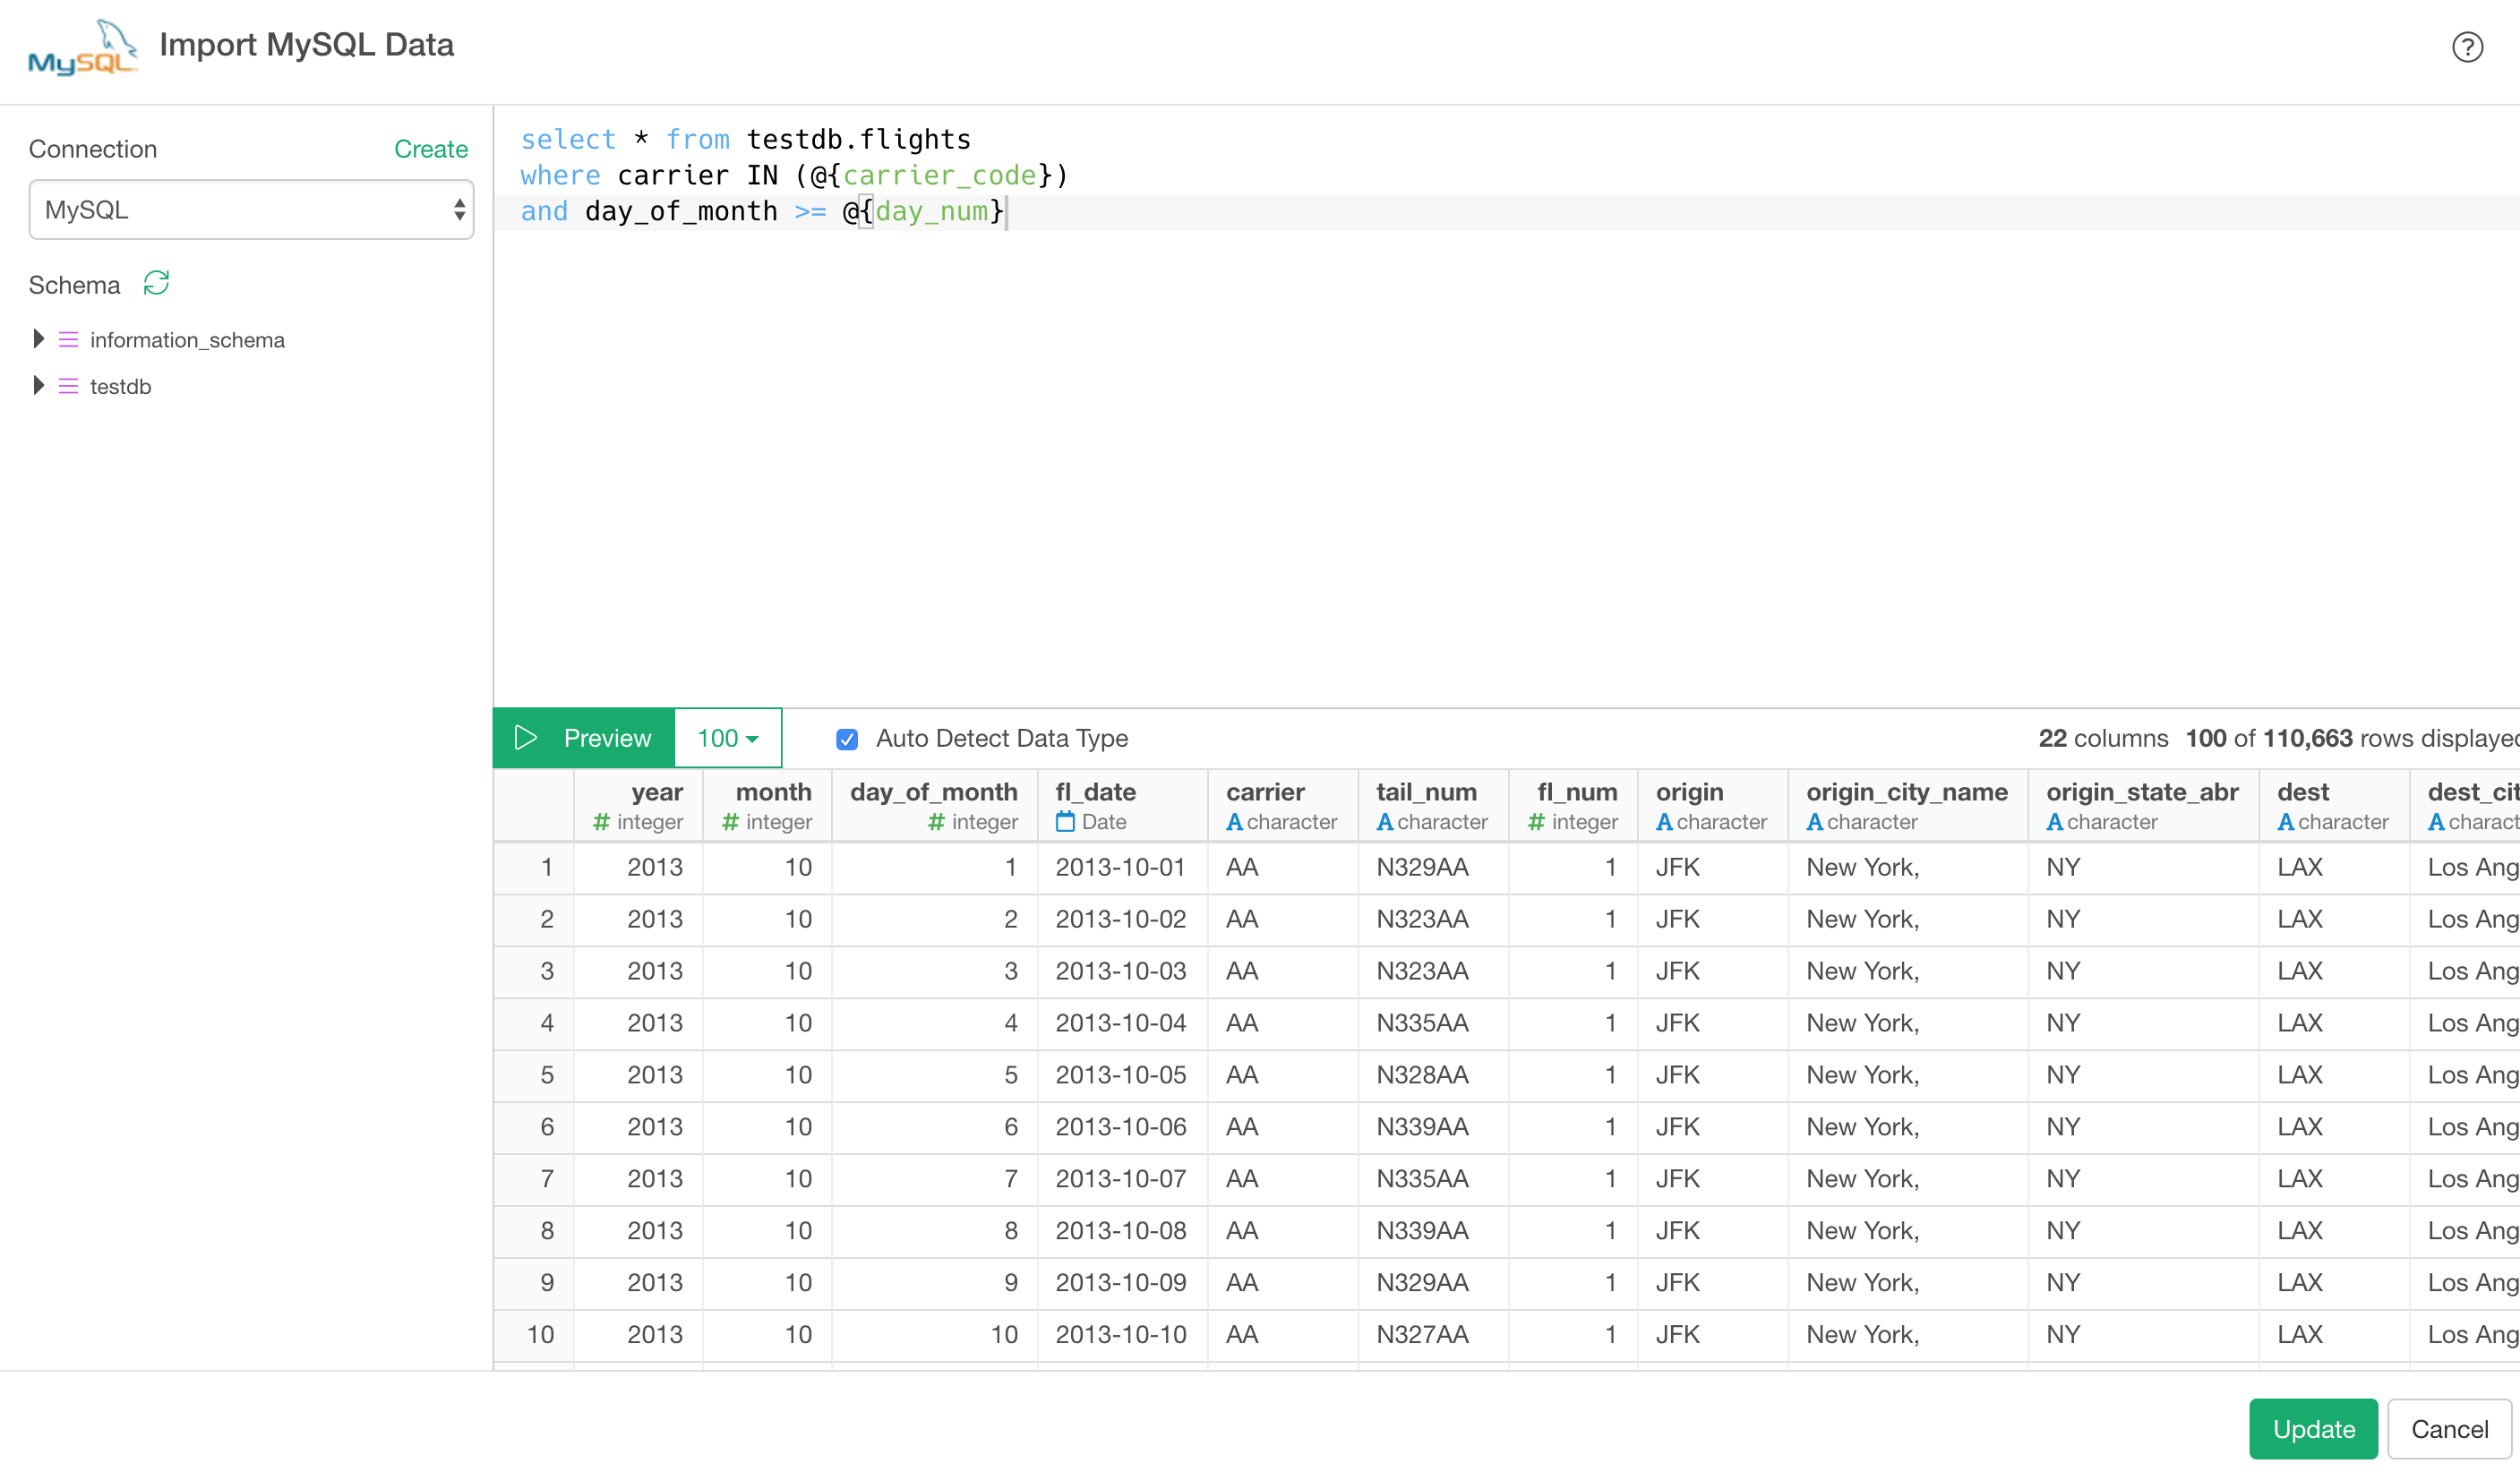
Once you import the data, then you can open the parameter pane to change the parameter values. Now, you are updating the query dynamically without opening the SQL editor and changing the query!
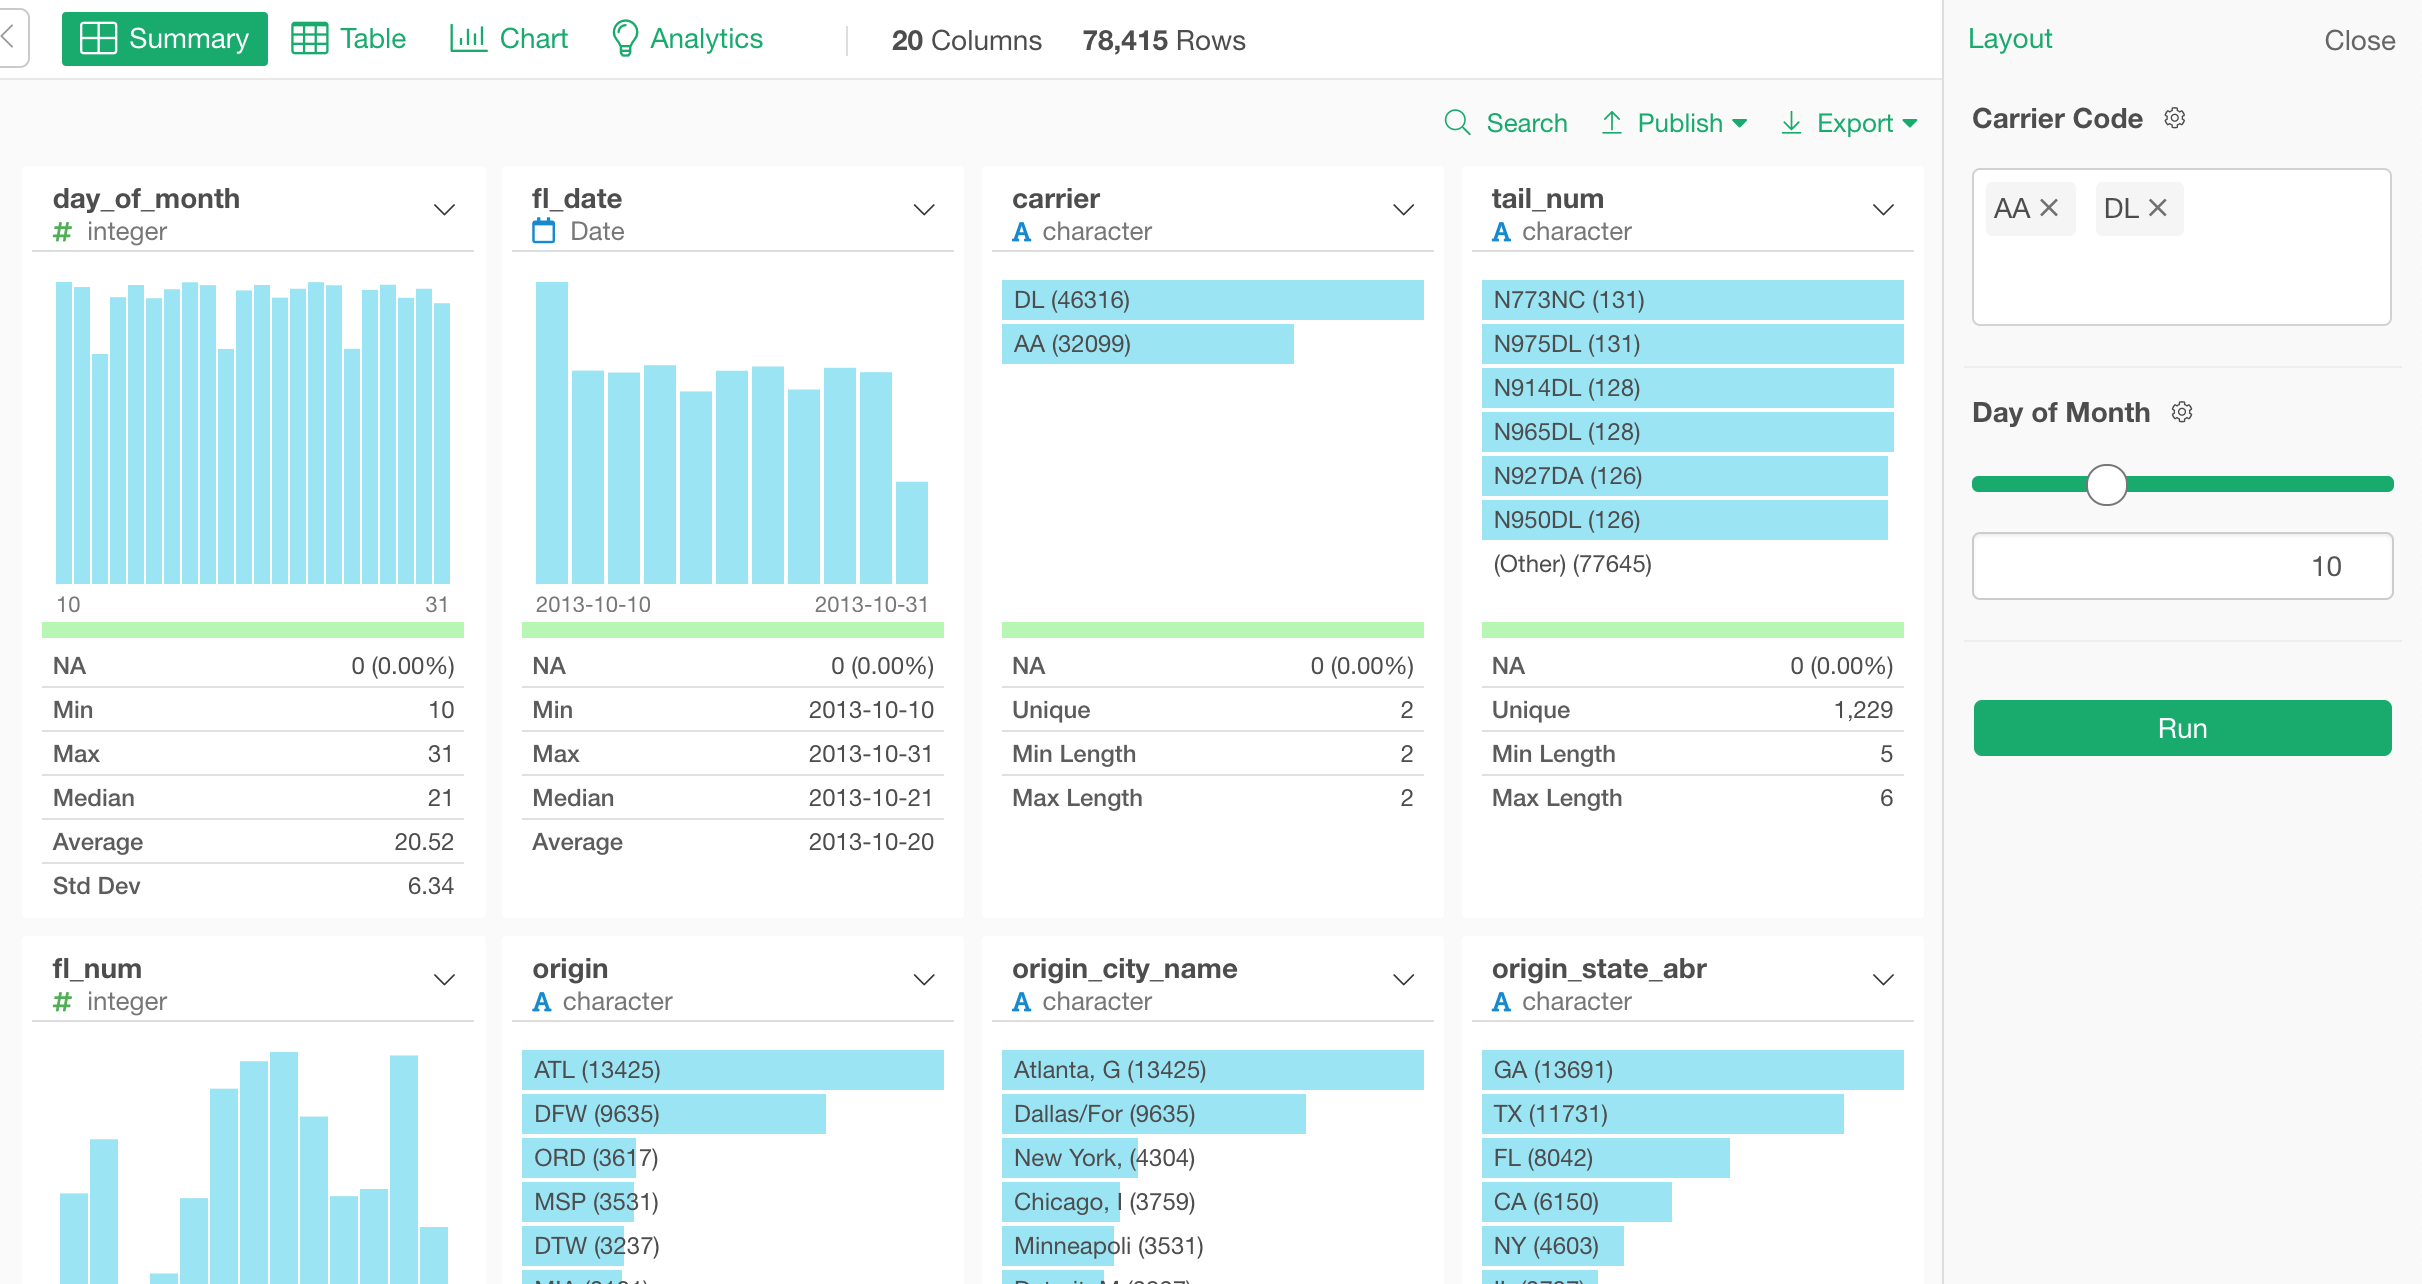
This can be super useful when you want to see the data from the databases and visualize it right away. You can just open the parameter pane while you are looking at the chart!
MongoDB
You can use the Parameter for MongoDB query as well.
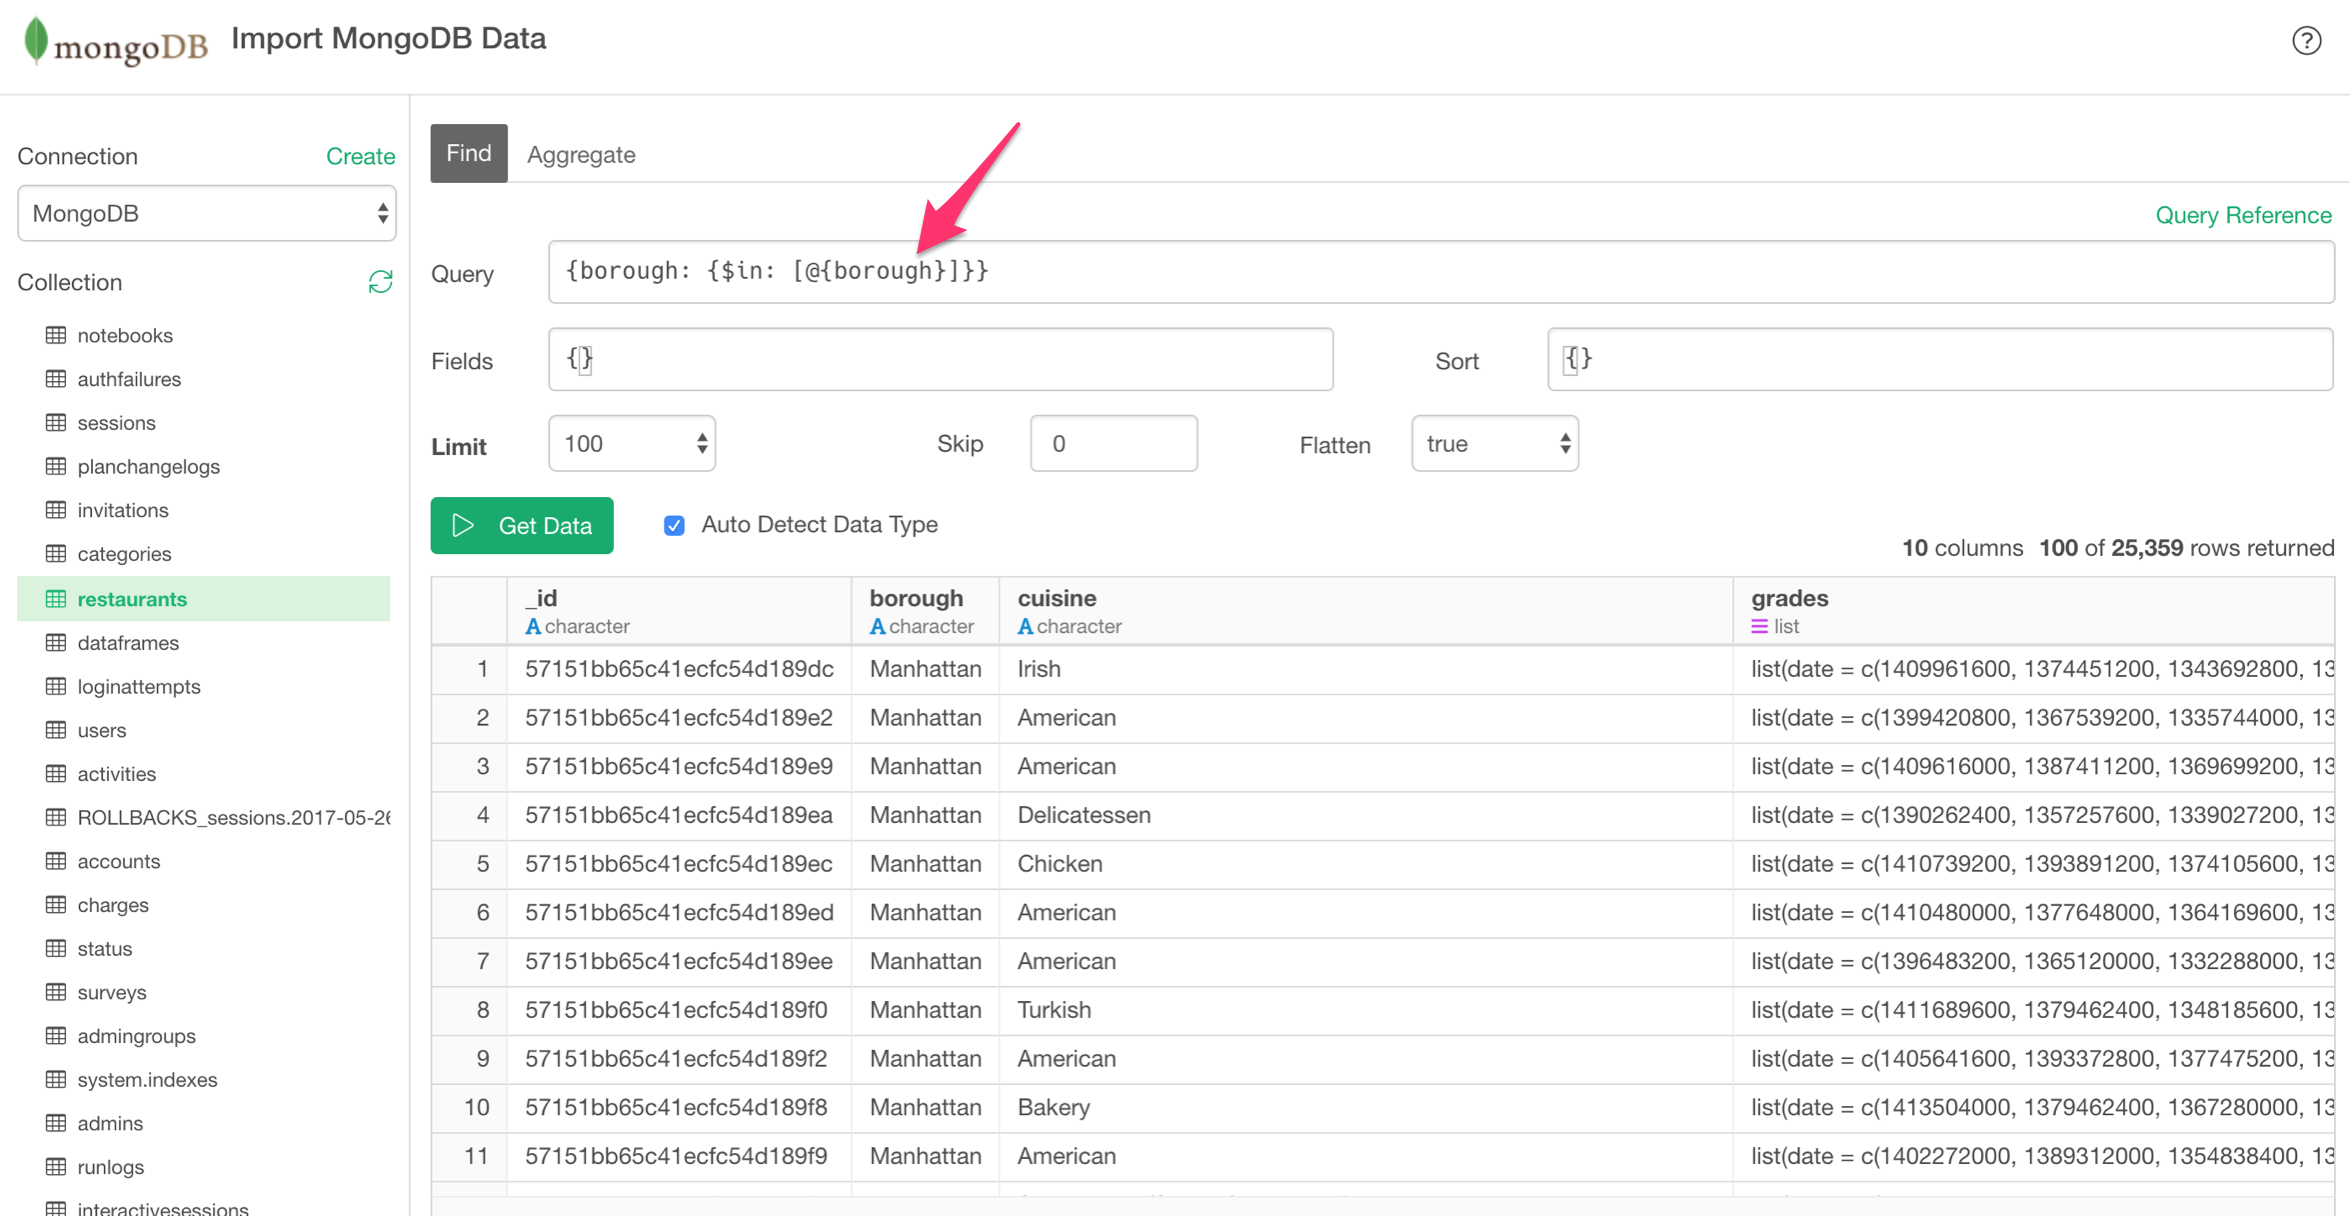
And you can dynamically update the query by changing the parameter values while you are viewing the chart (or map).
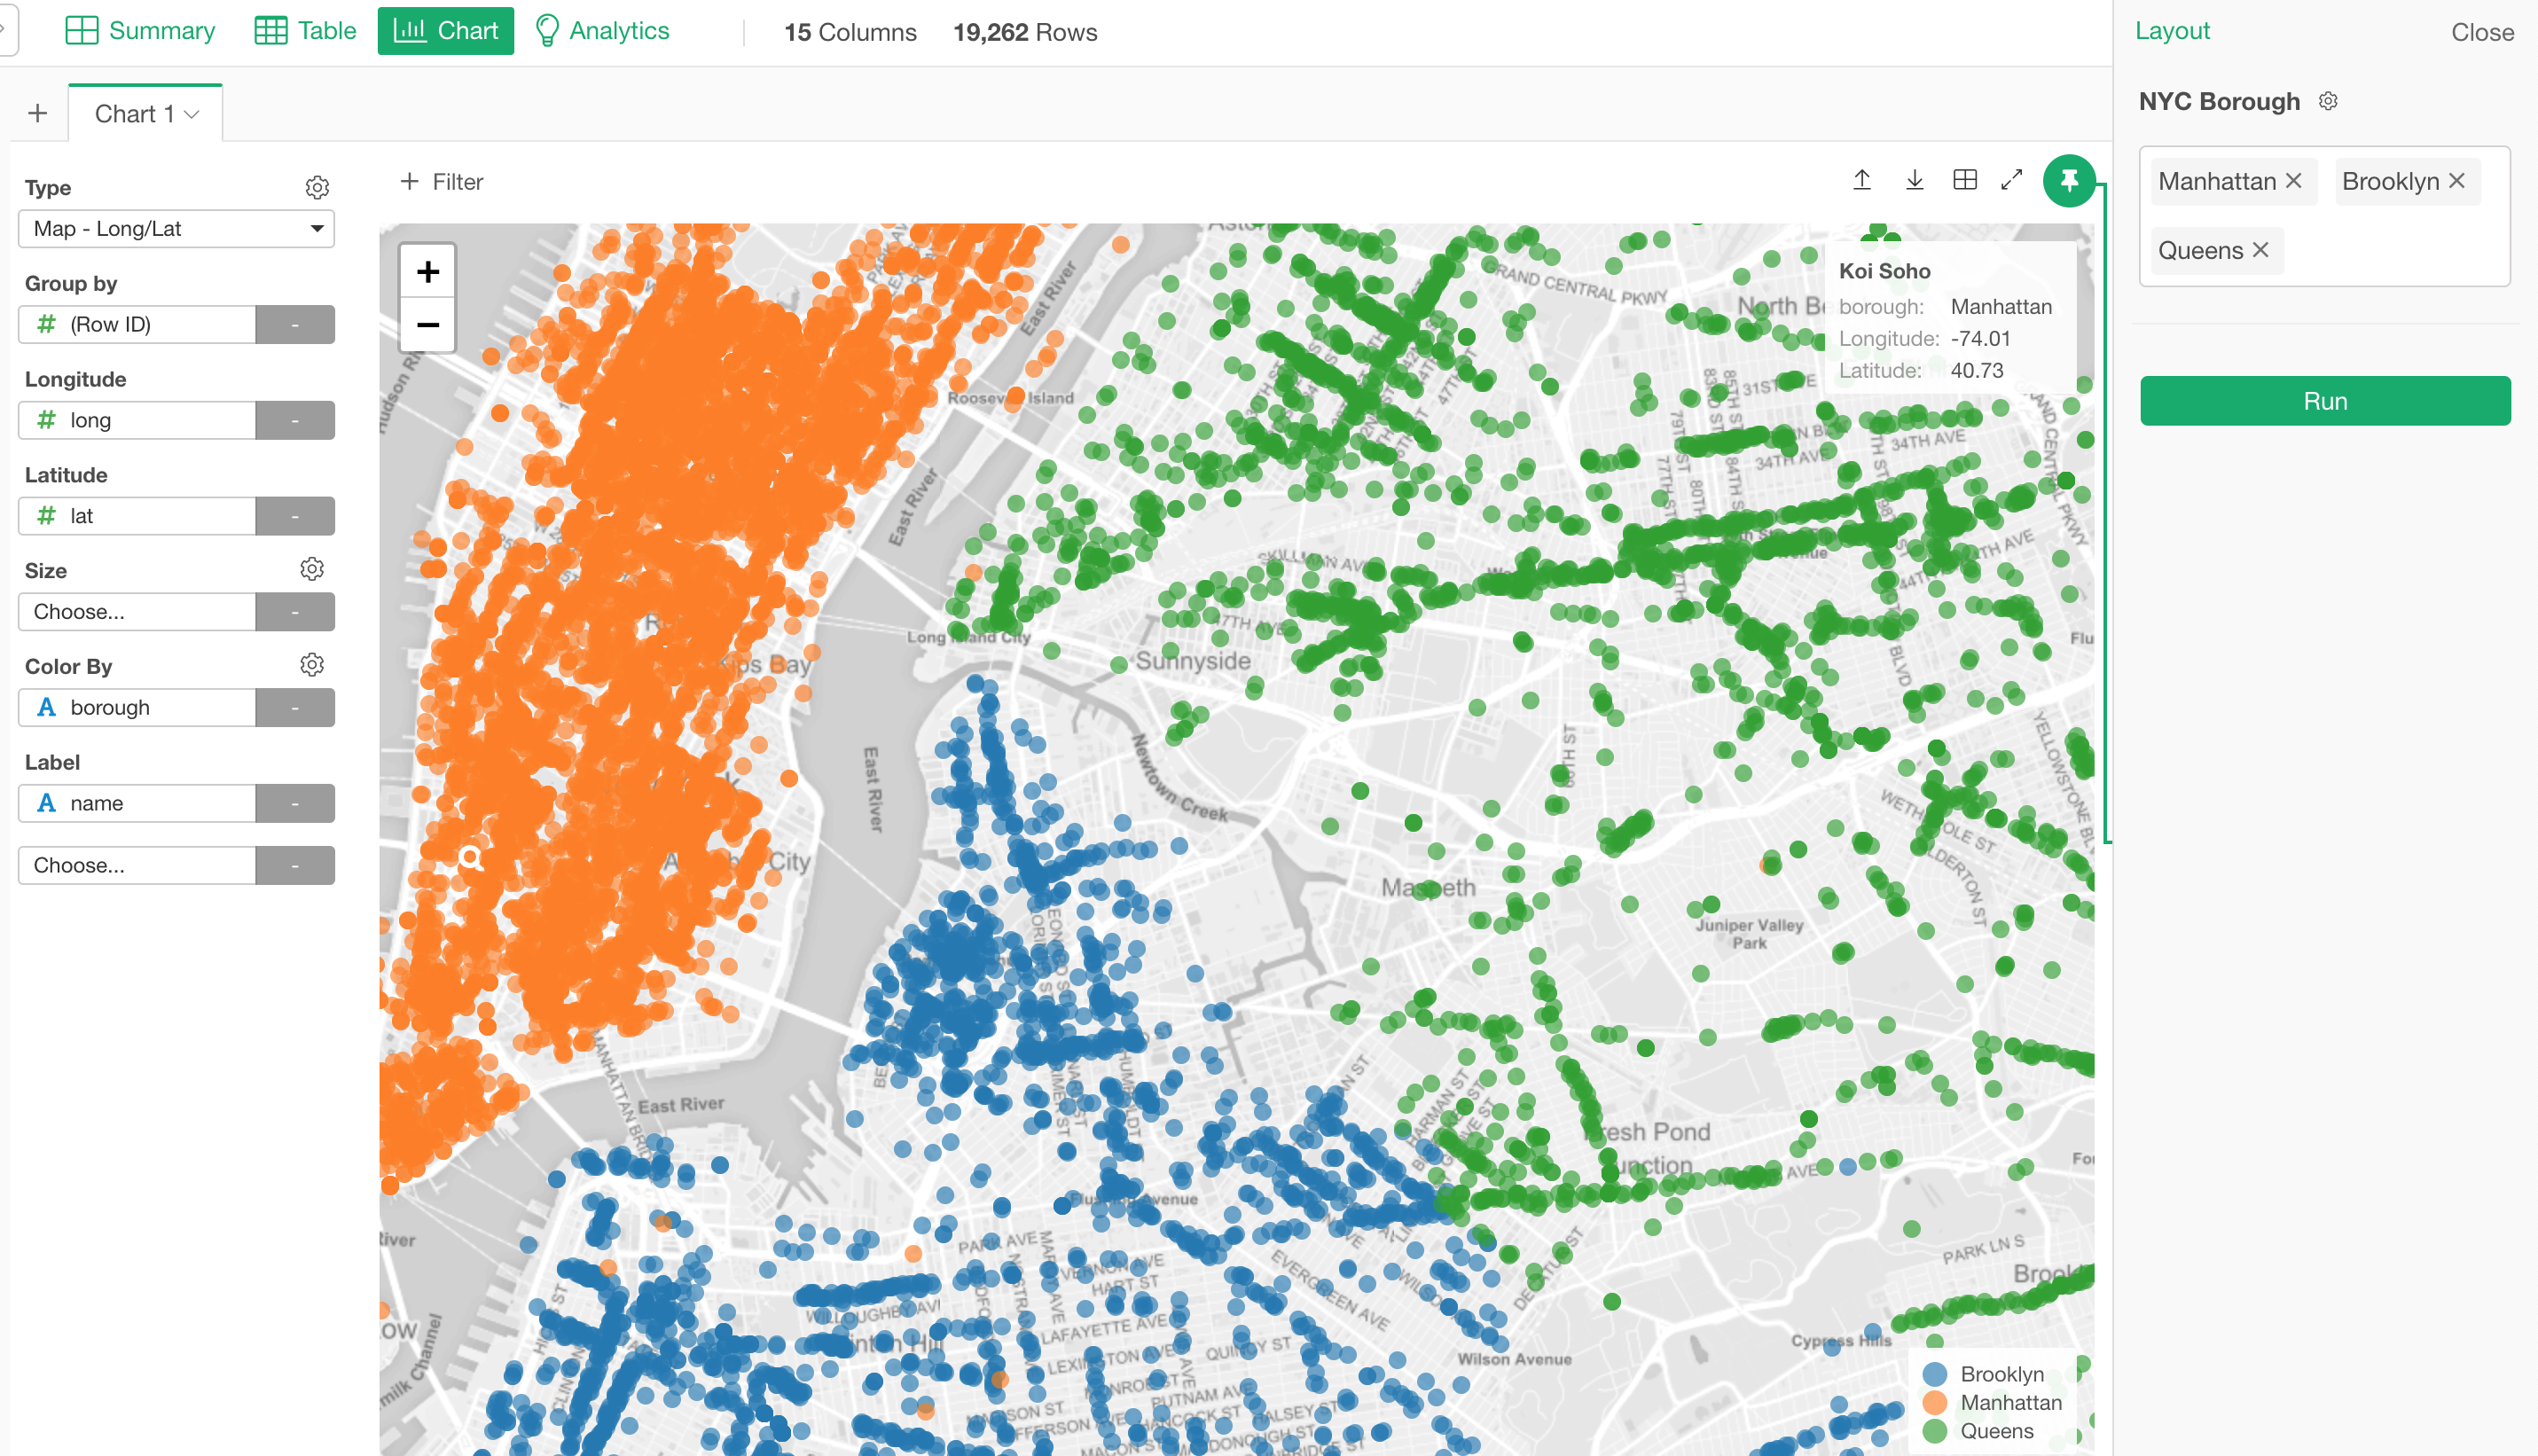
Chart Filter
In the Filter dialog, select a parameter from the parameter list.
Use to Interact
The way the parameter works in Exploratory is that it detects all the required parameters to generate the data for what you want to see and shows those parameters in the Parameter pane when you click the Parameter button.
For example, let’s imagine the following scenario.
| Chart A | Chart B |
|---|---|
| Parameter A | Parameter B |
Chart A has a step that uses Parameter A, and Chart B has a step that uses Parameter B.
And, if we open the Parameter pane in a Dashboard that embedded Chart A and Chart B, we will see Parameters A and Parameter B.
Now, if we removed Chart A and open the Parameter pane, we will see only Parameter A. This is because we don’t need Parameter B to generate the data that is used for Chart A.
I hope this makes sense. It’s just showing whatever the parameters that are associated to the data that is required for the Dashboard.
And this means, you don’t need to set up what parameters to add or remove manually to the Dashboard. Exploratory takes care of that automatically!
And of course, this is not just for Dashboard. It’s the same for Note, Slides, Chart, Analytics, and Data Frame.
Dashboard
Note
Slides
Chart
Analytics
How to manage Parameters
You can open the Parameter Configuration dialog in two ways.
One is to click ‘Parameter’ button and click the gear icons next to the parameters in the parameter pane.
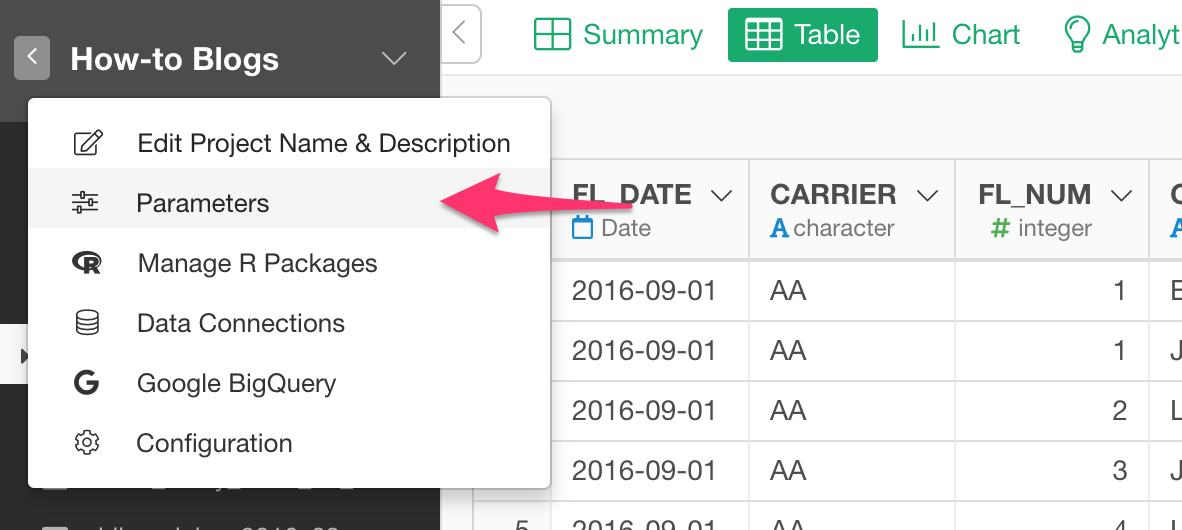
Another is to select ‘Parameter’ from the project level menu.