When you have data like the below, there is a bit of challenge to get the correct ‘average’.
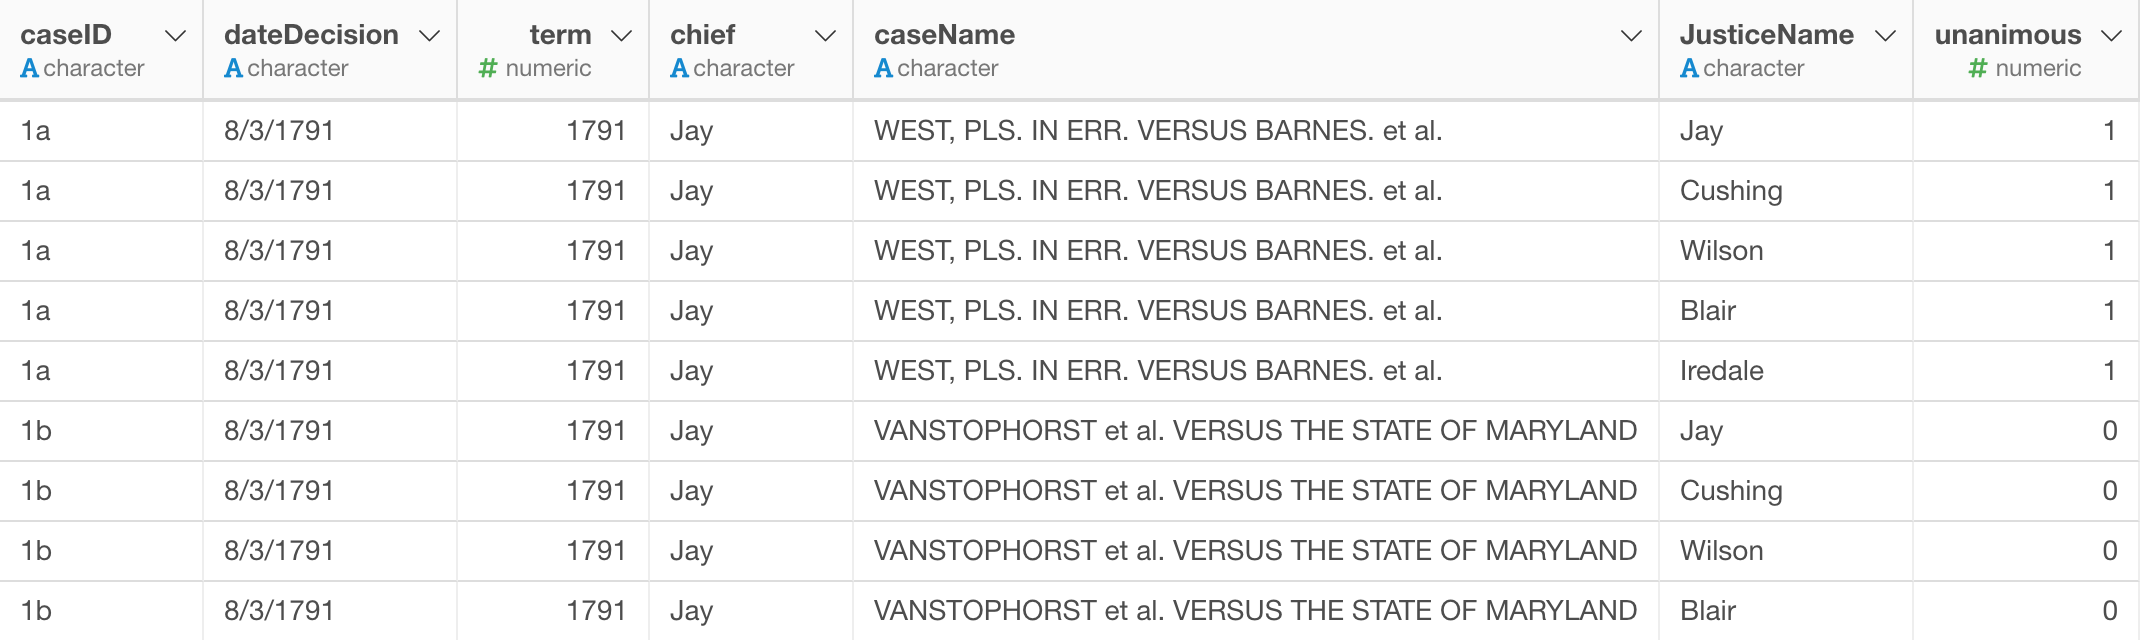
Each row represents unique Justice Name for each Case ID.
The 1st case ‘1a’ has 5 rows for different Justice Name values (e.g. Jay, Cushing, etc.). All of them have the same value 1 for ‘unanimous’.
The 2nd case ‘1b’ has 4 rows for various Justice Name values, and all have the same value of 0 for ‘unanimous’.
Now, if you consider the unanimous value for the 1st case ‘1a’ is 1 and the 2nd case is 0, then you would think the average among the two cases would be 0.5, right?
But if we go to the Pivot table and calculate the average of all the values of these 9 rows, you will end up getting 0.5555.
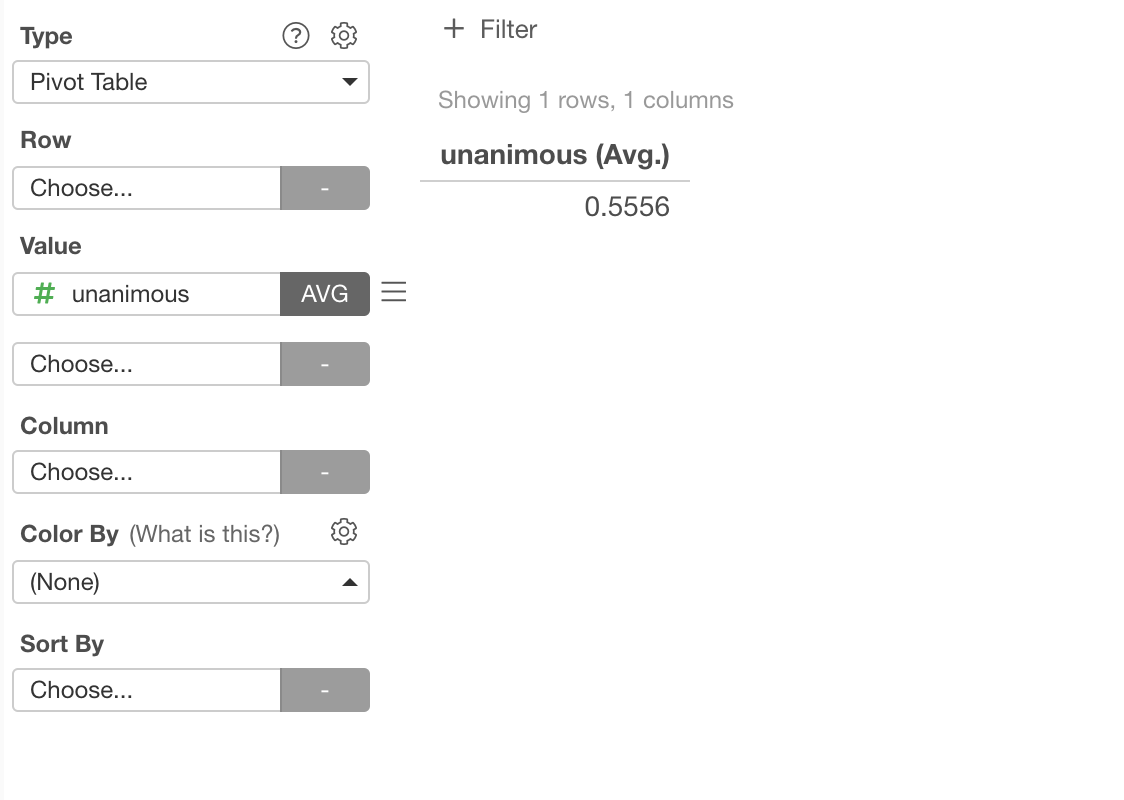
Why?
That’s because it calculates the average as:
5 (Sum of Unanimous Values) / 9 (Number of Rows)But what we want to do here in this case is to get 1 for case ‘1a’ and 0 for case ‘1b’ first, then take the average between them.
You can address this by Data Wrangling.
First, you group the data by the case ID and summarize to calculate the average for each case first, then go to the Pivot table to calculate the average among the two cases.
Here is how.
Data Wrangling
Group By
First, you want to group the data by ‘caseID’ column.

This will give you the data look like the below.

Each group is colored by different color.
Summarize
Then, summarize with ‘mean (average)’ function.
You can select the function from the column header menu.
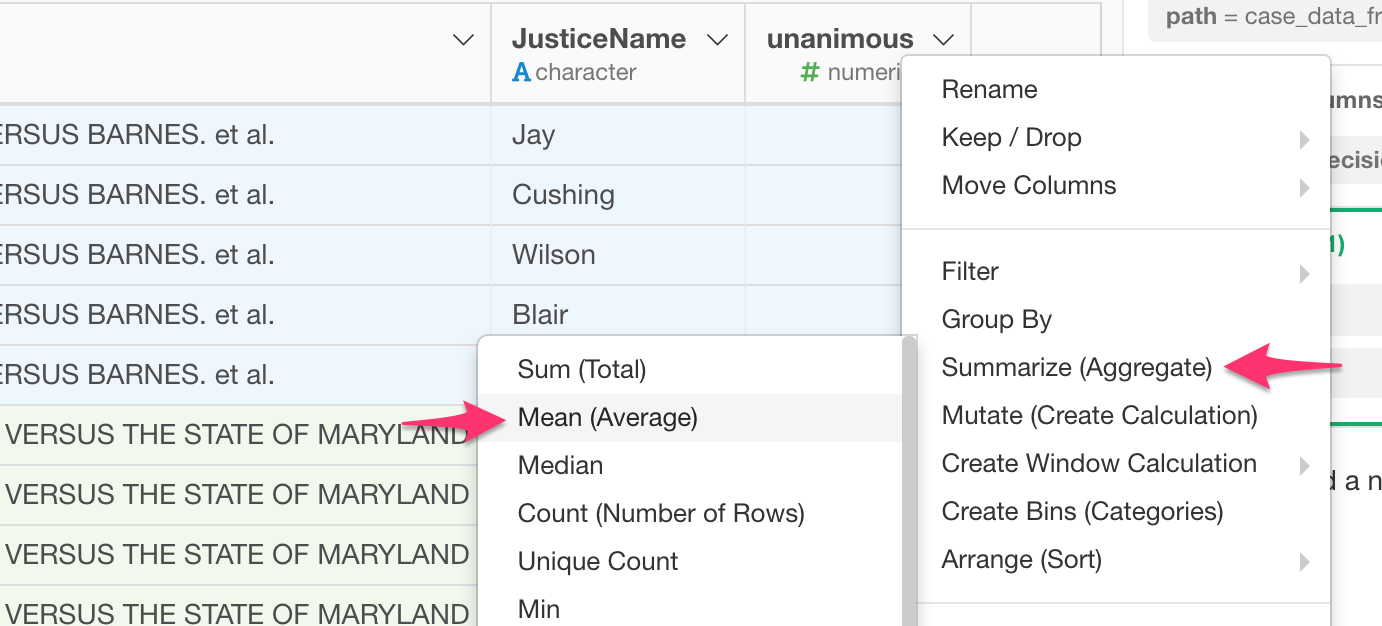
I’m using ‘mean (average)’ calculation but this could be ok with ‘last’, ‘first’ function as well.
At this point though, we have lost all the other columns. But you can bring them back if you want.
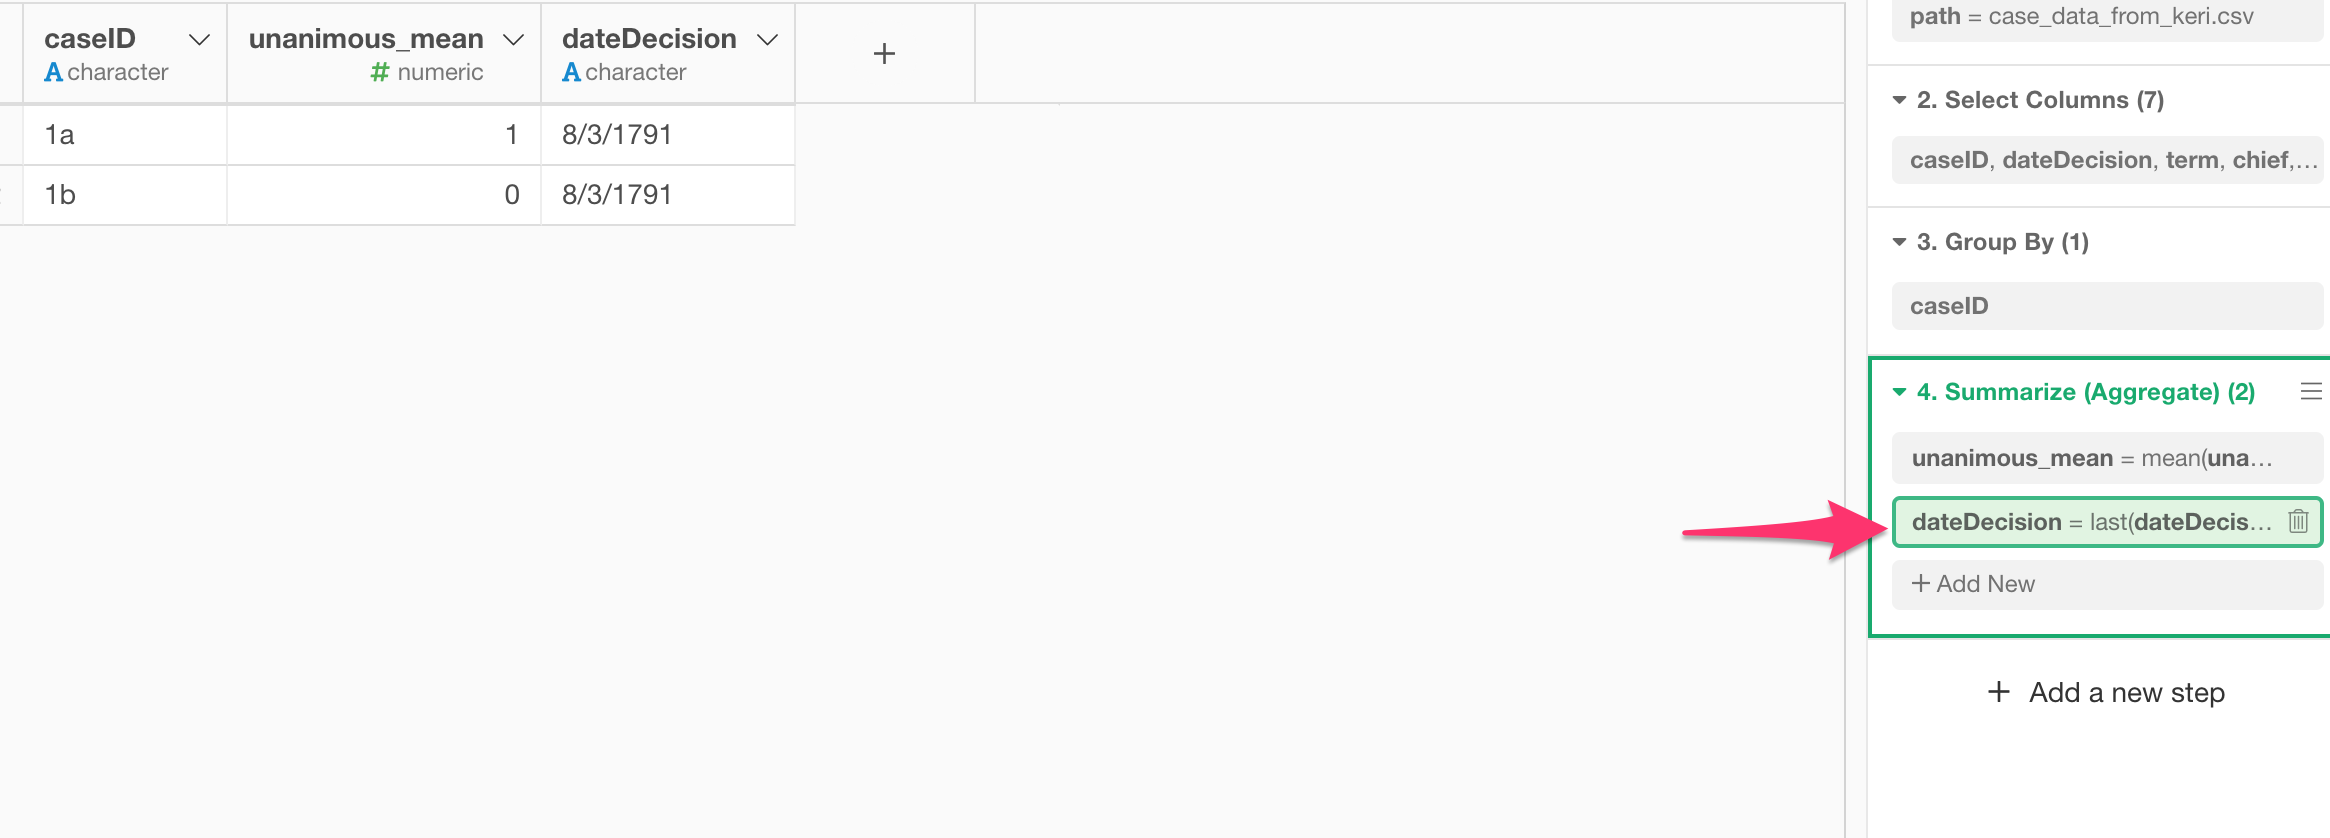
Let’s say we want to bring the dateDecision.
Just click on the Plus button in the column header.

In the dialog, select the dateDecision column and ‘last’ function.
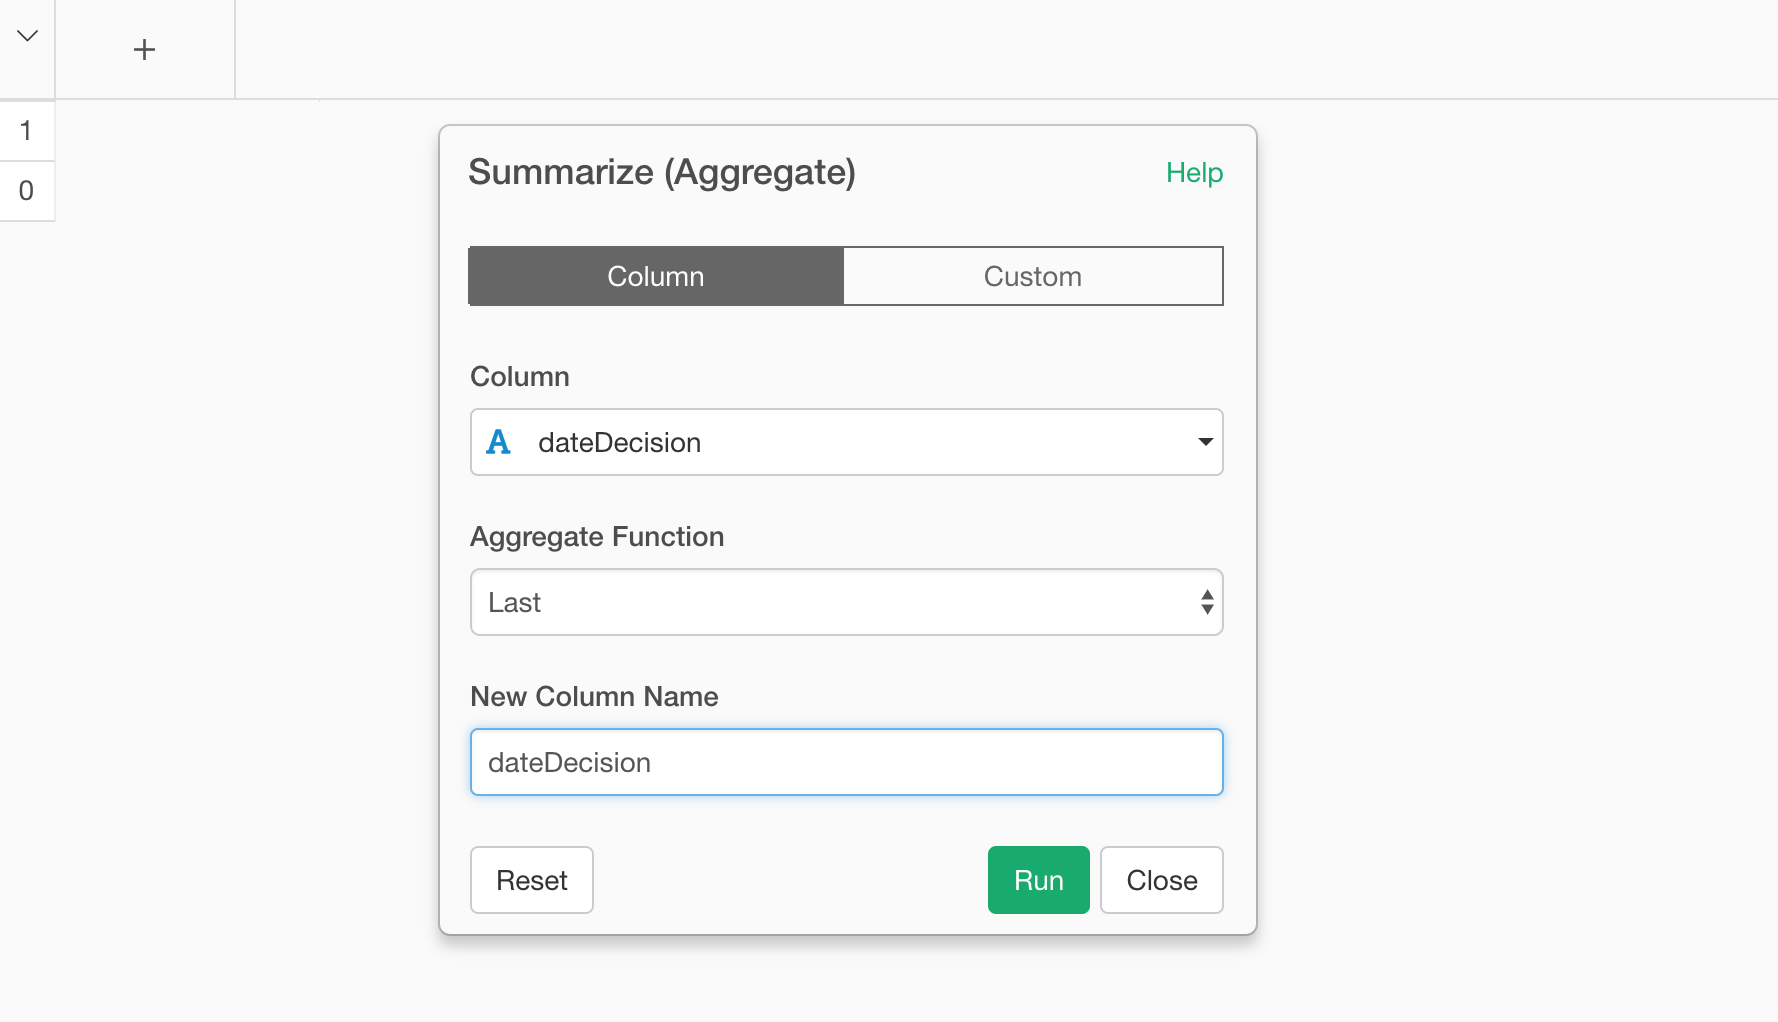
Once you type the name for the newly created column, hit Run button.
You’ll get the column back.
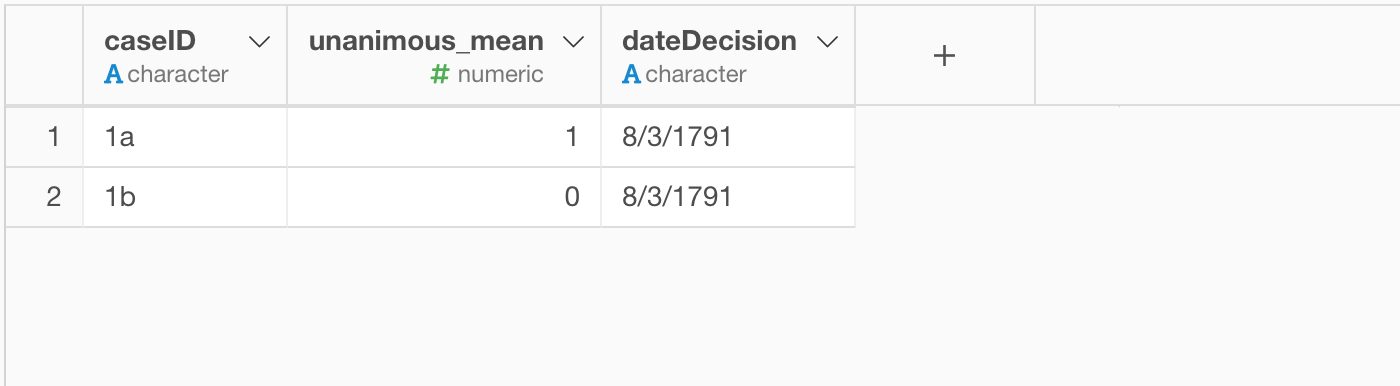
If you want to change the column order here then you can drag and drop the ‘token’, which represents each calculation.
Pivot Table
At this point, you can go back to Pivot Table and re-select the column.
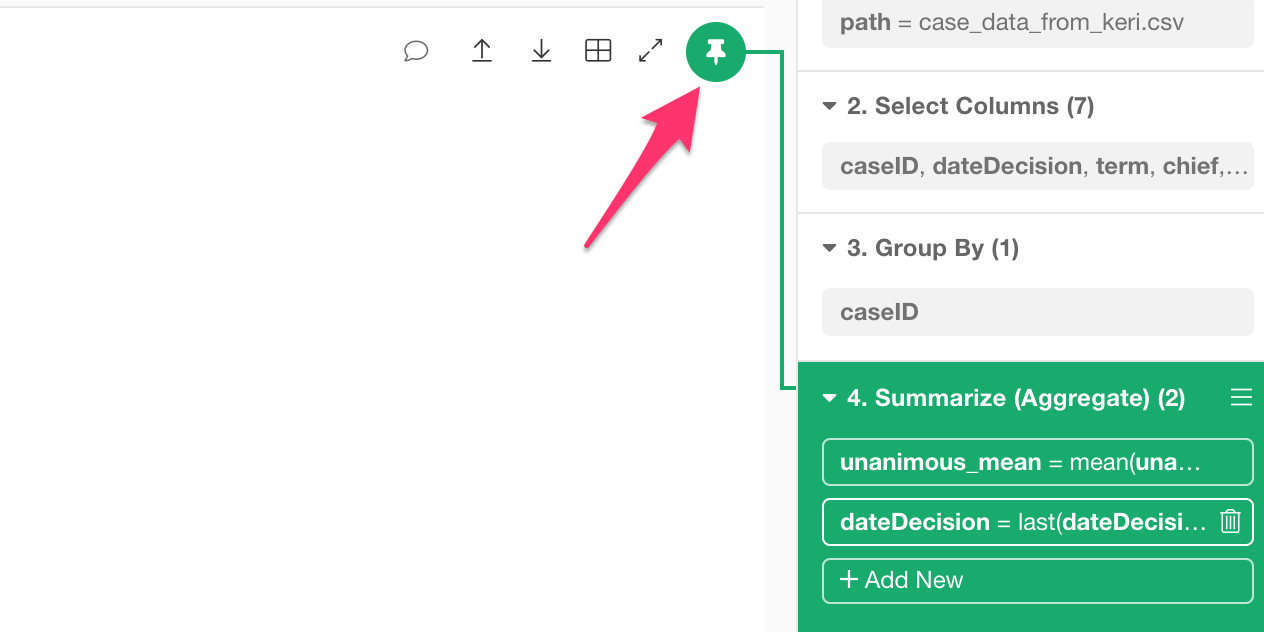
Make sure that the latest step of ‘Summarize’ is highlighted with green background color at the right hand side.

If not, then you want to drag and drop the Pin button to this step.
And you want to assign ‘caseID’ to Row and ‘unanimous_mean’ to Value. Make sure to select ‘mean (average)’ as the summarize function here.

Now we can see the average of all is calculated as 0.5.