
Calculating Customer Lifetime Value (CLV)
Understanding the Customer Lifetime Value is critical for subscription businesses including SaaS (Software-as-a-Service).
Unlike, transactional businesses, the subscription business accumulate revenues from the same customer over time.
Let's say Netflix charges customers $20 every month. It can expect just $20 from one customer for the first month. But if this customer continues to be a customer of Netflix for the next 12 months then Netflix can expect $240 from this customer.
This is called Customer Life Time Value or CLV.
Knowing the CLV is important because once you understand how much revenue you can expect per customer then you can decide how much you can spend to acquire new customers or to keep existing customers happy.
Now, how you can calculate the CLV?
That's the topic of this post.
I'll talk about 3 ways to do.
- Estimate CLV with Guts
- Estimate CLV based on Churn Rate
- Estimate CLV based on Survival Rate (Retention Rate)
Estimate CLV with Guts
Let's start with a very simple one.
Let's say the average customer lifetime period is 12 months and the MRR is $100, then your CLV is $1200.
12 * 100 = 1200But of course, this could be too simple. I just guessed the lifetime period as 12 months with my guts feeling, assuming that nobody churns.
But that's not realistic. Customer churns all the time for any business, unfortunately.
Estimate CLV with Churn Rates
The average lifetime period really depends on your churn rate. If it's high then the period gets shorter. If it's low then the period gets longer.
And it can be calculated as:
Average Lifetime = 1 / Churn RateFor example, your monthly churn rate is 10%, then the average lifetime period can be calculated as:
1 / 0.1 = 10So it is 10 months.
Once we get the average lifetime period calculated, then we can calculate the CLV by multiplying by the MRR.
So, if the MRR is $100, then the CLV is $1,000.
10 * 100 = 1,000Now, here is a problem.
We can't expect the same amount of revenue every month because the churn rates are varies among the months. It might be a 40% churn rate at the first month, 30% at the second month, then it flattens at 25% thereafter, for example.
So, if you want to calculate the CLV more realistically you want to calculate the retention rate for each period of the customer life span then you can multiply the recurring revenue to the rate. This will give you more realistic average revenue from your customers.
Estimate CLV with Survival Rates
The best way to estimate the retention rates over time is to use the Kaplan-Meyer algorithm, which is a well known statistical algorithm for estimating the survival (or retention) rates through time periods. The algorithm takes care of even the users whom we don't know have churned or not at a given period yet because they are still at early age compared to other users.
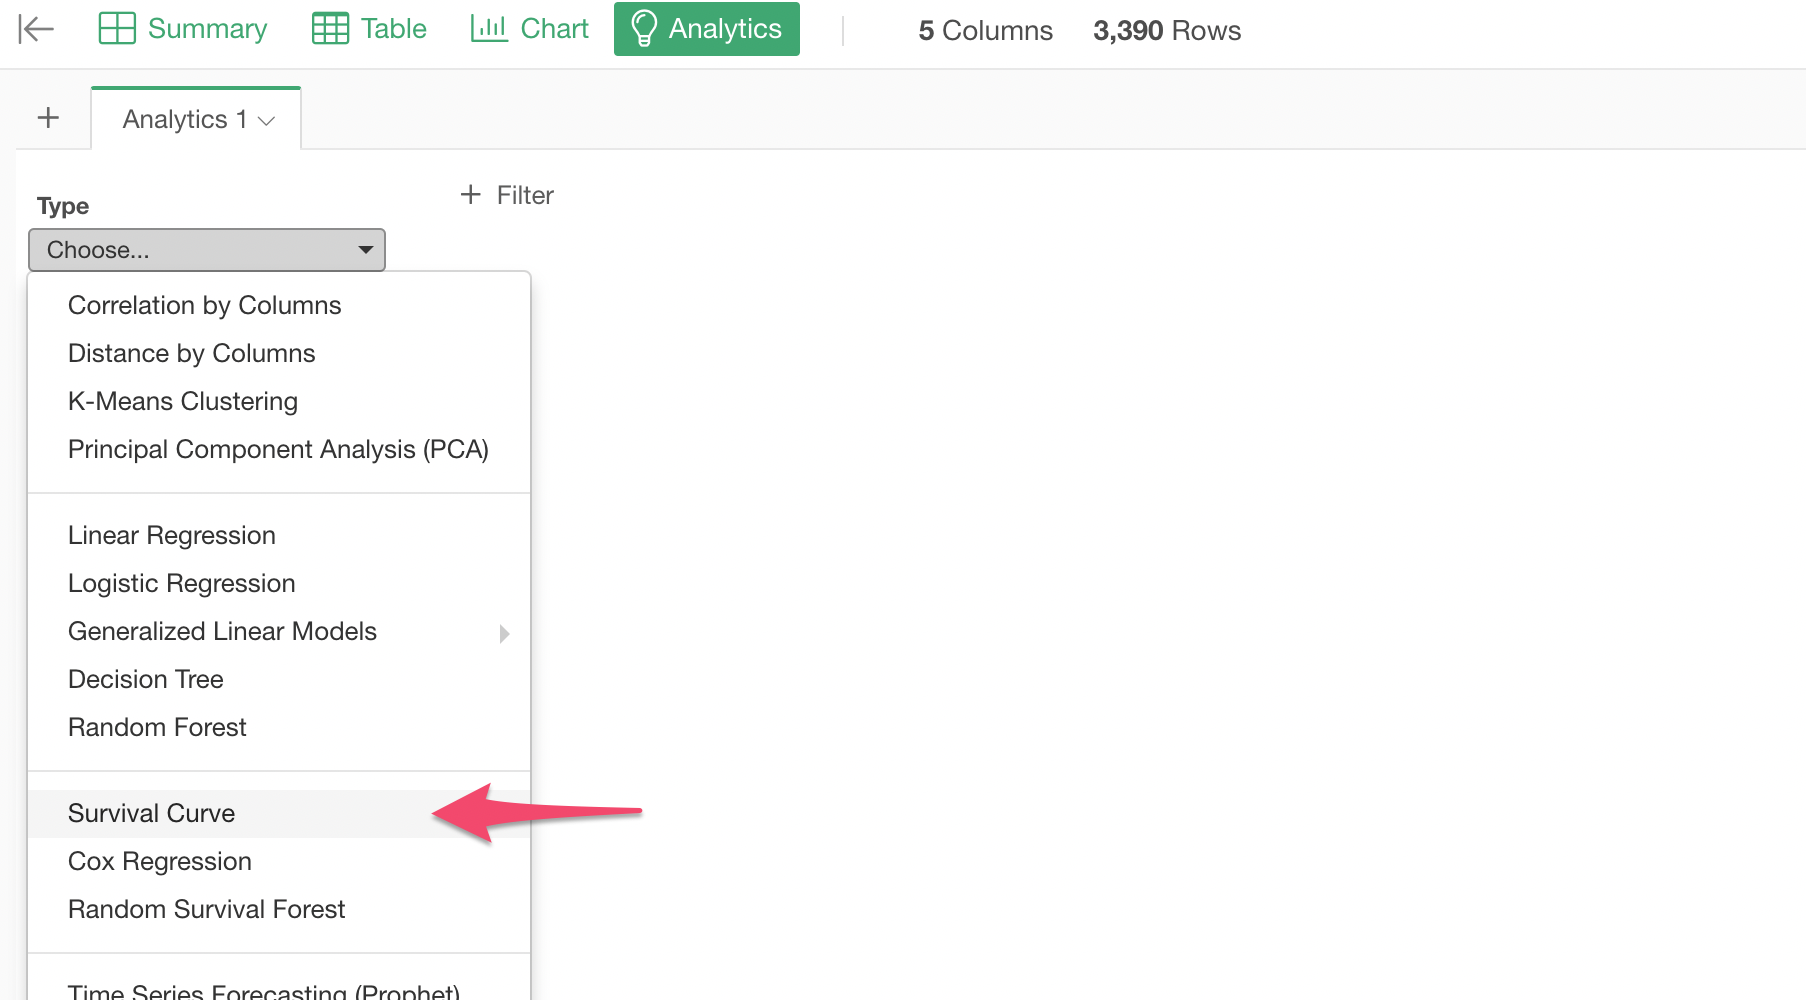
With Exploratory, you can use 'Survival Curve' under the Analytics view.
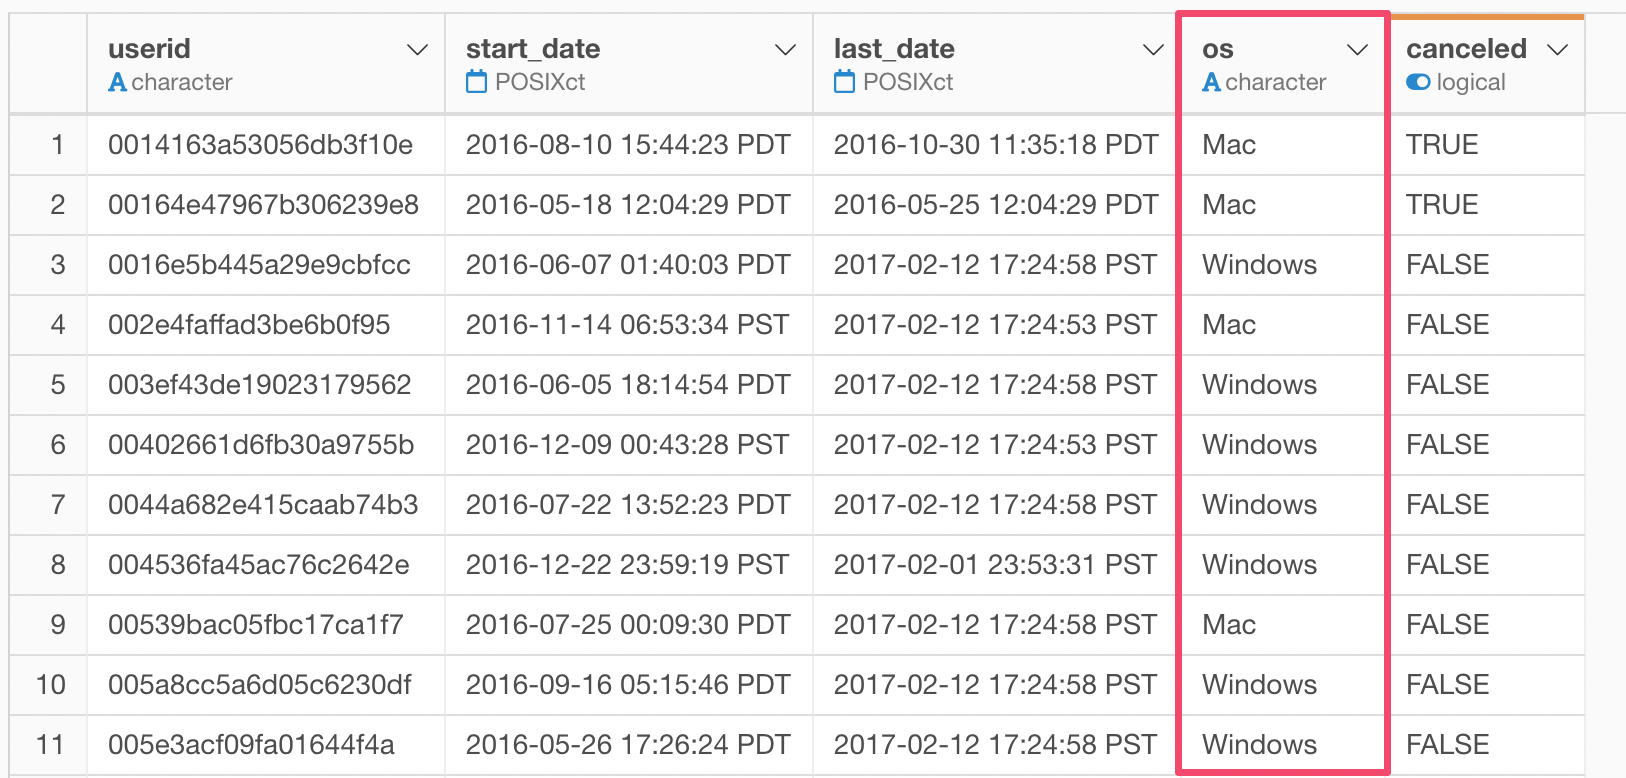
I have customer data with the following columns.
- User ID
- Start Date - when a given user started using the service
- End Date - when a user stopped using the service
- Canceled - whether a given user has canceled or not
- OS - which PC operating system a given user used
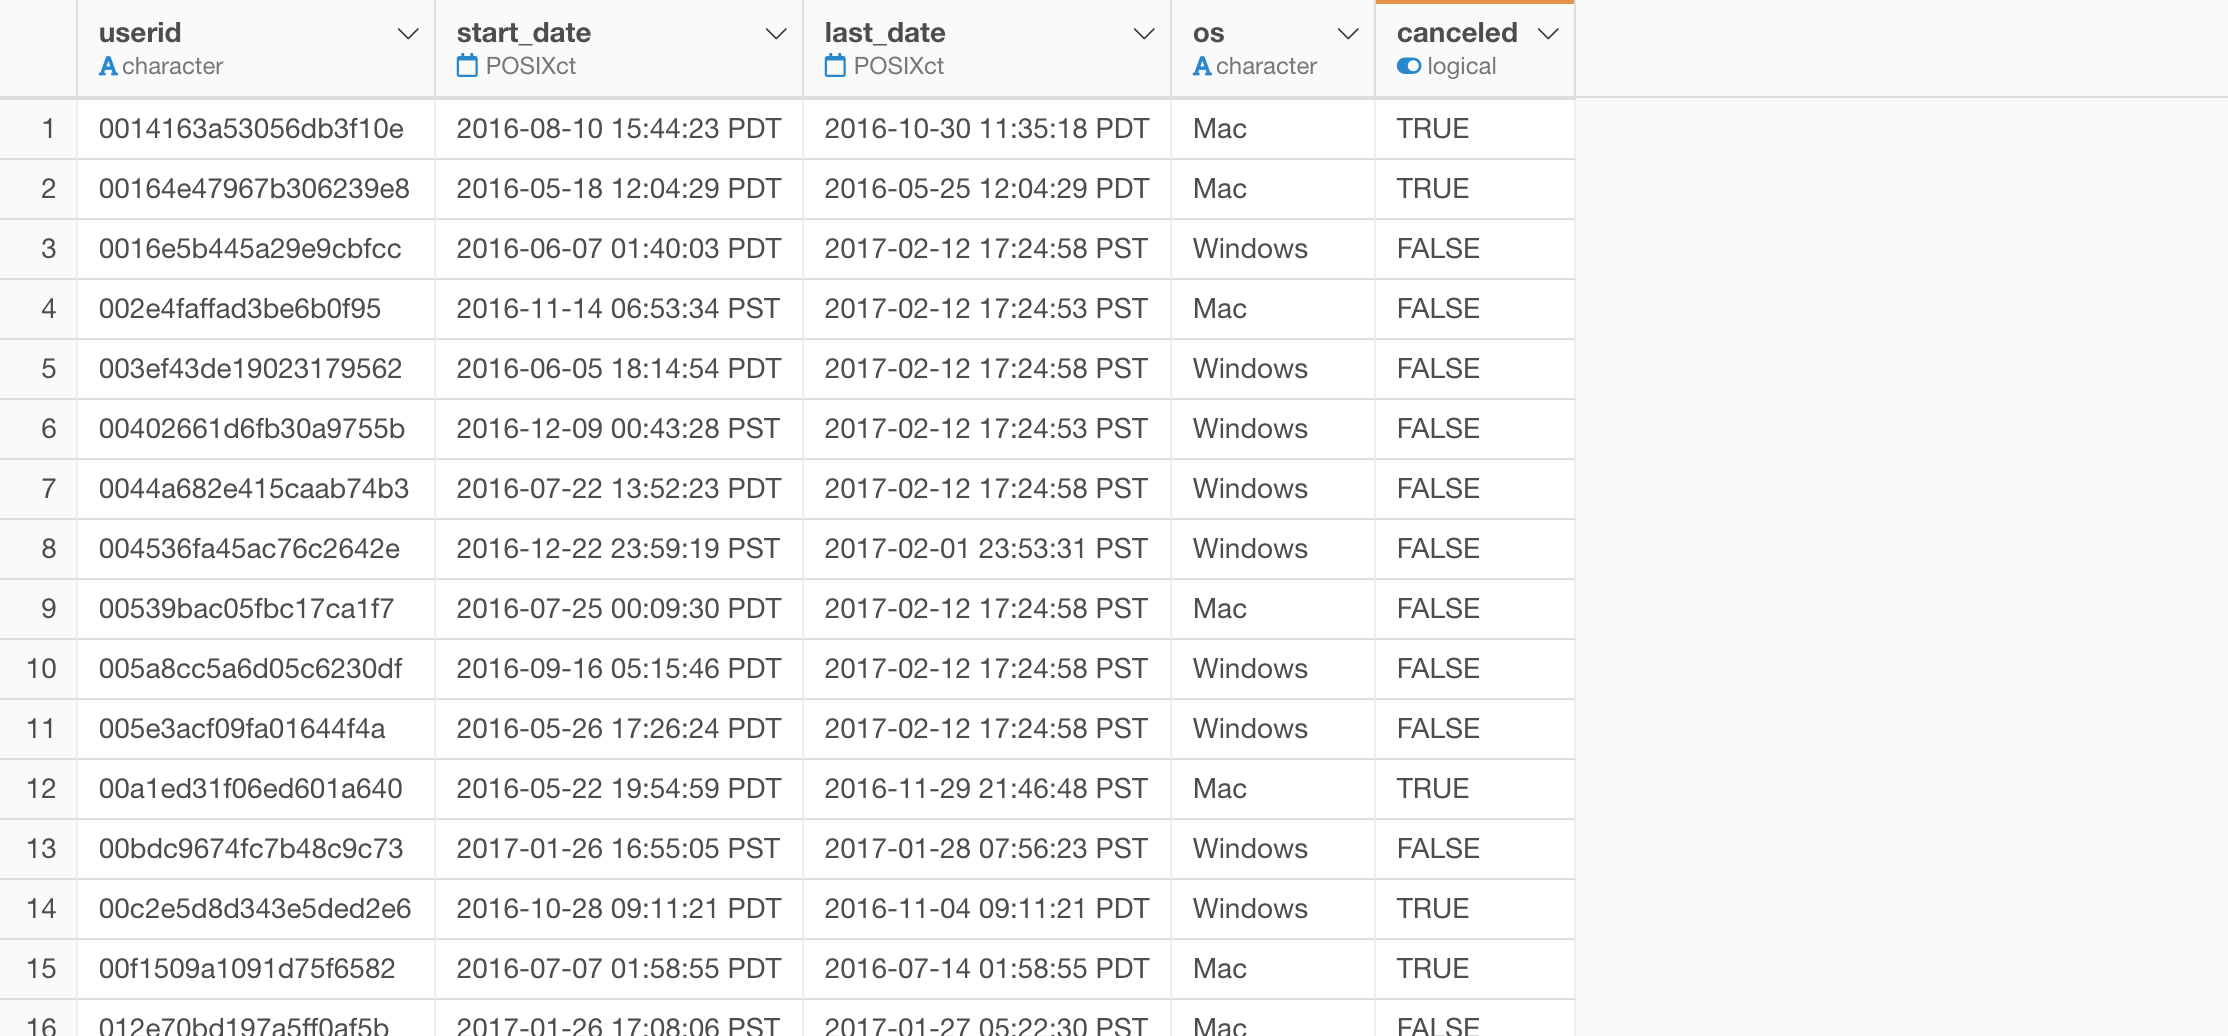
Each row represents each user.
Take a look at this note on how to prepare the data for Survival Curve.
Use Survival Curve to Calculate Survival Rates
Go to the Analytics view, and select 'Survival Curve' analytics type.
Assign the following columns to the corresponding fields.
- start_date -> Start Time
- last_date -> End Time
- canceled -> Event Status

Once you run it you will get the survival curve.
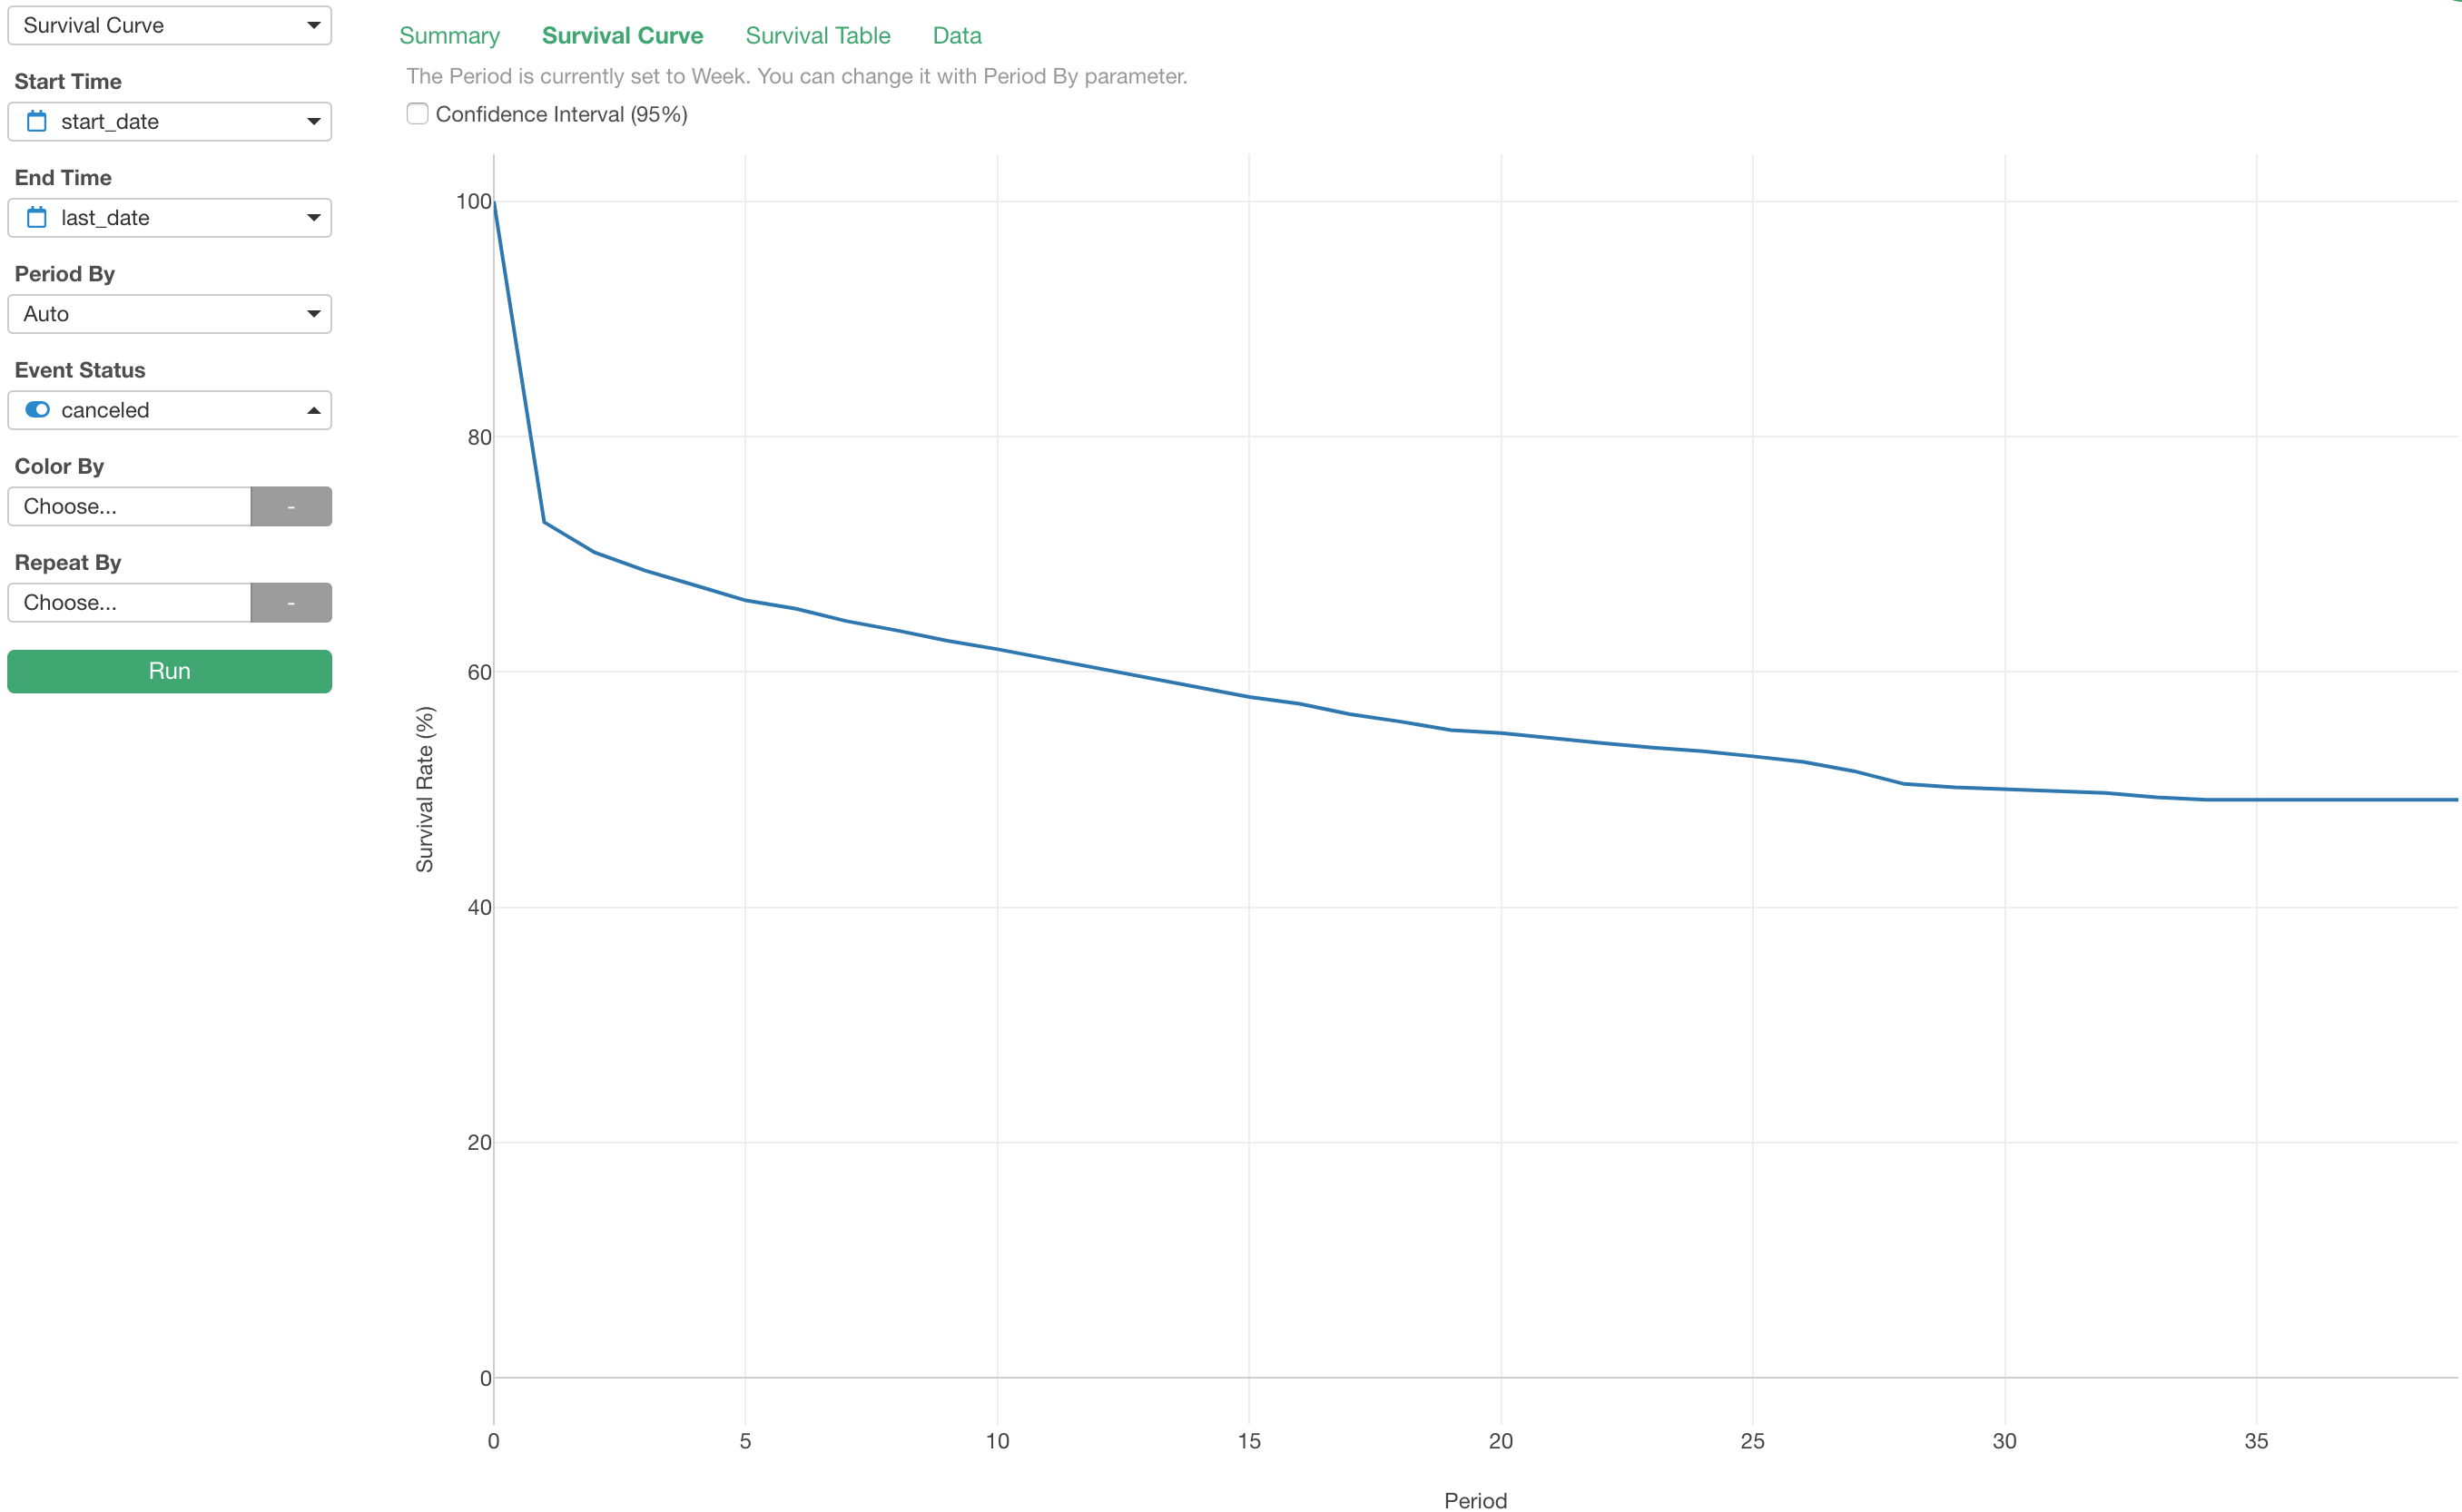
This chart shows you the survival rate for each period. The period is currently set to 'Week'.
We can change it to 'Month' by selecting 'Month' for the Period By.
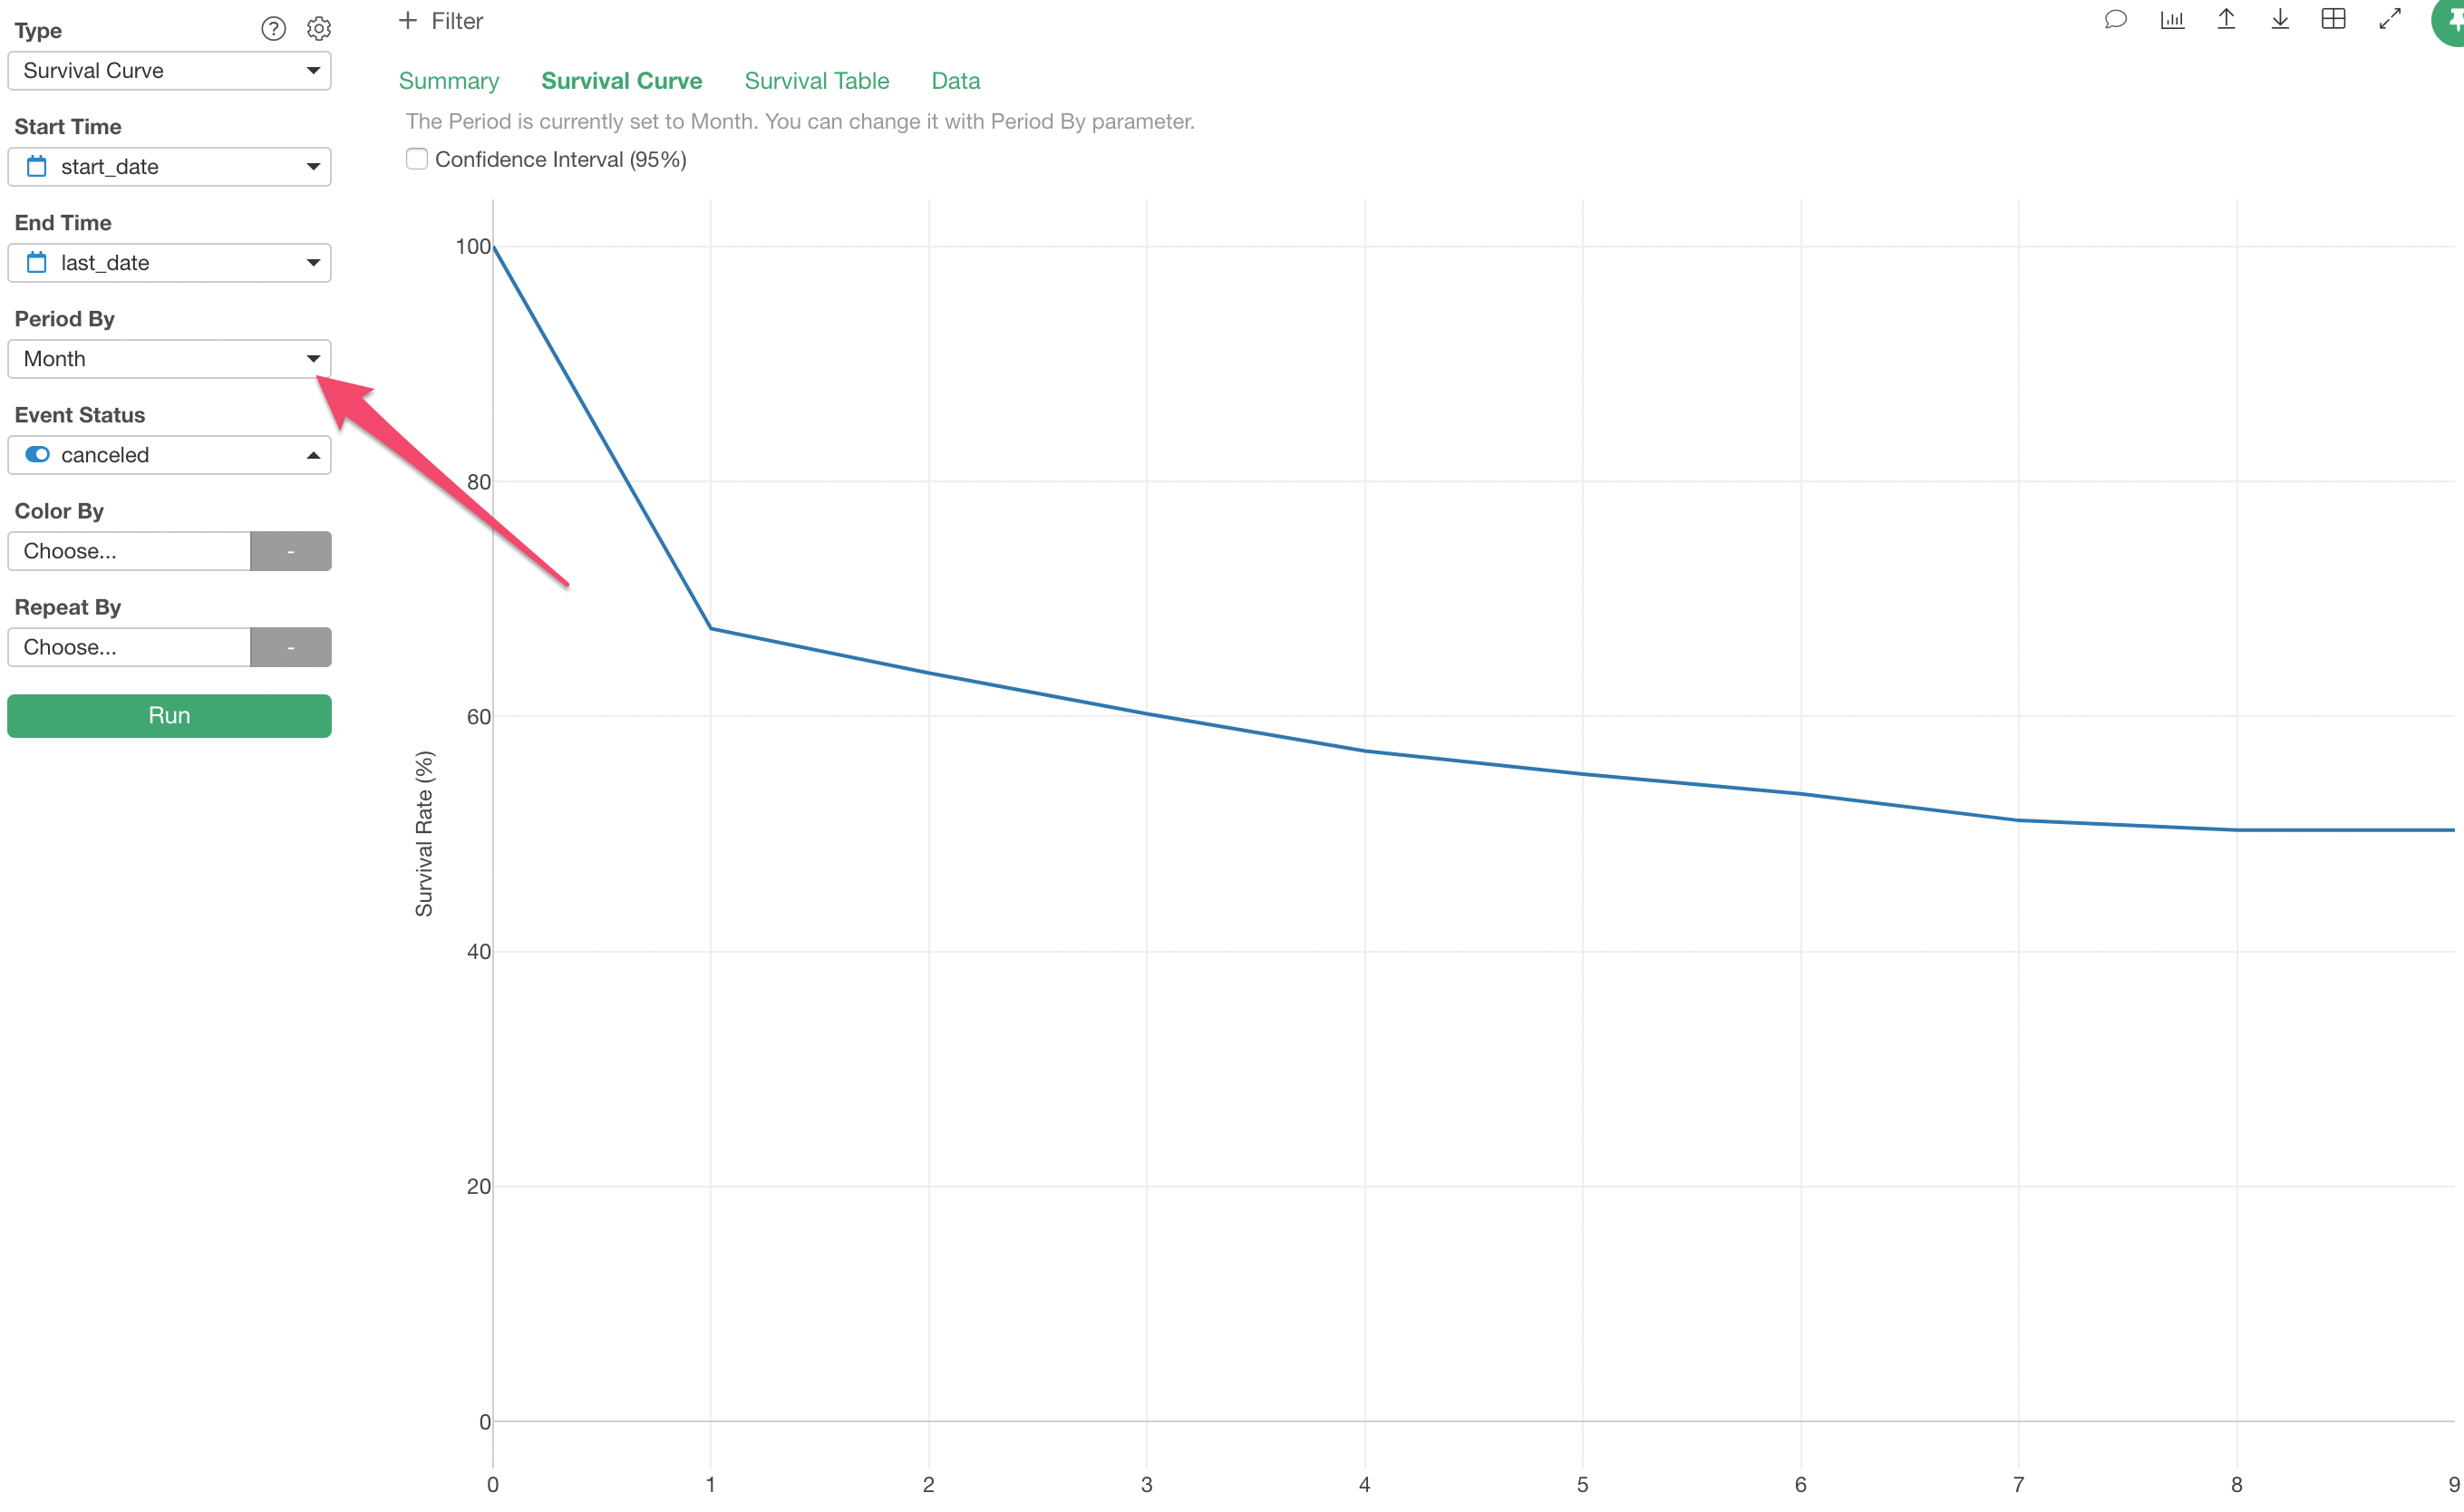
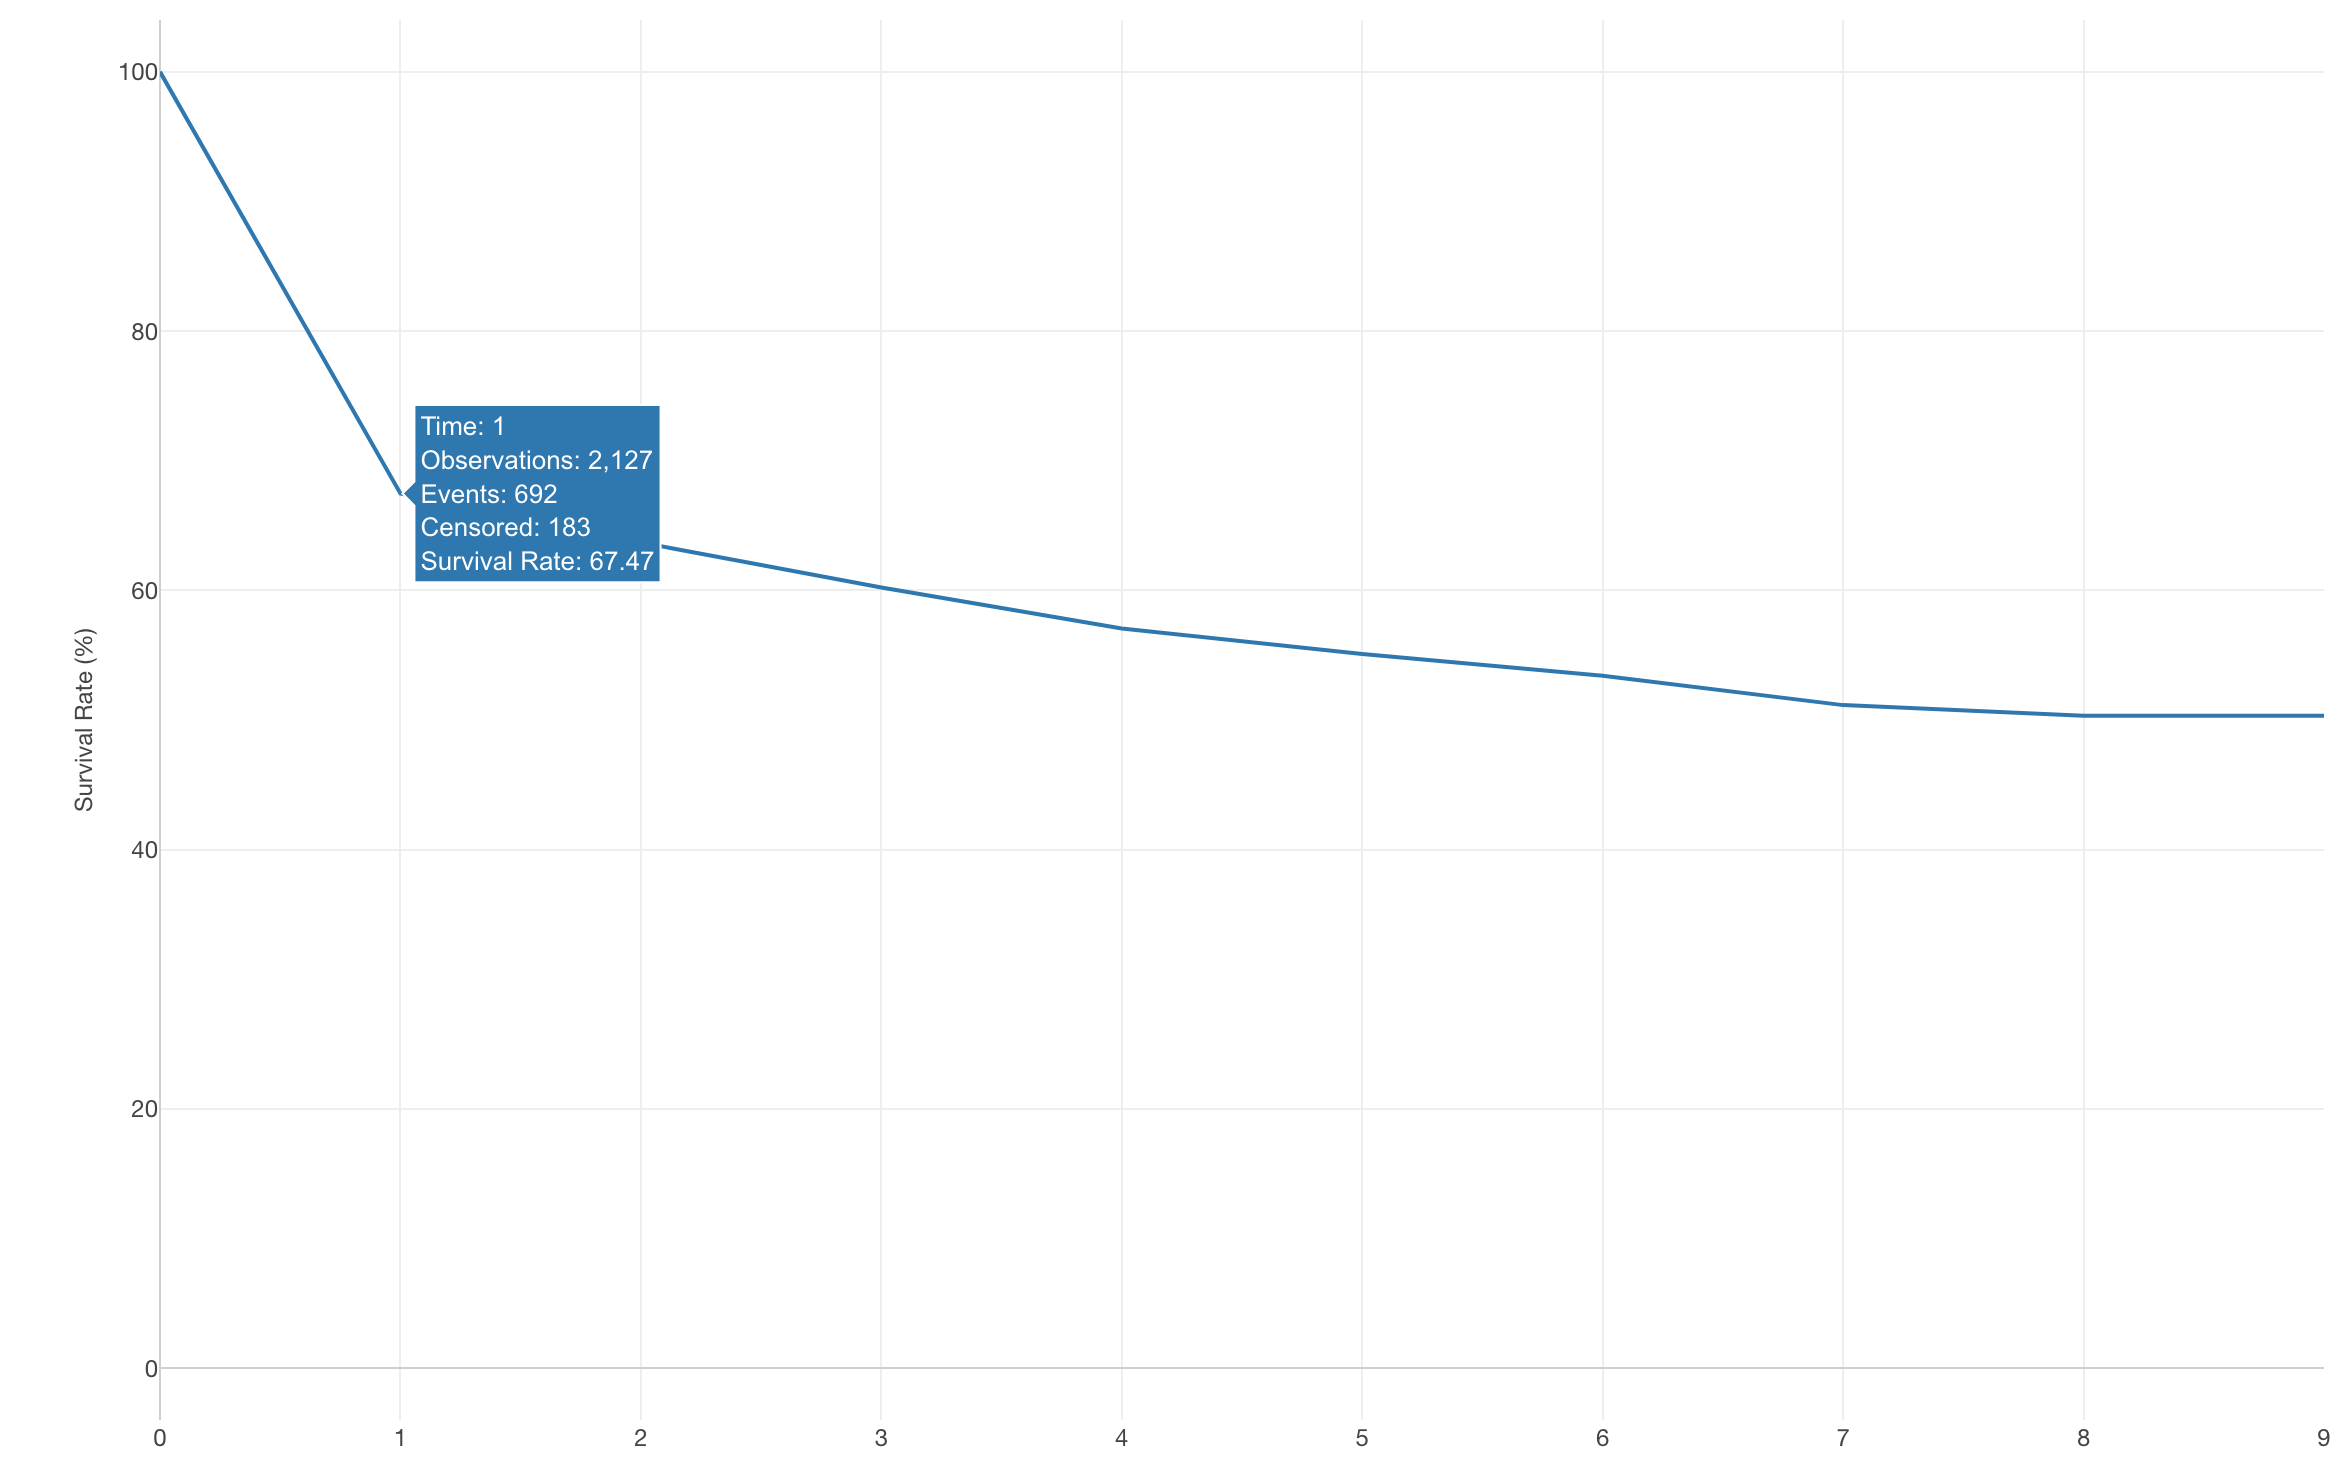
Now, we are looking at the monthly survival rates.
For example, the survival rate for the 1st month is 67.47%.
How can we use this Survival Curve to calculate the CLV (Customer Lifetime Value)?
The CLV is the expected revenue from a customer throughout the customer period between the time when he/she converted and the time he/she canceled.
So the expected revenue for each period can be calculated as:
Expected Revenue of a given period = Survival Rate of the period * Recurring RevenueThe first period, in this case, that is the period 0 at X-Axis, starts at 100%, that's when the customers just converted. And the 100% survival rate means that you can expect 100% of the revenue.
If the monthly charge is $100 then we can expect $100 per customer.
Now, the second months' survival rate is 67.47%.
This means that the expected revenue for this period is about $67 per customer, not $100.
If this makes sense to you then you can skip to the next section. Otherwise, please follow me here. This can be a bit tricky.
Let's say we have 100 customers to start with. The survival rate of 67% means that we have only 67 people remained by the end of this period. That means that we can expect the revenue only from these 67 people.
The total revenue is $6,700.
67 * $100 (revenue per person) = $6700Since we had 100 customers originally, in order to calculate the average revenue (per customer) we can divide the $6,700 by 100, which is $67.
And this is basically the same thing of:
0.67 (67%) * $100 (recurring revenue per person) = $67So, we can calculate the expected revenue for each period by multiplying the recurring revenue by the survival rate of the period.
The same thing for the 3rd month.
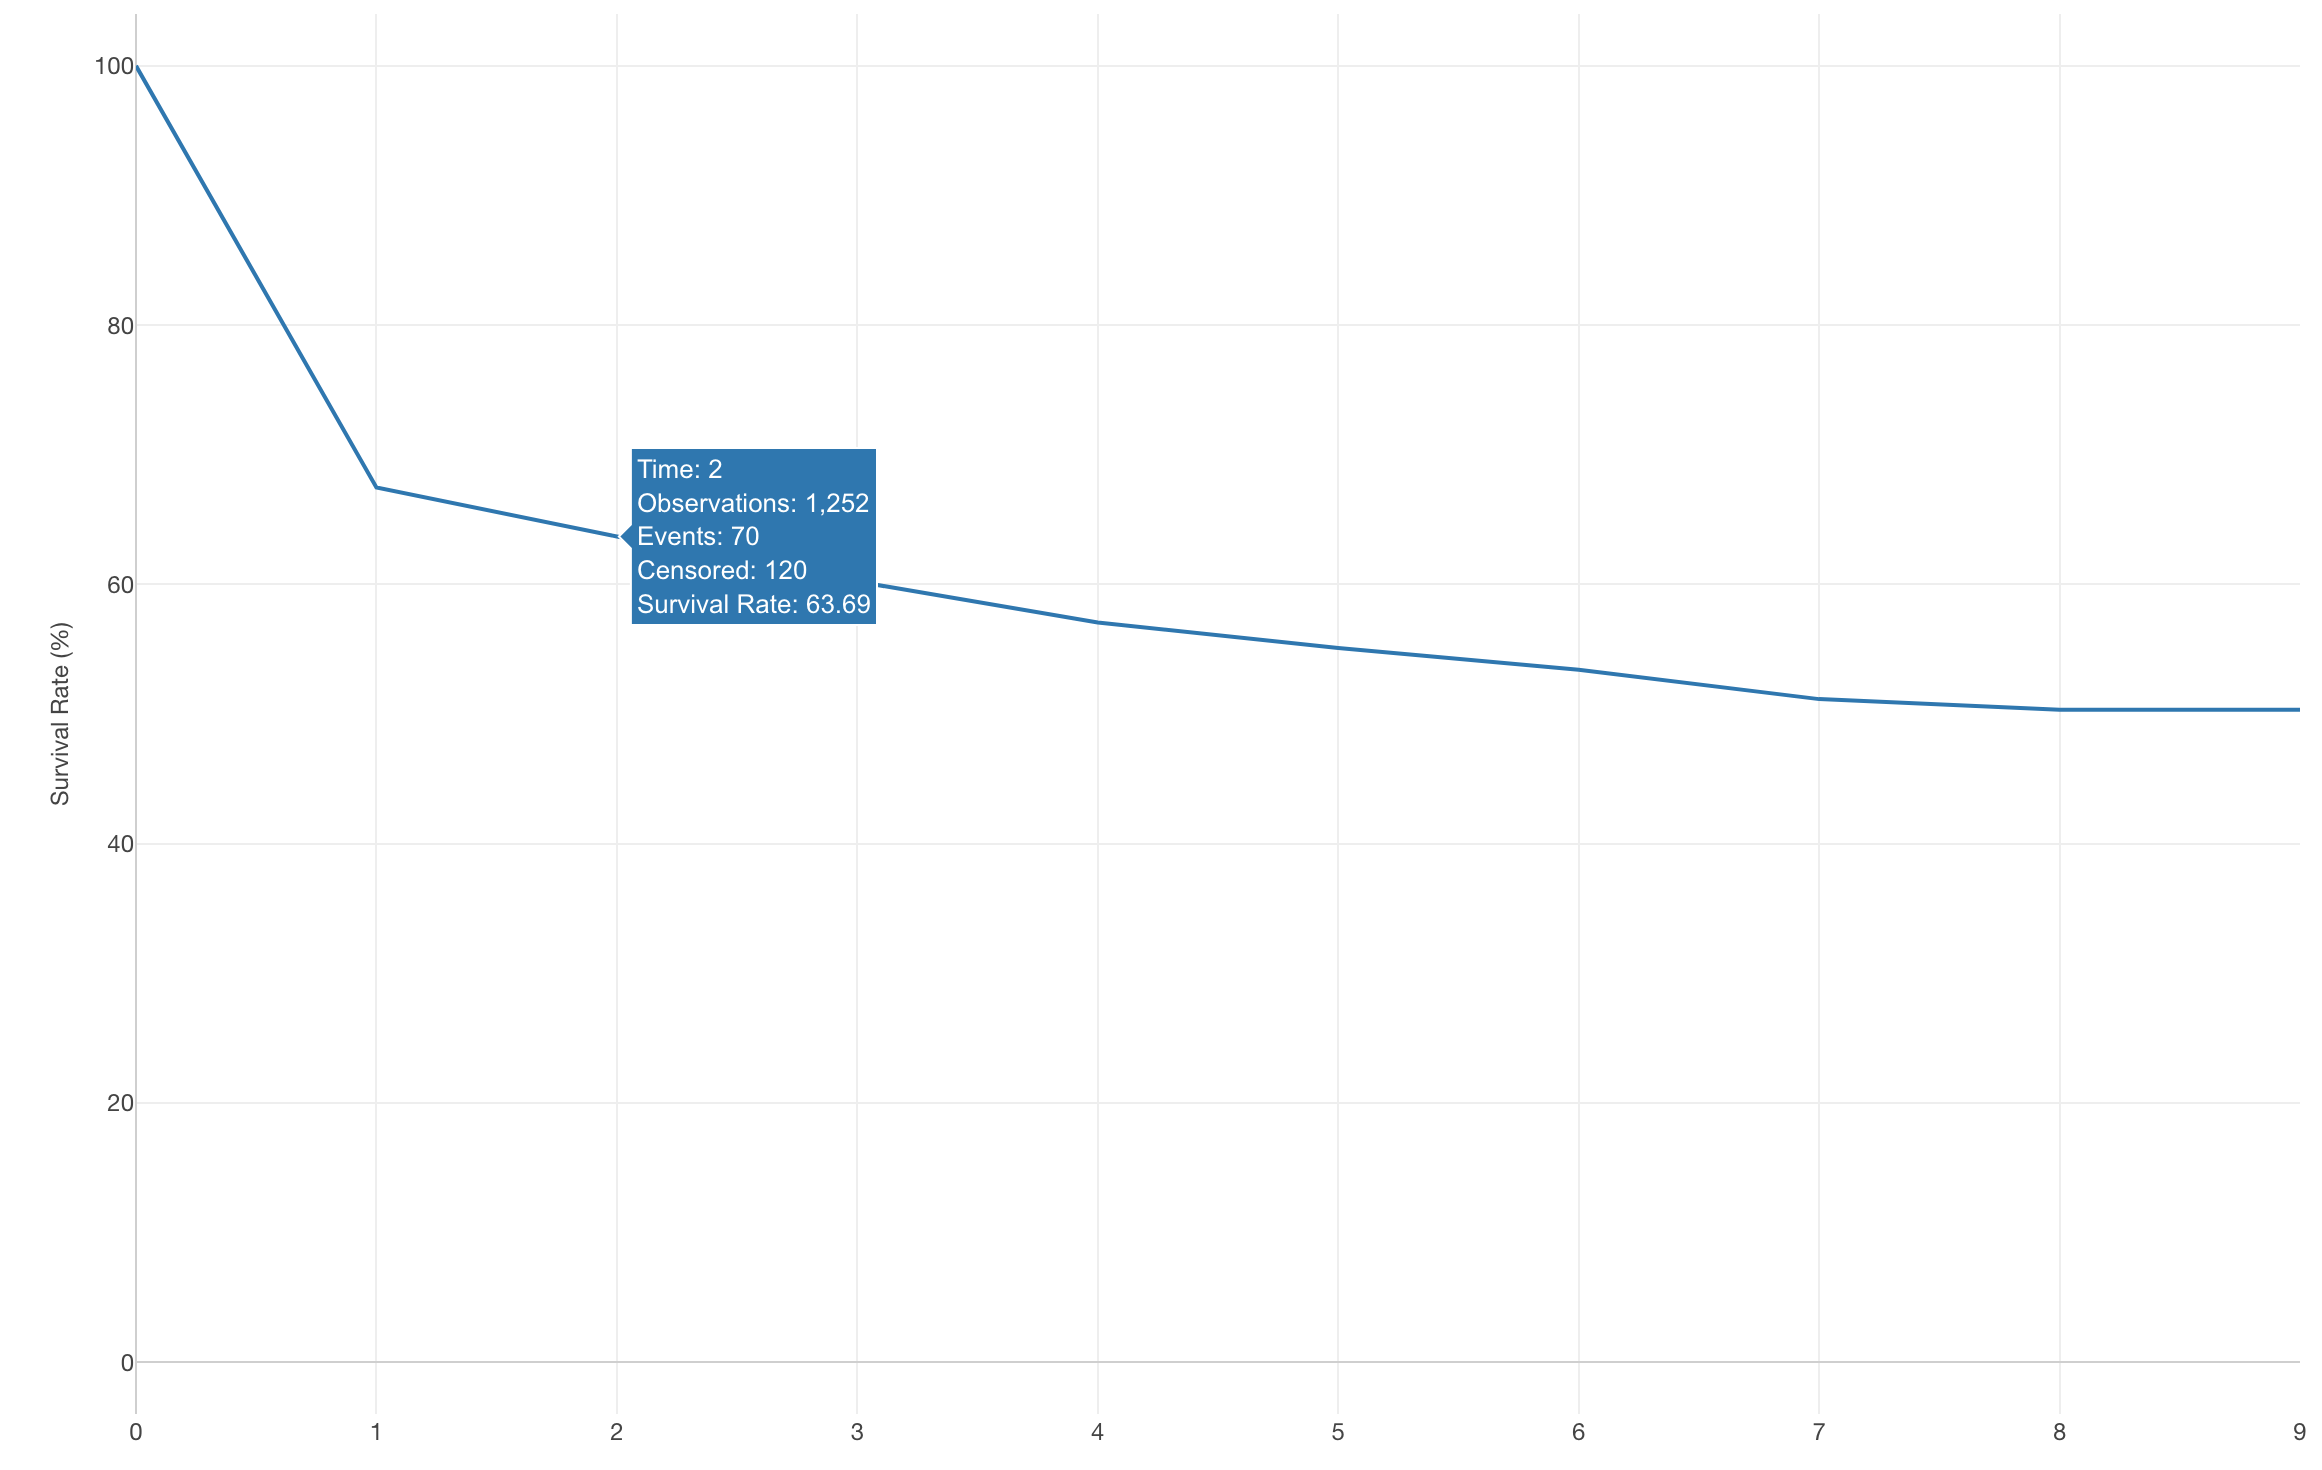
Since the survival rate is about 63% the expected revenue per customer for this period is $63.
0.63 * $100 = $63The survival rate tends to continue to decrease so as the expected revenue.
And the CLV is the sum of all the expected revenue of all the periods till everyone canceled.
Now that we know the logic of how to calculate the CLV using the survival rates, let's actually calculate it in Exploratory.
Calculate CLV with Survival Rates
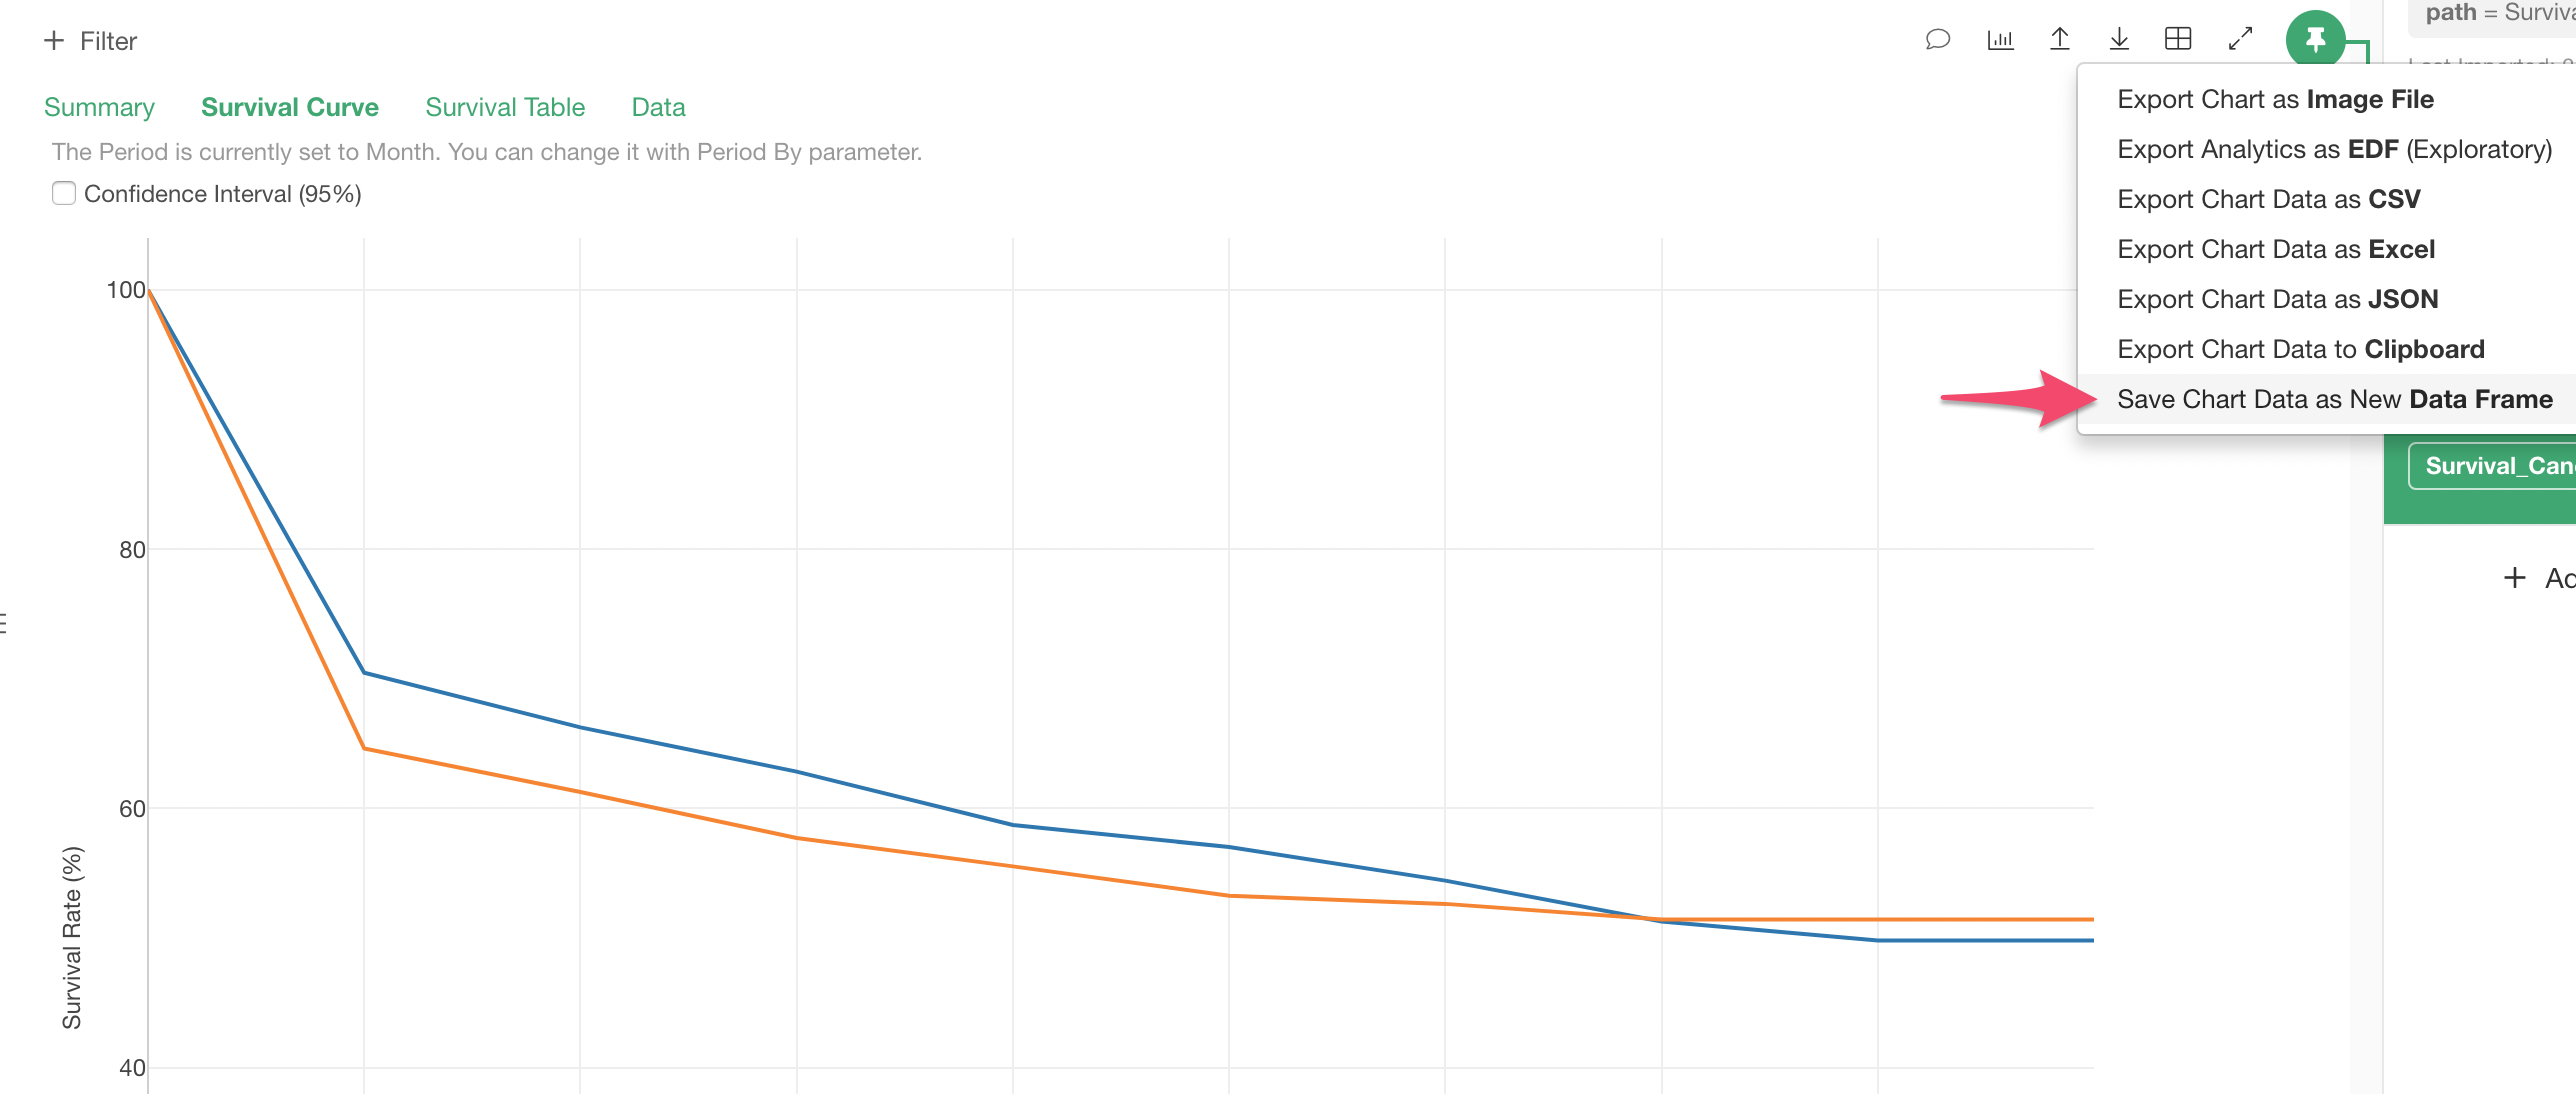
Click the 'Export' button and select 'Save Chart Data as New Data Frame' menu.
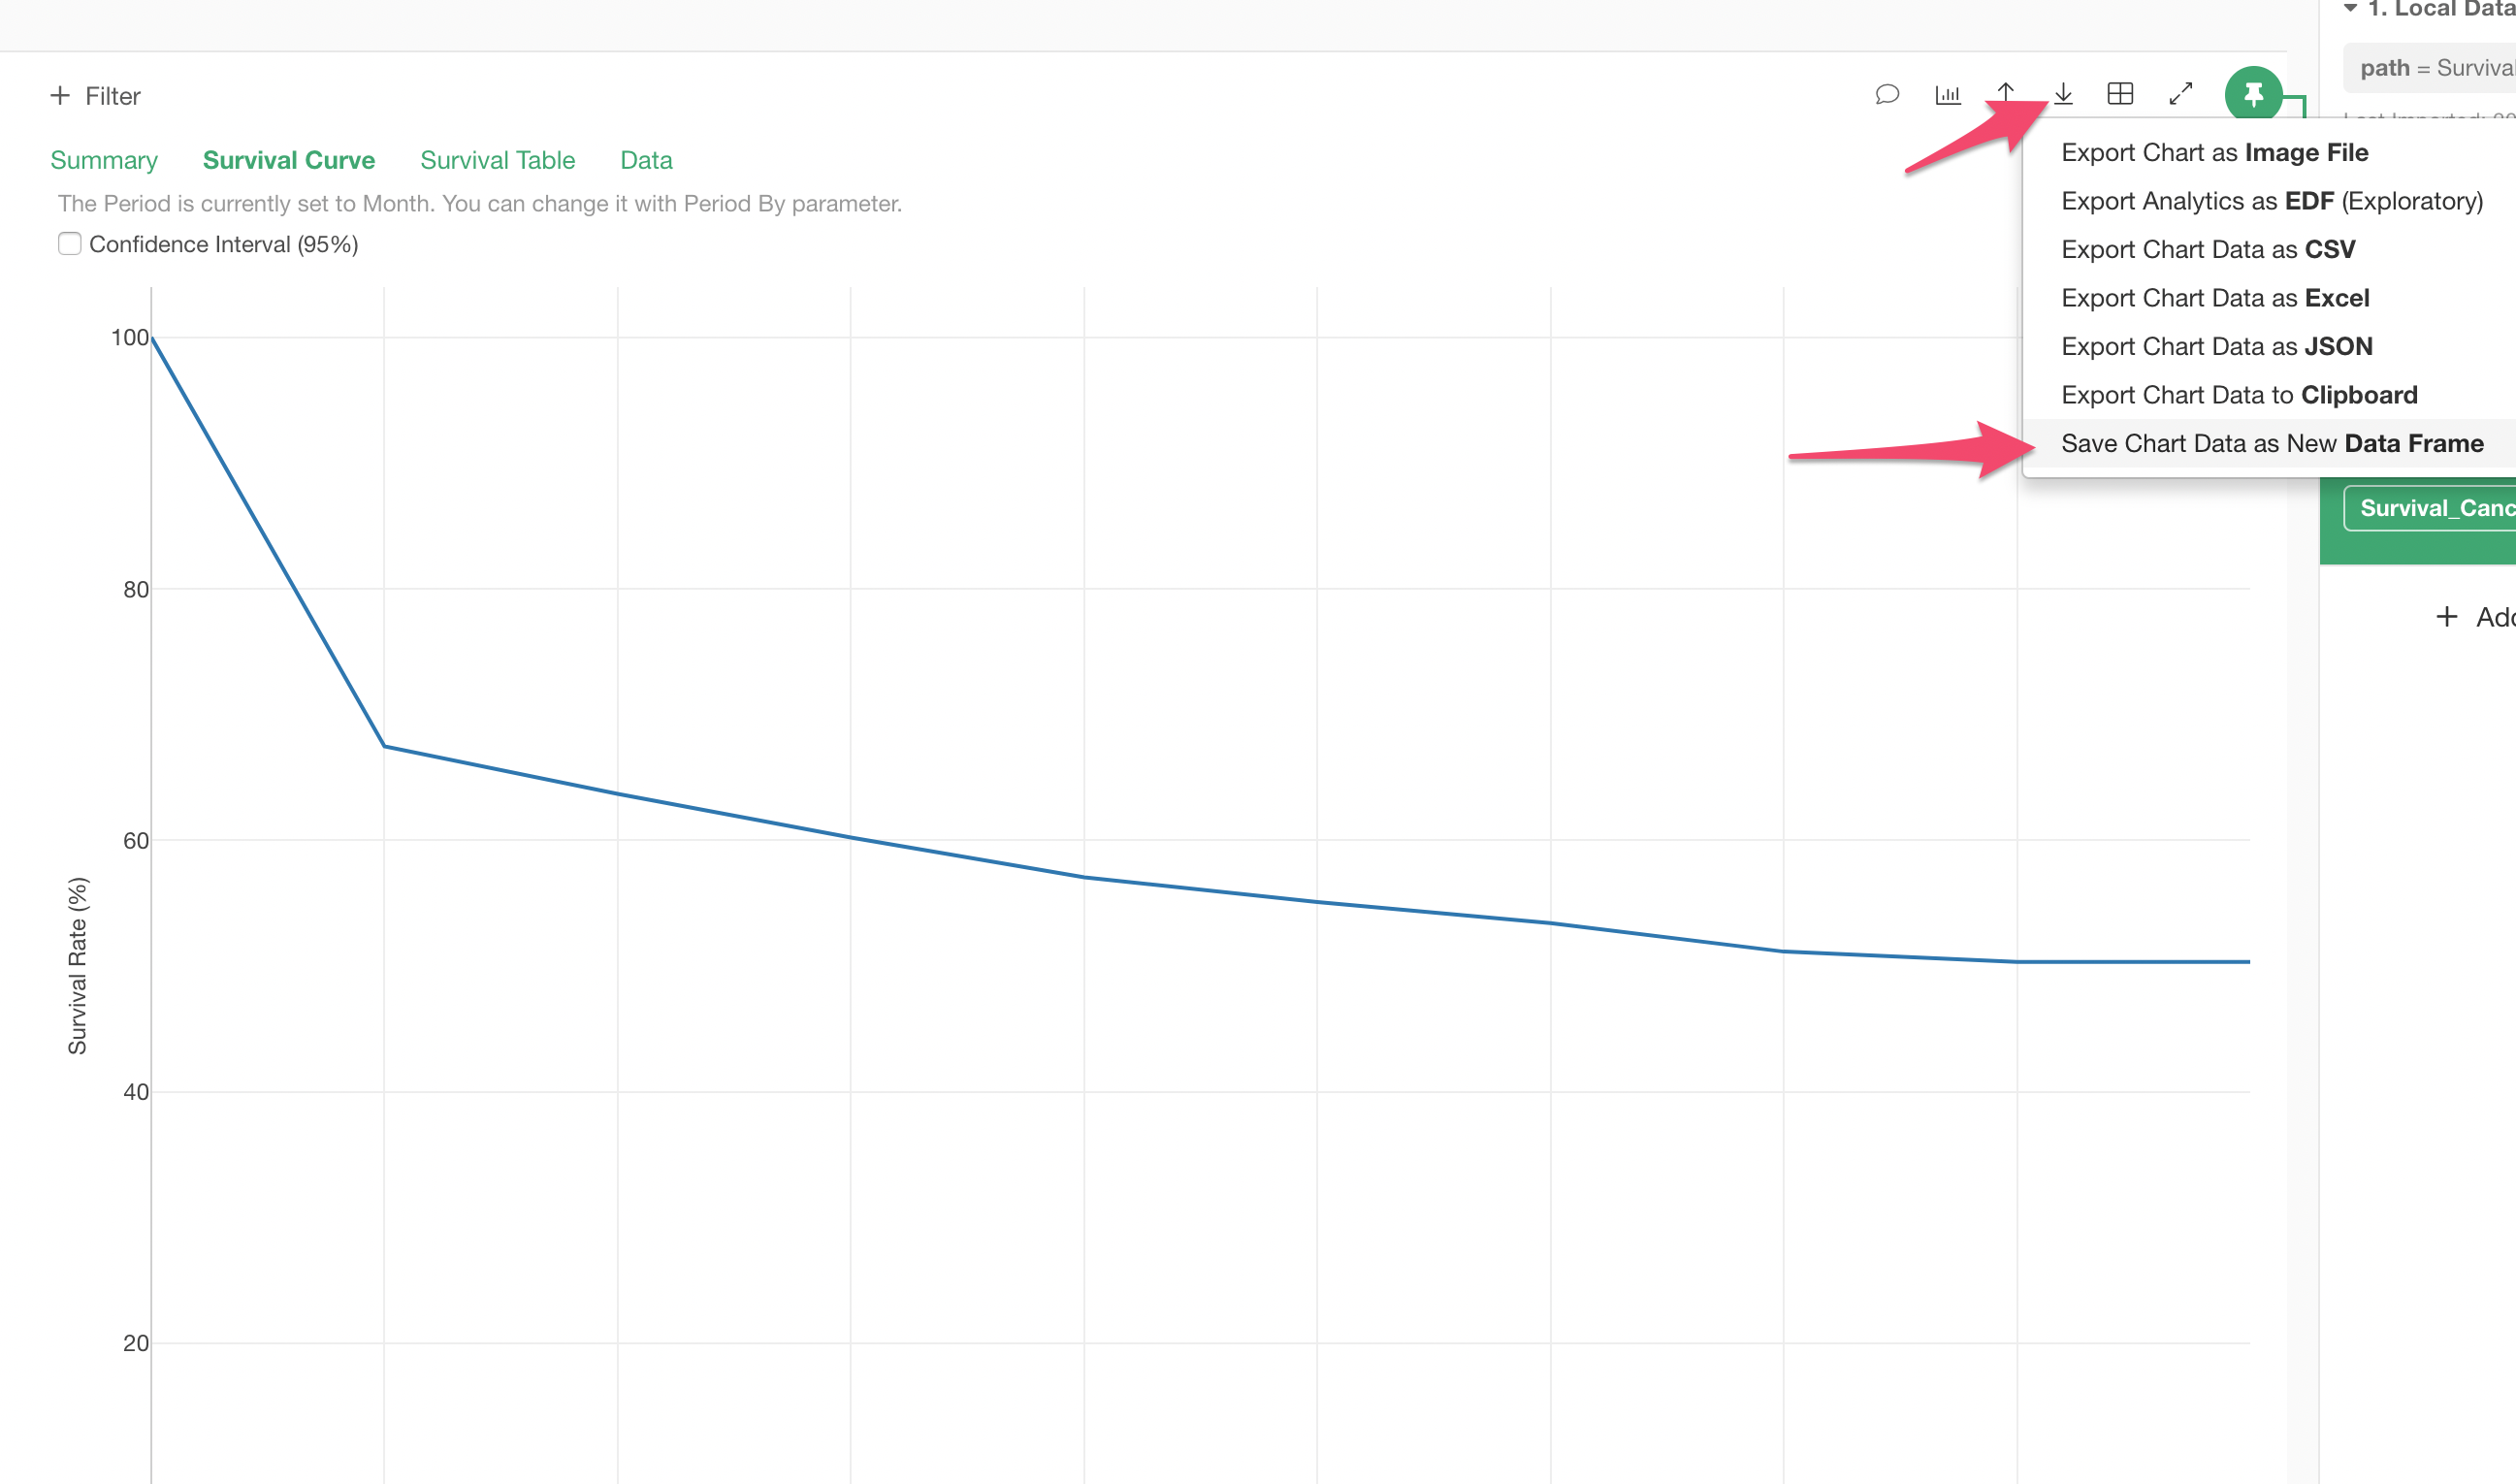
This will create a new data frame based on the exported data.
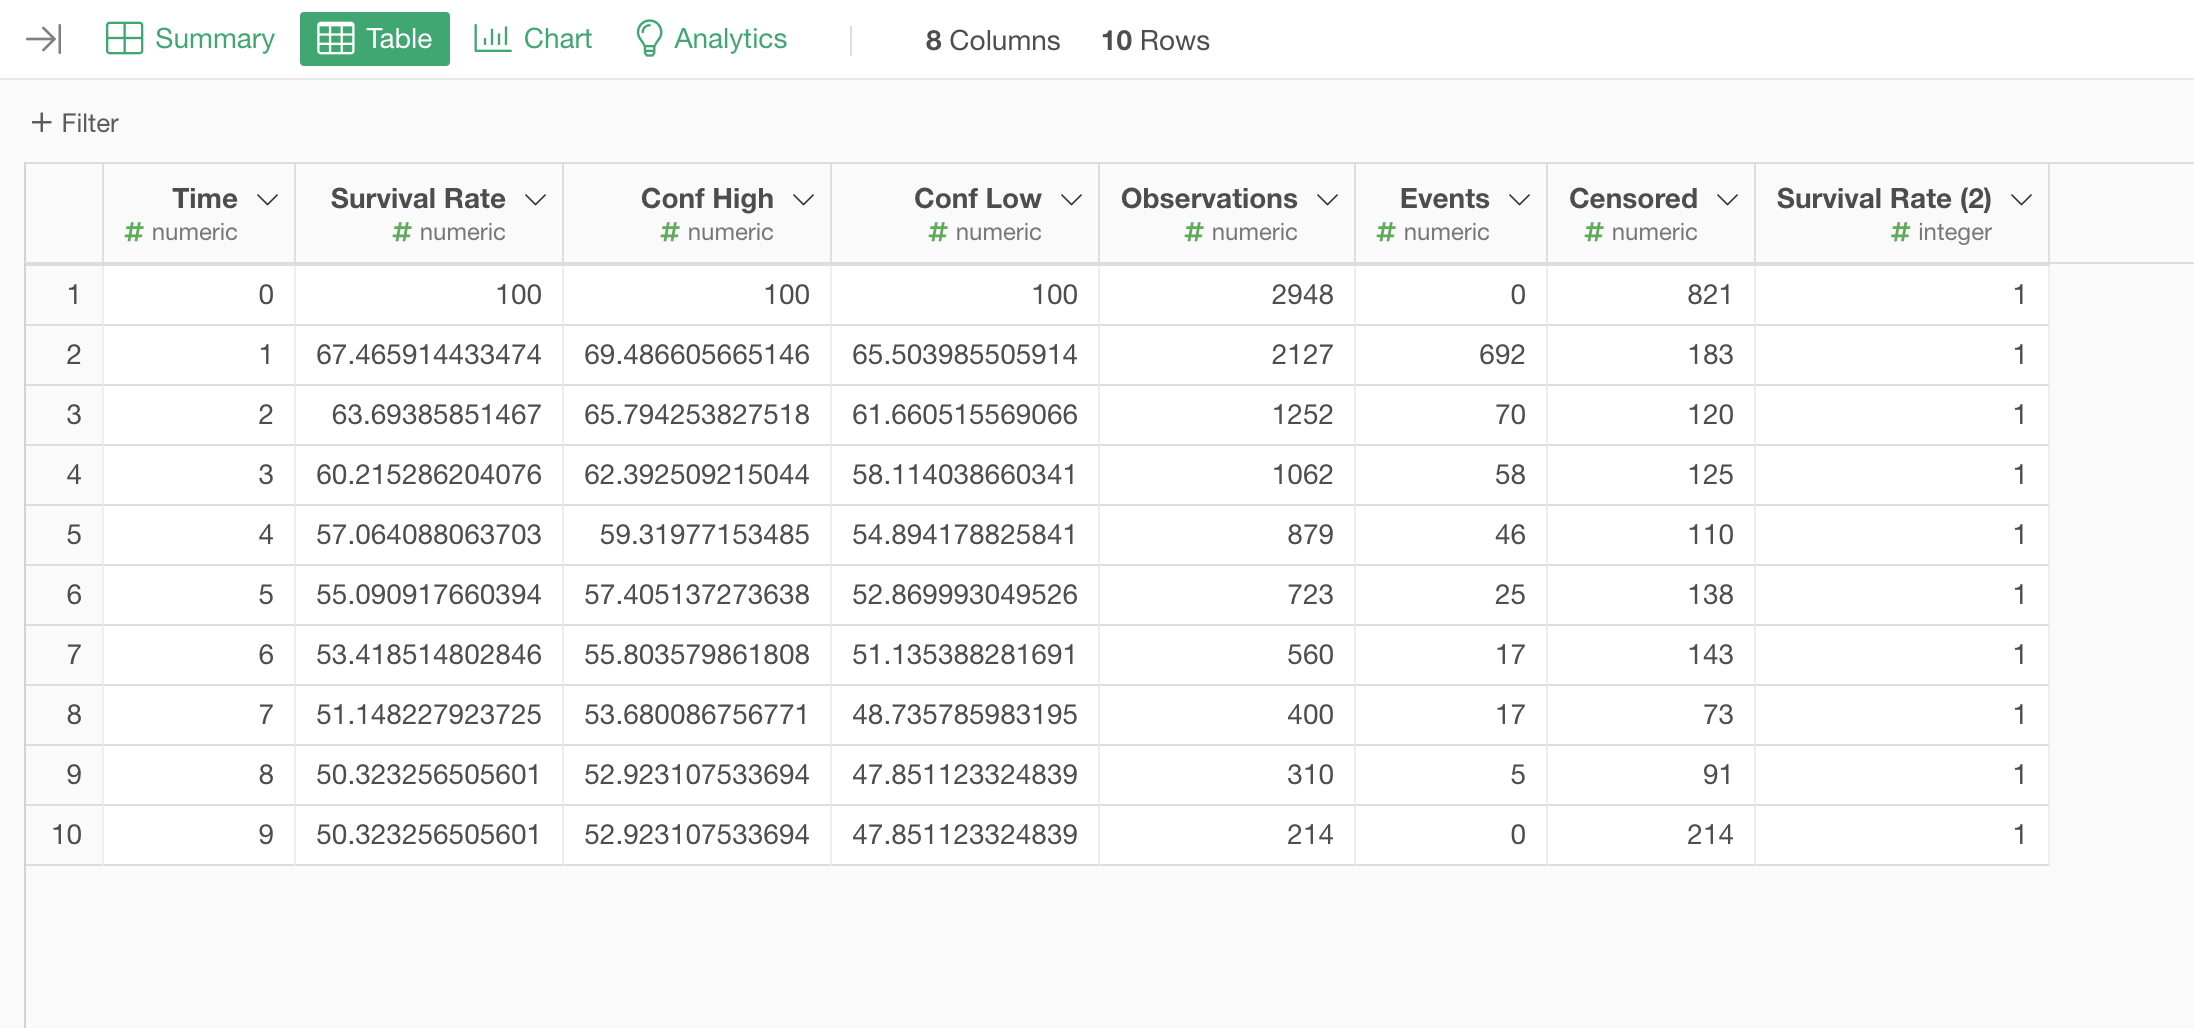
Now we can calculate the CLV by multiplying the recurring revenue of, let's say, $100.
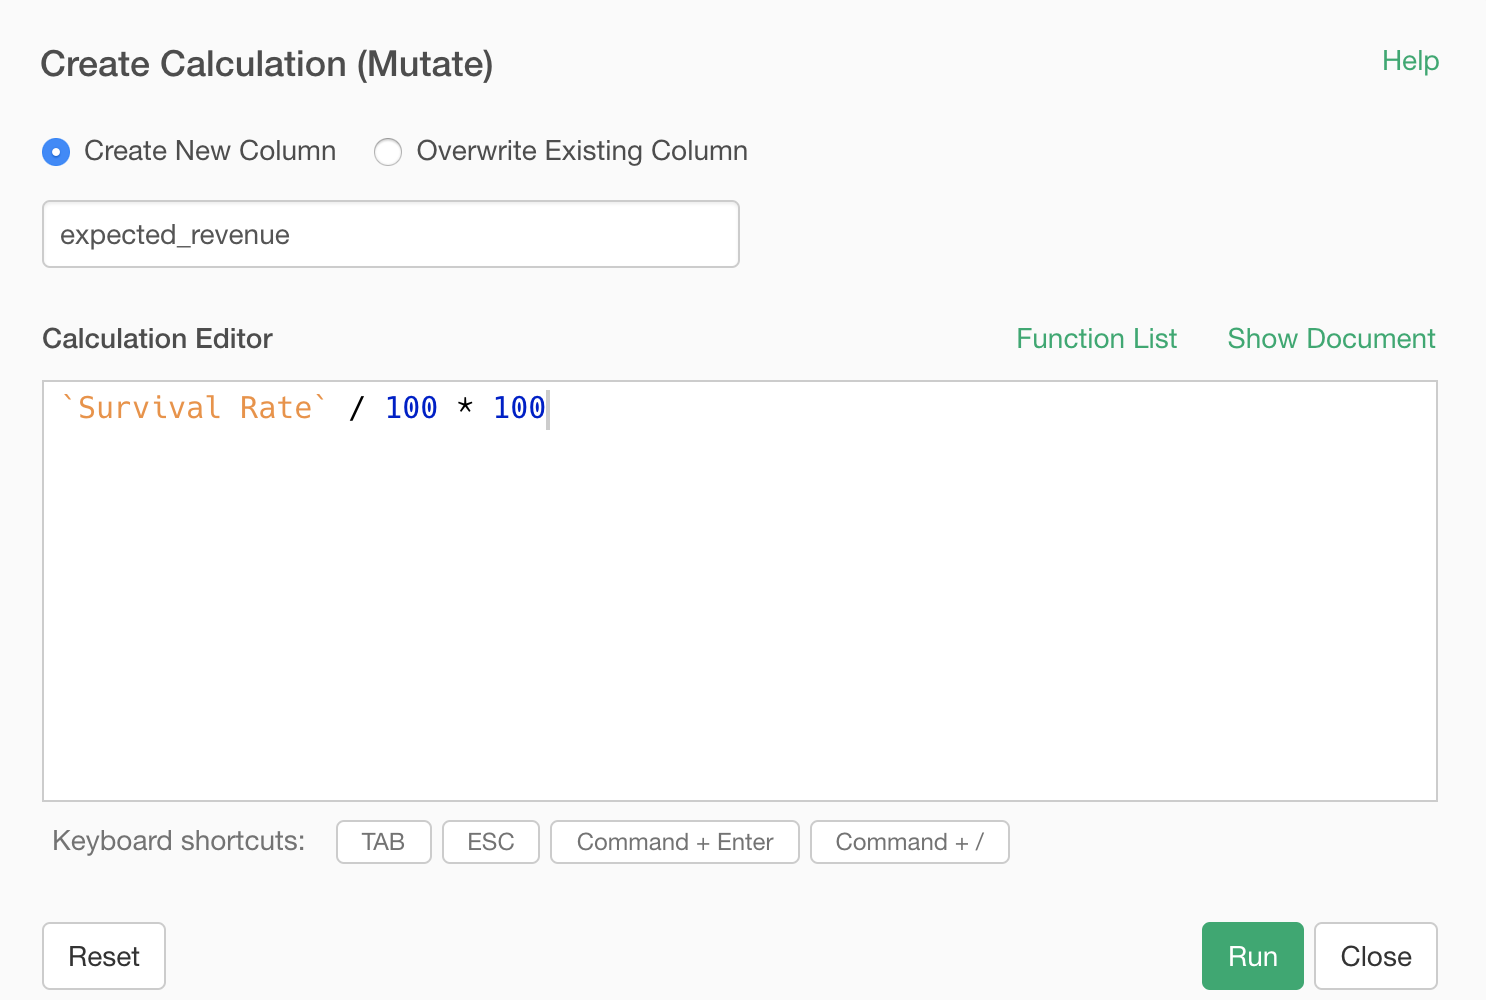
Select 'Create Calculation (Mutate)' from the column header menu of the 'Survival Rate' column.
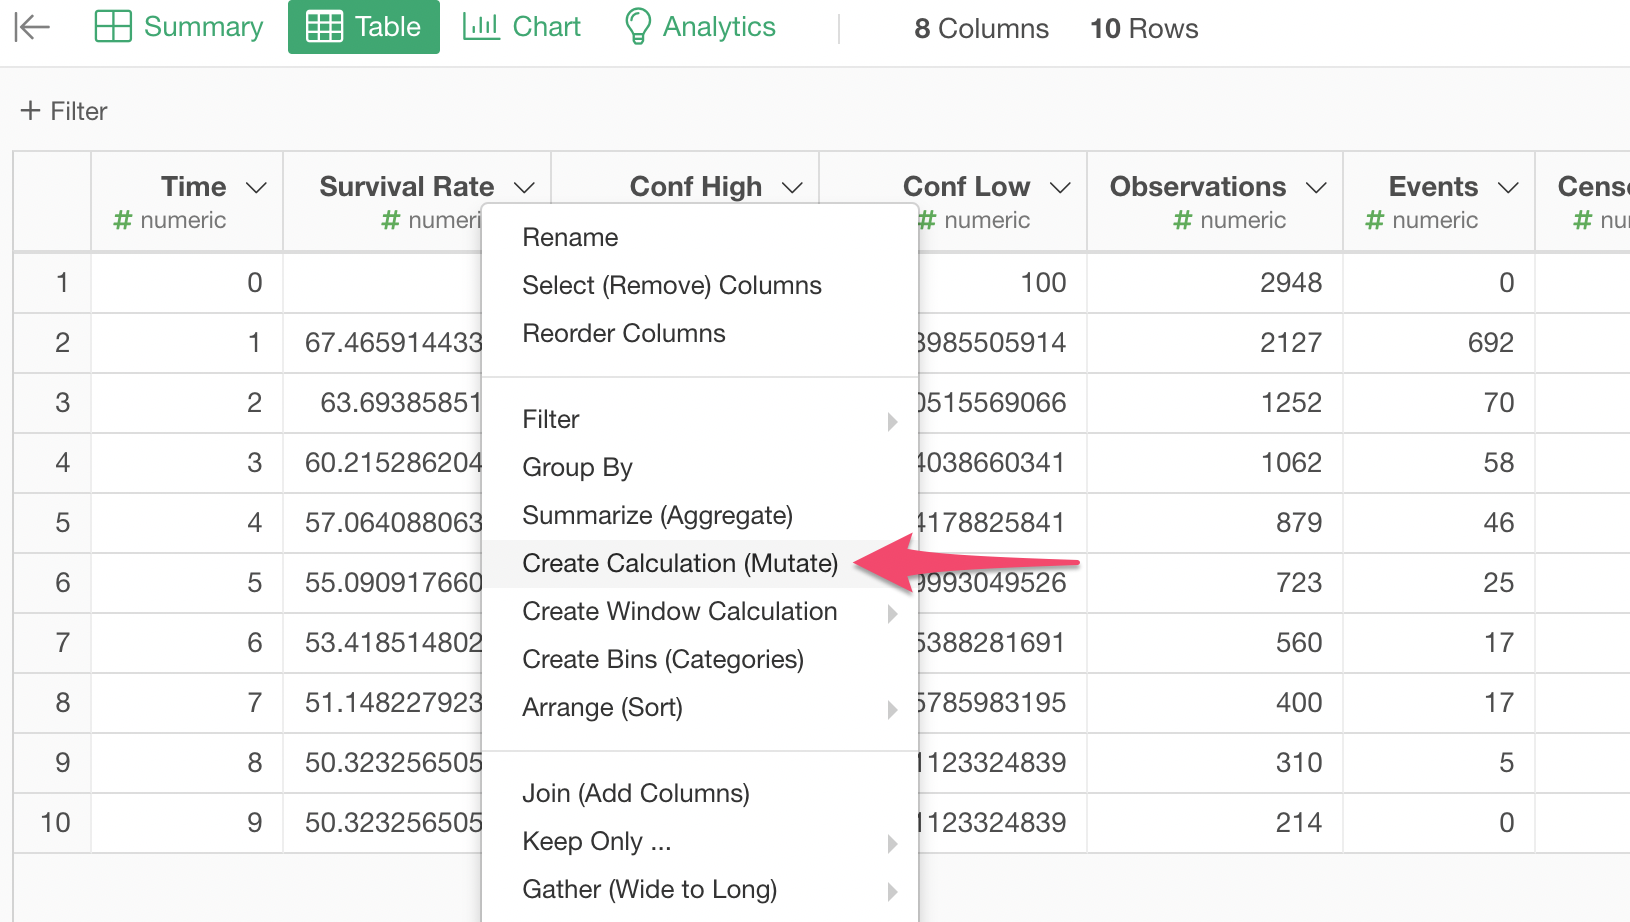
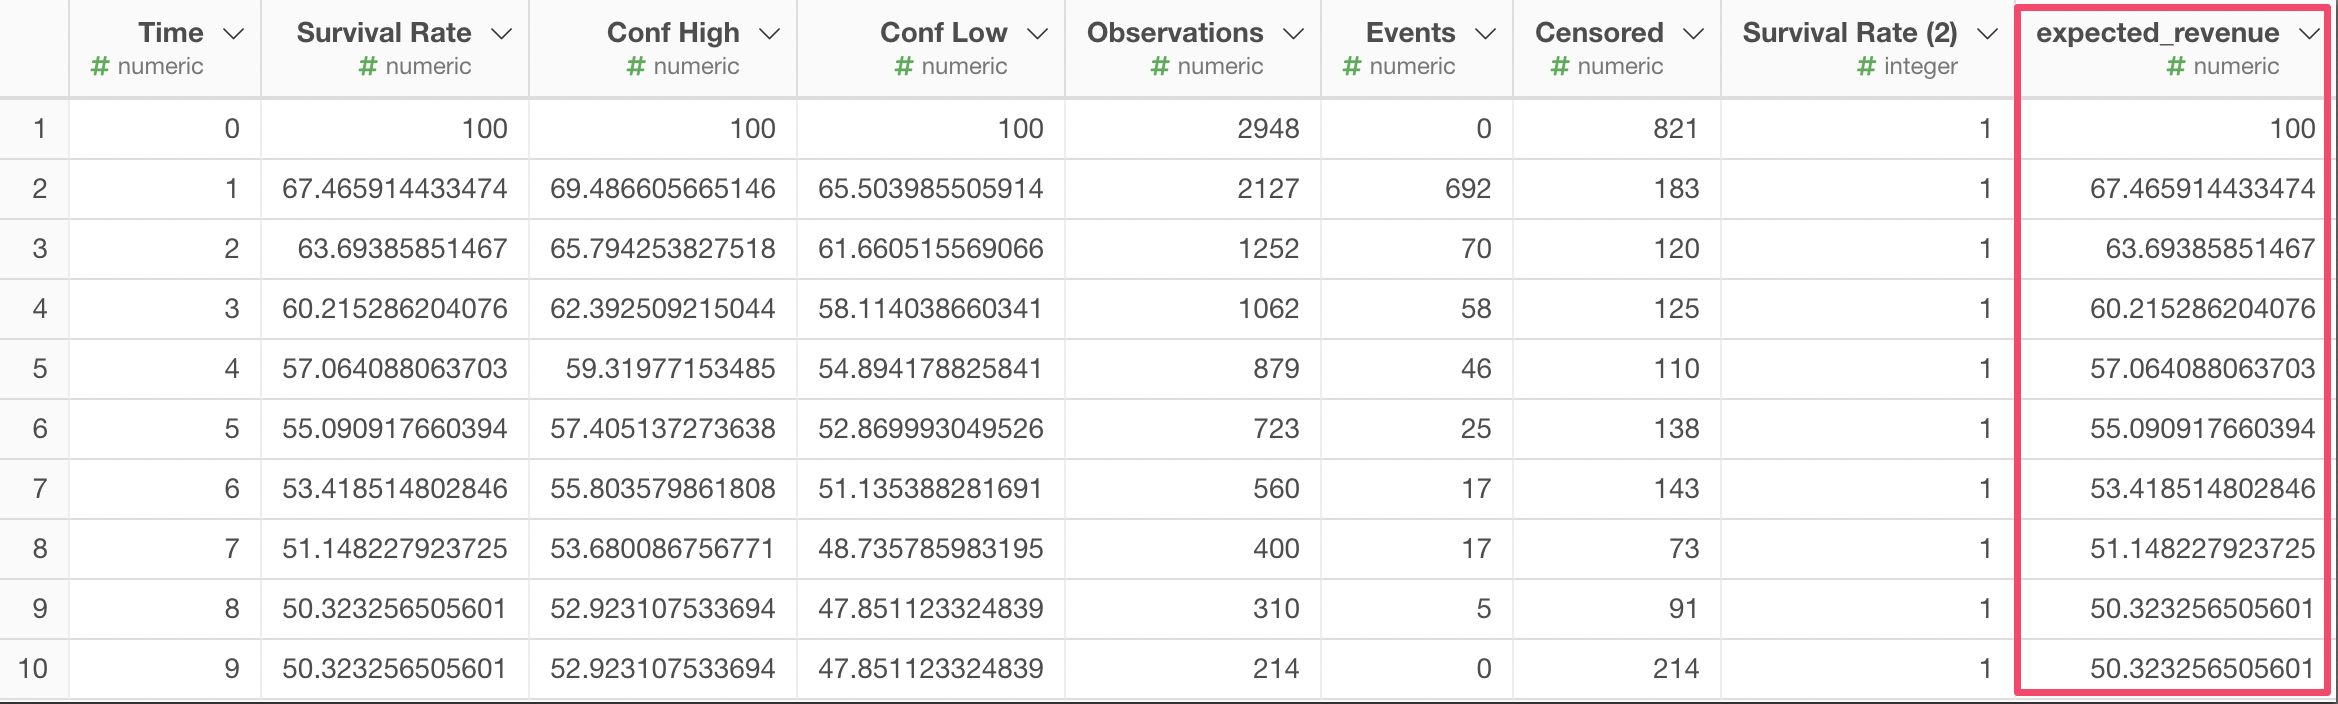
Since the 'Survival Rate' column values are percentage values we need to divide them by 100 first, then multiply by the recurring revenue of $100.
Type the following calculation.
`Survival Rate`/100 * 100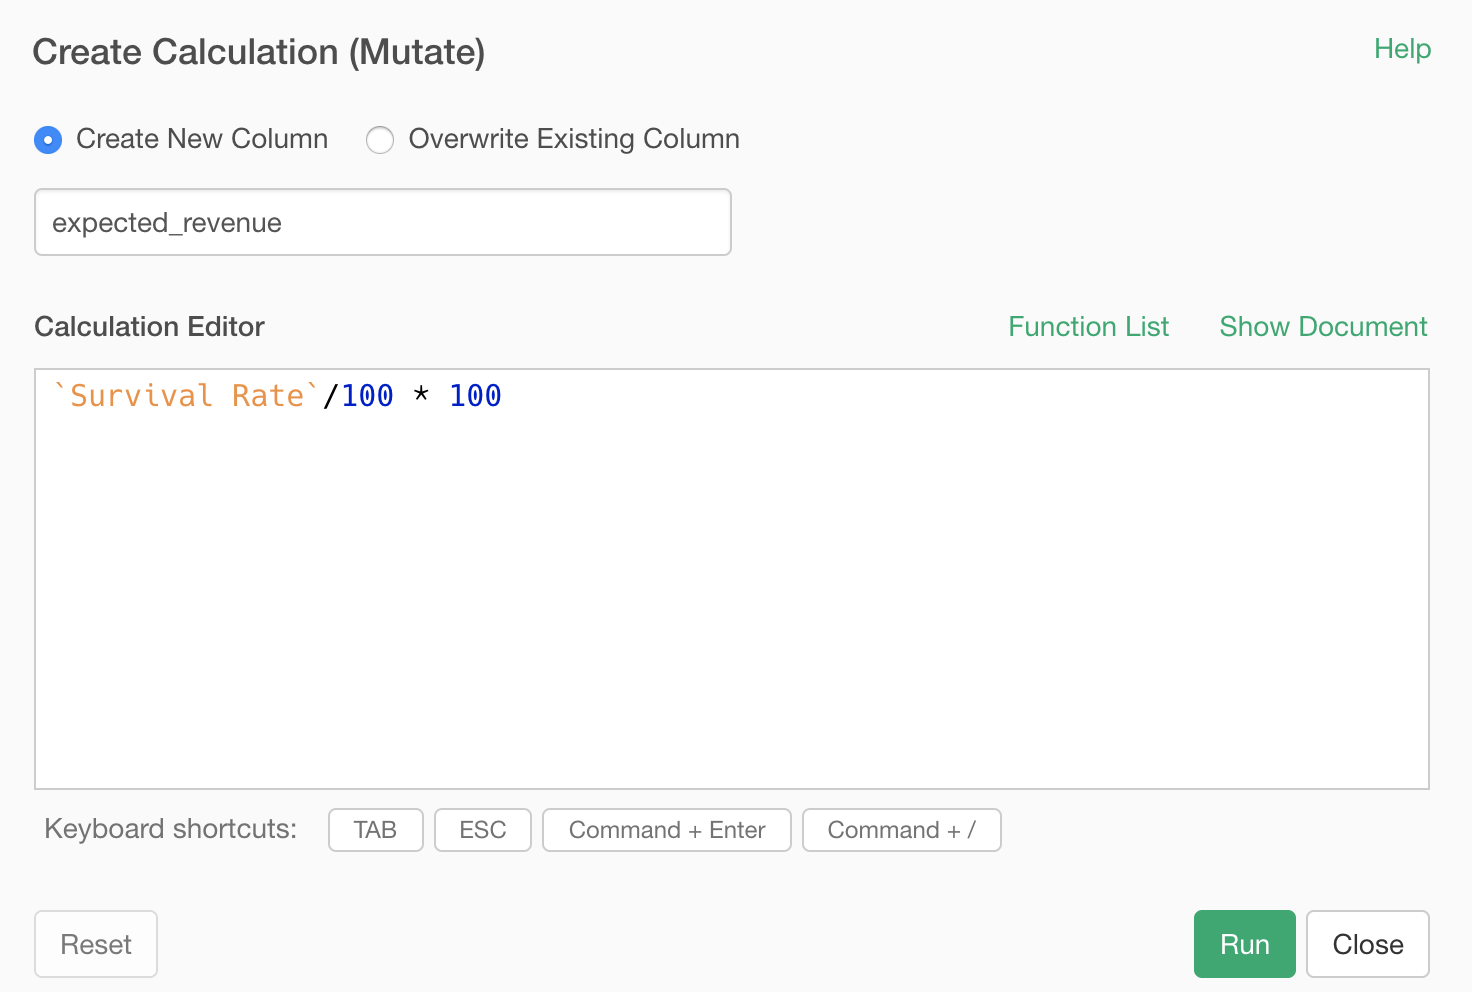
Now we can just sum up all the expected revenue.
The easiest way to do this to use the Pivot Table under the Chart tab.
Select the 'expected_revenue' column to Value and keep the aggregation function as 'Sum'.
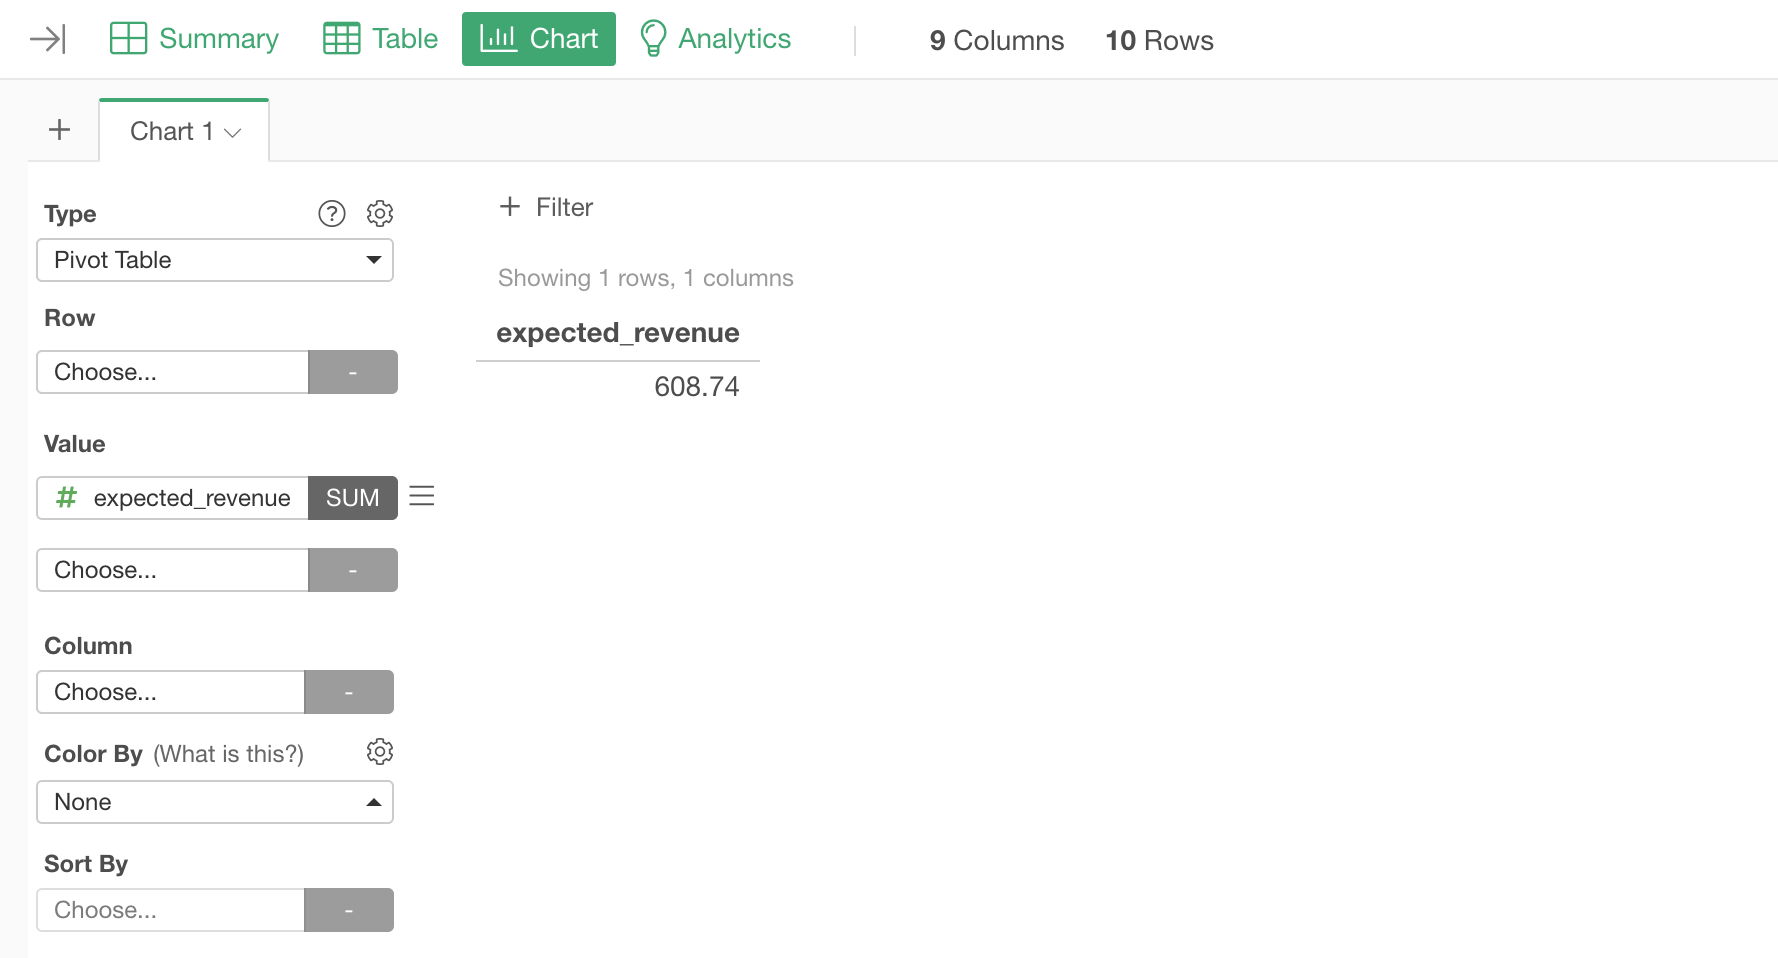
The CLV is $608.74.
Calculate CLV for Each Segment
Do you remember we had the OS column, which indicates which PC operating system a given user uses, in the original data?
Now, what if we want to know the CLV for each OS. In another word, we want to know if the CLV is different between Windows customers and Mac customers, and if any how much is the difference?
This is pretty straightforward.
First, we want to create multiple survival curves for multiple segments.
Go back to the original Survival Curve under the Analytics view, assign the 'os' column to 'Color By', and run.
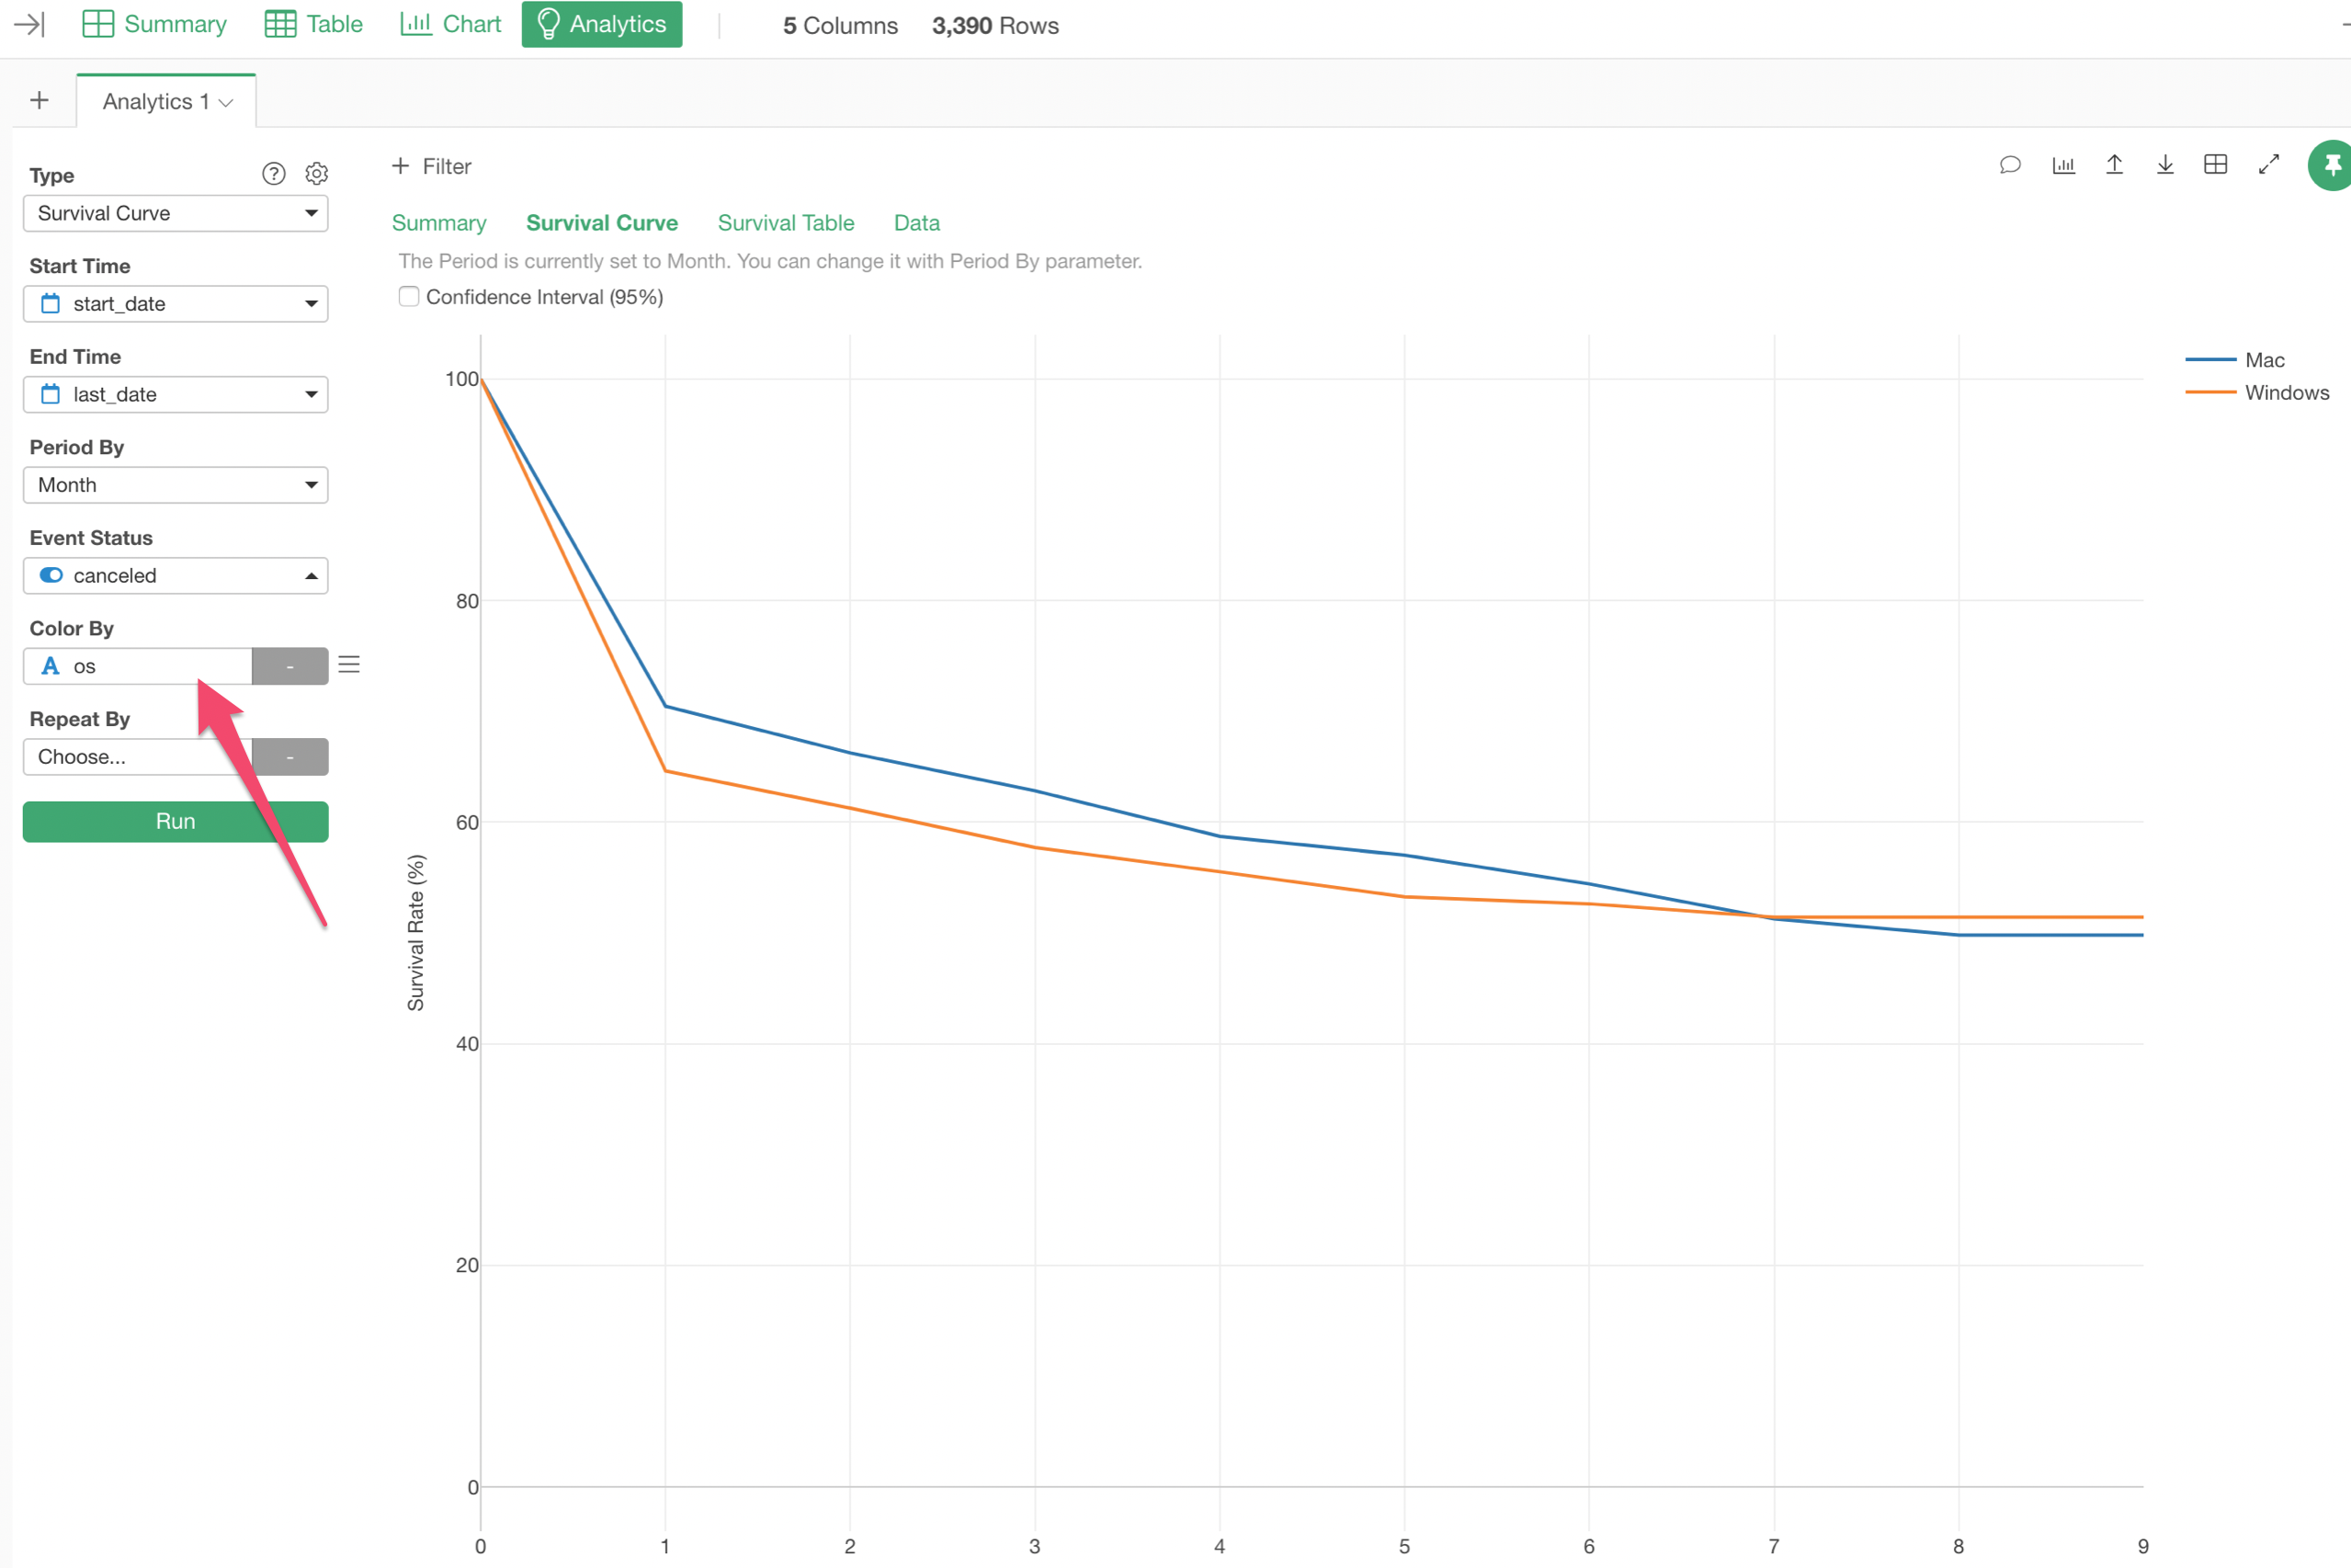
Now we have 2 survival curve lines drawn.
We can export this data and create a new data frame again.
Now we have 2 sections of data, one for Mac and another for Windows.
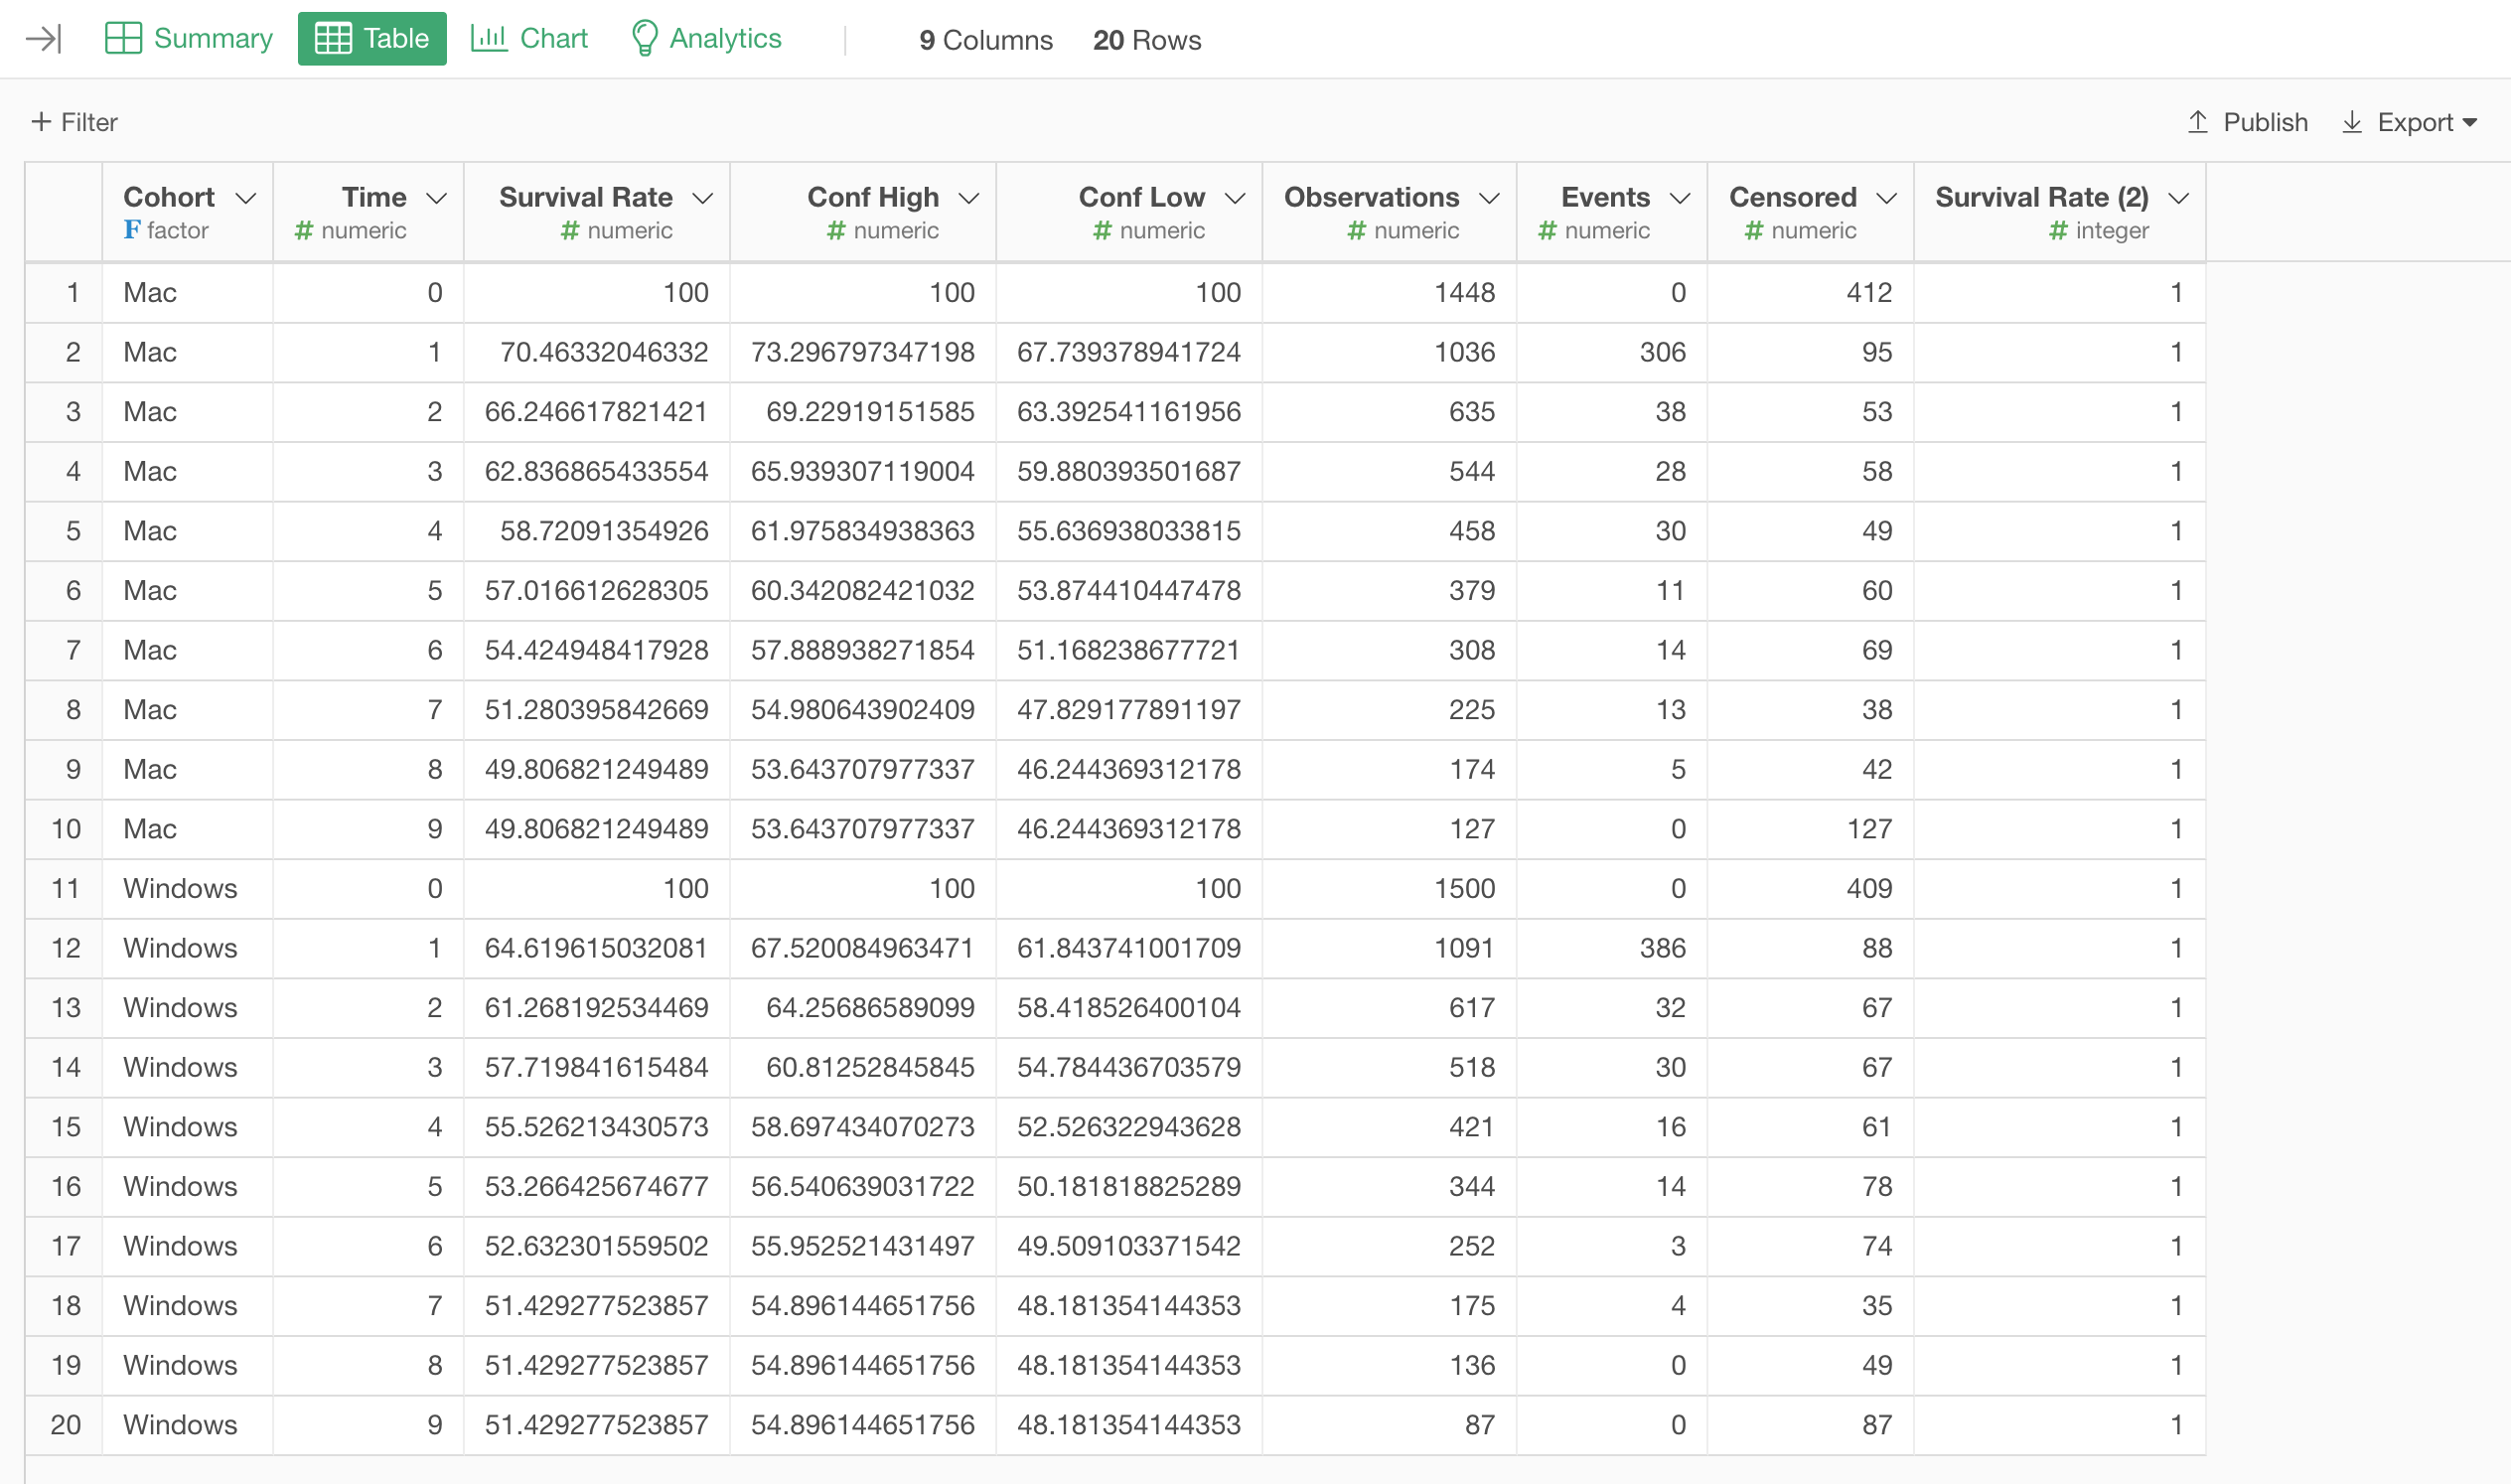
Calculate the expected revenue just like we did before.
Go to the Table view and create the Pivot Table, the same way we already did before, but this time we want to assign the 'Cohort' column to the Row.
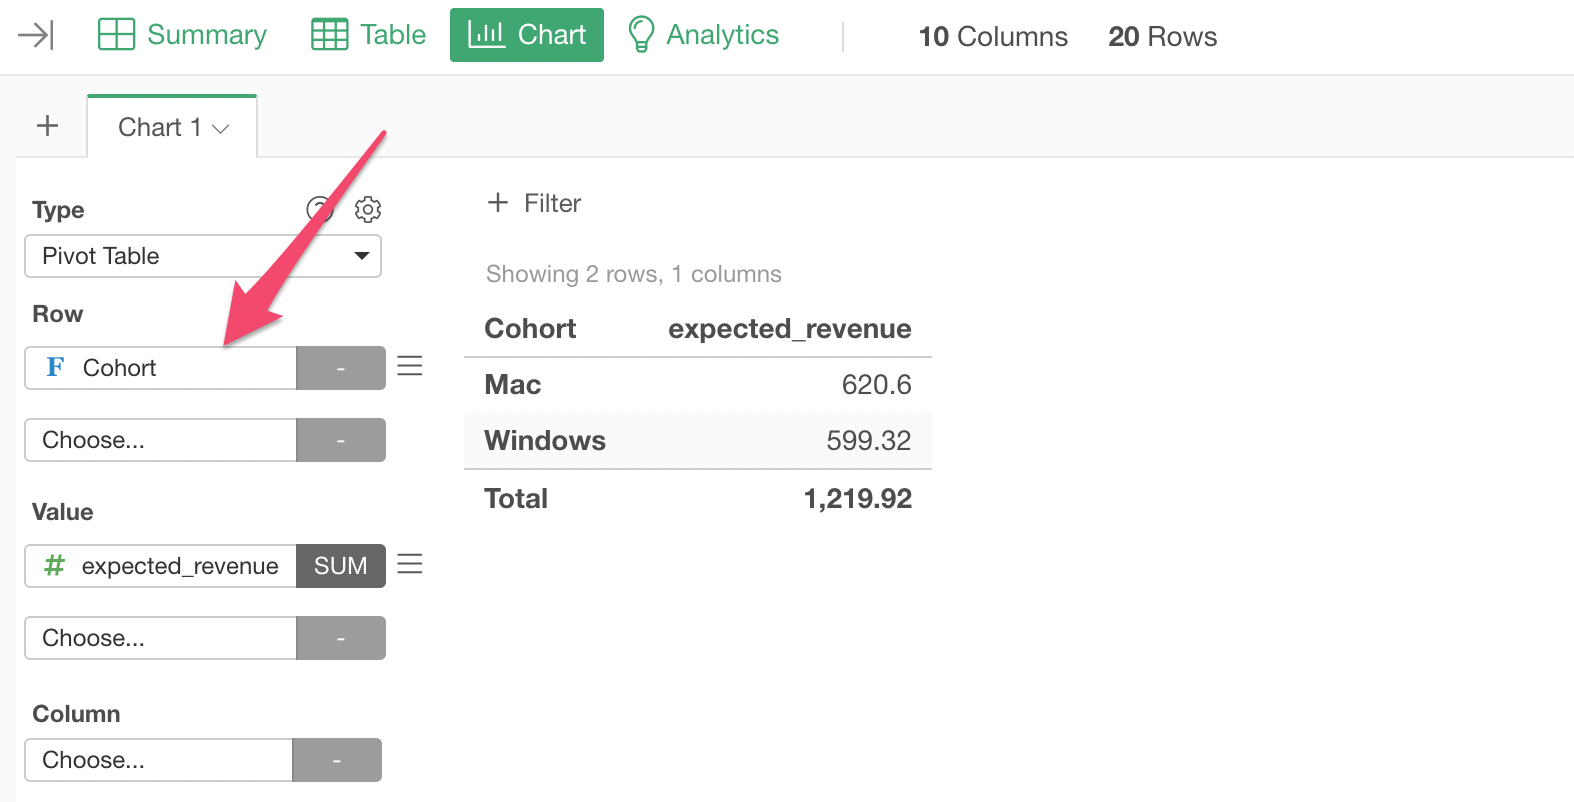
Now we have the CLV calculated for each OS.
It is $620.60 for Mac users while it is $599.37 for Windows users.
Things to Consider
Calculating the CLV using the survival rate reflects the actual patterns of customer retention (or churn), and it is a much better way to estimate the CLV rather than simply multiplying the same recurring revenue to all the periods.
But there are some limitations.
Not Enough Data Yet
With the survival curve, the survival rates can be calculated only for the periods for which you have data. If your service is in the market only for a short period of time (say, 6 months) the CLV calculated here is the total expected revenue per customer for the 6 months, but most likely your customers will use your service beyond the 6 months, I hope!
In such cases, you might want to go with the simpler version, which was introduced above, to calculate the CLV knowing that the churn rates can change quickly so this CLV might not be so reliable to evaluate how much you can spend.
Discount Rate
Another thing is that the value of dollars (or any currency) can be different over time. $100 today is different from $100 in 3 years because you can expect more than $100 if you keep the $100 in a bank with healthy amount of interest rates.
This is called Discount Rate. I'll create another note to demonstrate how you can calculate the CLV accounting for the discount rate.