Calculating Duration Between Order Dates for Each Customer with ‘lag’ Function
Let’s say we have a customer purchase order data, and we want to understand how long does it take for customers to order the next orders.
Another word, we want to calculate the durations between the order dates for each customer.
You can do this by using ‘lag’ function, which returns the previous value. Once we get the previous ‘order date’ then we can calculate the difference between the previous and the current order dates.
We want to do this for each customer, so we can ‘group’ the data by customer with the ‘Group By’ step before using the ‘lag’ function.
Here is how you can do in more details.
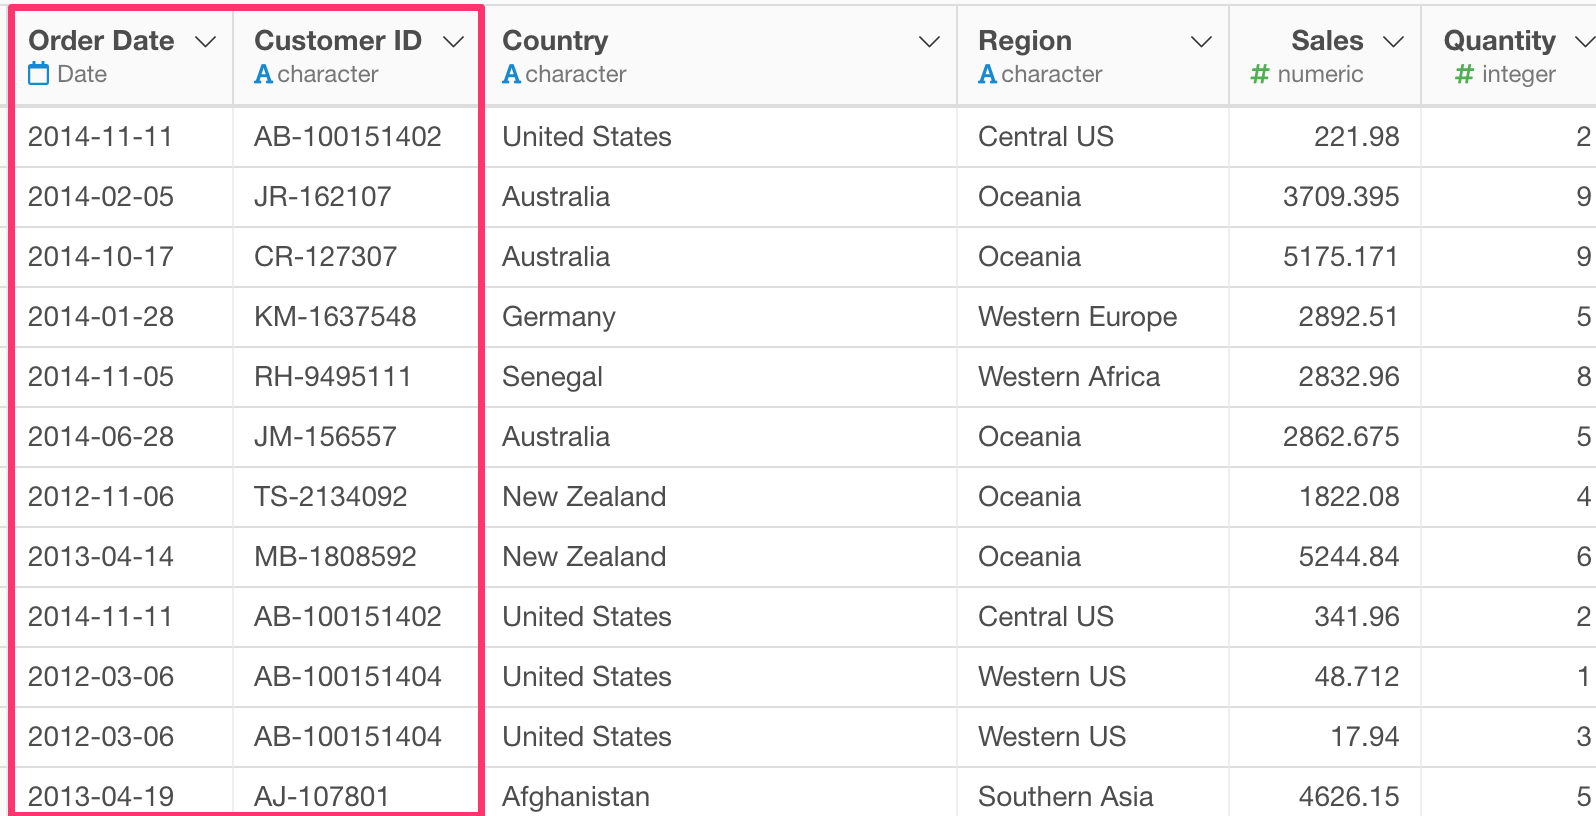
Sample Data
We have Order Date and Customer ID columns as follows.
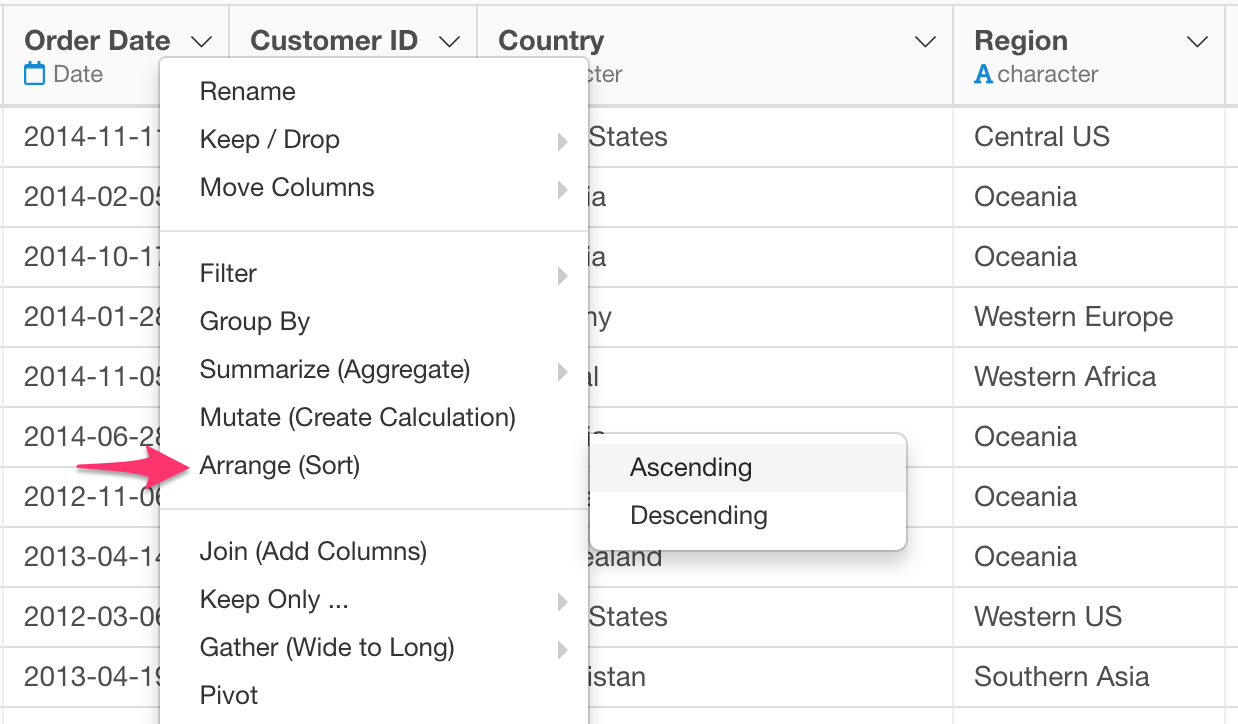
Sort (Arrange) Data
We’re going to calculate the difference between the current date and the previous date by using a function called ‘lag’, which returns the previous row’s value. But this means that we need to make sure the ‘previous’ row’s date is really the ‘previous’ date.
What I mean is that the data might not have been sorted by the order date yet.
We can quickly sort the data by the ‘Order Date’ column by selecting ‘Arrange’ from the column header menu.
Group the Data
Select ‘Group By’ from the column header menu.

Now we see the data grouped by customer, which is indicated by color.

Calculate Differences Between Current and Previous Dates
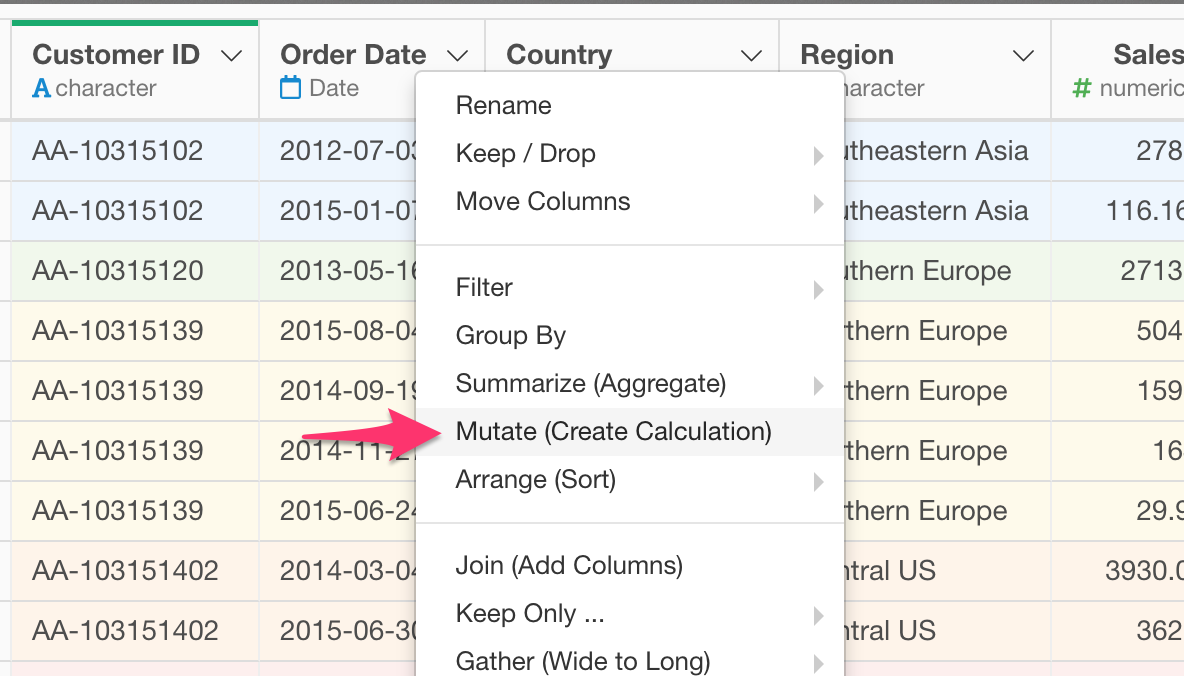
Select ‘Mutate (Create Calculation)’ from the column header menu of Order Date column.
And type something like the following.
`Order Date` - lag(`Order Date`)This is basically subtracting the ‘previous’ order date from a given date.

When you run it, the new column will be created like the below.
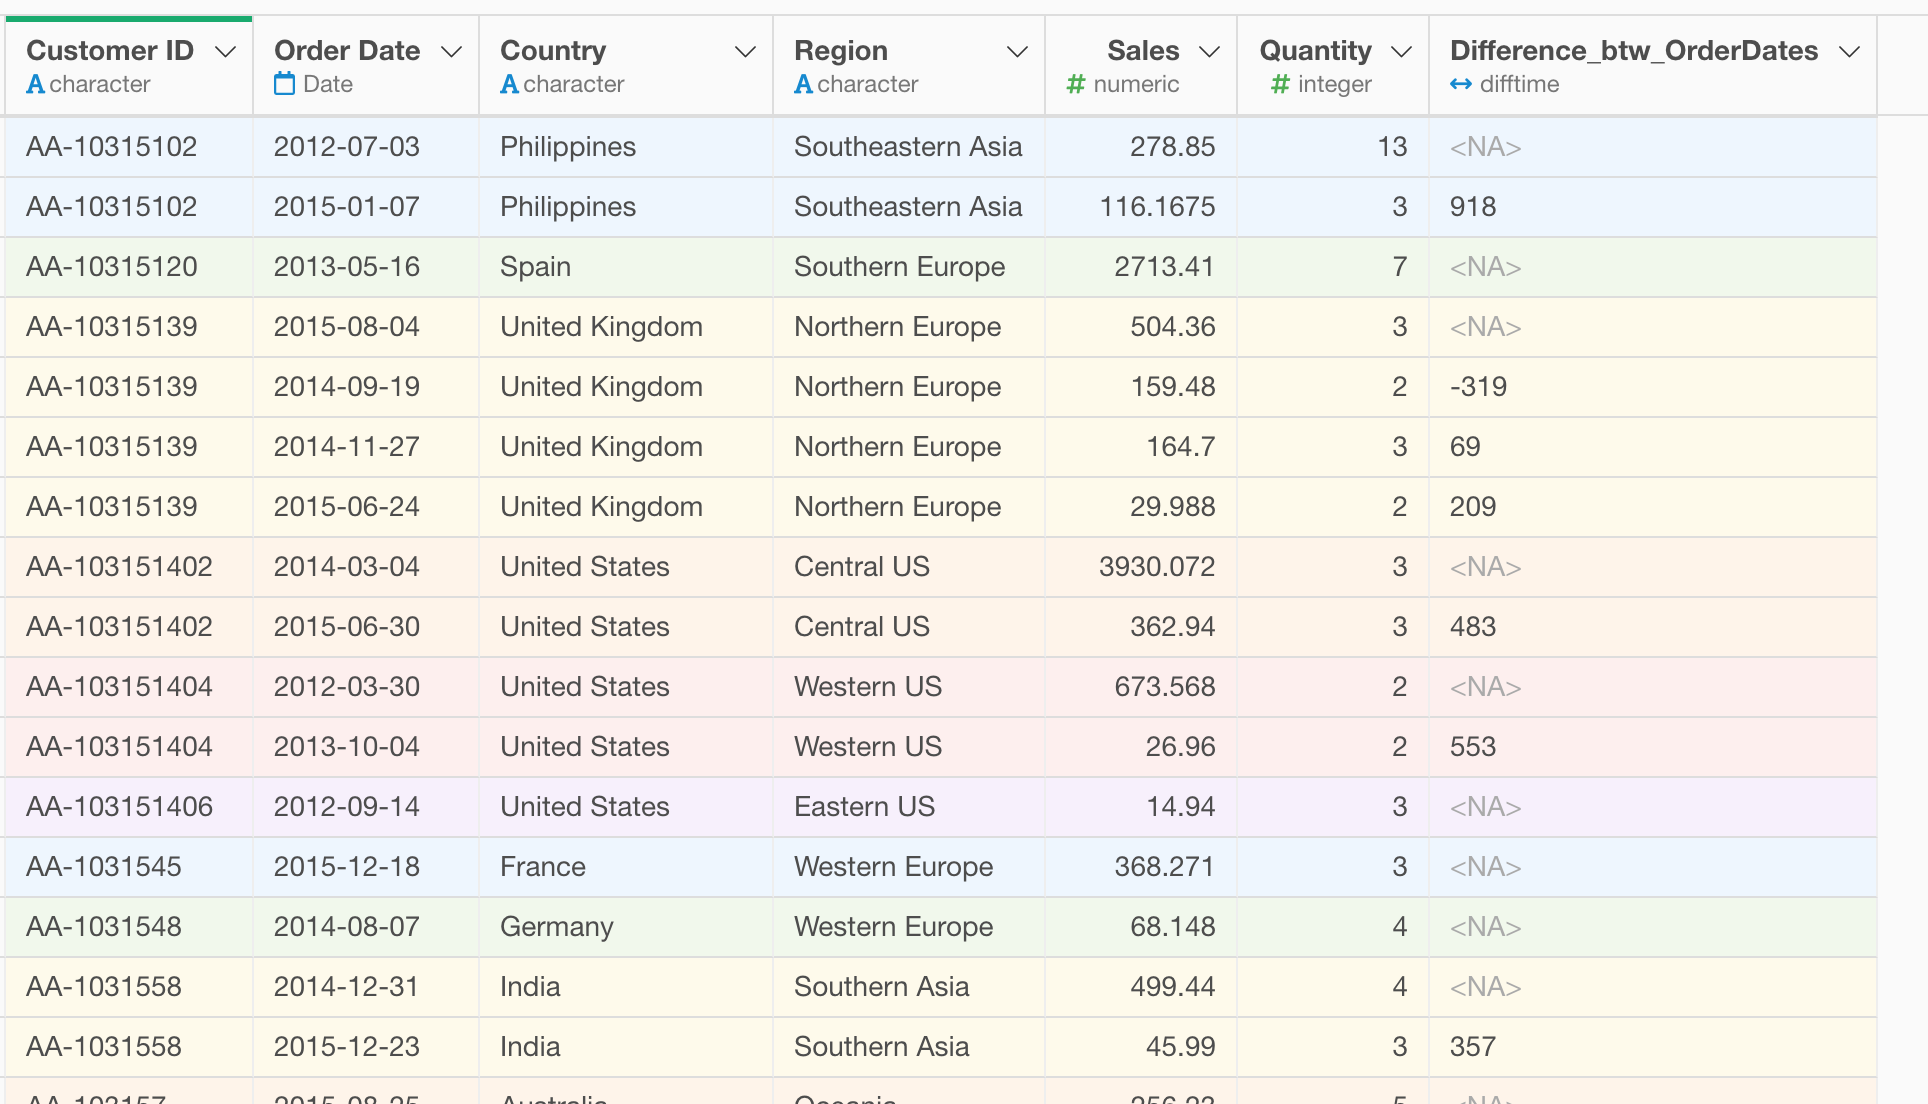
The calculated result is generated as ‘difftime’ data type, which is basically the difference between the two dates. The unit depends on the original data type of the date data. If the data type is ‘Date’ then the unit for the difftime data is ‘Day’. If the data type is ‘POSIXct’ then the unit would be ‘Second’.
In this case, the original data ‘Order Date’ was Date data type, so this new ‘difftime’ column’s unit is ‘Day’.
Un-group the Data
When the data frame is grouped (e.g. by customer) all the following operations will be affected by the setting. In this particular scenario we won’t have much of a problem except that the performance would suffer a little bit.
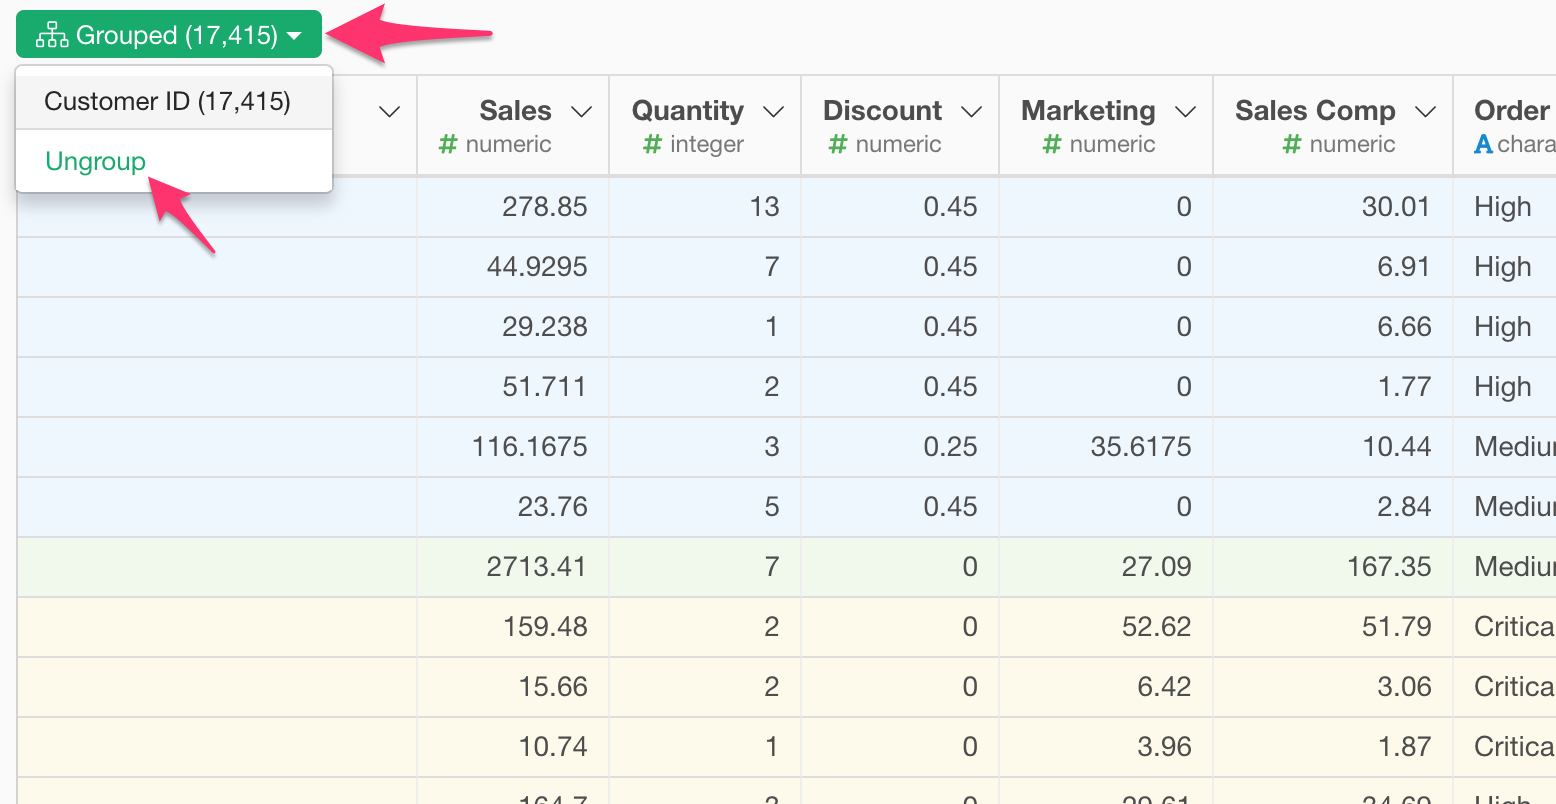
It’s always better to ‘un-group’ the data frame when not necessary.
Select ‘Ungroup’ from the group button.
Note that the data might be shown in different orders between the grouped data and ‘un-grouped’ data. This is because Exploratory shows the data being sorted by the grouping column(s) for the table view.

Convert Difftime to Numeric
Since we want to do some calculations with the ‘difference between the orders’ column later it is better to convert it to Numeric data type.
Select
Change Data Type -> Convert to Numeric -> Days
from the column header menu of the newly created column at the previous step.

We’ll keep the unit as ‘Day’ here.

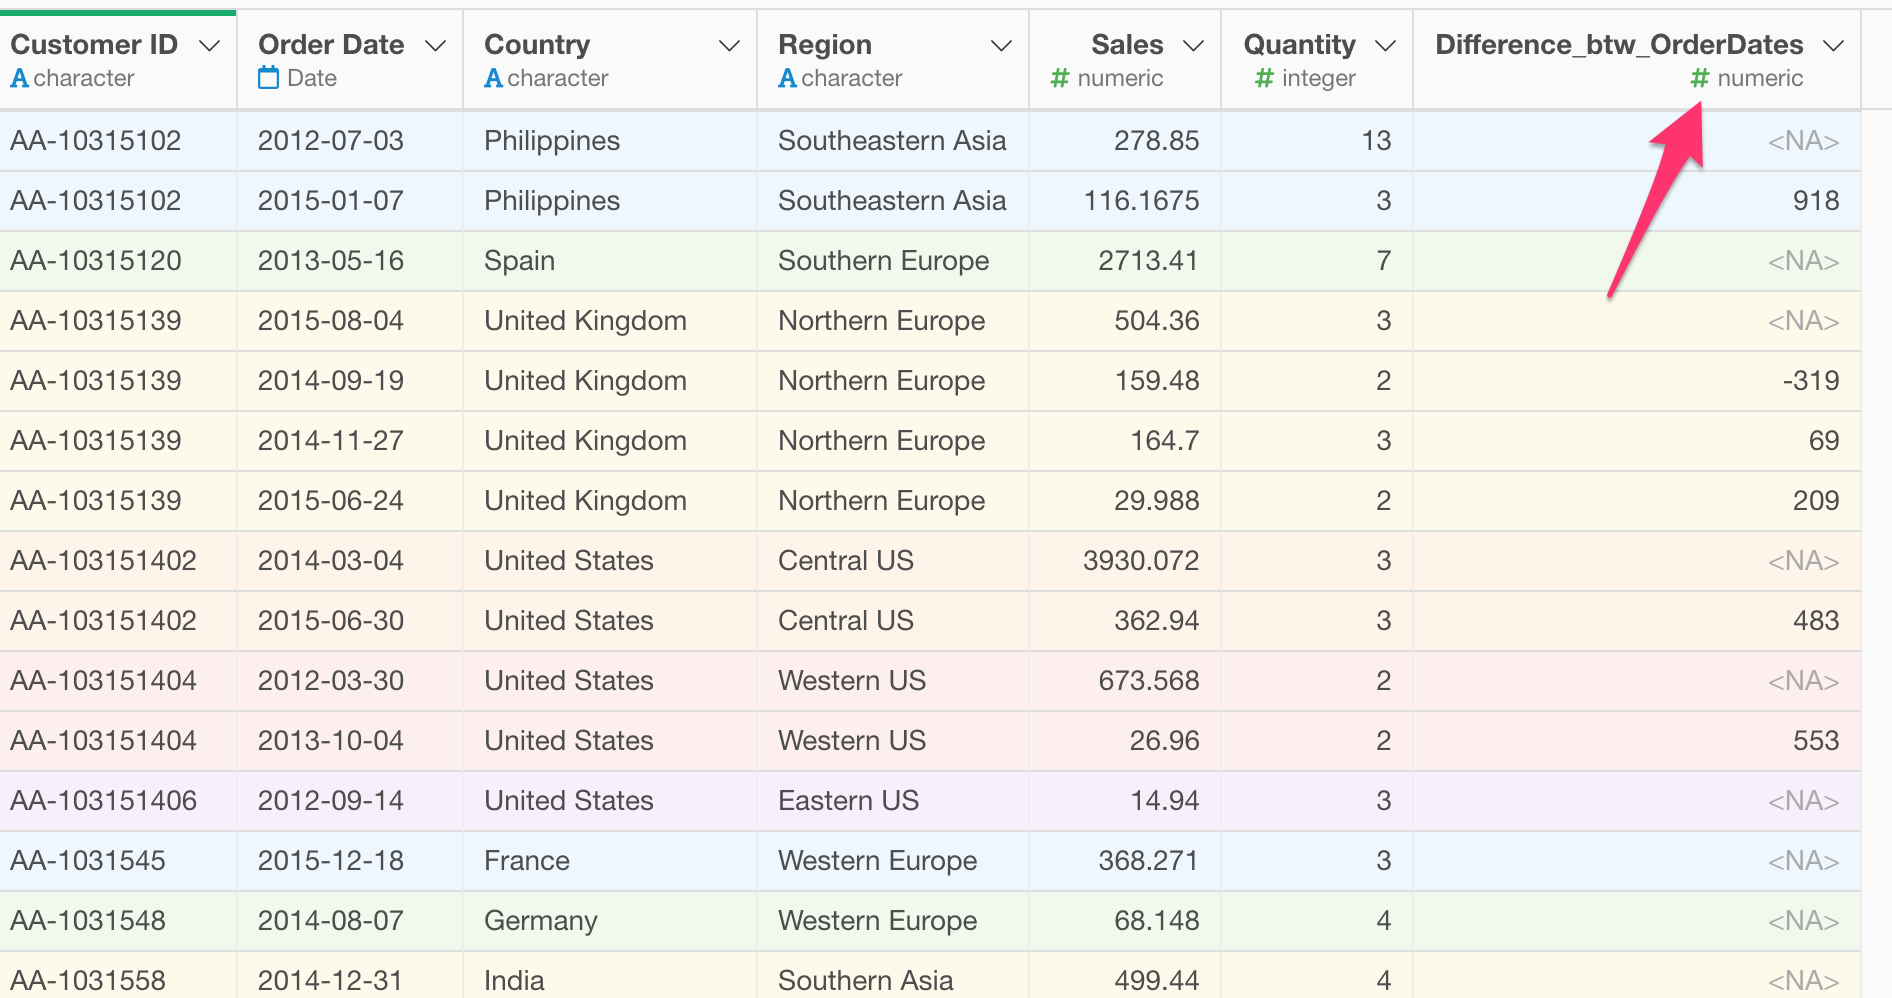
Once you run it, you will get the column being converted to Numeric data type.
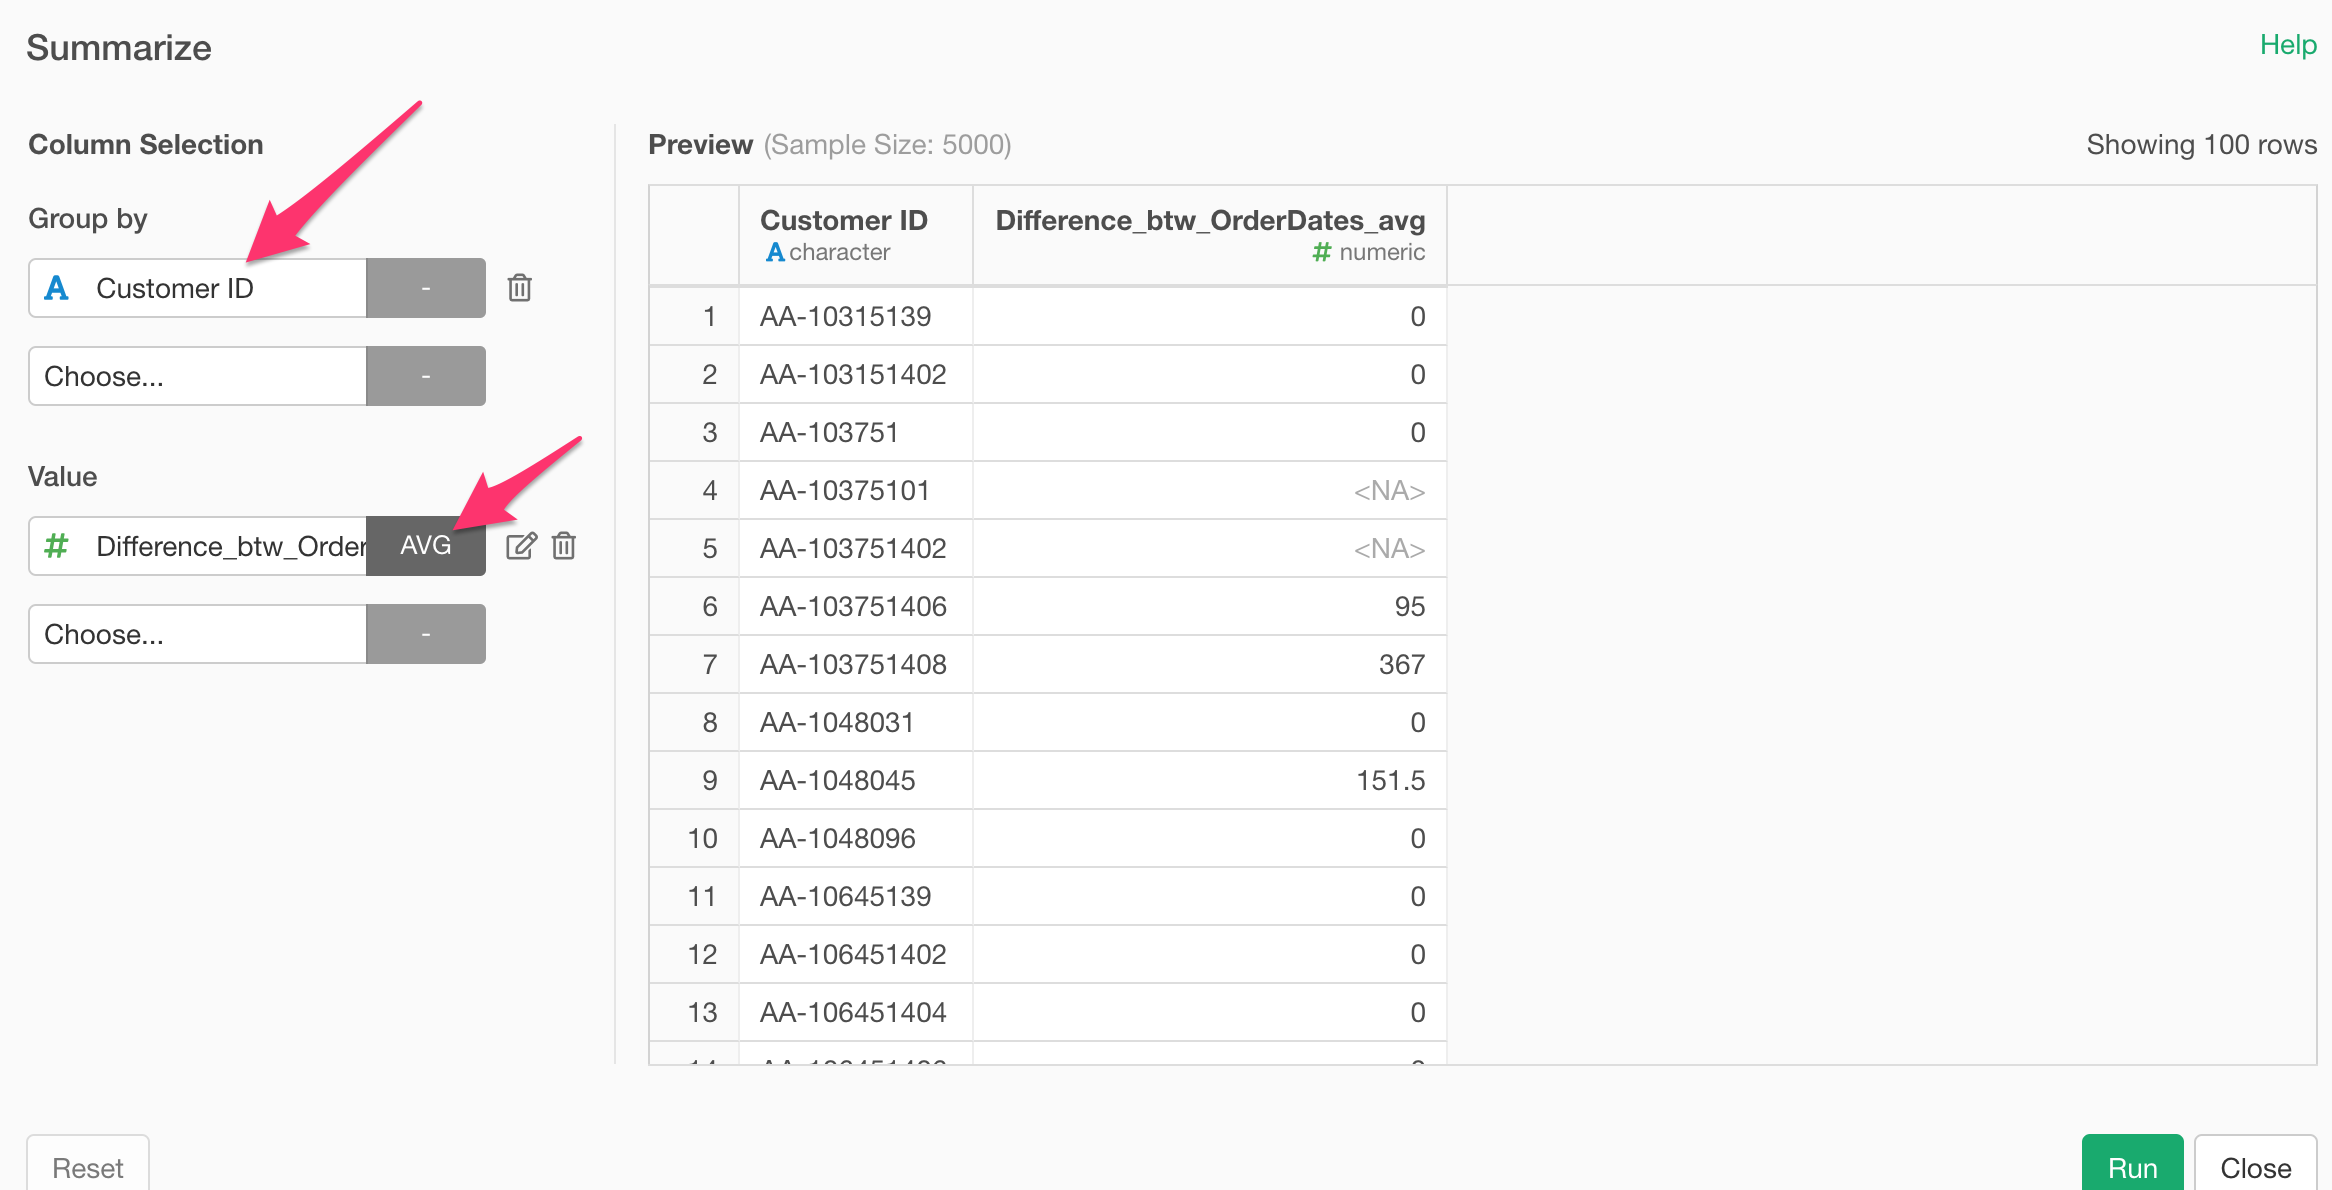
Summarize the Average Duration for Each Customer
If we want to calculate the average duration between the orders for each customer we can use the ‘Summarize’ step.
Select ‘Summarize’ from the column header menu of the duration column.

Assign the ‘Customer ID’ column to the ‘Group By’ and select ‘Average’ as the aggregation function for the ‘Value’ column.