// Note that this report is refreshed daily (7AM PT) to update the data in the charts. So the comments about the charts might not match as the day goes by…
California County Level Infections & Deaths of COVID-19 Visualized
New York Times has published data about the number of COVID-19 infected cases and deaths in U.S. at the county level.
- We’re Sharing Coronavirus Case Data for Every U.S. County - Link
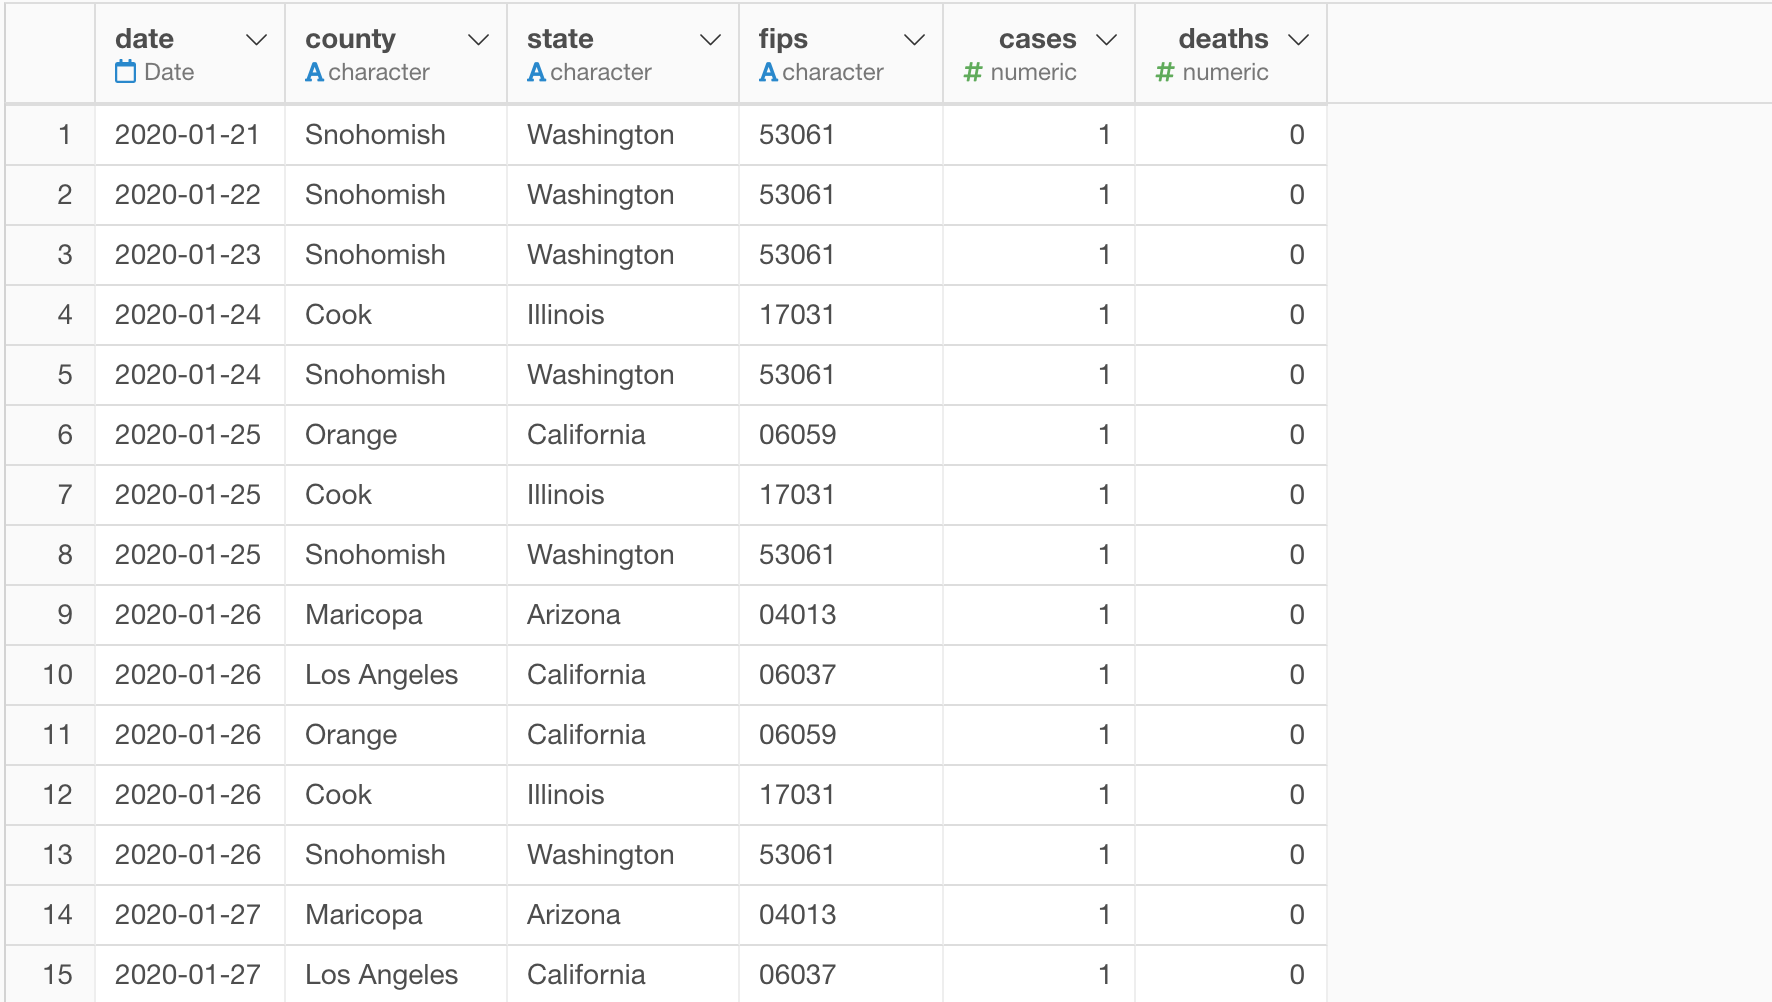
So I’ve got the County level data and visualized the trend for California counties.
Note that the data is refreshed daily (7AM PT).
Number of Cases
These are the number of the cases for those who were tested Positive. Note that we need to be mindful on this numbers. These numbers can be influenced a lot by how many were tested. In general, more tests can produce more positive cases, and the testing criteria might vary by county.
Number of Cases by County
Los Angeles has the most reported cases and it’s dramatically more than other counties. It has four times of the 2nd ranked county, Santa Clara.
The top county in Bay Area (or Silicon Valley if you will) is Santa Clara where Apple, Google, and many of other tech companies are located.)
Cumulative Number of Cases - Daily
Here’s a daily cumulative number of the cases.
On the left (Non Bay Area counties) you can see a super rapid increase in Los Angeles.
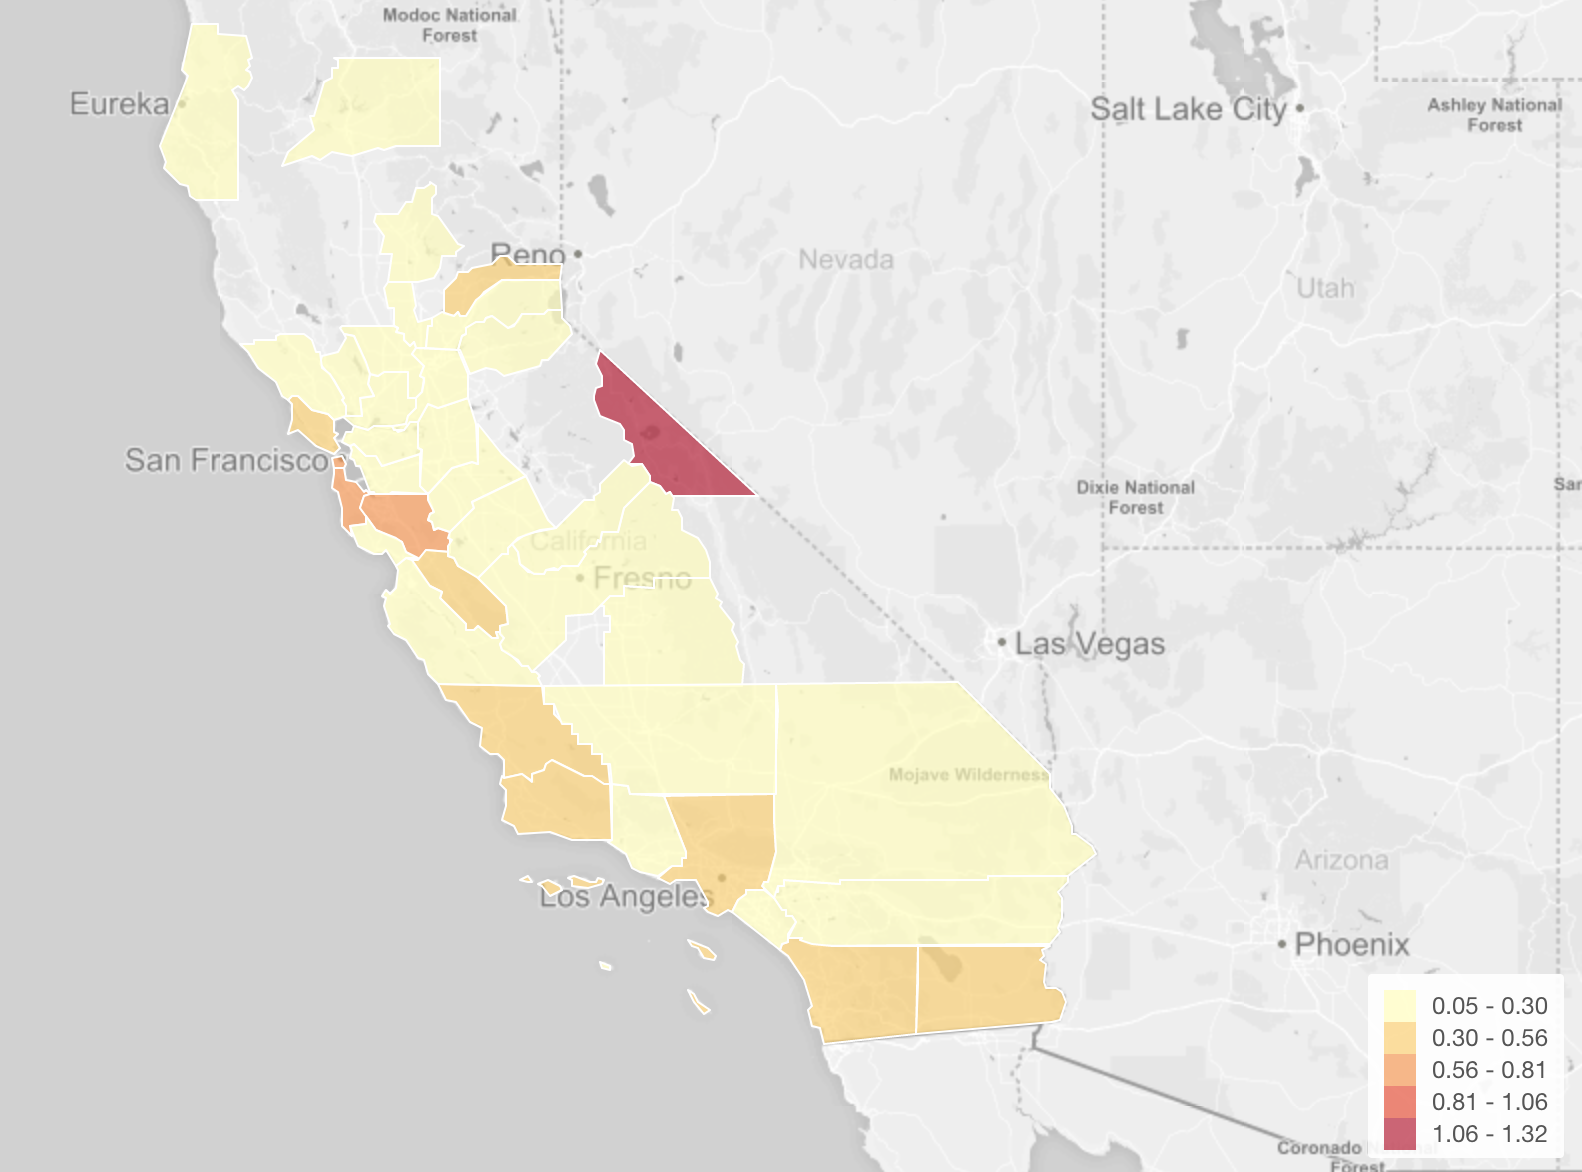
Number of Cases by County - Map
Here’s a county level map showing the number of cases by color.
Put in Perspective
Now, some of the numbers shown above might scare you, but you need to put that in perspective.
Here’s when you compare the number of deaths of California counties against New York City.
We are not seeing the kind of overshoot happening in New York City here in California yet… I don’t know what that means. Does that mean we will have similar situation soon? Or something California has done so far is different from New York? Or it’s just a different nature of New York that we don’t have it here in California such as the density, temperature, etc.
Anyway, it’s too early to say any conclusion as of now, let’s finger crossed! and do whatever we can do to slow the speed of the epidemic!
Written on 4/1/2020. (The data is refreshed daily, but the writing is not.)