Switching Marker between Line, Bar, and Circle
You can quickly switch the chart marker type between Bar, Line, and Circle, which will help you visualize multiple measures in a single chart better.
Here's a quick how-to video!
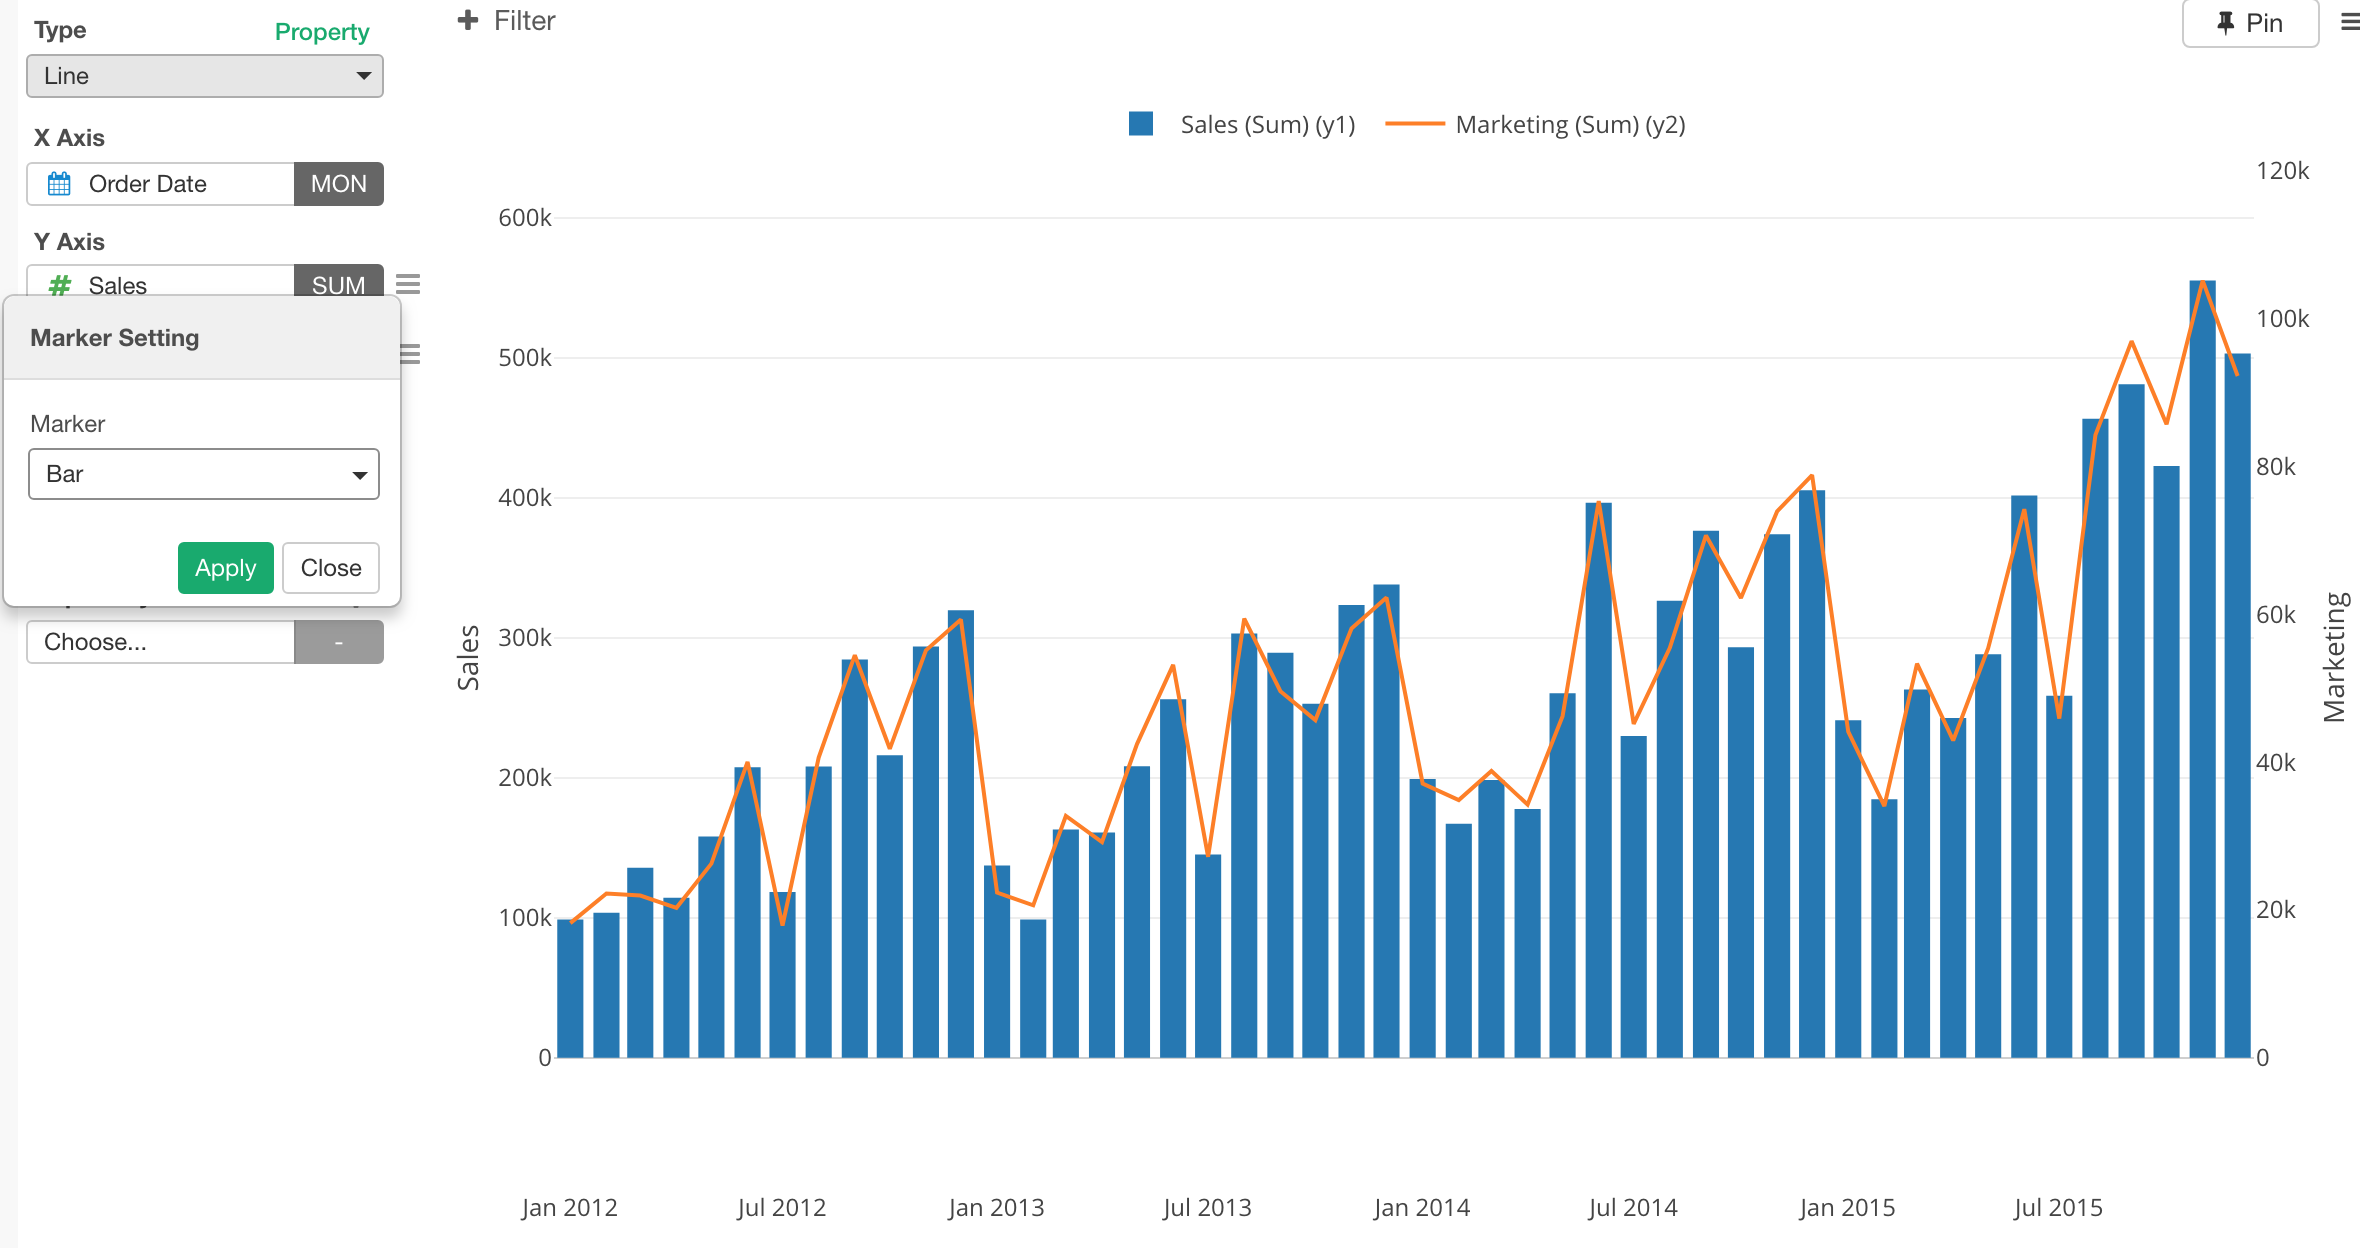
For example, here I'm setting the first Y Axis column to use Bar marker.
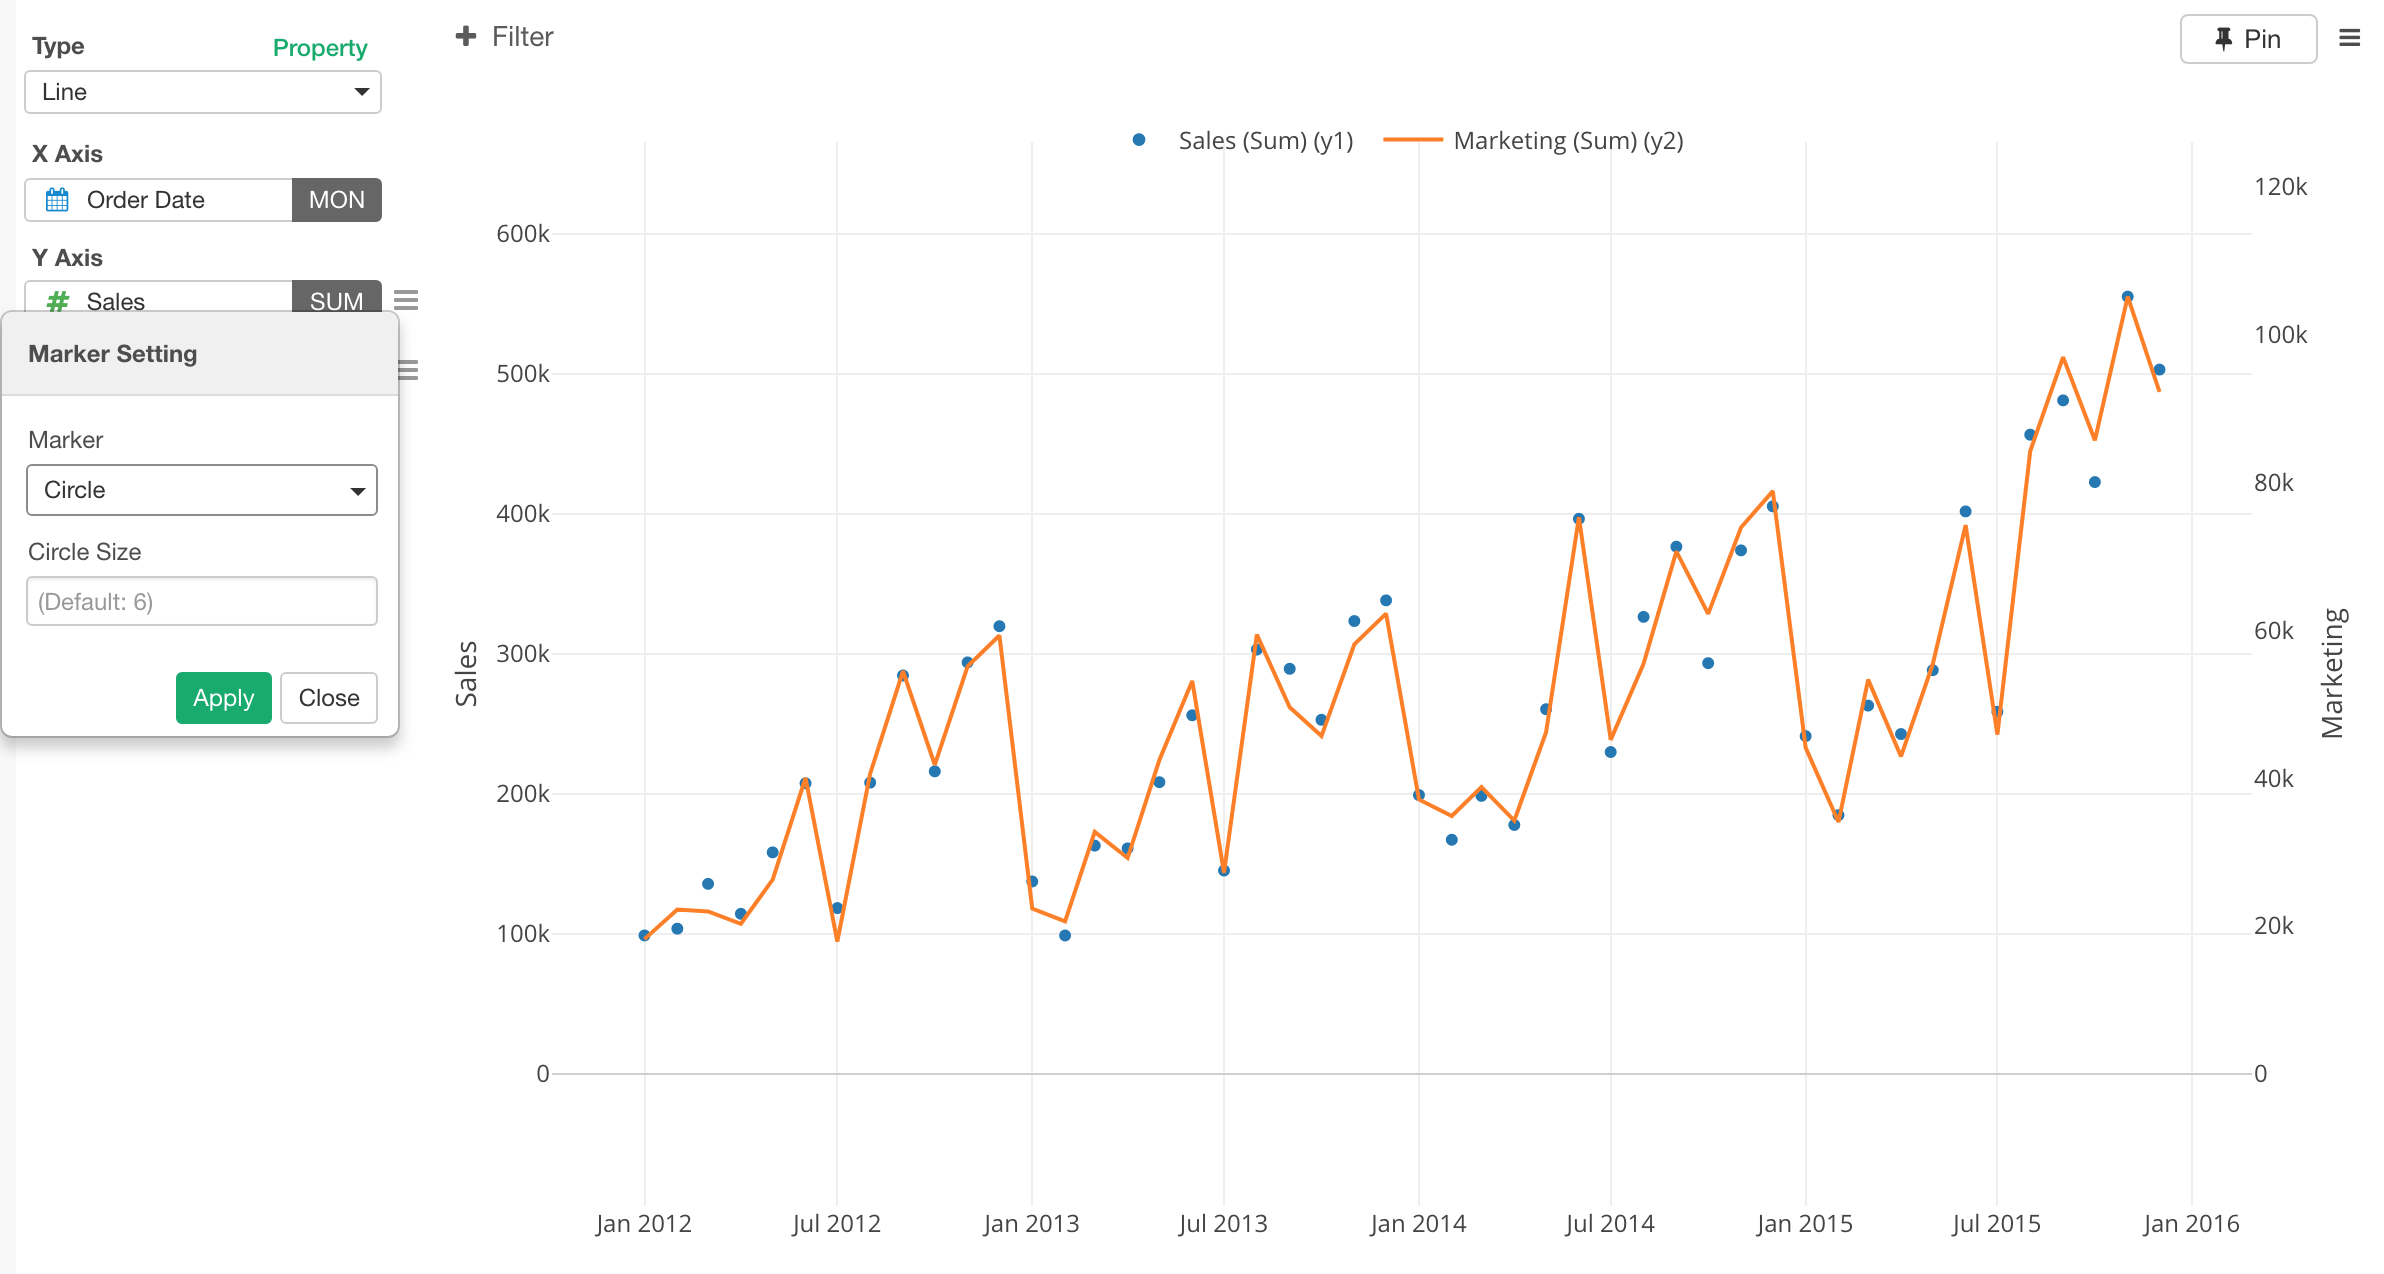
And here, I'm setting it to Circle.
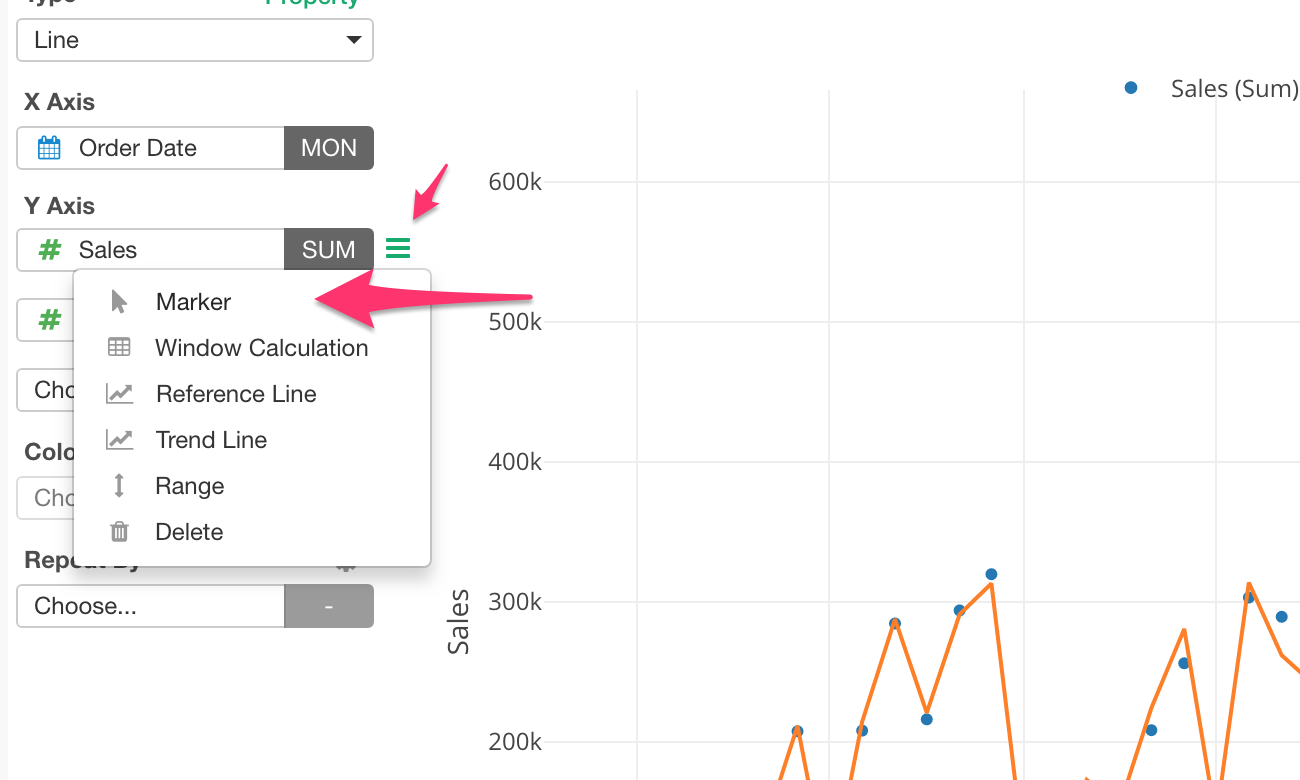
You can access Marker Setting from the Y Axis menu.