Creating the 1st Chart
You can create charts under ‘Chart’ view in Exploratory.
The basic workflow is to select a chart type from the list, then assign columns to X Axis, Y Axis, Color, etc.
In this tutorial, we’ll start creating a chart from the Summary view.
Data
We’ll use ‘HR Employee Attrition’ data for this tutorial. You can download it from the link below.
This data has one row representing one employee.
Create a Chart from Summary View
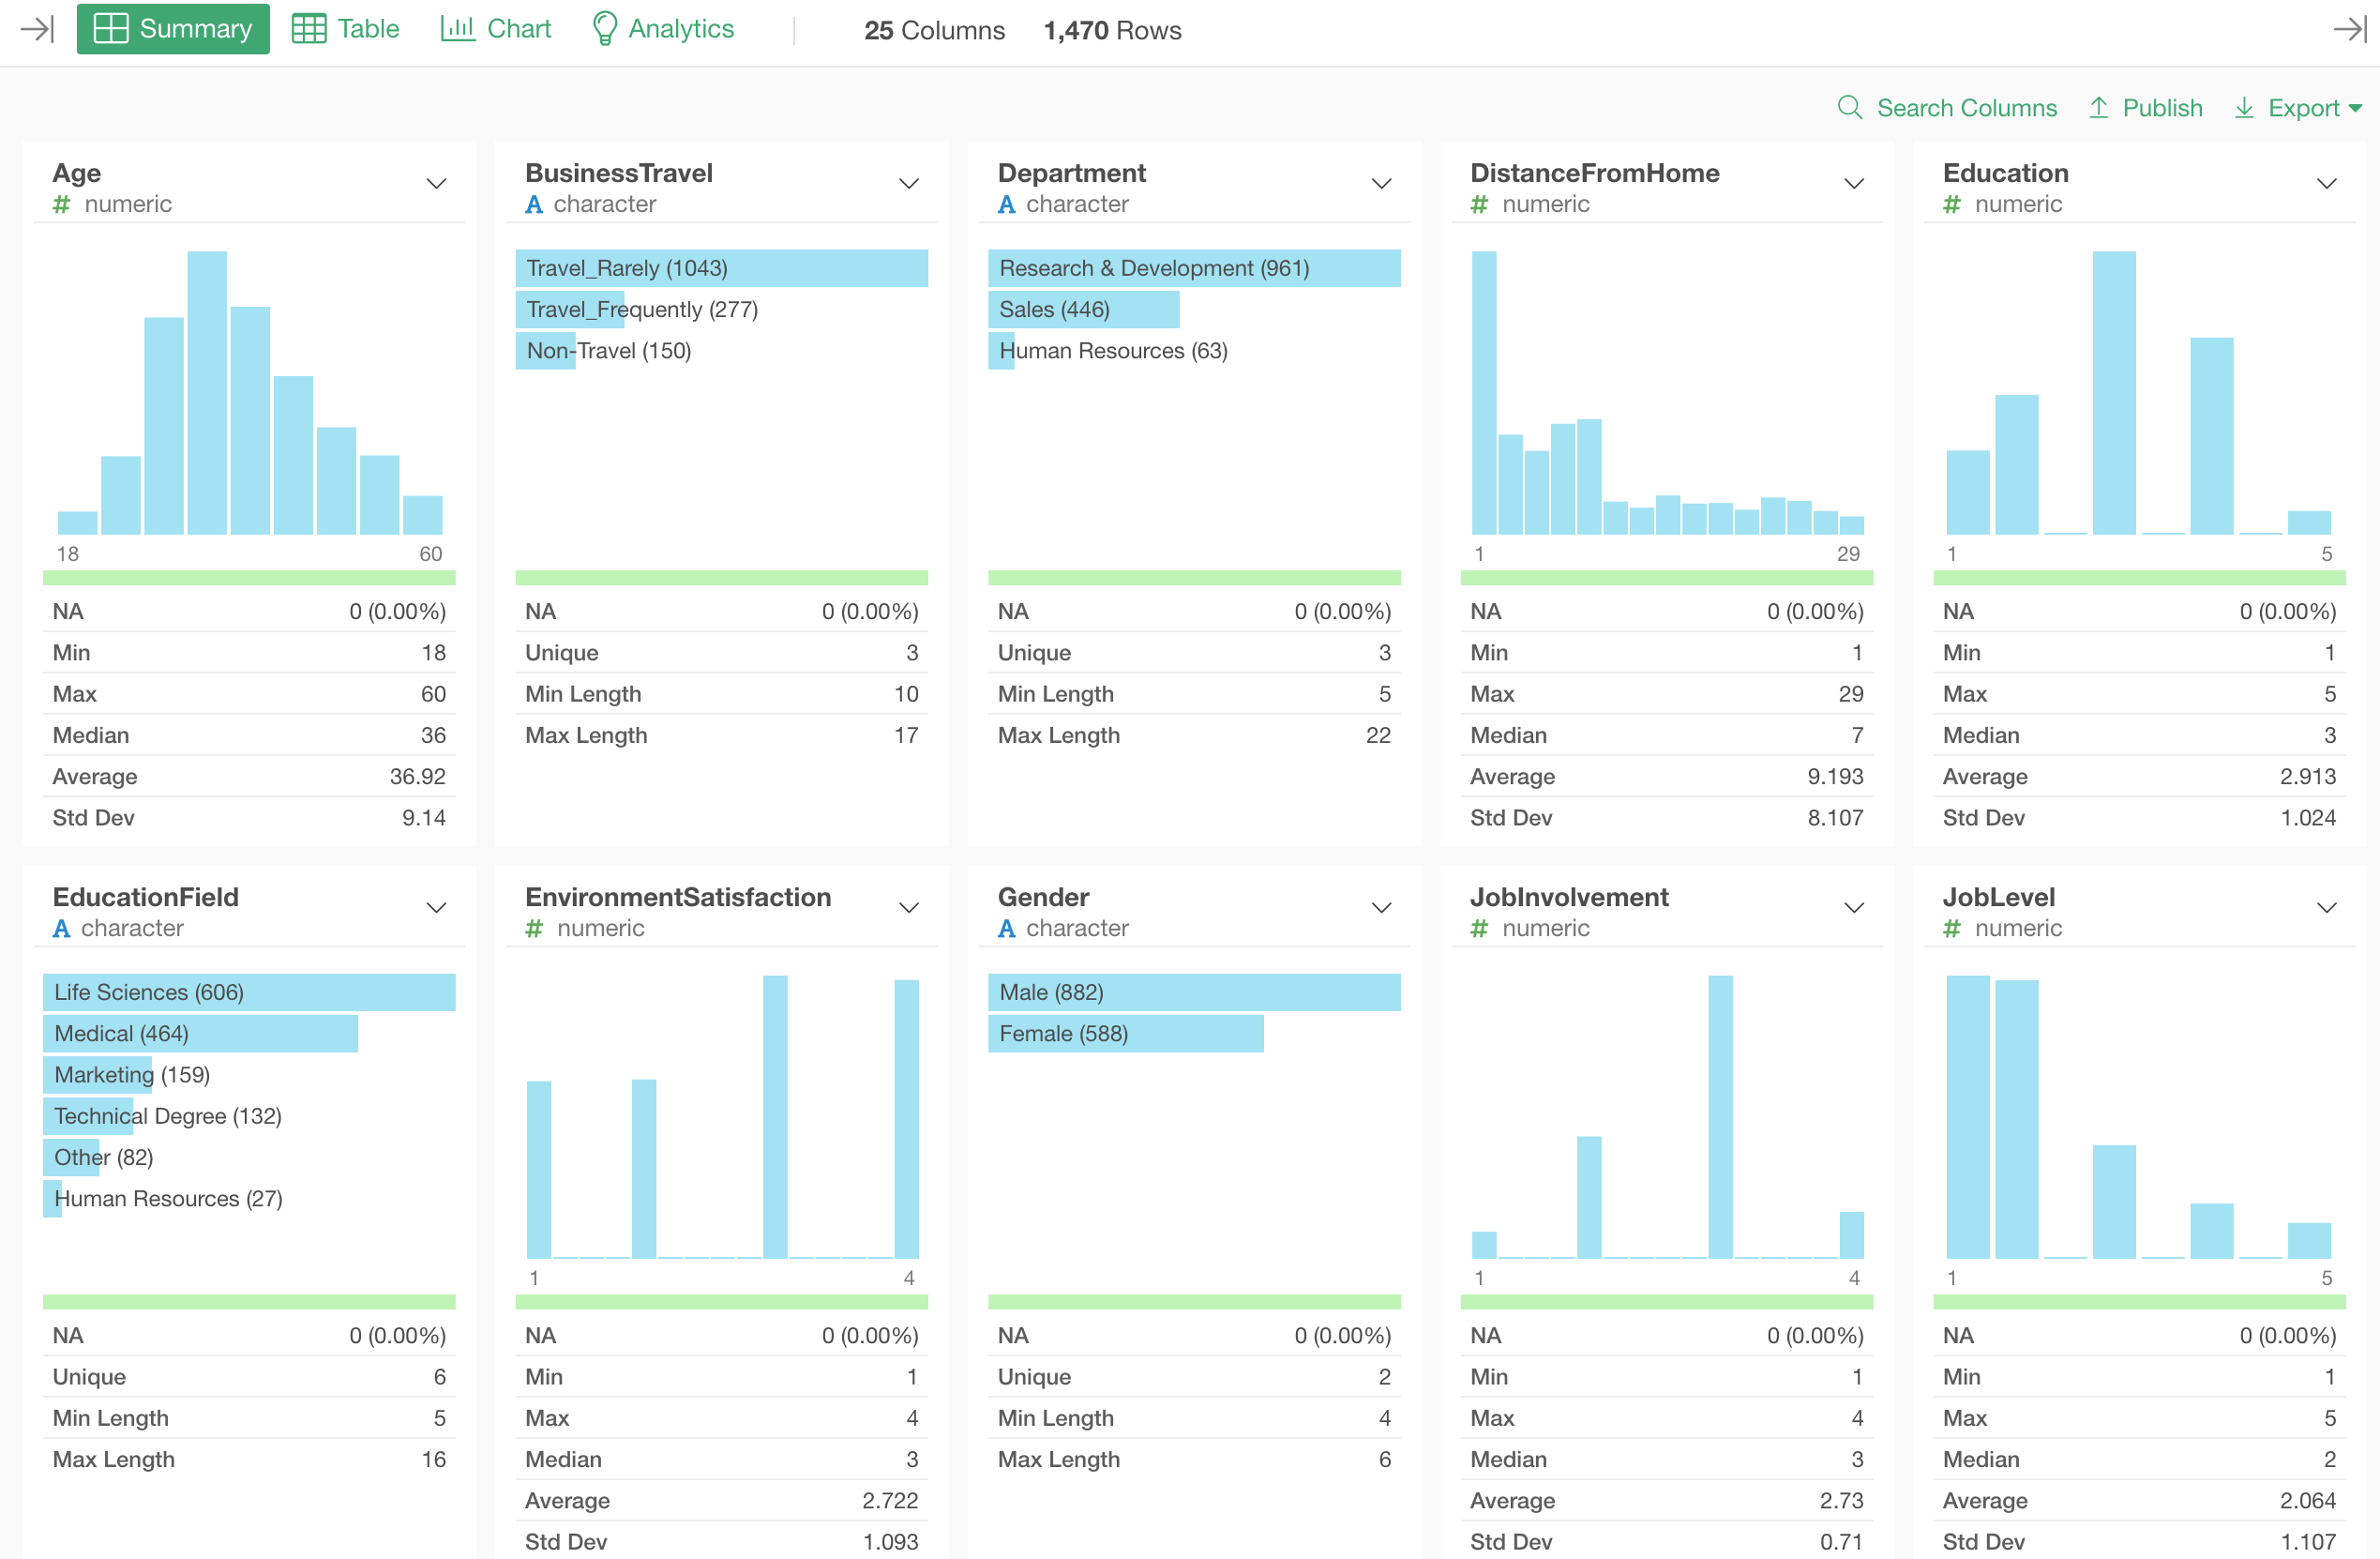
Let’s take a look at ‘Job Role’ column.
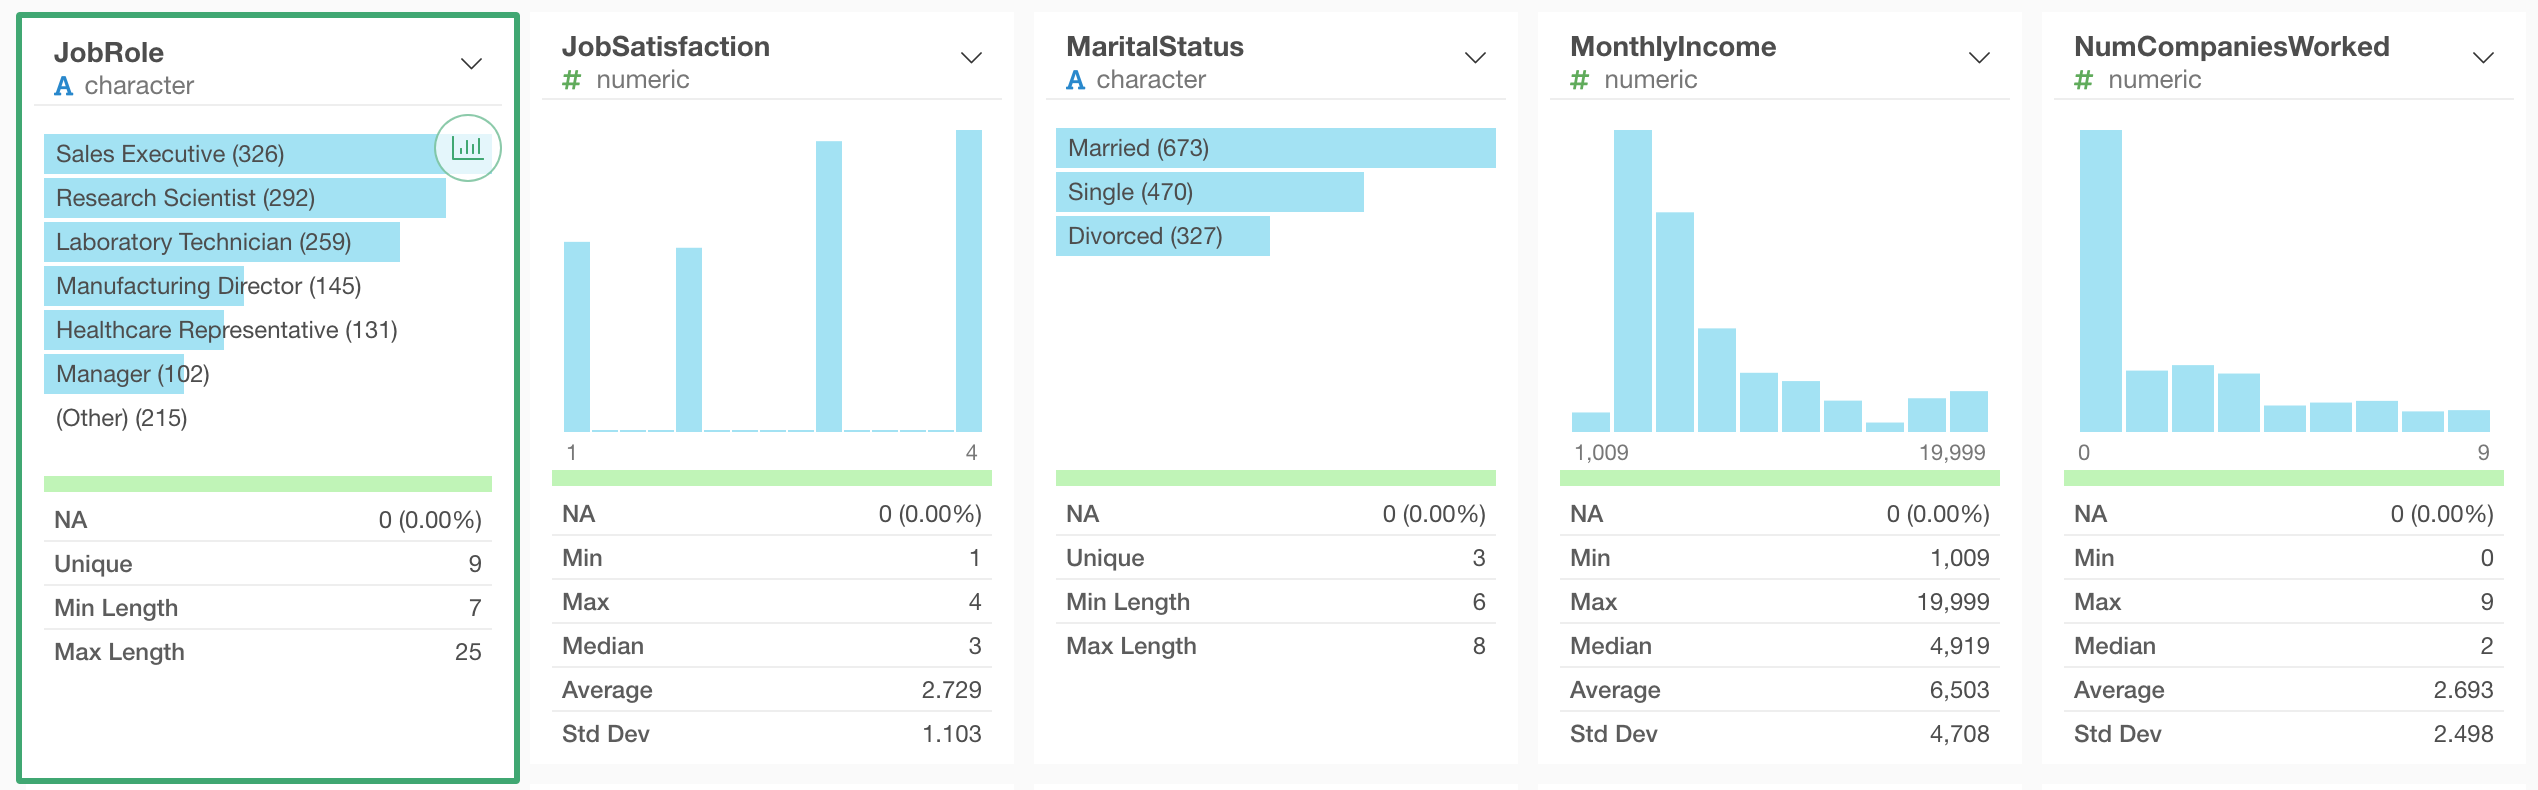
There are 6 most frequent job roles shown in the chart, but there seems to be more job roles since the ‘Unique’ is showing 9.
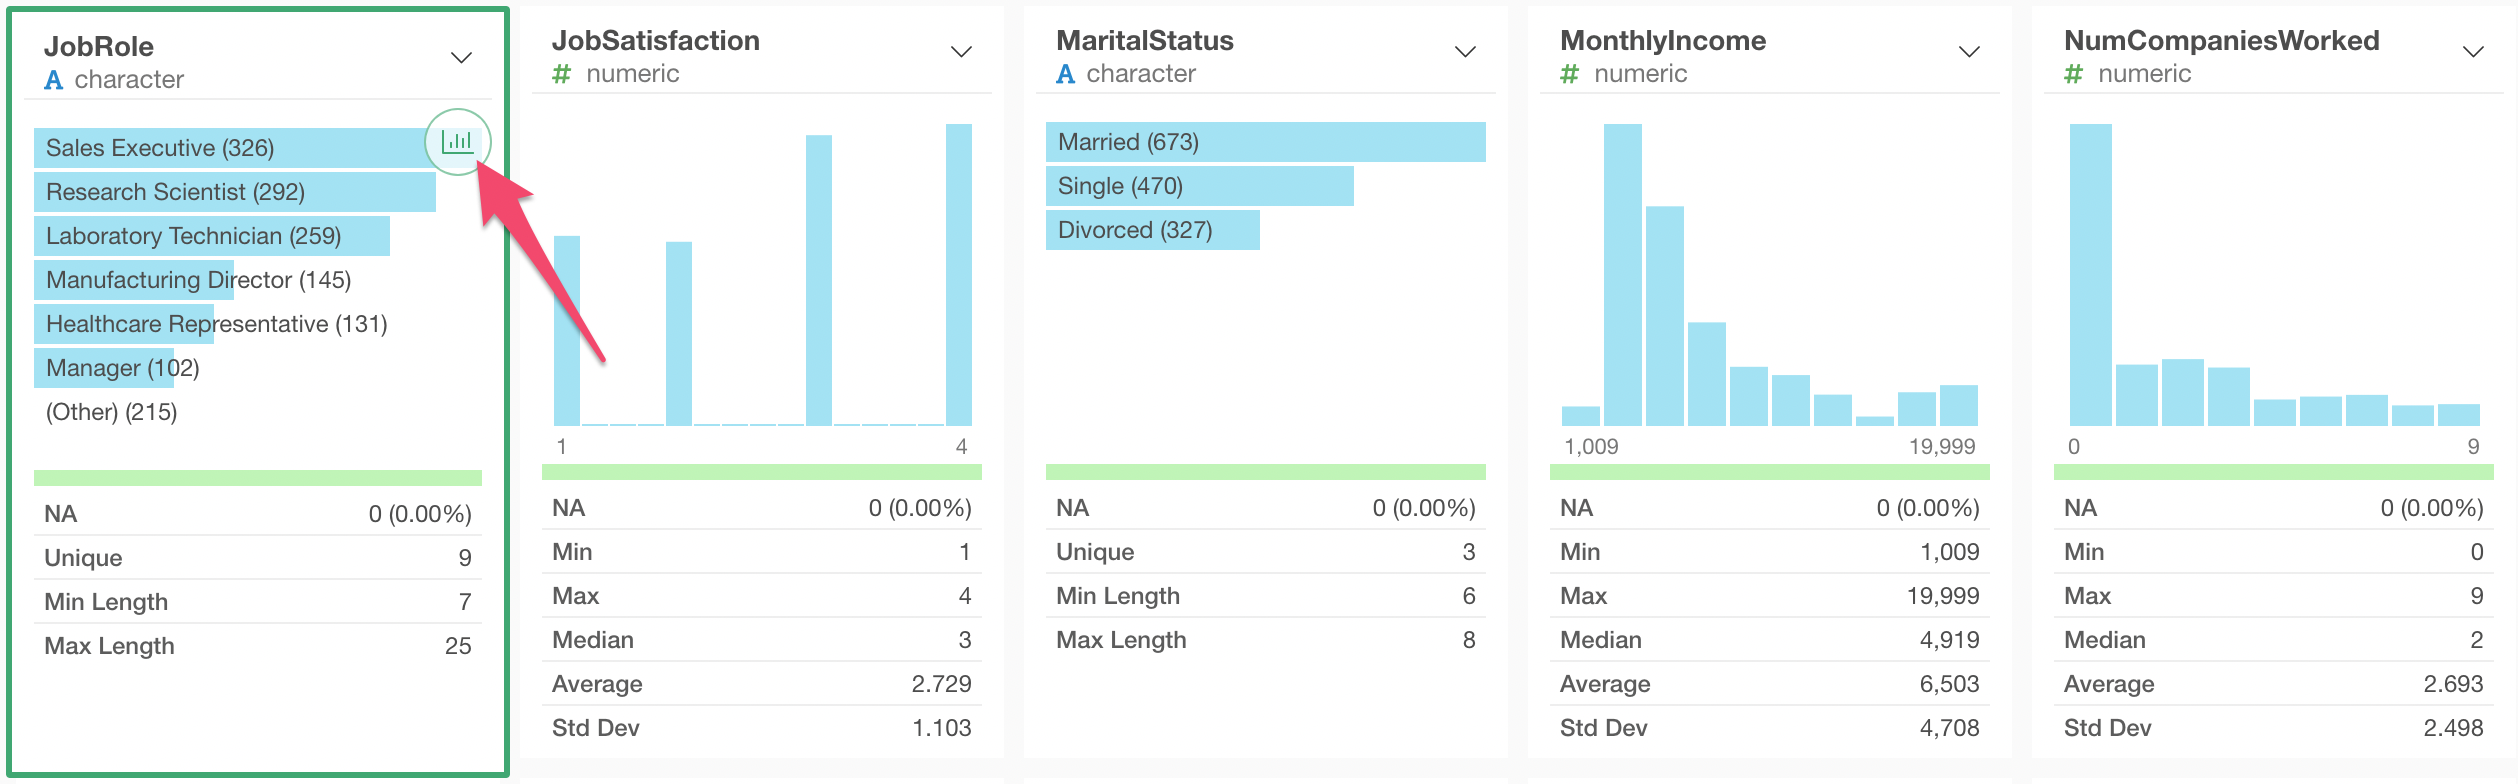
Let’s click on the chart icon, which shows up when you move the mouse pointer on top of the ‘Job Role’ column, to visualize all the job roles.
This will create a new chart as ‘Bar’ chart under the ‘Chart’ view.
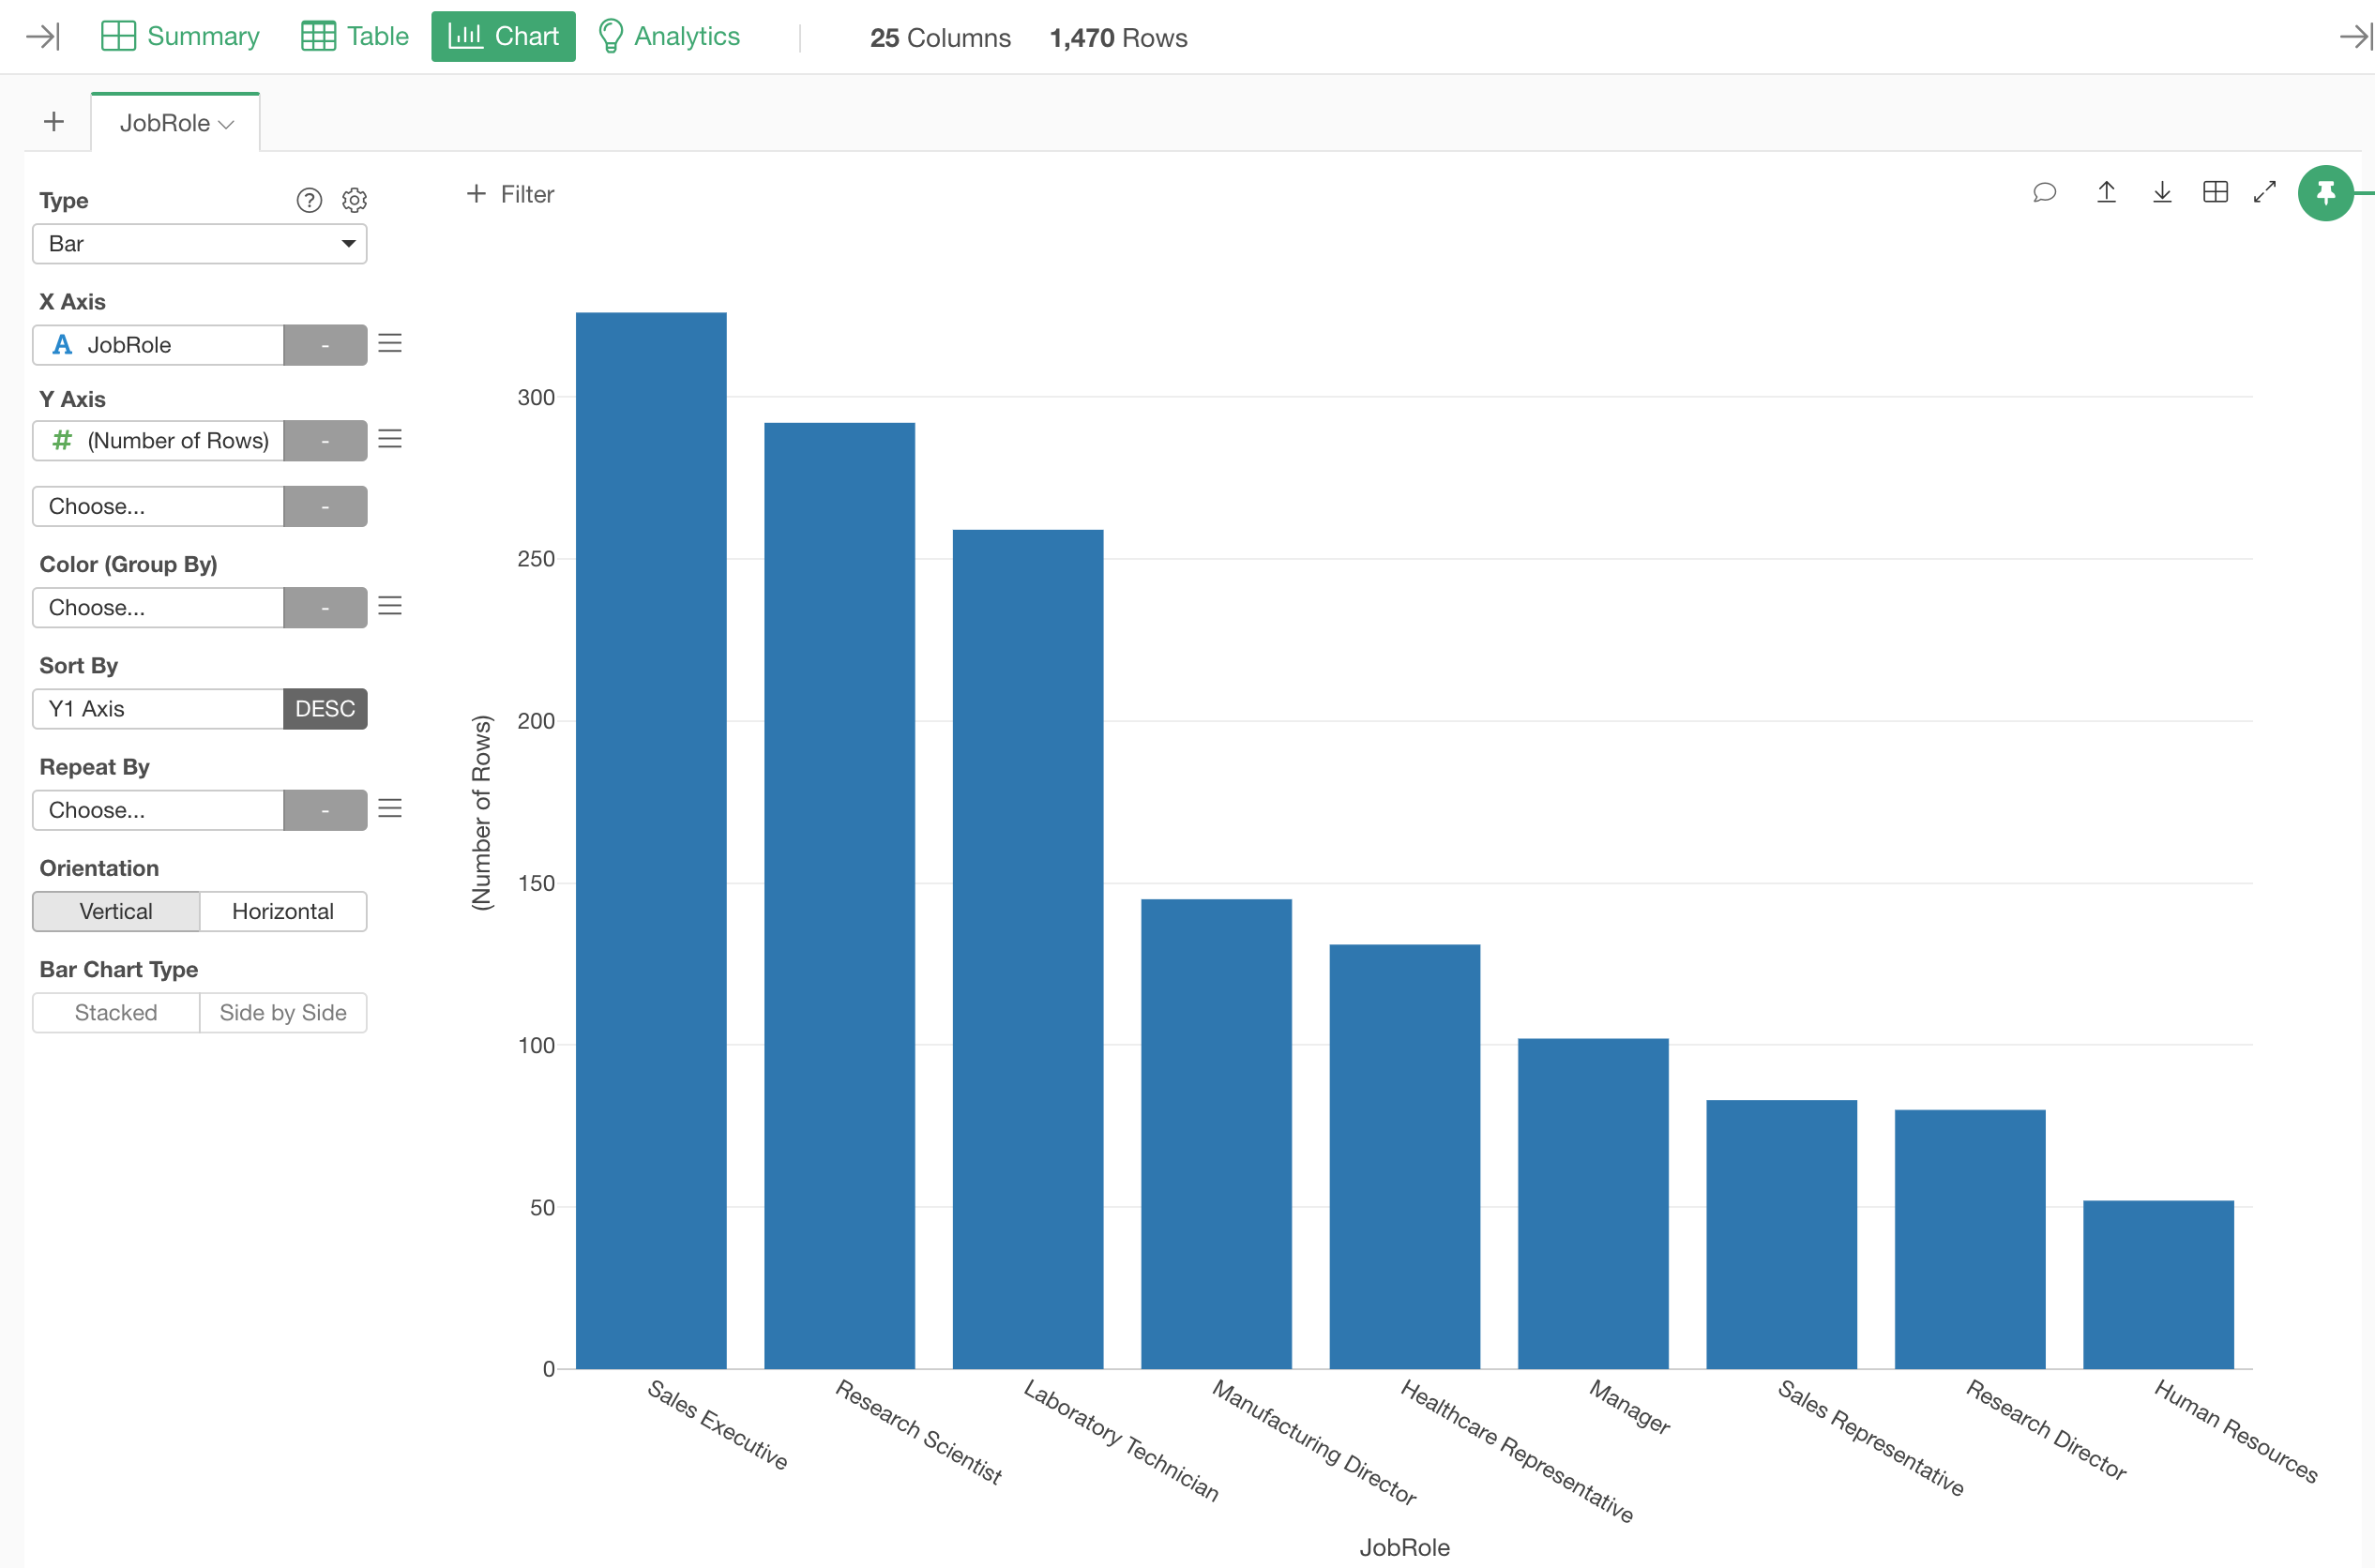
In Exploratory, assigning columns to X-Axis and Y-Axis is the basic procedure of creating charts.
With this chart, you’d notice that ‘Job Role’ column is already assigned to X-Axis. This is because we have clicked on the chart icon of ‘Job Role’ column under Summary view before.
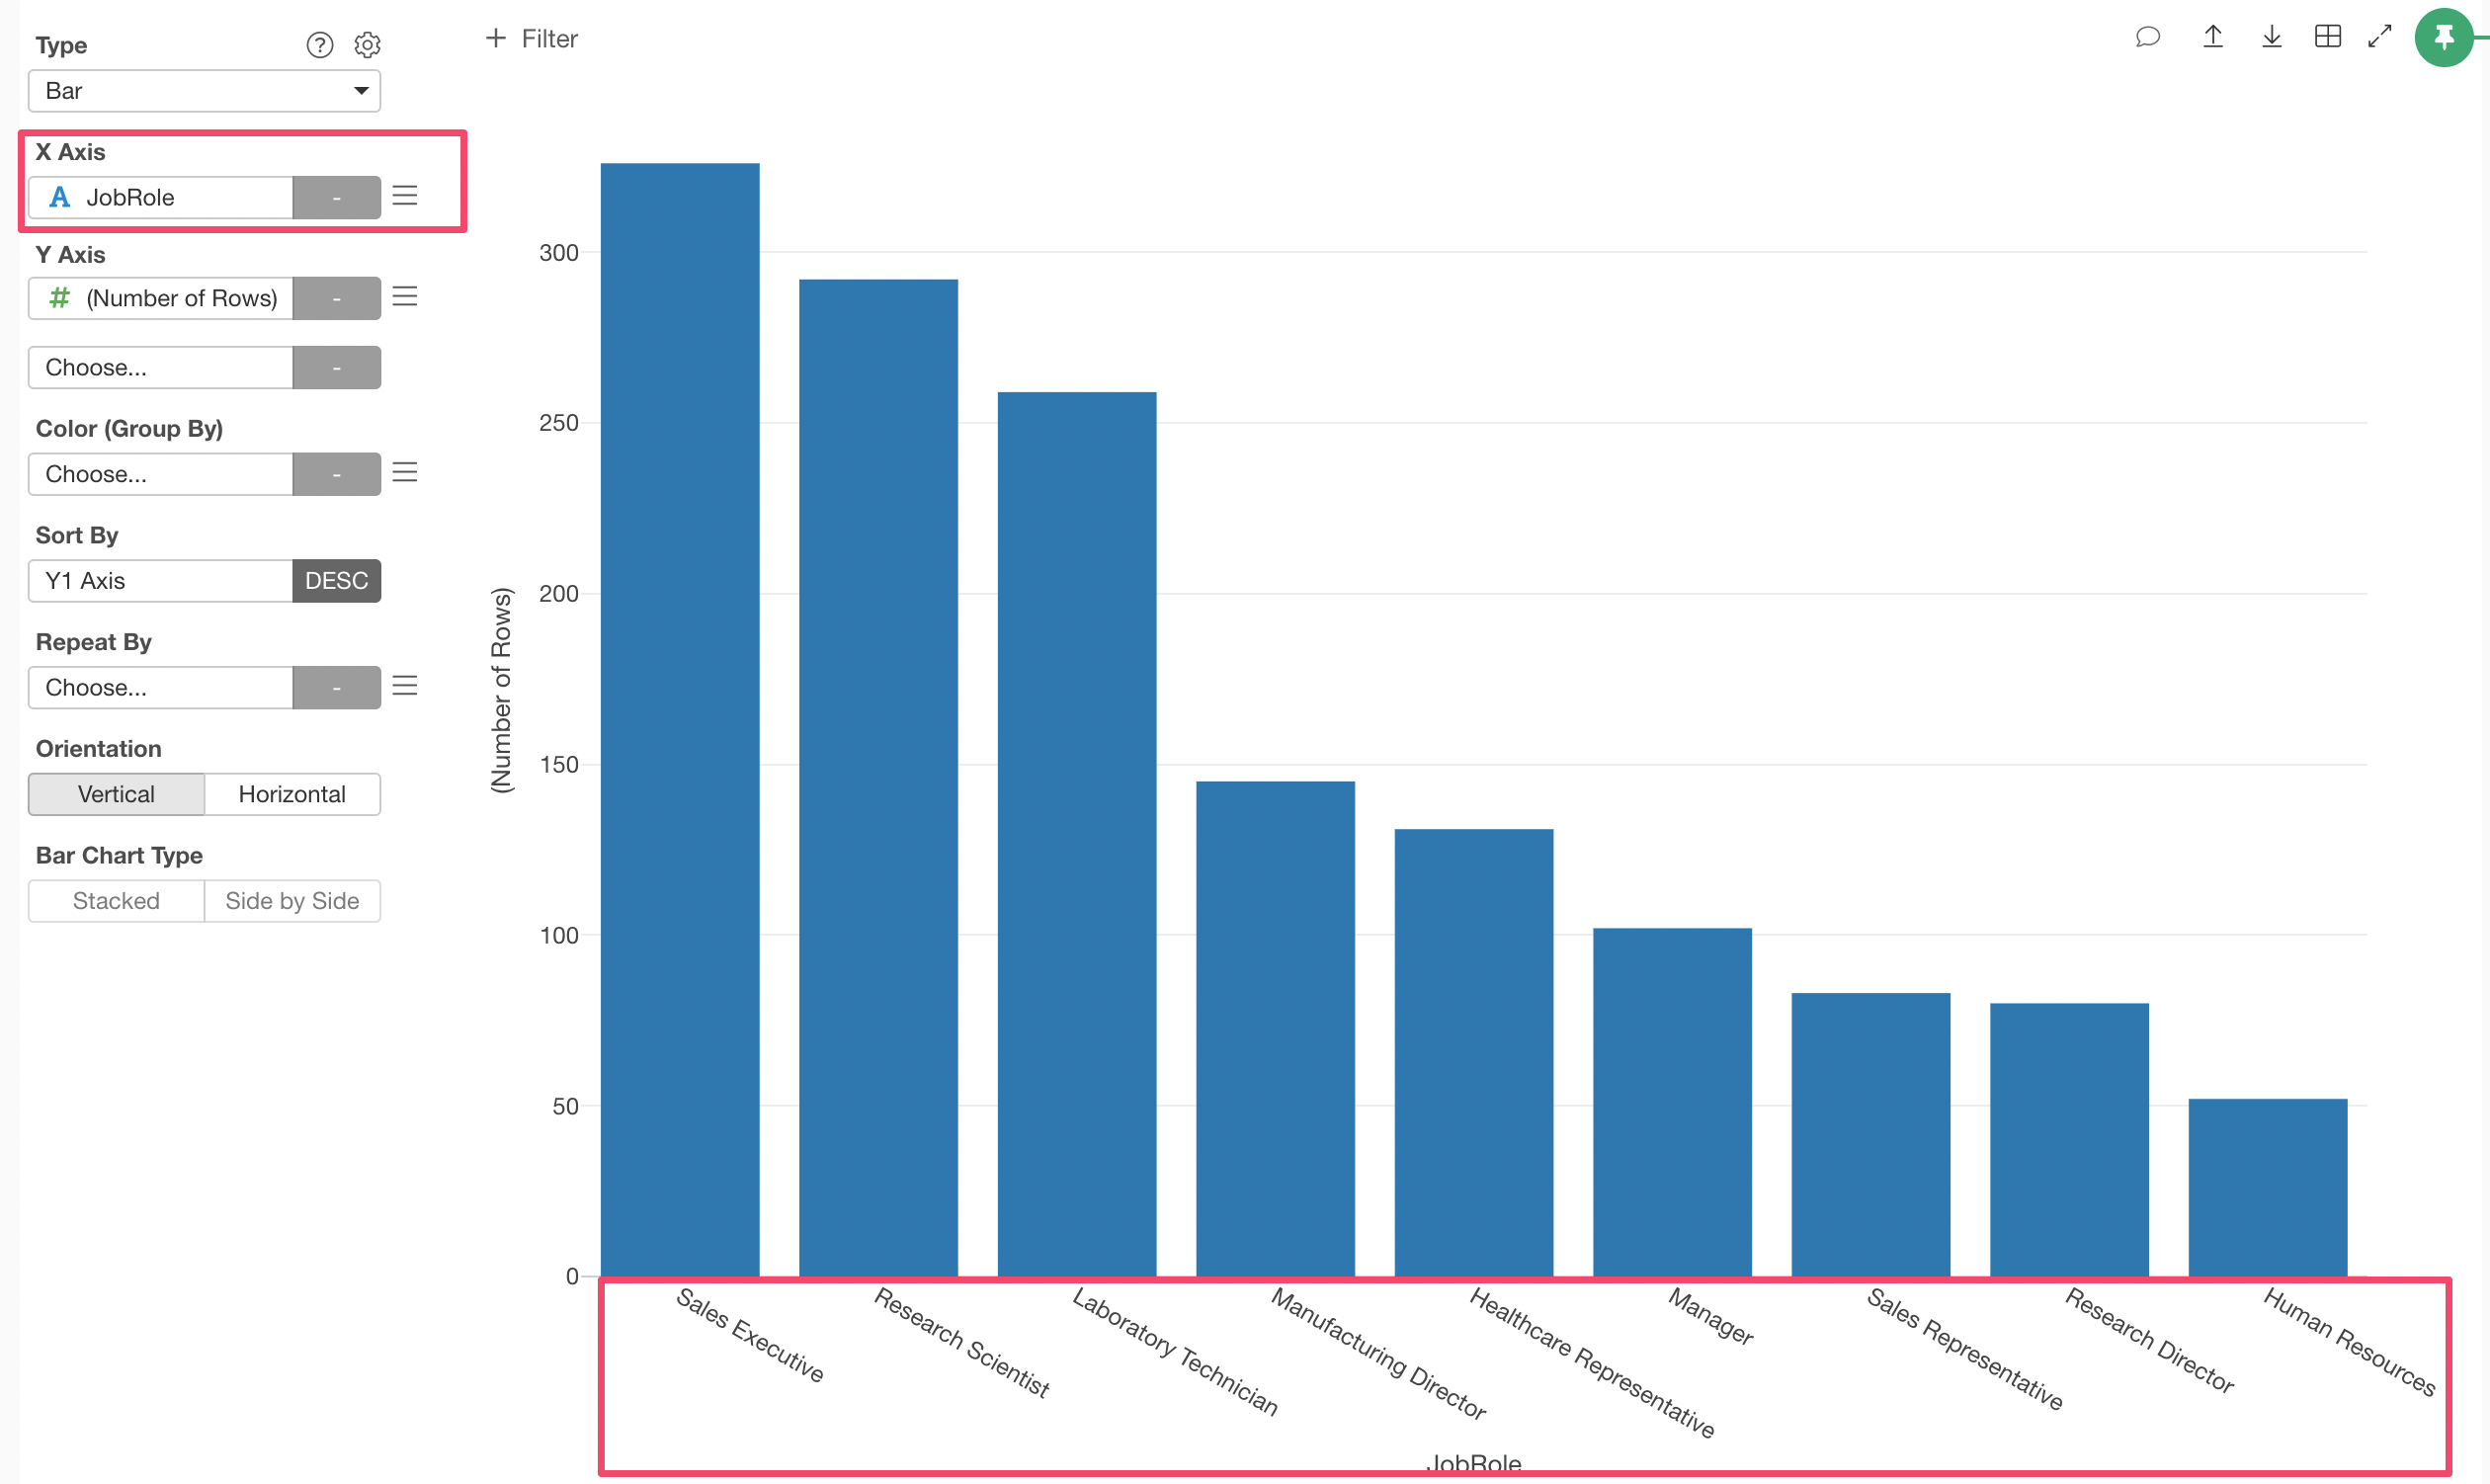
Next, you’d notice that ‘Number of Rows’ is assigned to Y-Axis, which is the default when you don’t assign any particular column.
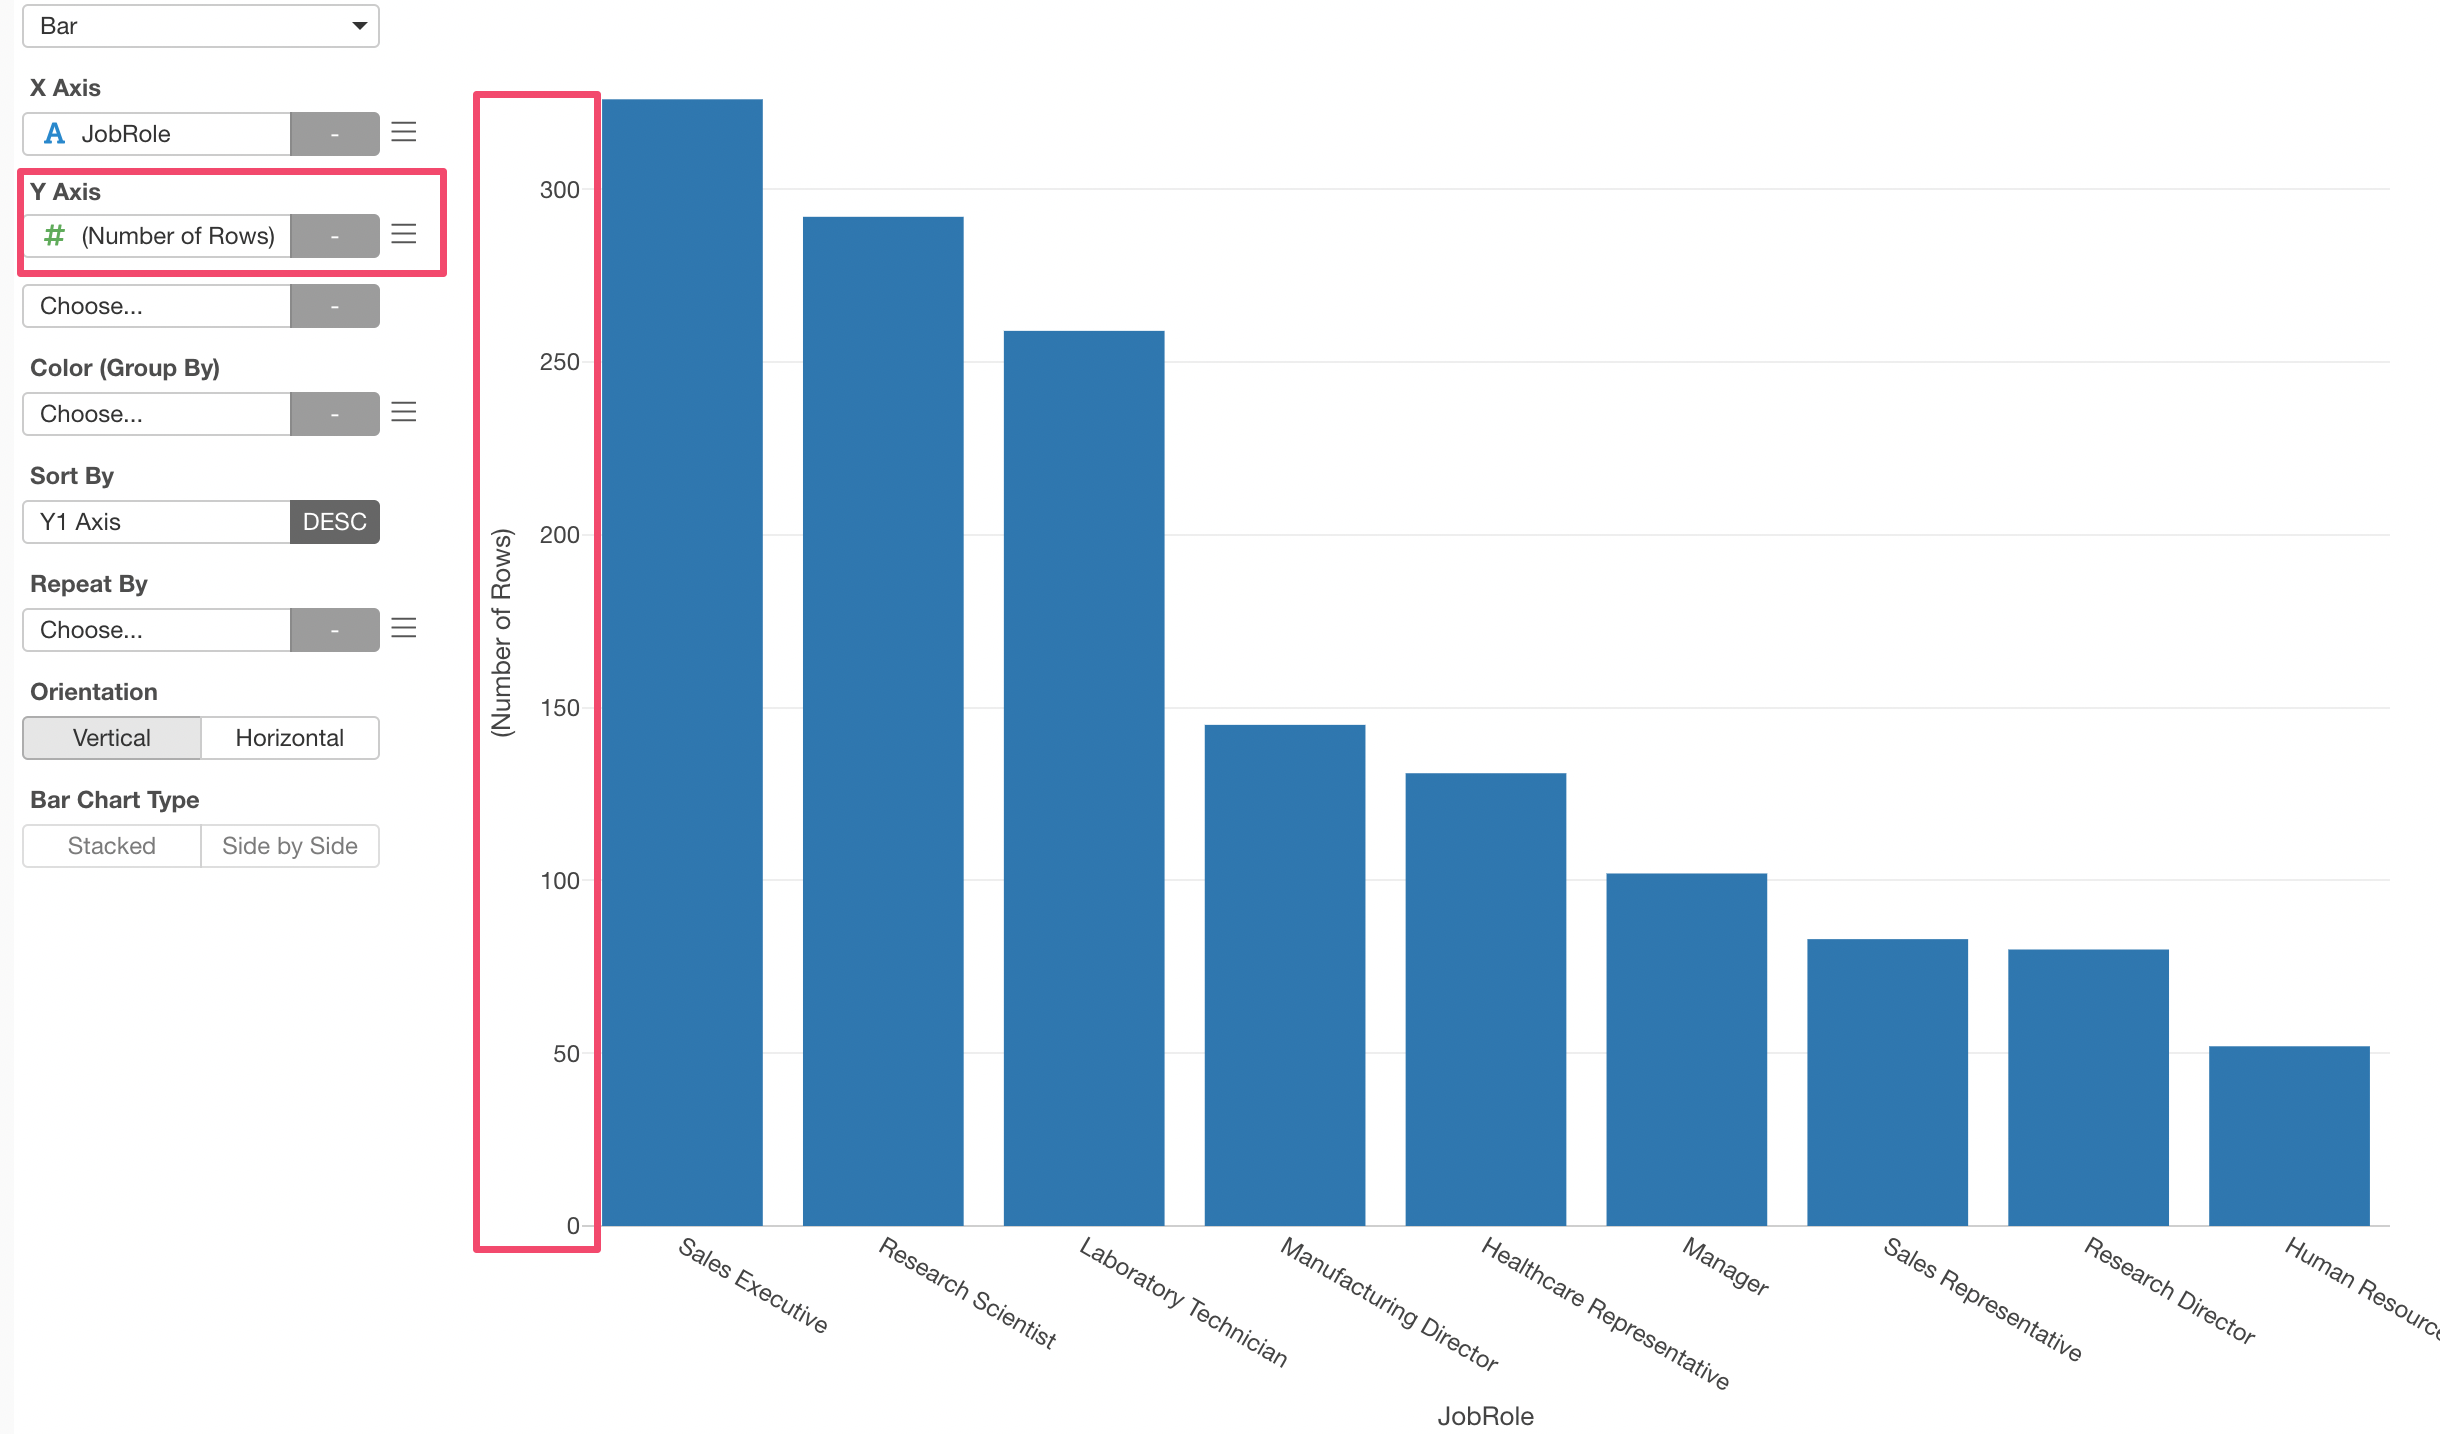
In this data, one row equals one employee so the ‘number of rows’ means the number of employees.
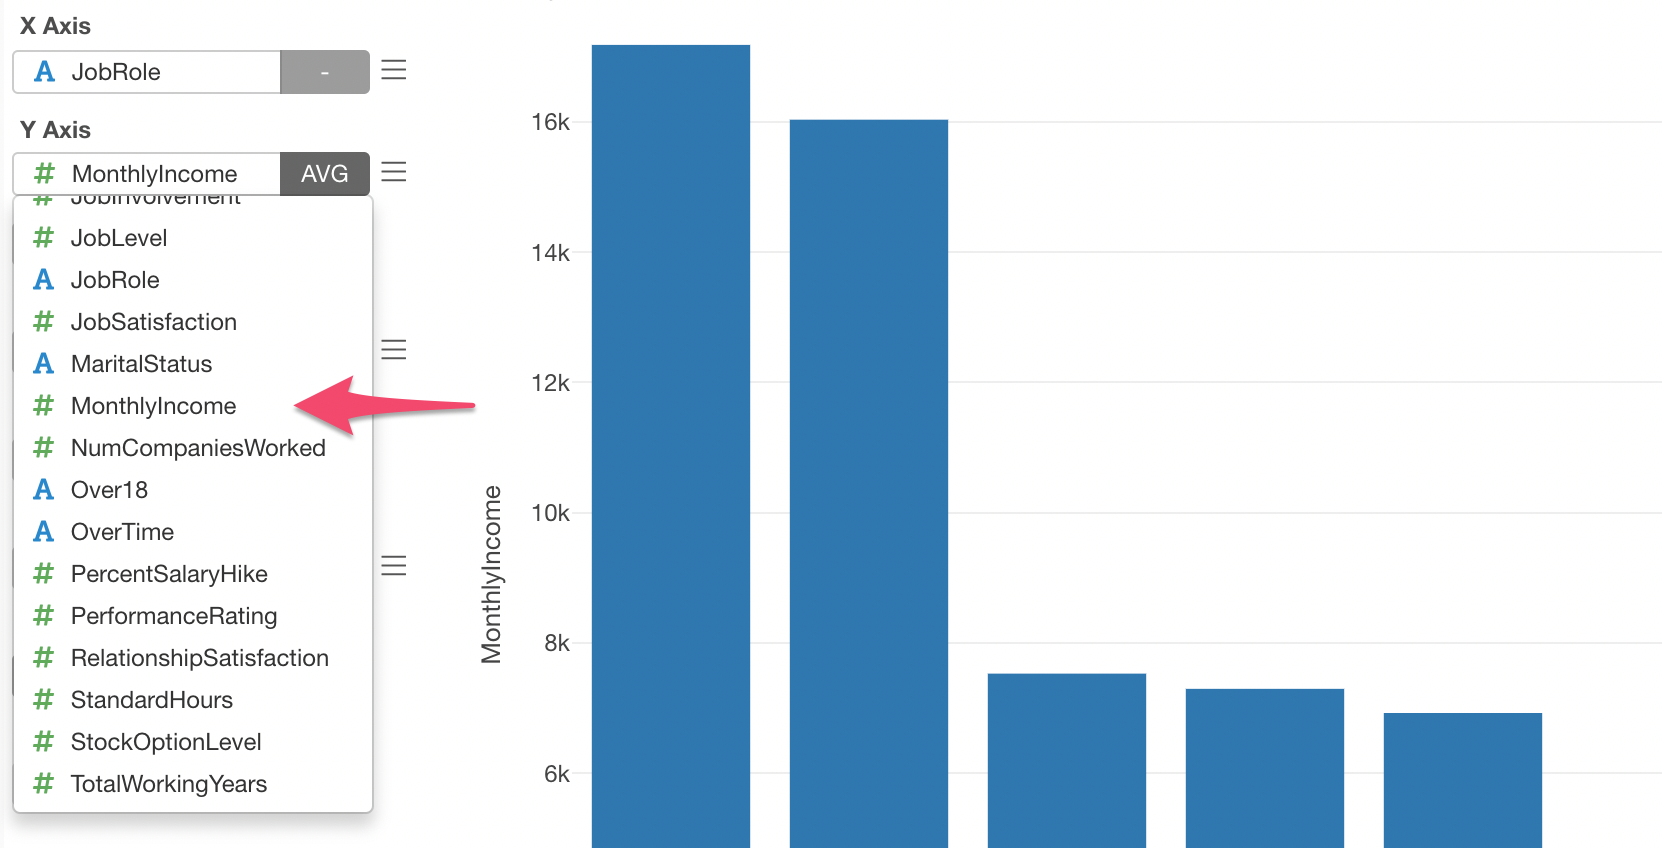
Assigning Numeric Column to Y-Axis
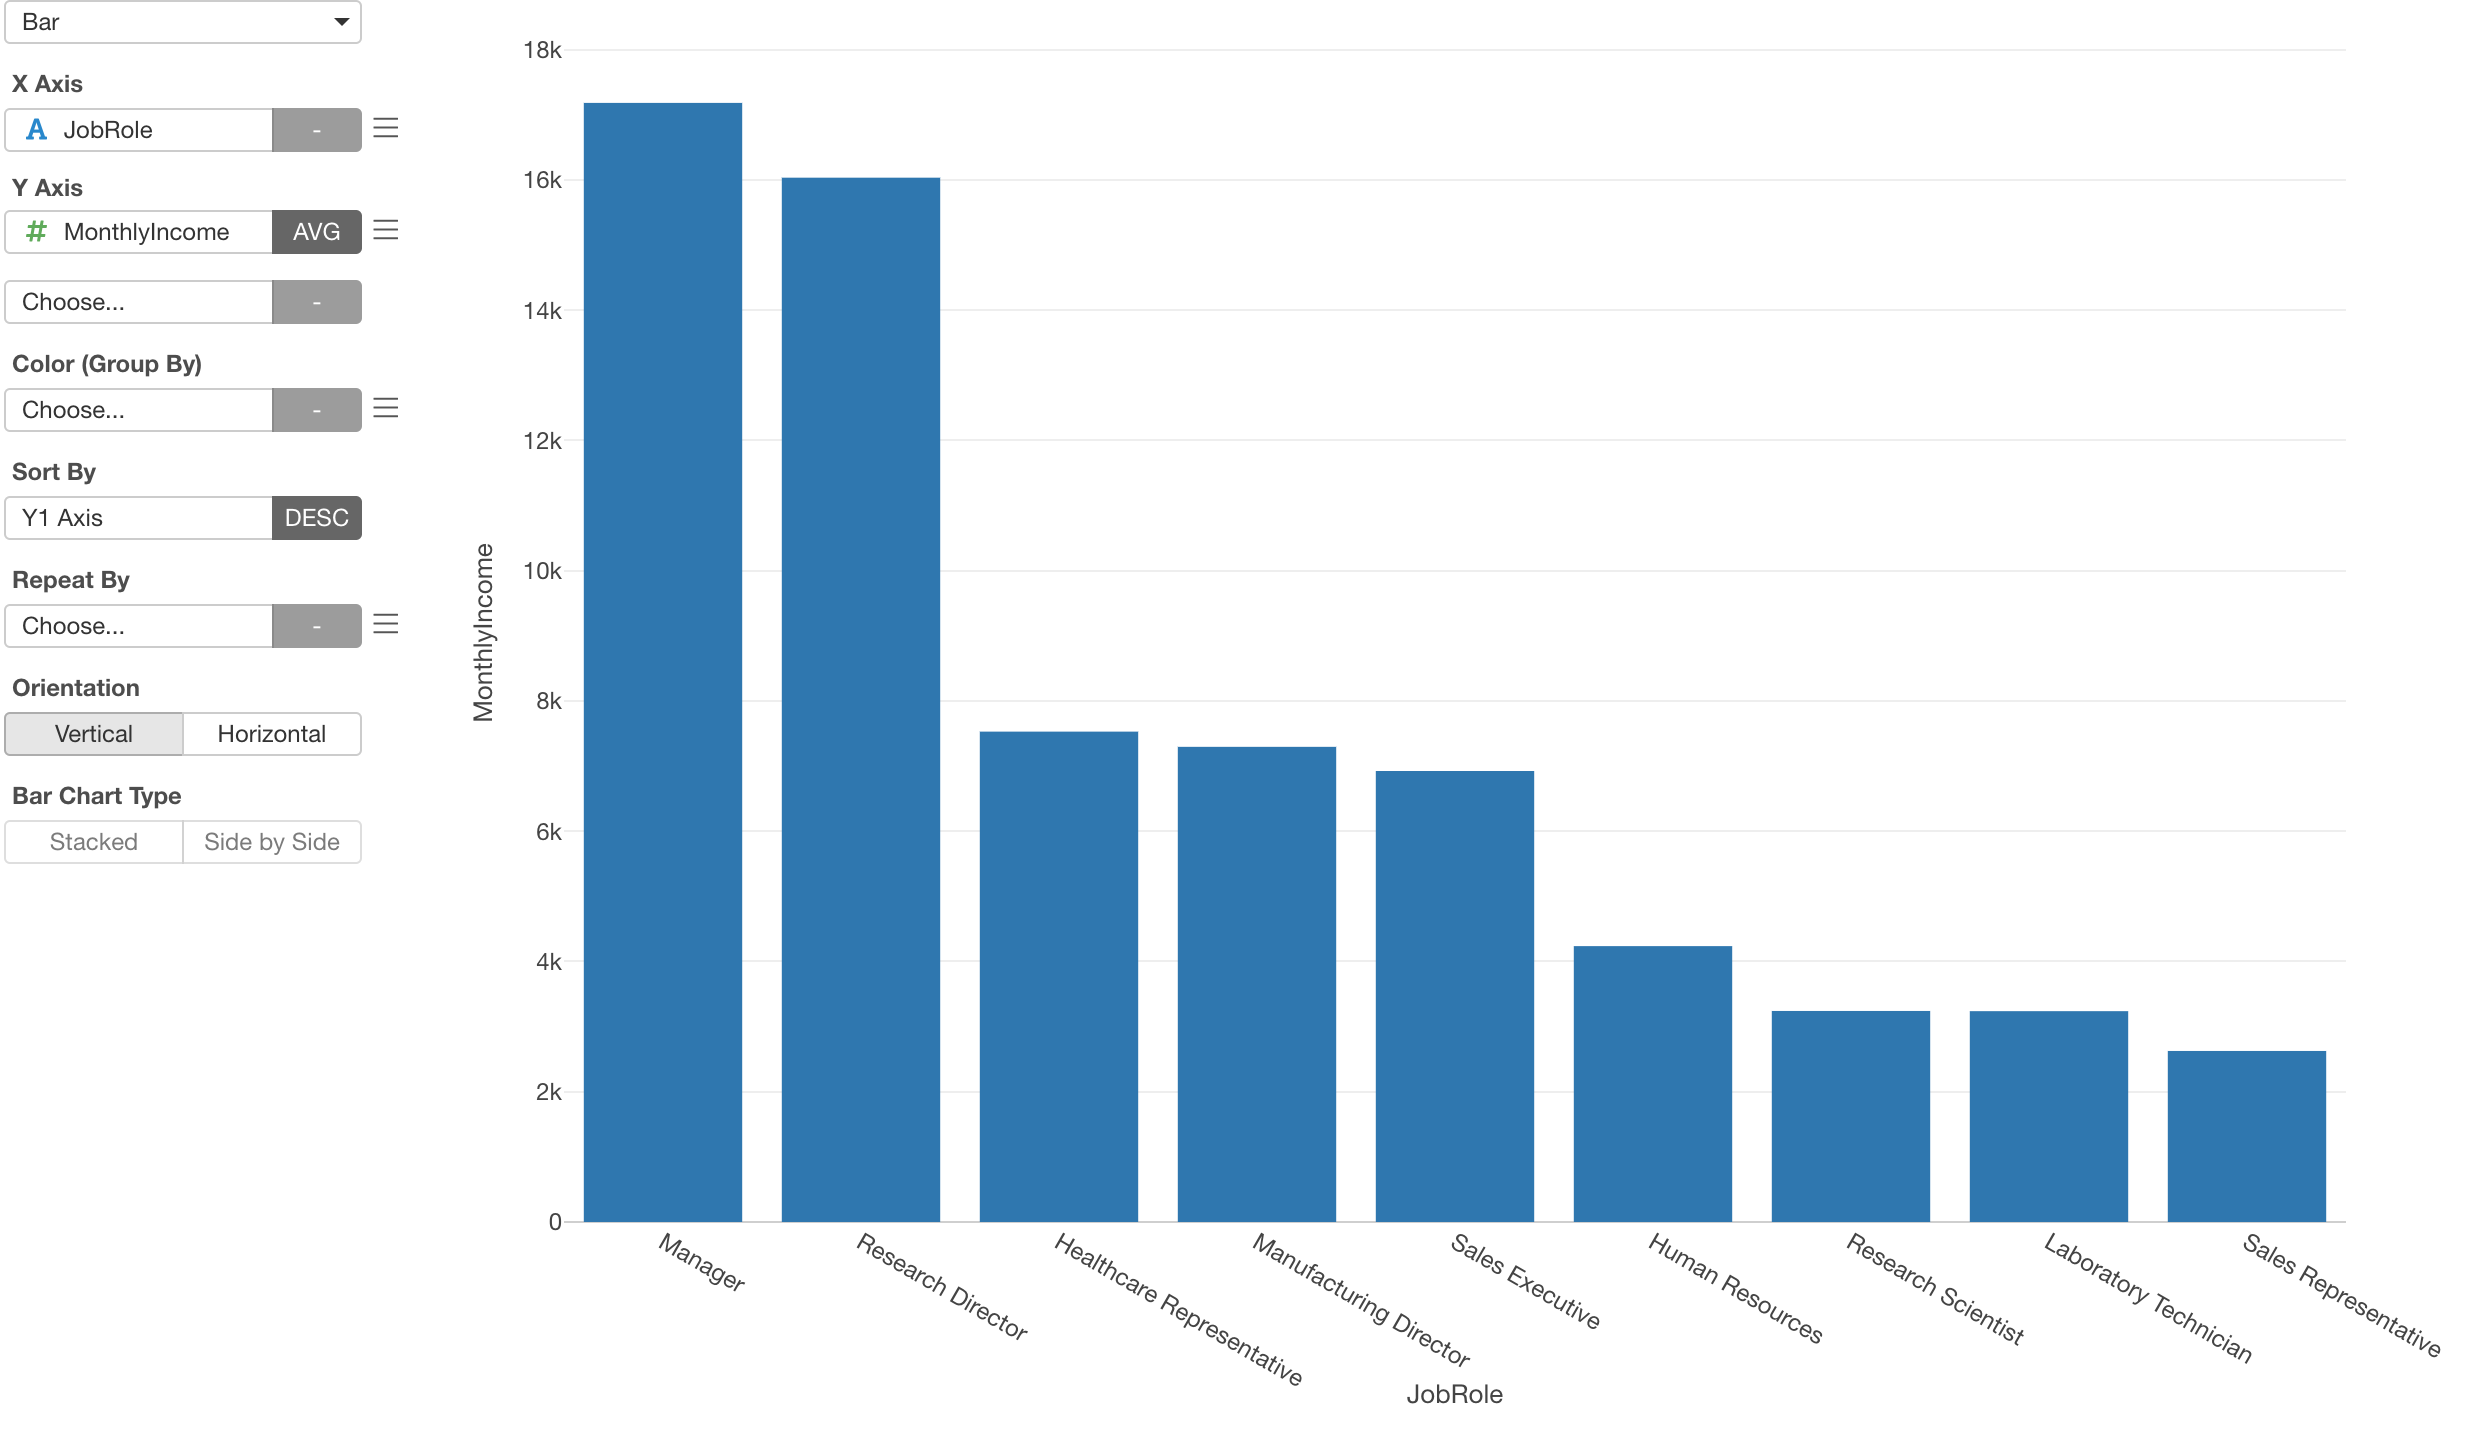
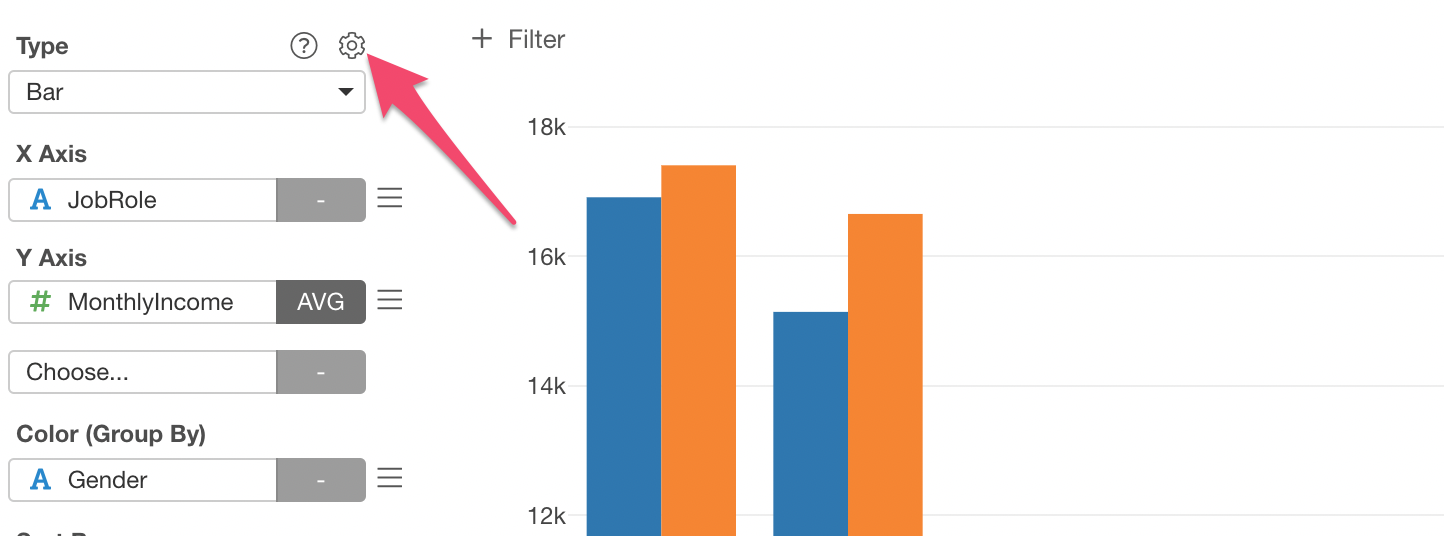
Let’s assign ‘Monthly Income’ column to Y-Axis and visualize the average income by the Job Role.
By default, ‘SUM’ aggregate function is selected, but we can change this by selecting ‘Mean (Average)’ from the aggregate function list.
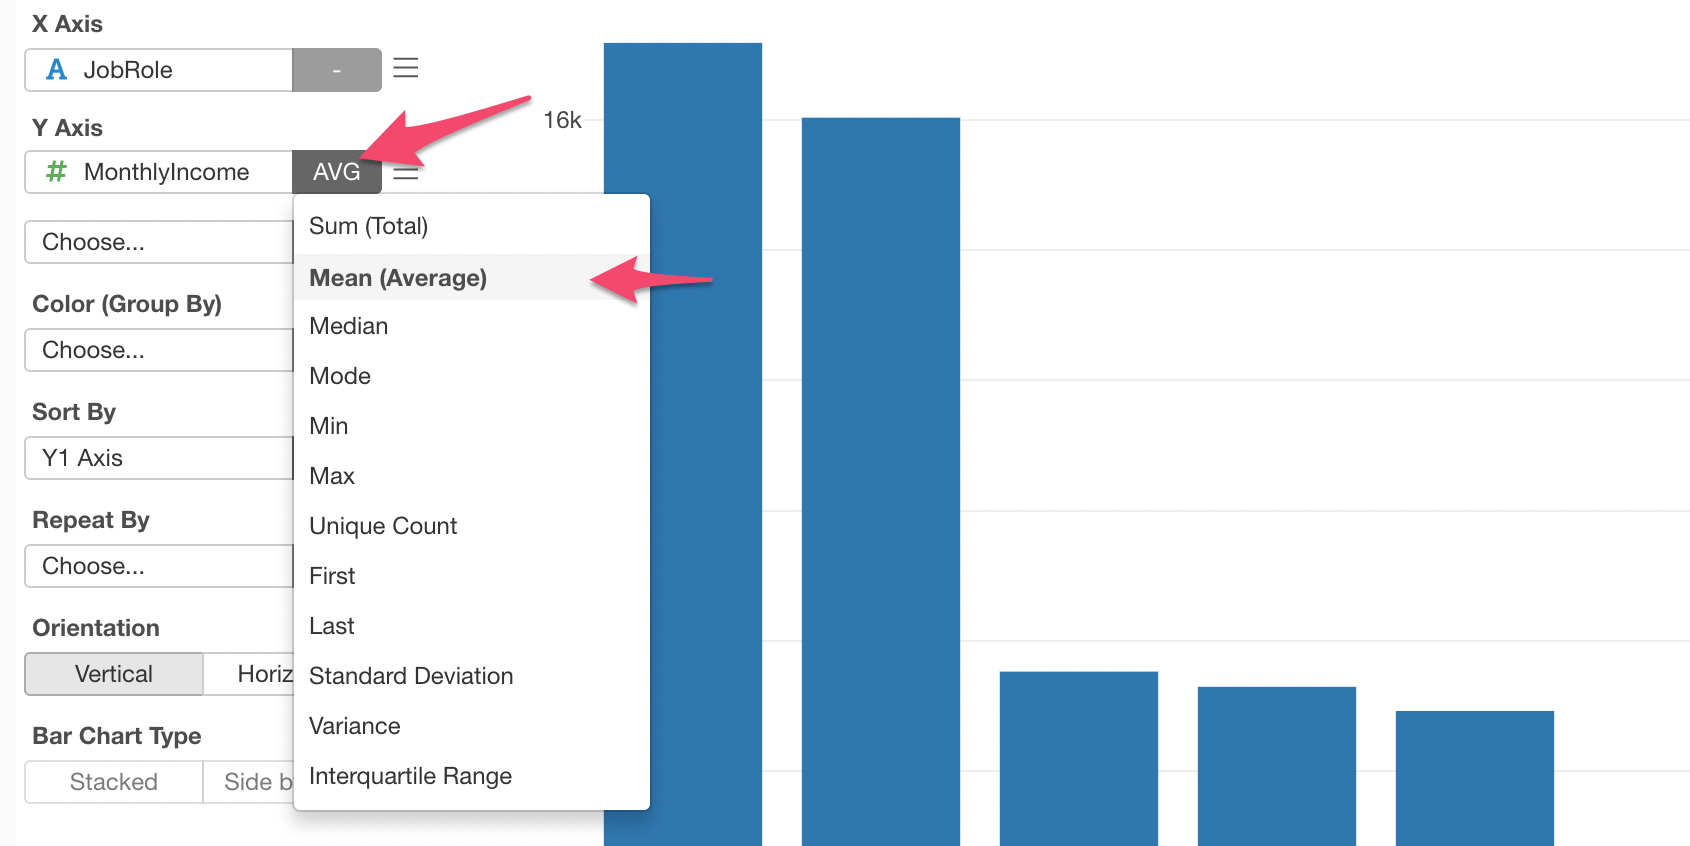
Now, we can see the bars showing the average income for each Job Role.
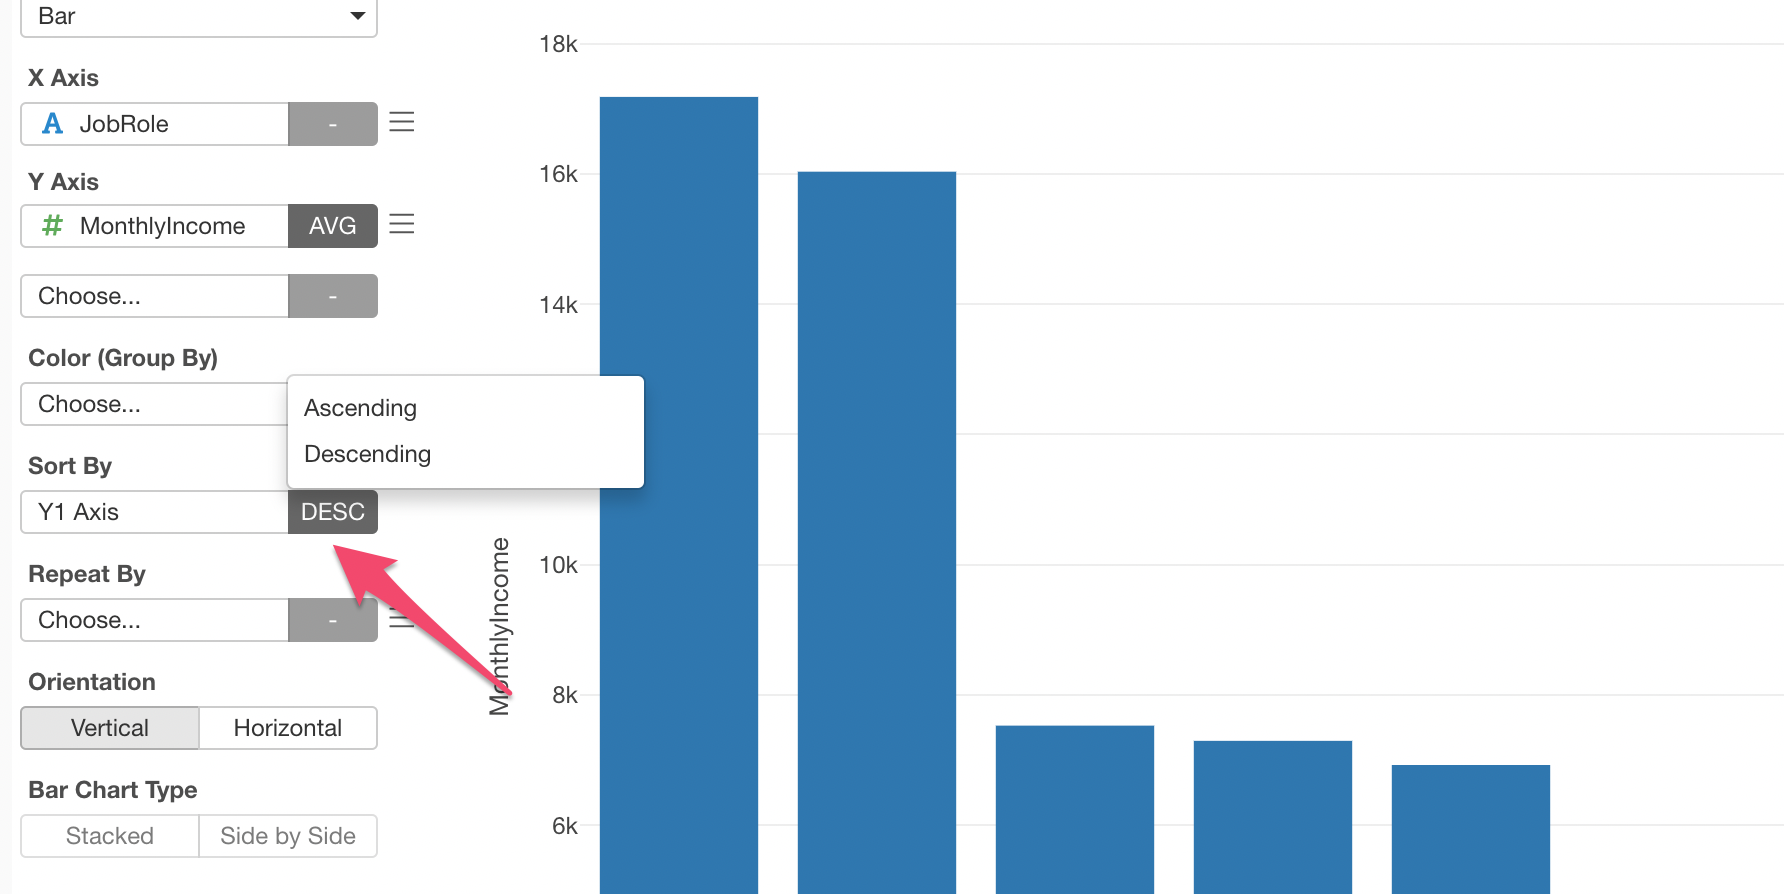
Changing Sort Order of Bars
When you create charts from Summary view, the bars are automatically sorted from the highest to the lowest.
You can configure this from ‘Sort By’.
Breaking Down by Color
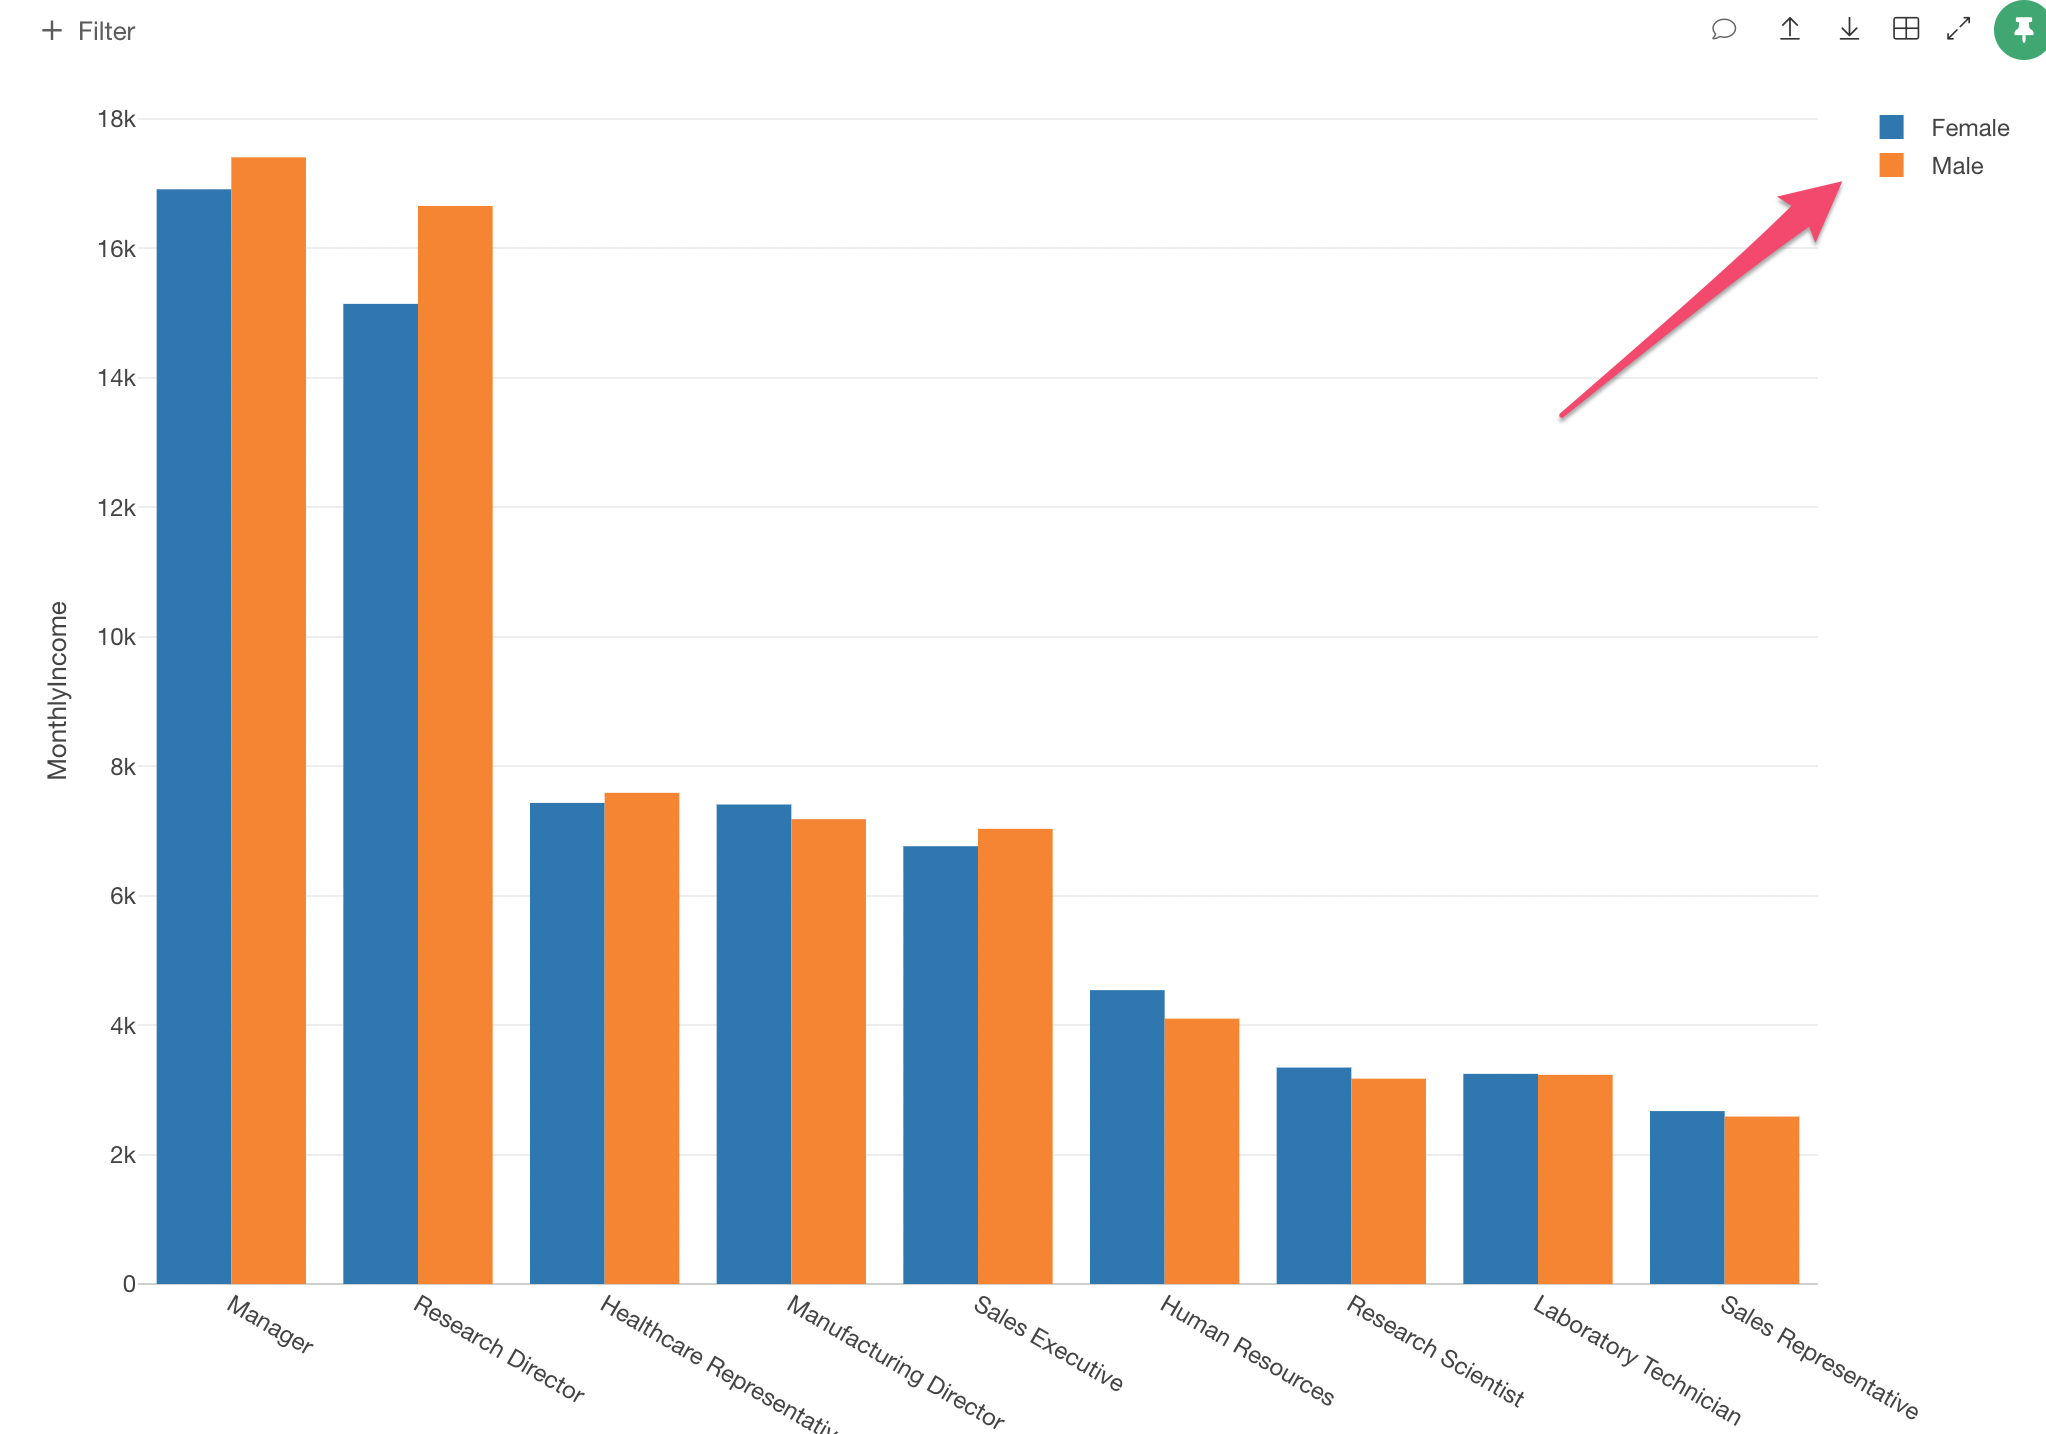
You can assign a column to Color to break down the bars. For example, let’s assign ‘Gender’ column to Color and see how the average incomes differ among men and women.
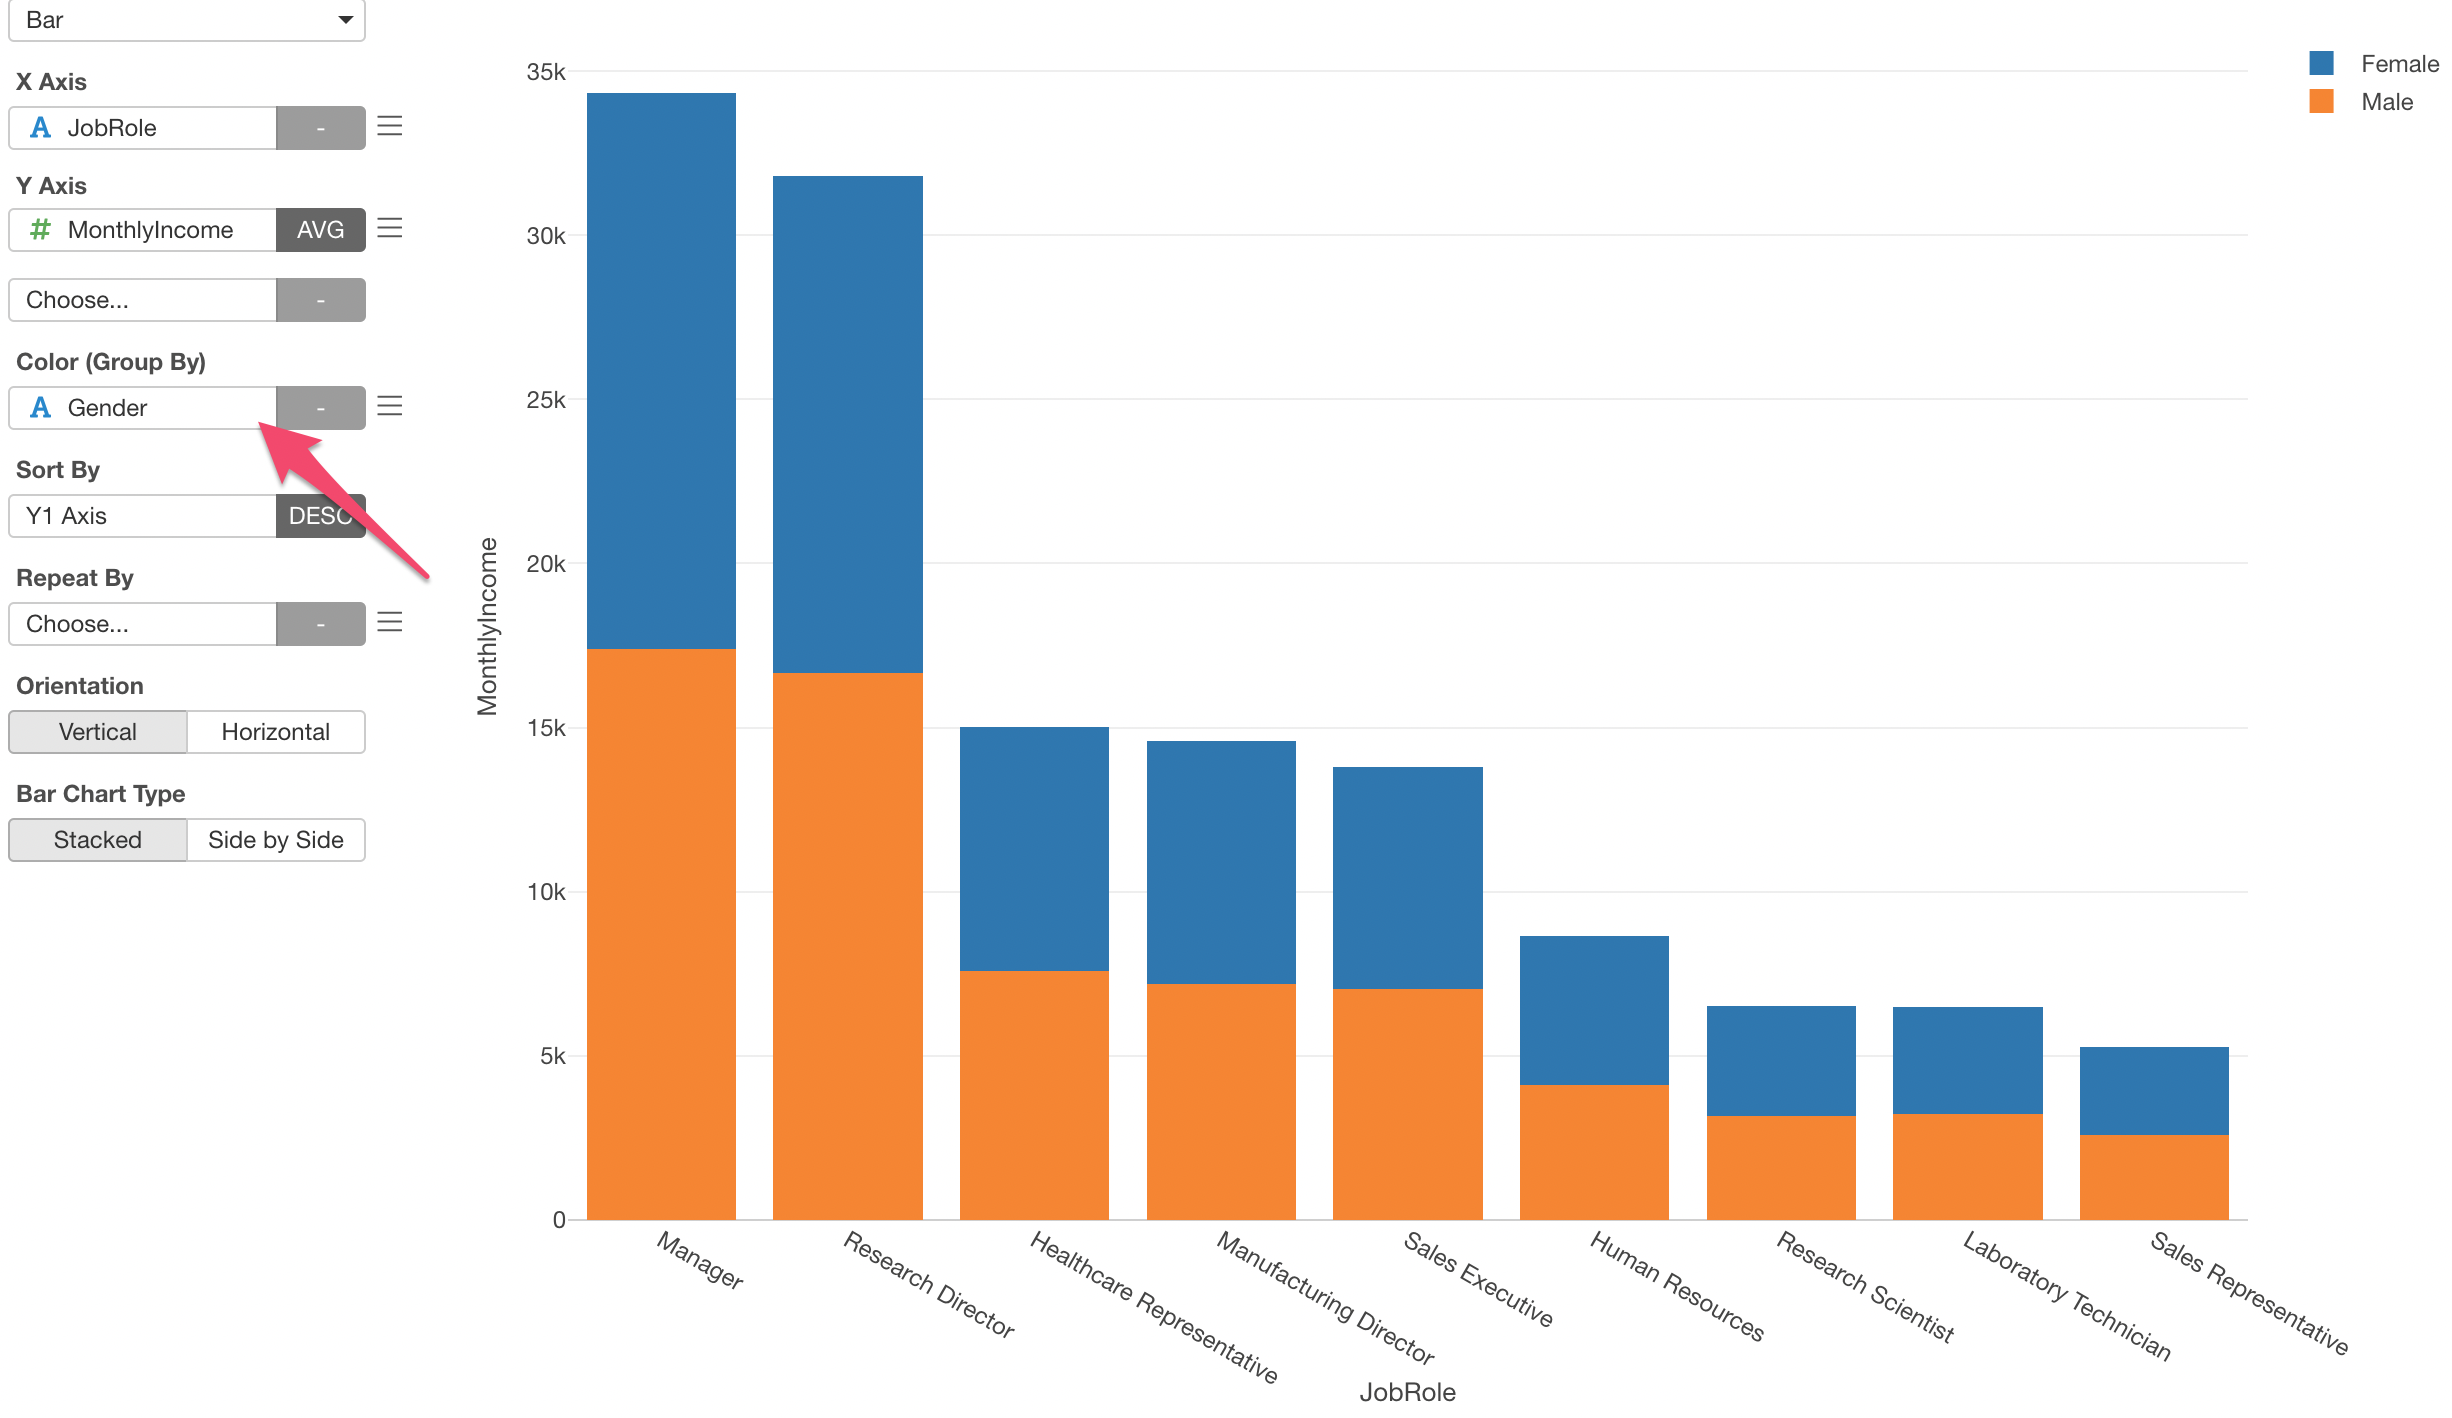
Now, each bar is separated into two, Blue for Female and Orange for Male.
But this view doesn’t help us comparing the Male and the Female for each job role because the Male and the Female bars are stacked together.
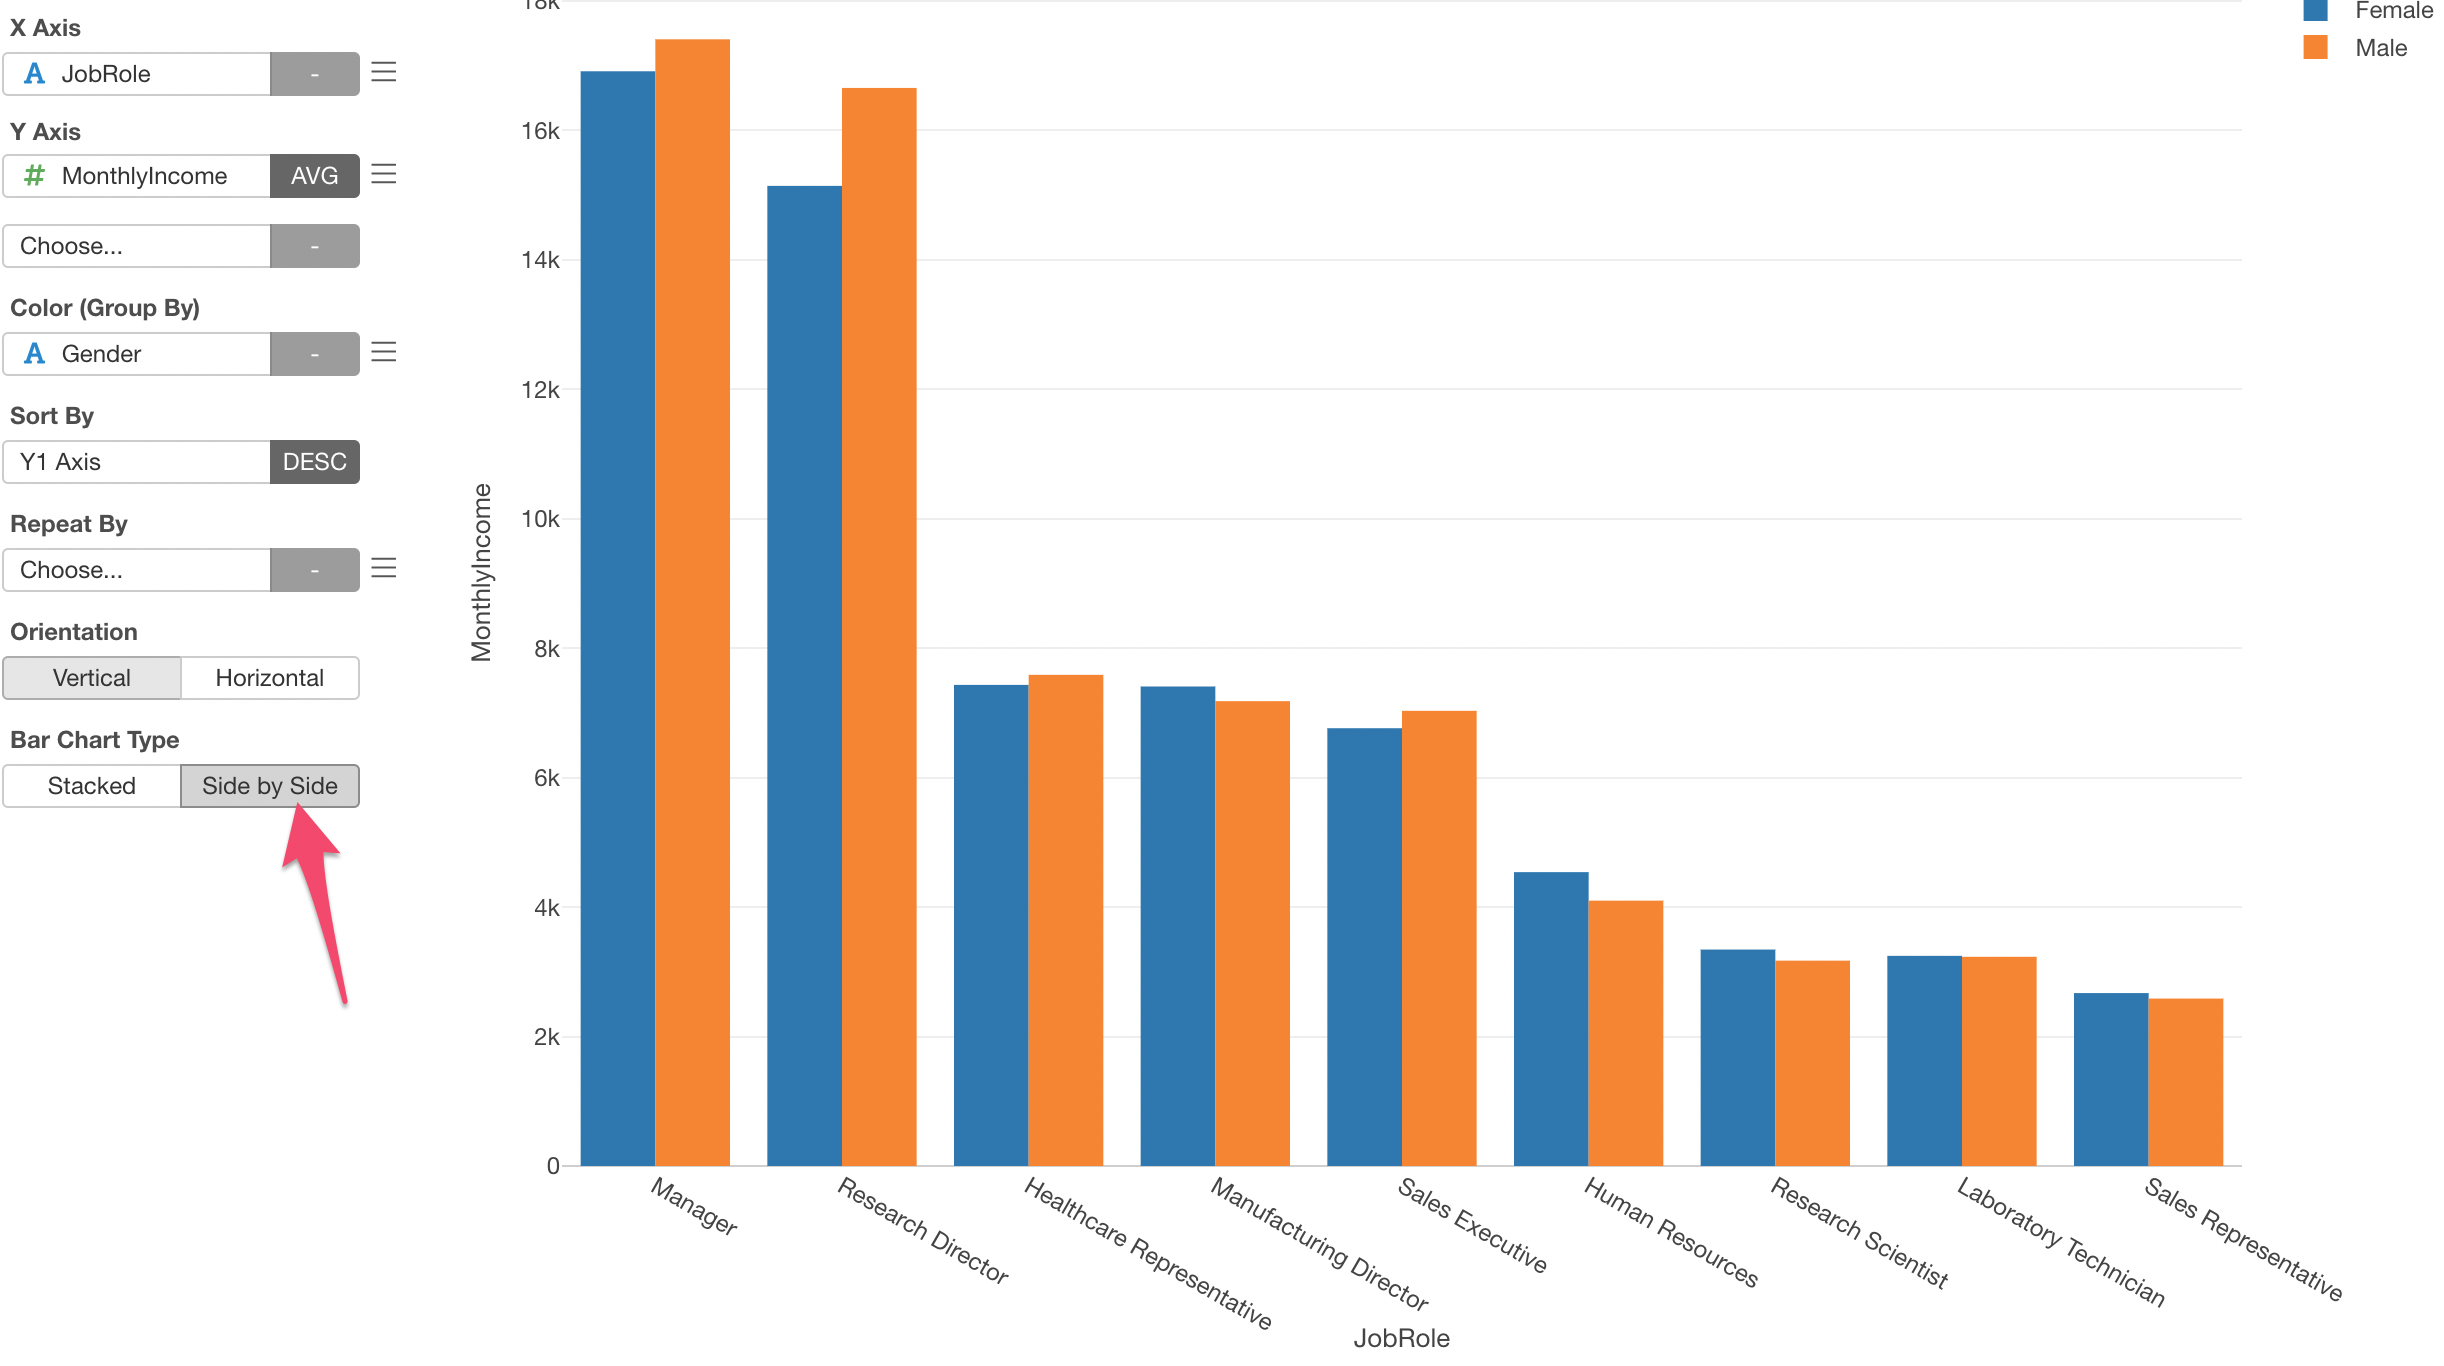
You can change this by clicking ‘Side by Side’ button.
Changing Legend Position
The legend is shown at the right side of the chart by default, but you can change the position from the property.
Click the Property button.
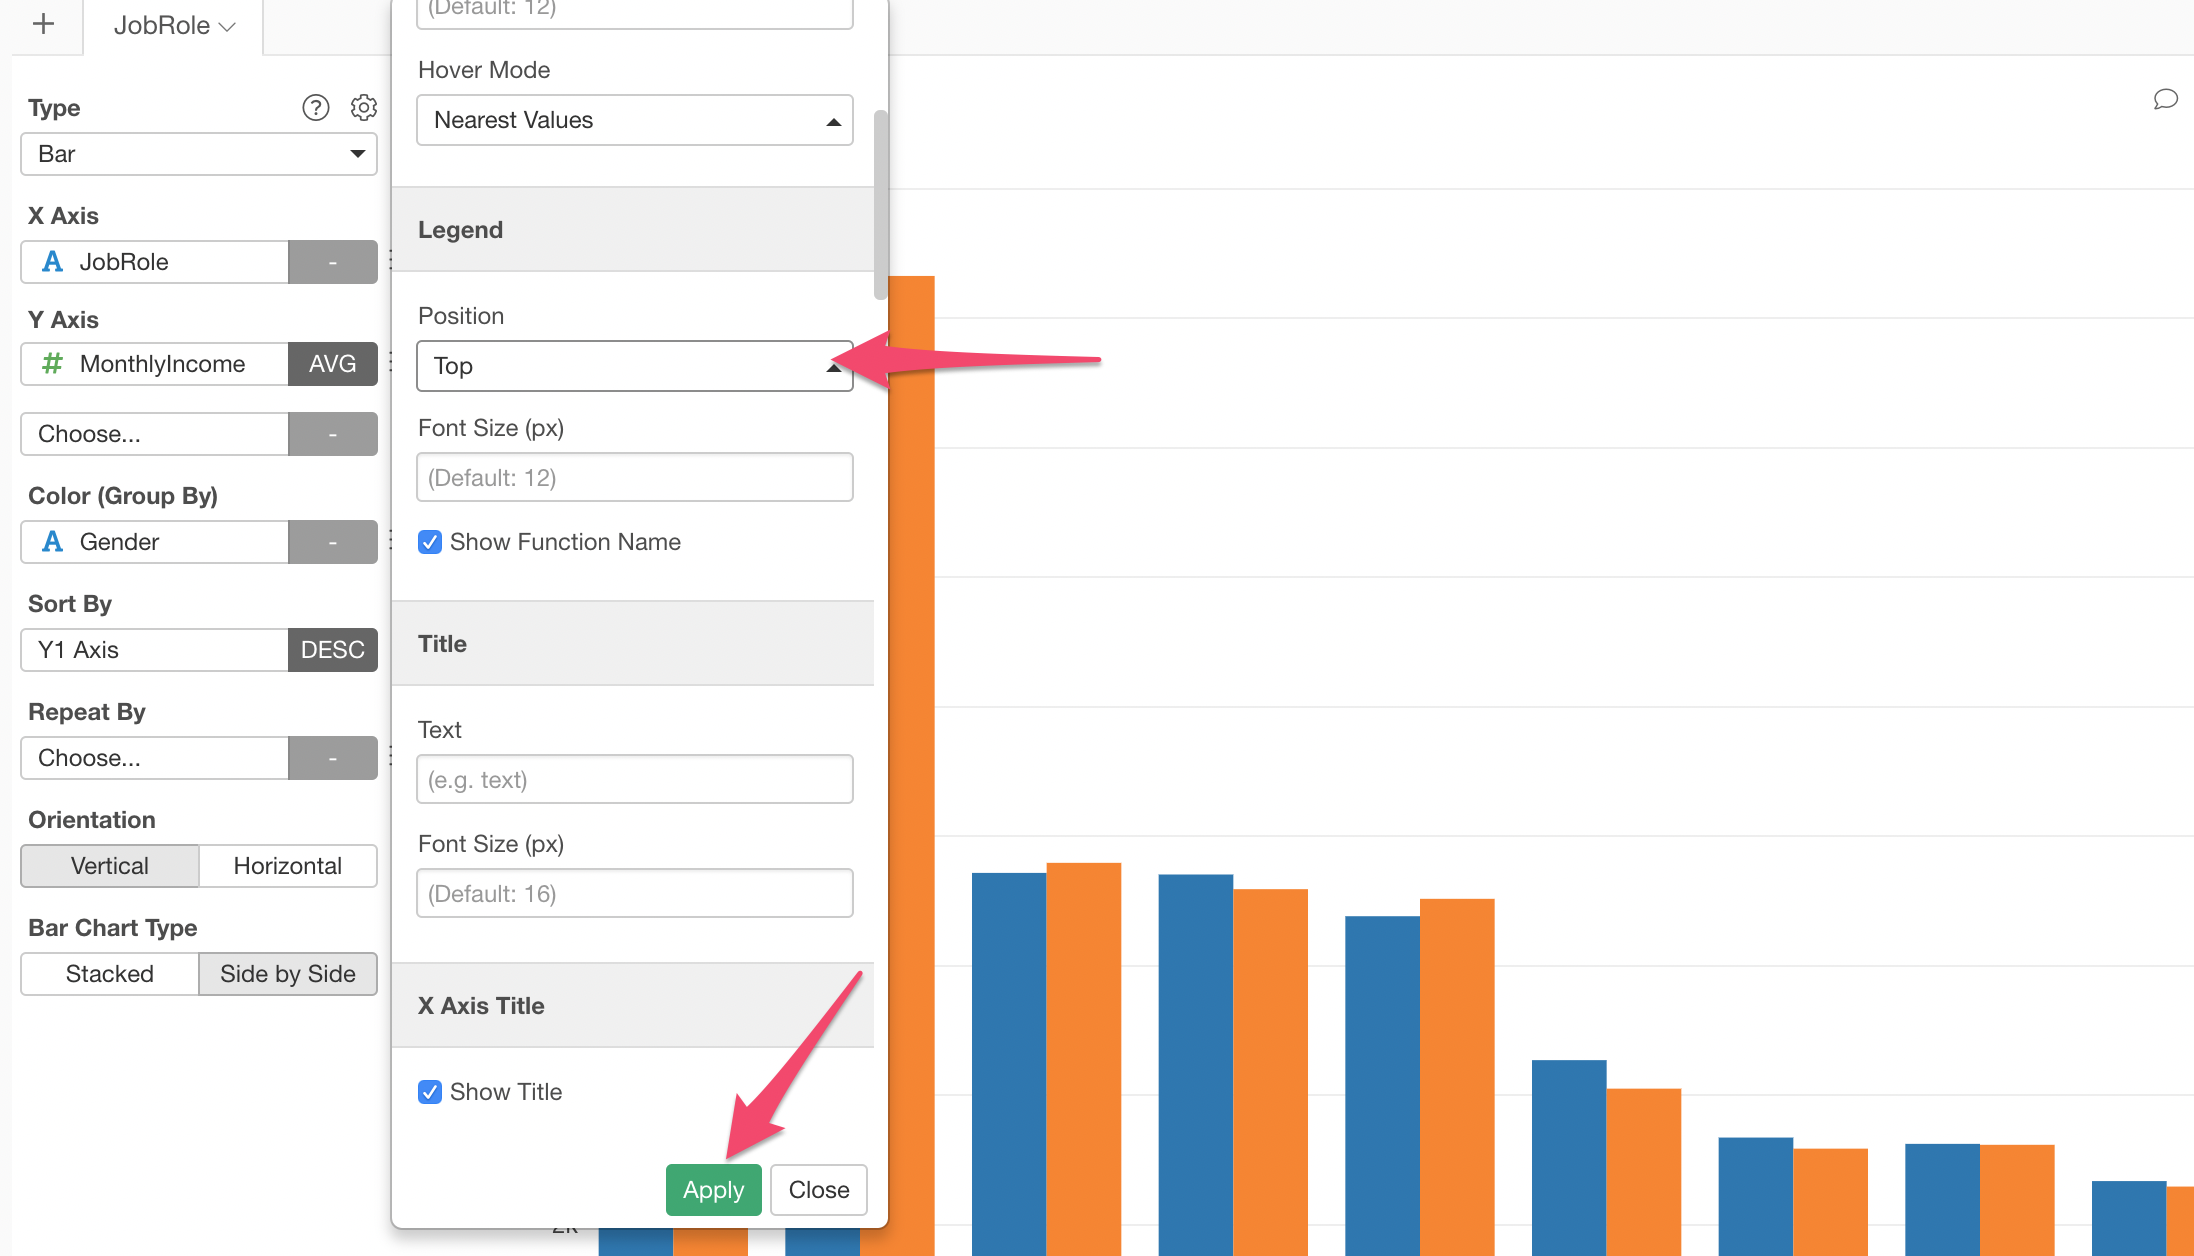
Inside the Property dialog, select ‘Top’ from the Position list and click ‘Apply’ button.
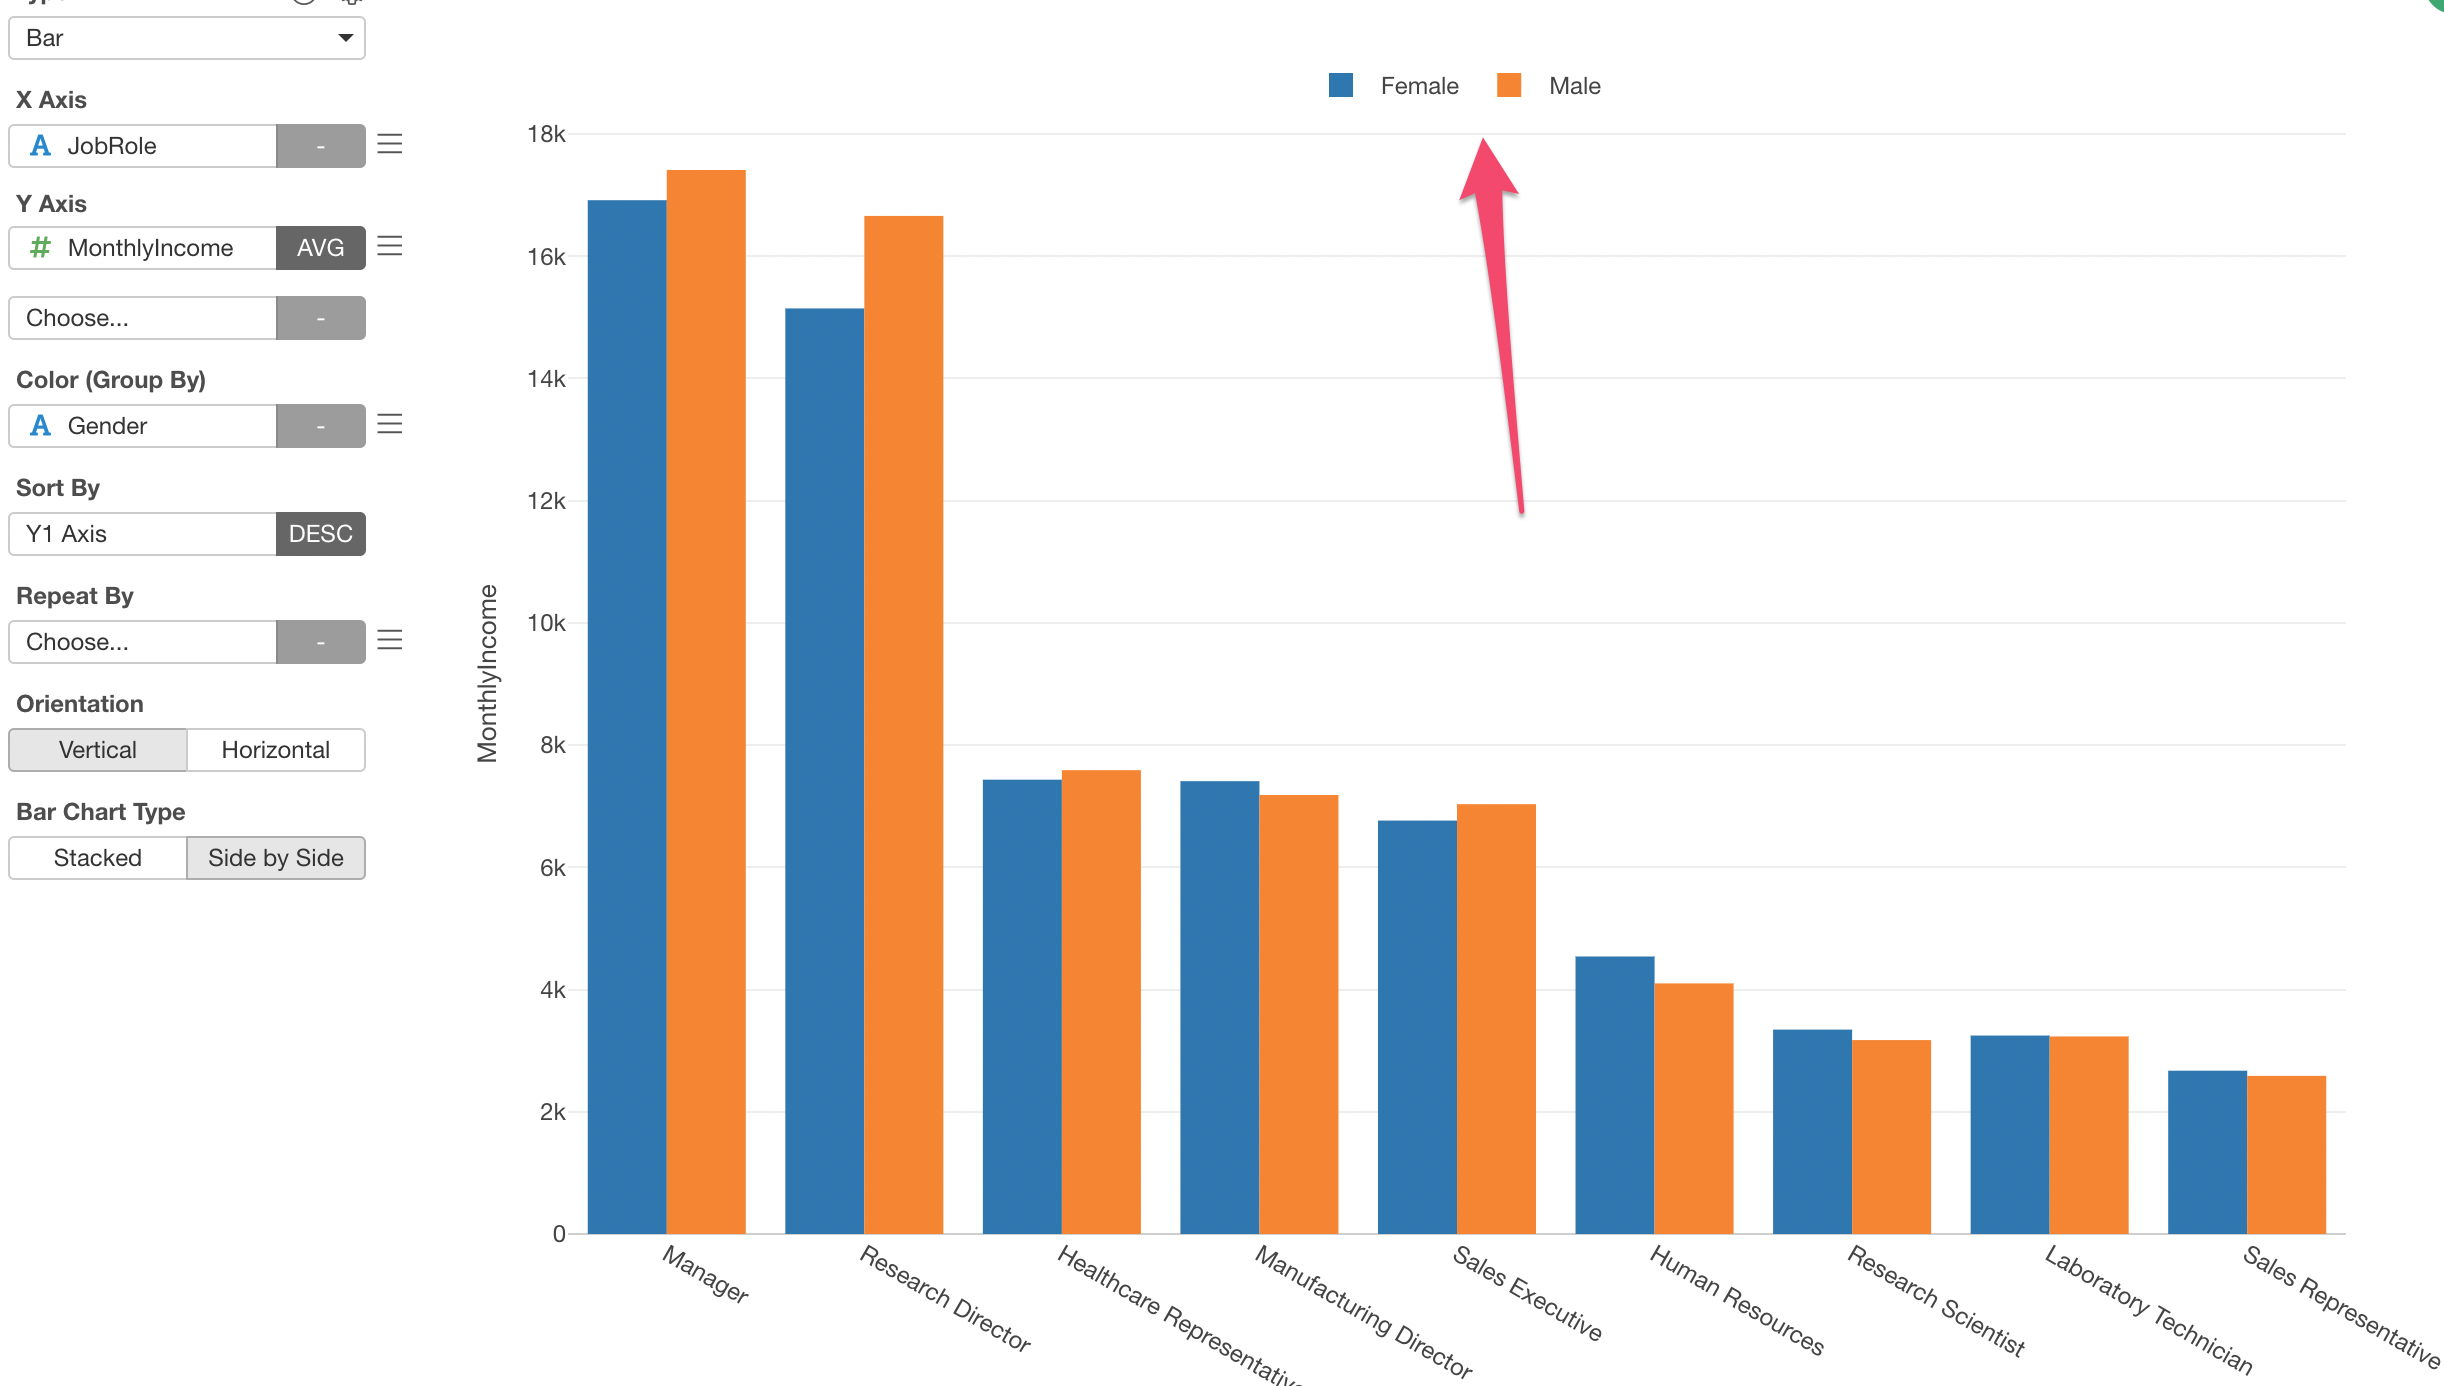
Now, we can see the legend shown at the top of the chart.
Showing Detail Data for a Selected Bar
You can see the detail data by clicking on any bar.
For example, let’s click on the blue bar (Female) of Sales Executive.
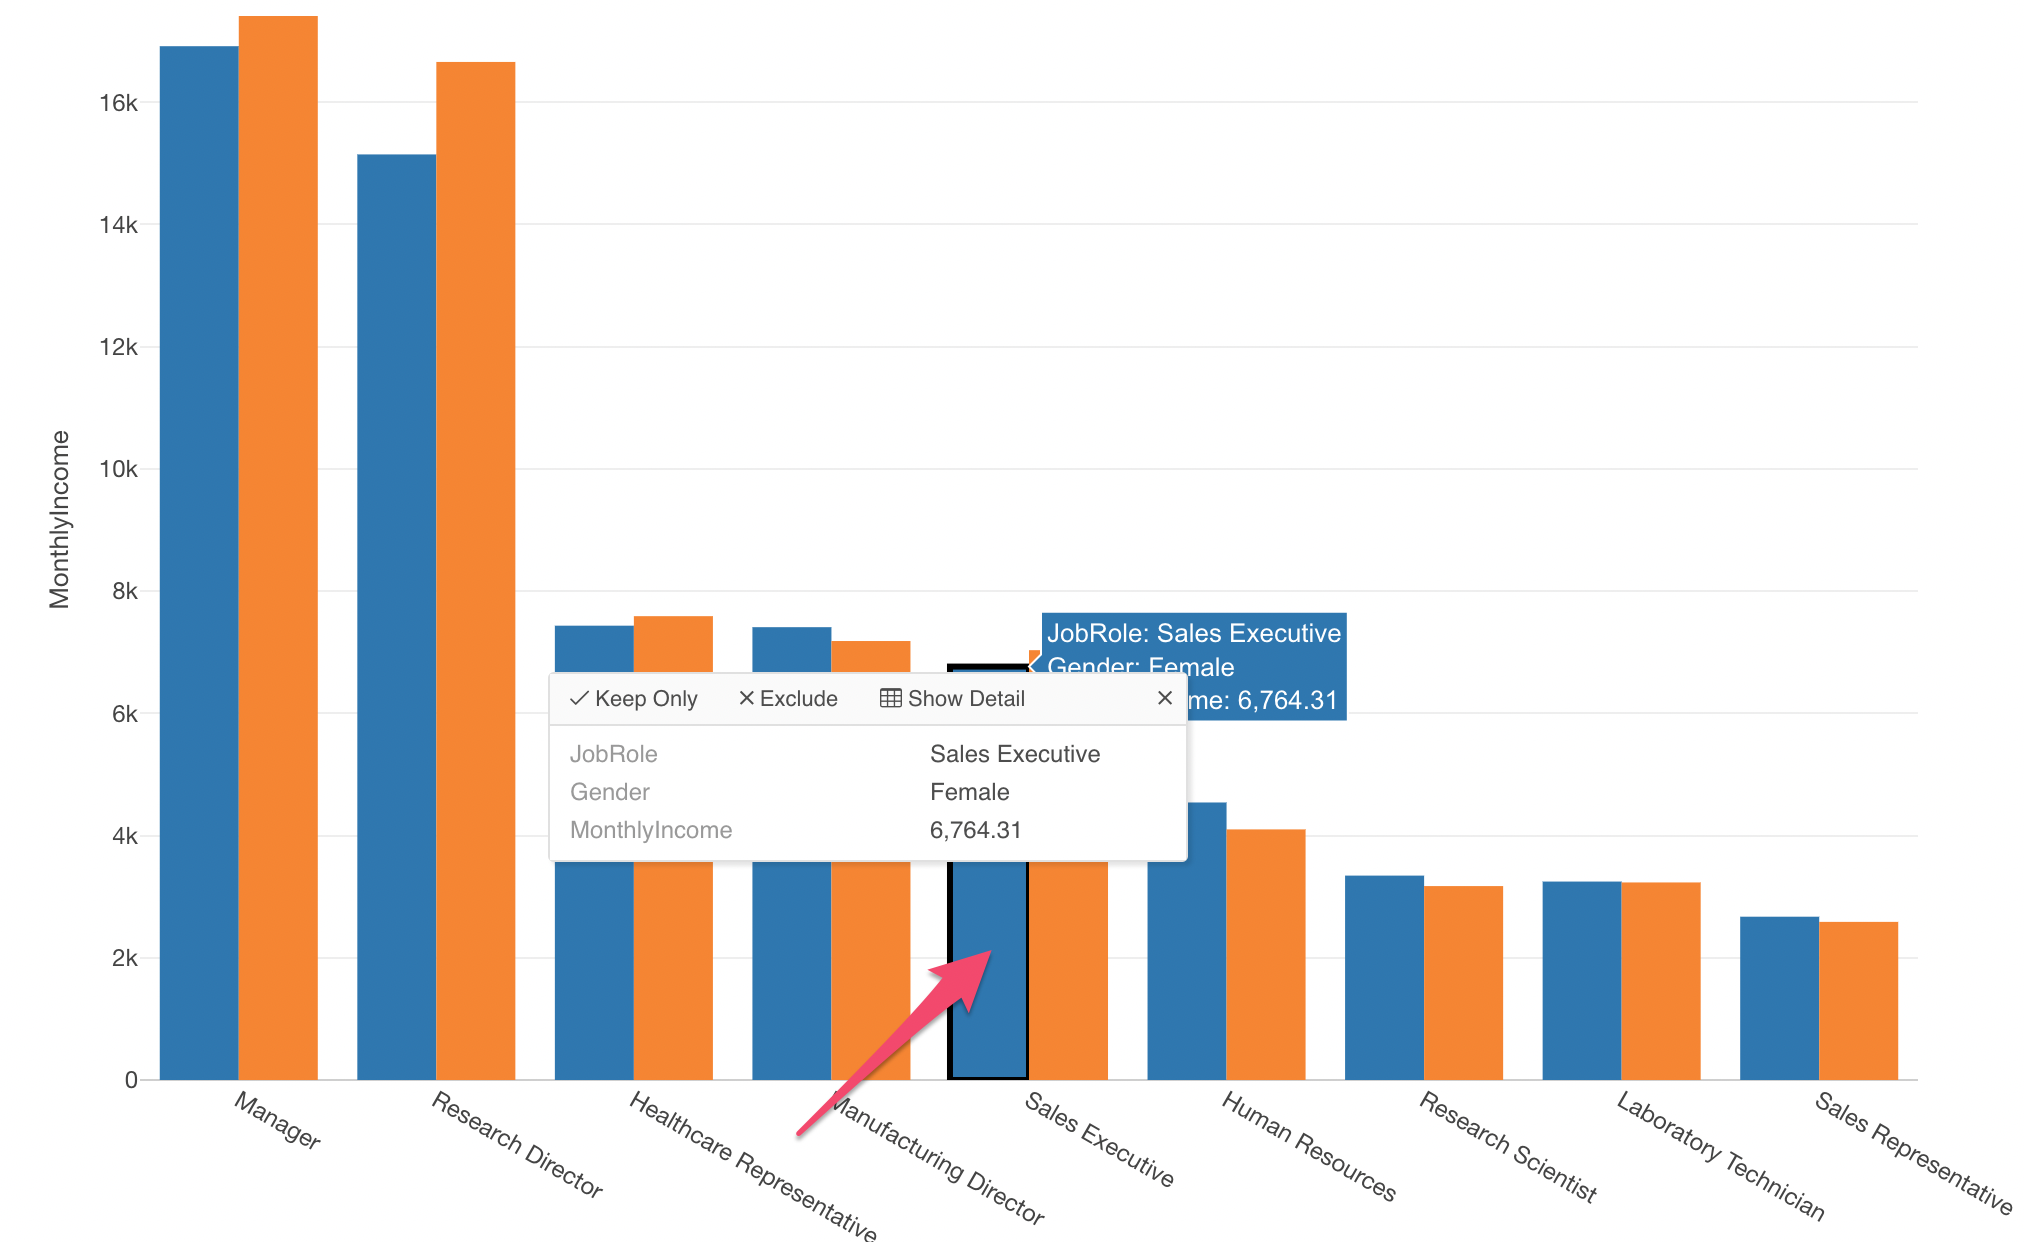
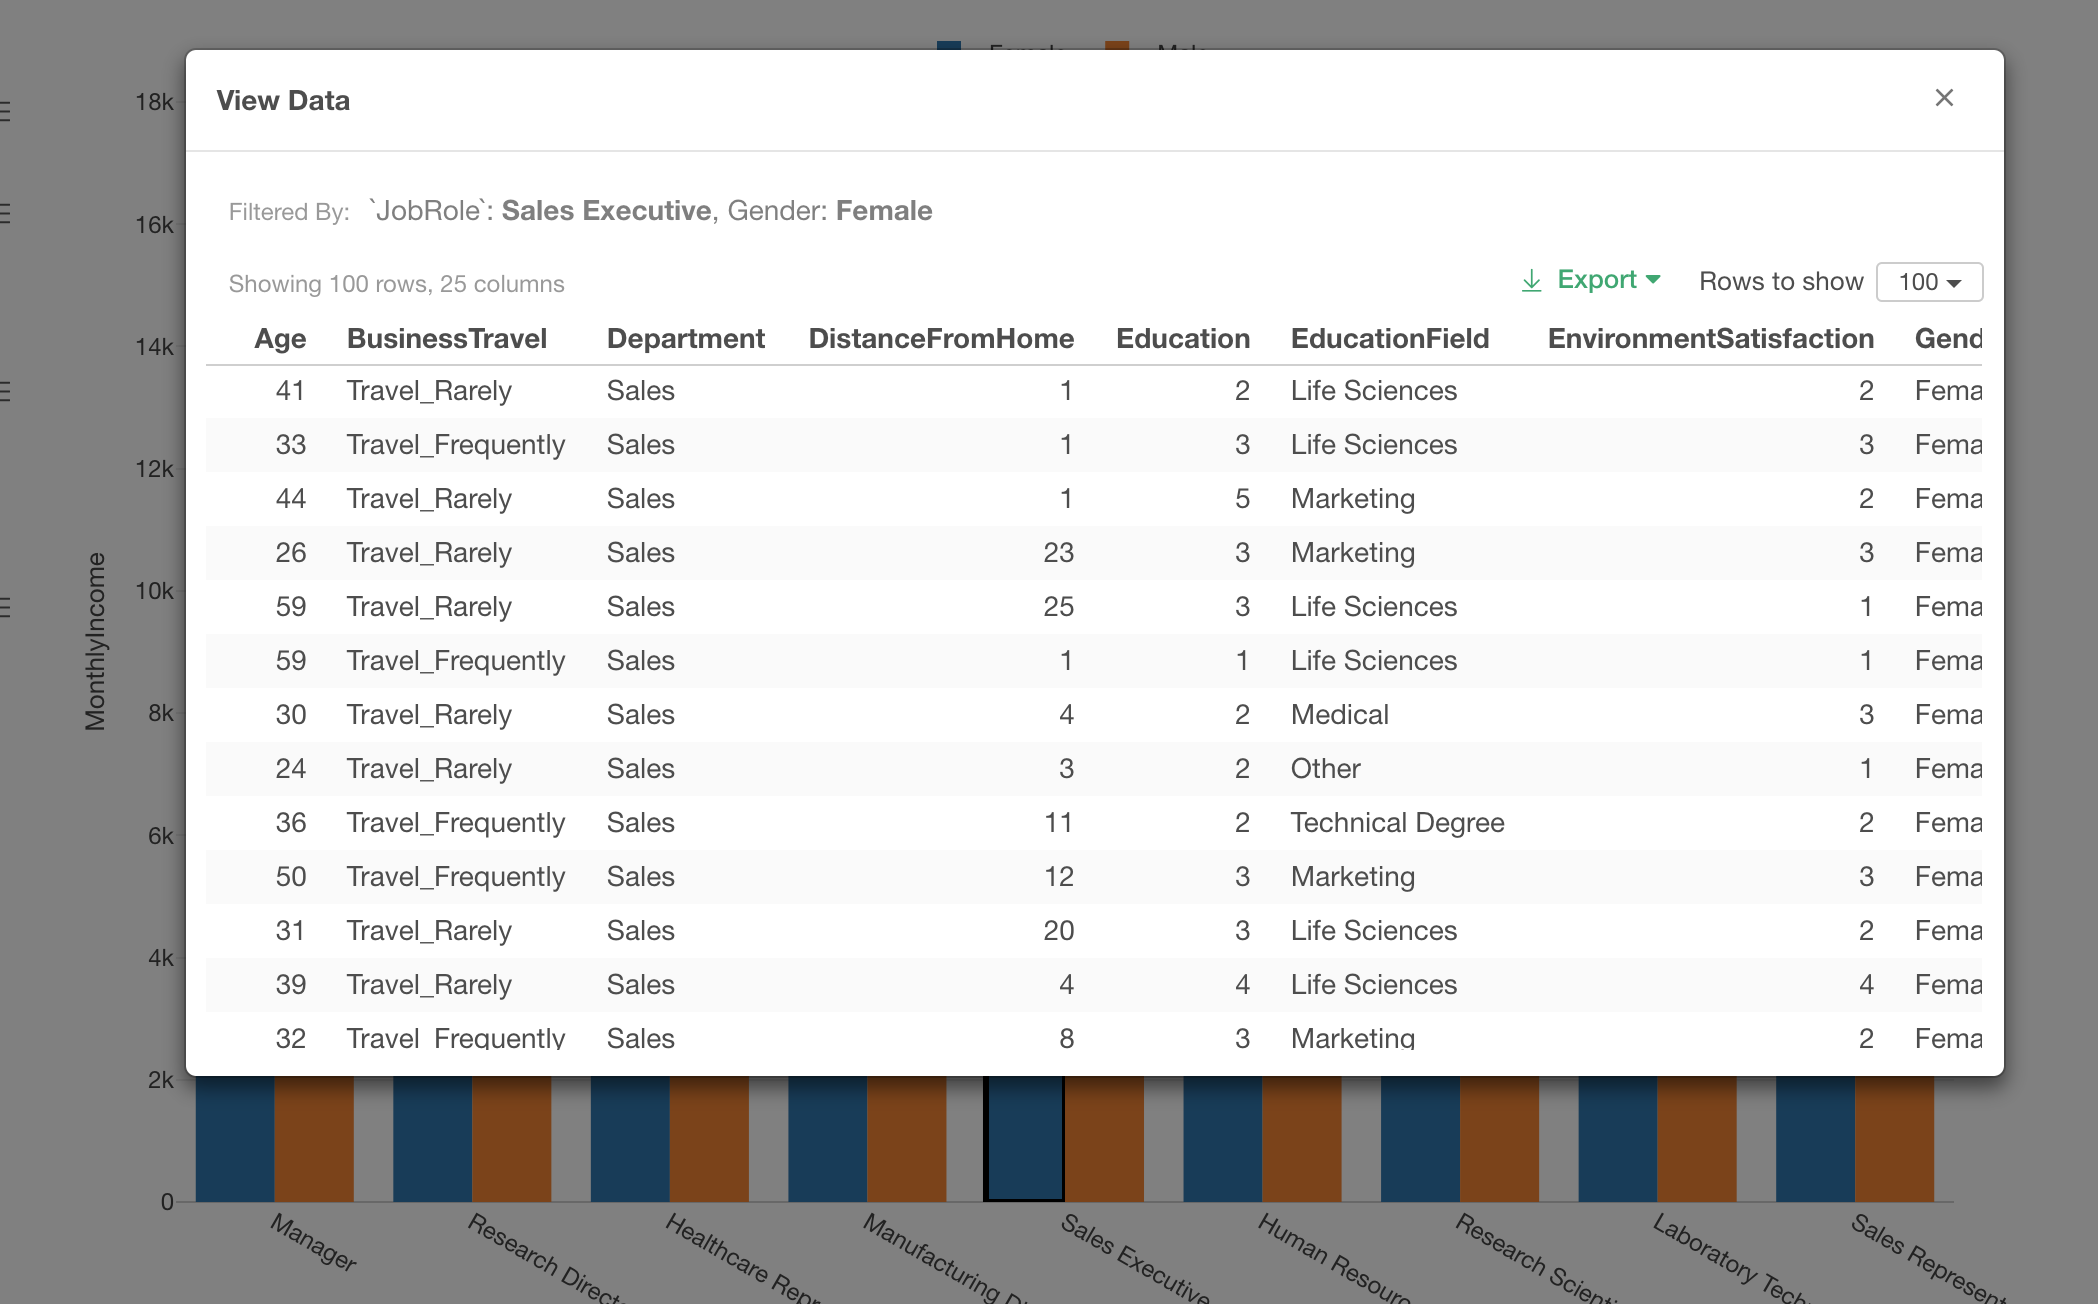
Inside the pop-up, you can click ‘Show Detail’ button at the top to open a dialog where you can see the underlying data for this particular section - Female & Sales Executive.
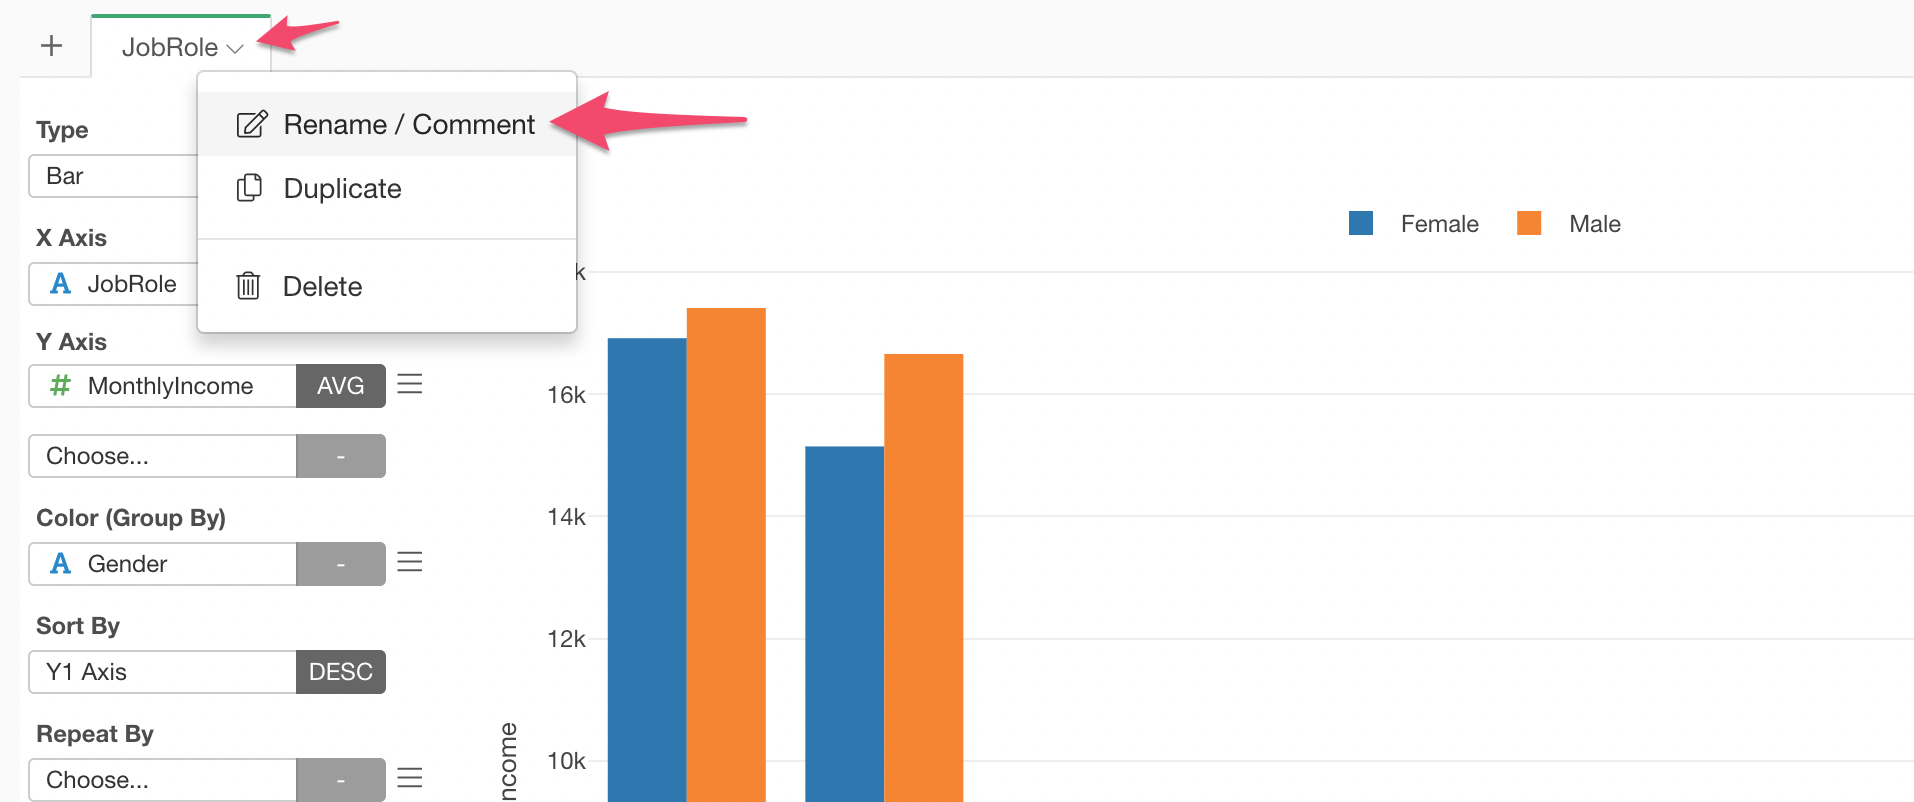
Renaming Chart / Adding Comment
Let’s give a name to this chart and also leave a comment about our finding.
Select ‘Rename / Comment’ from the chart tab menu.
You can type the chart name and the comment in the dialog to make it easier to remember what this chart is at later times.
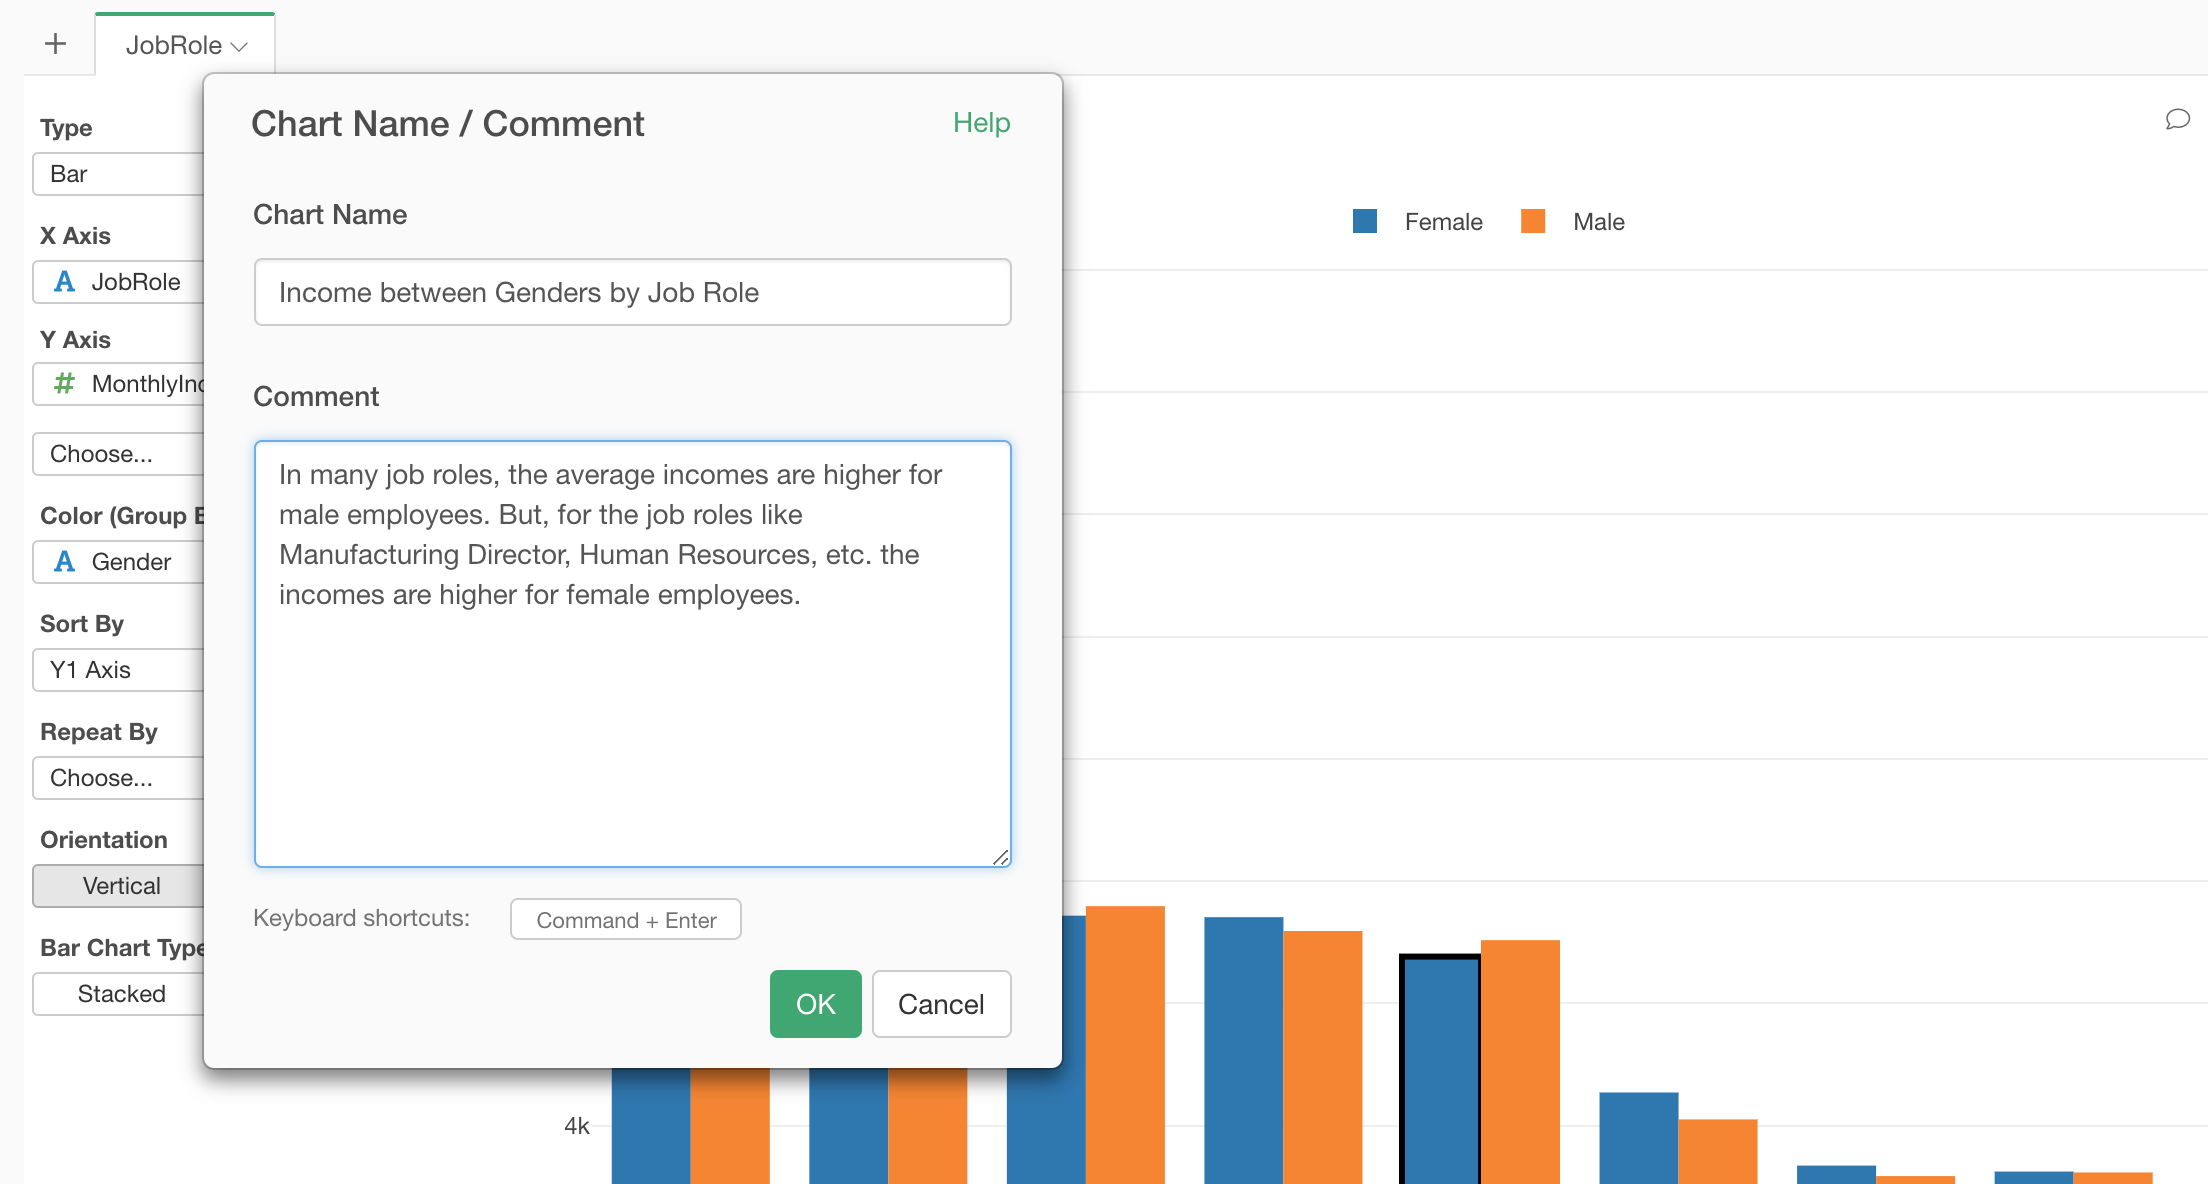
Once you save this by clicking ‘OK’ button, you can see them displayed in the pop-up when you move the mouse pointer on the chart tab.
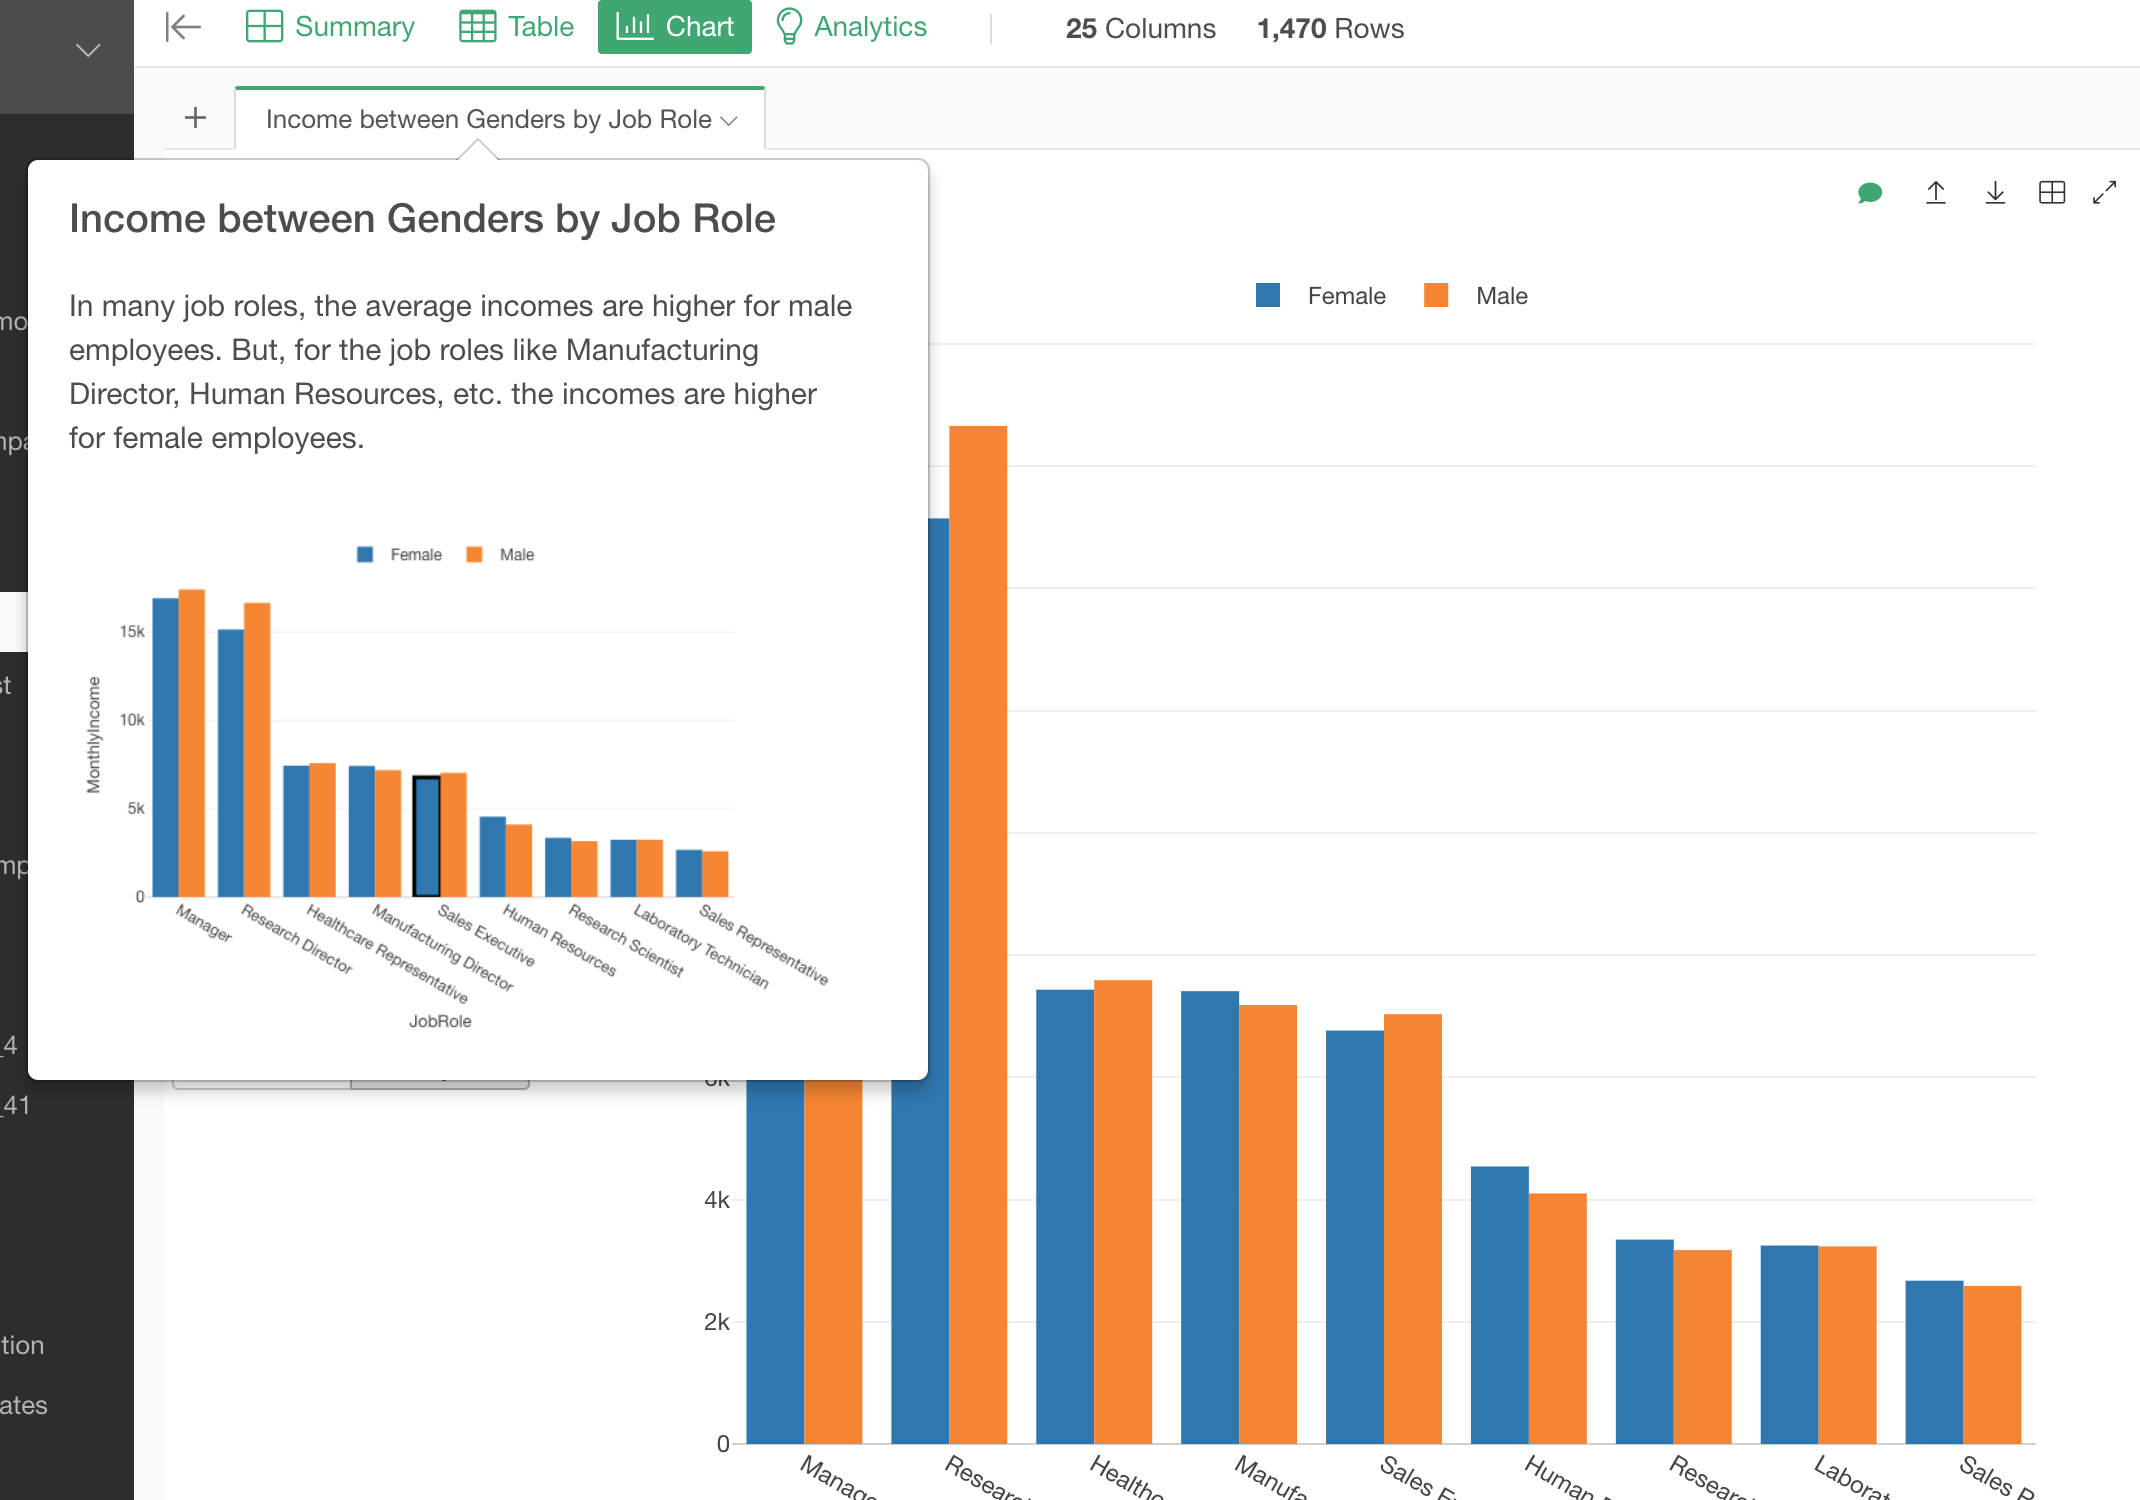
This would be convenient when you try to find the chart later after creating many charts and also when you want to put together your findings into a report.
How to Use Exploratory
There are many other ‘How-to’ notes, check them out from this list page.
Also, we have put together ‘How to start Exploratory’ note where you can find a series of our hand picked ‘how-to’ to get you started quickly.