What makes Google Store Apps get higher rating?
We’ve got this Google Playstore’s apps review data.
One of the columns is called ‘Rating’, which is an average score given to each app.
I wanted to see what influences the higher or the lower rating for the apps.
For example, there are columns like ‘Type’, which can identify if a given app is either Free or Paid. I wonder if this matters when it comes to the apps rating scores.
There are other columns like Review counts, Install counts, Review comment’s sentimen scores, etc. and I’d like to see if these have any correlated relationships with the rating score.
How the variance of App Rating Score
By looking at the summary view, we can see that most of the rating scores are between 4 and 5 with the average being 4.17 and the median being 4.3.
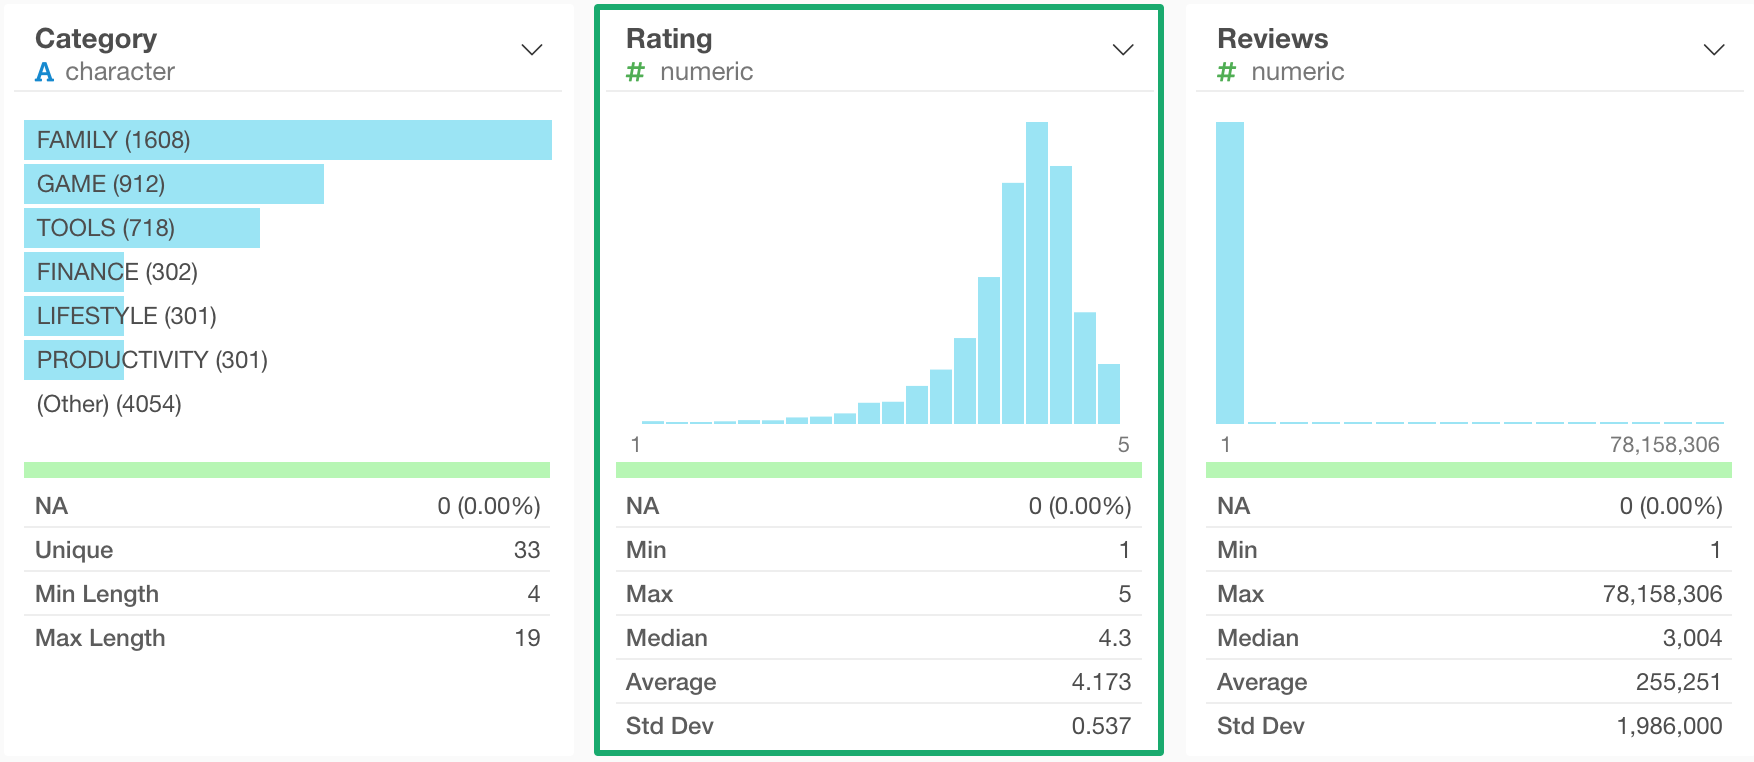
Here is a more detailed histogram.
Are the variances different between Paid and Free apps?
By comparing the variances of the rating score of Paid apps and Free apps with a density plot like the below, we can see that the Paid apps tend to have better rating scores than the Free apps.
Here’s the same information of the variance shown with Boxplot chart. Again, the Paid apps tend to show a bit higher rating scores.
When people pay for the apps they have already liked the apps so they tend to give higher rating scores compared to what they would have done for the Free apps. What we are looking at with these charts matches with the conventional wisdom.
Correlation between Rating and Review
Another thing I wanted to know is if there is any correlation between number of the reviews and the rating scores. For example, when the apps get high number of the reviews that might be because they really like the apps or they really hate the apps. Another word, if the apps are just so so then people don’t get up their chairs and make any reviews.
By drawing a trend line, it looks that there is a sort of upward trend between Reviews and Rating, which means that the more reviews the apps get the higher rating scores they get. But the correlation is 0.06, so there is no strong correlation there.
We can see that there are many apps with large number of reviews around 4.5 rating.
I have categorized the Reviews variable into 10 classes and visualize the relationship between the Reviews and the Rating scores with Heatmap.
Here is one for the Free apps.
There are many apps with large number of the reviews whose rating scores are ranging between 4.2 and 4.6. But surprisingly, the largest number of the apps is found in the intersection of the least number of the reviews and the highest rating. These are the apps that don’t get many reviews but they tend to score high when they get them.
Here is one for the Paid apps.
This, too, shows basically the similar trend. That is, 1) the largest number of the apps is found in the intersection of the least number of the reviews and the highest rating, and 2) there are many apps with large number of the reviews whose rating scores are around 4.5.
Correlation between Rating and Sentiment of Review Comments
There is a column that shows the sentiment of the review comments. The higher the sentiment scores are the happier the sentiments are. The lower the scores are the less happy the sentiments are. And the zero means neutral.
The question is, if the sentiment score correlates with the rating score? This seems to be obvious. If you are making positive sentiment reviews you would give higher rating, right?
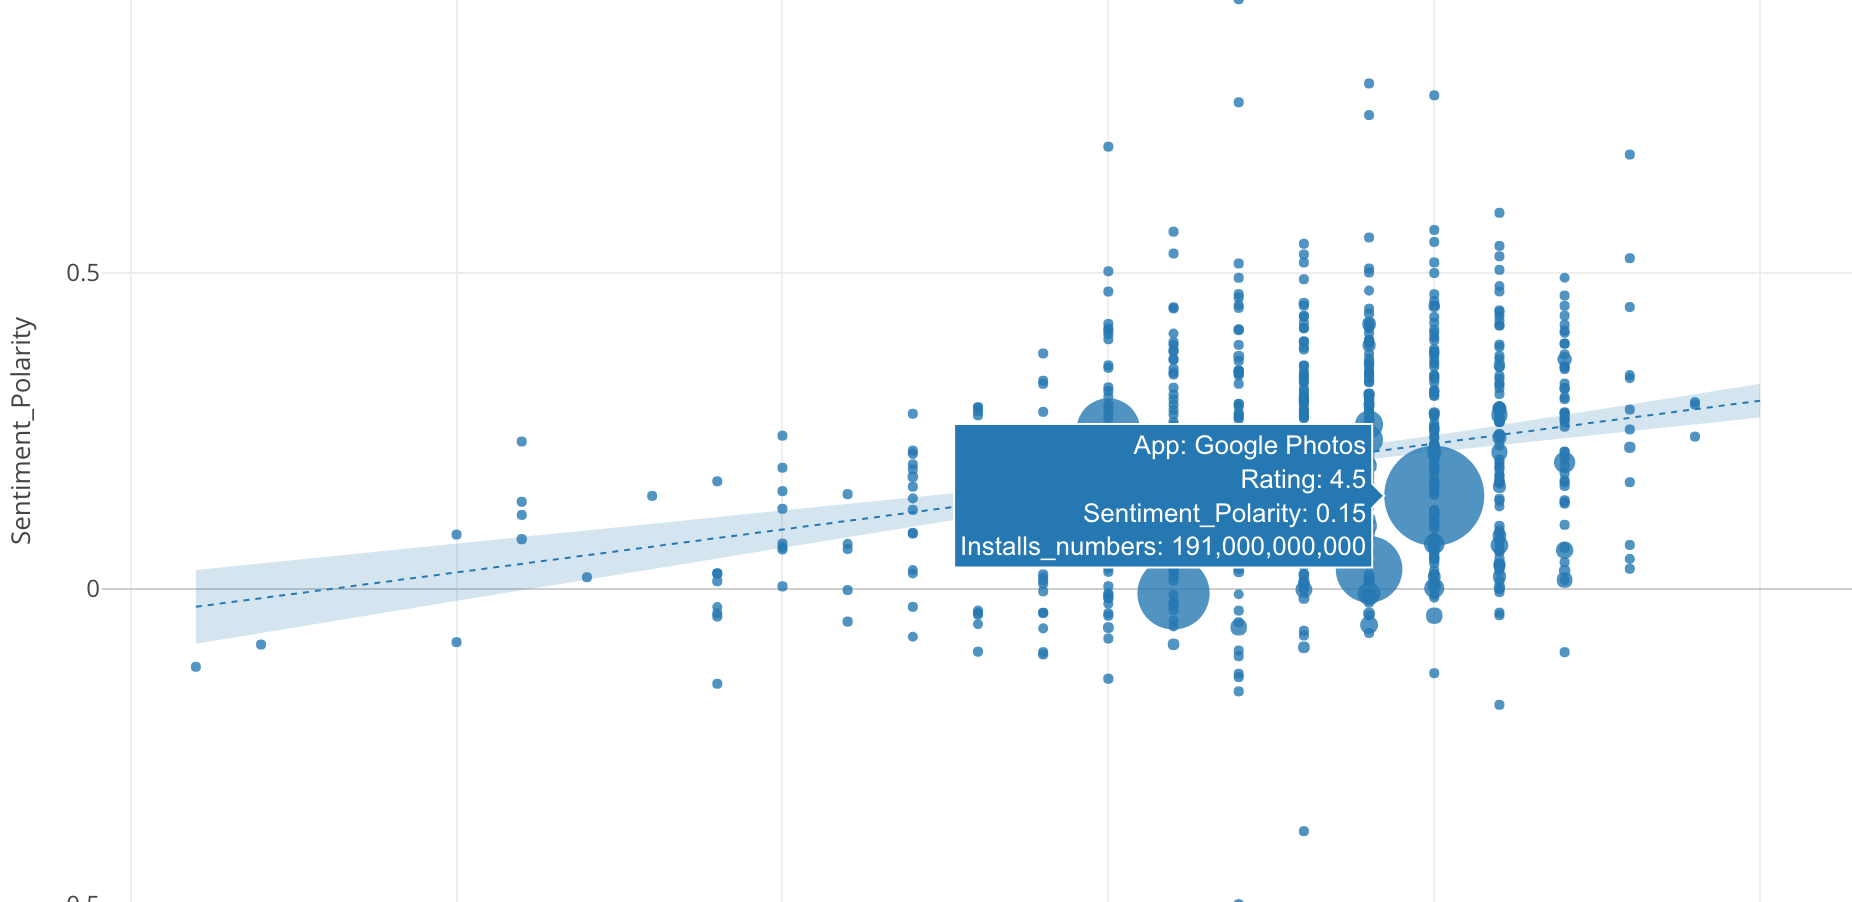
Here is a scatter plot with the rating score at X-Axis and the sentiment score at Y-Axis. The size of each circle is showing the number of the installs.
The correlation between the sentiment and the rating is not as strong as I thought, though we can see the trend there.
There are a few apps with significant number of the installs.
For example, Google Photo app has 4.5 rating score with 0.15 sentiment. Among the big apps (in terms of the install number) this seems to get the best review feedback.
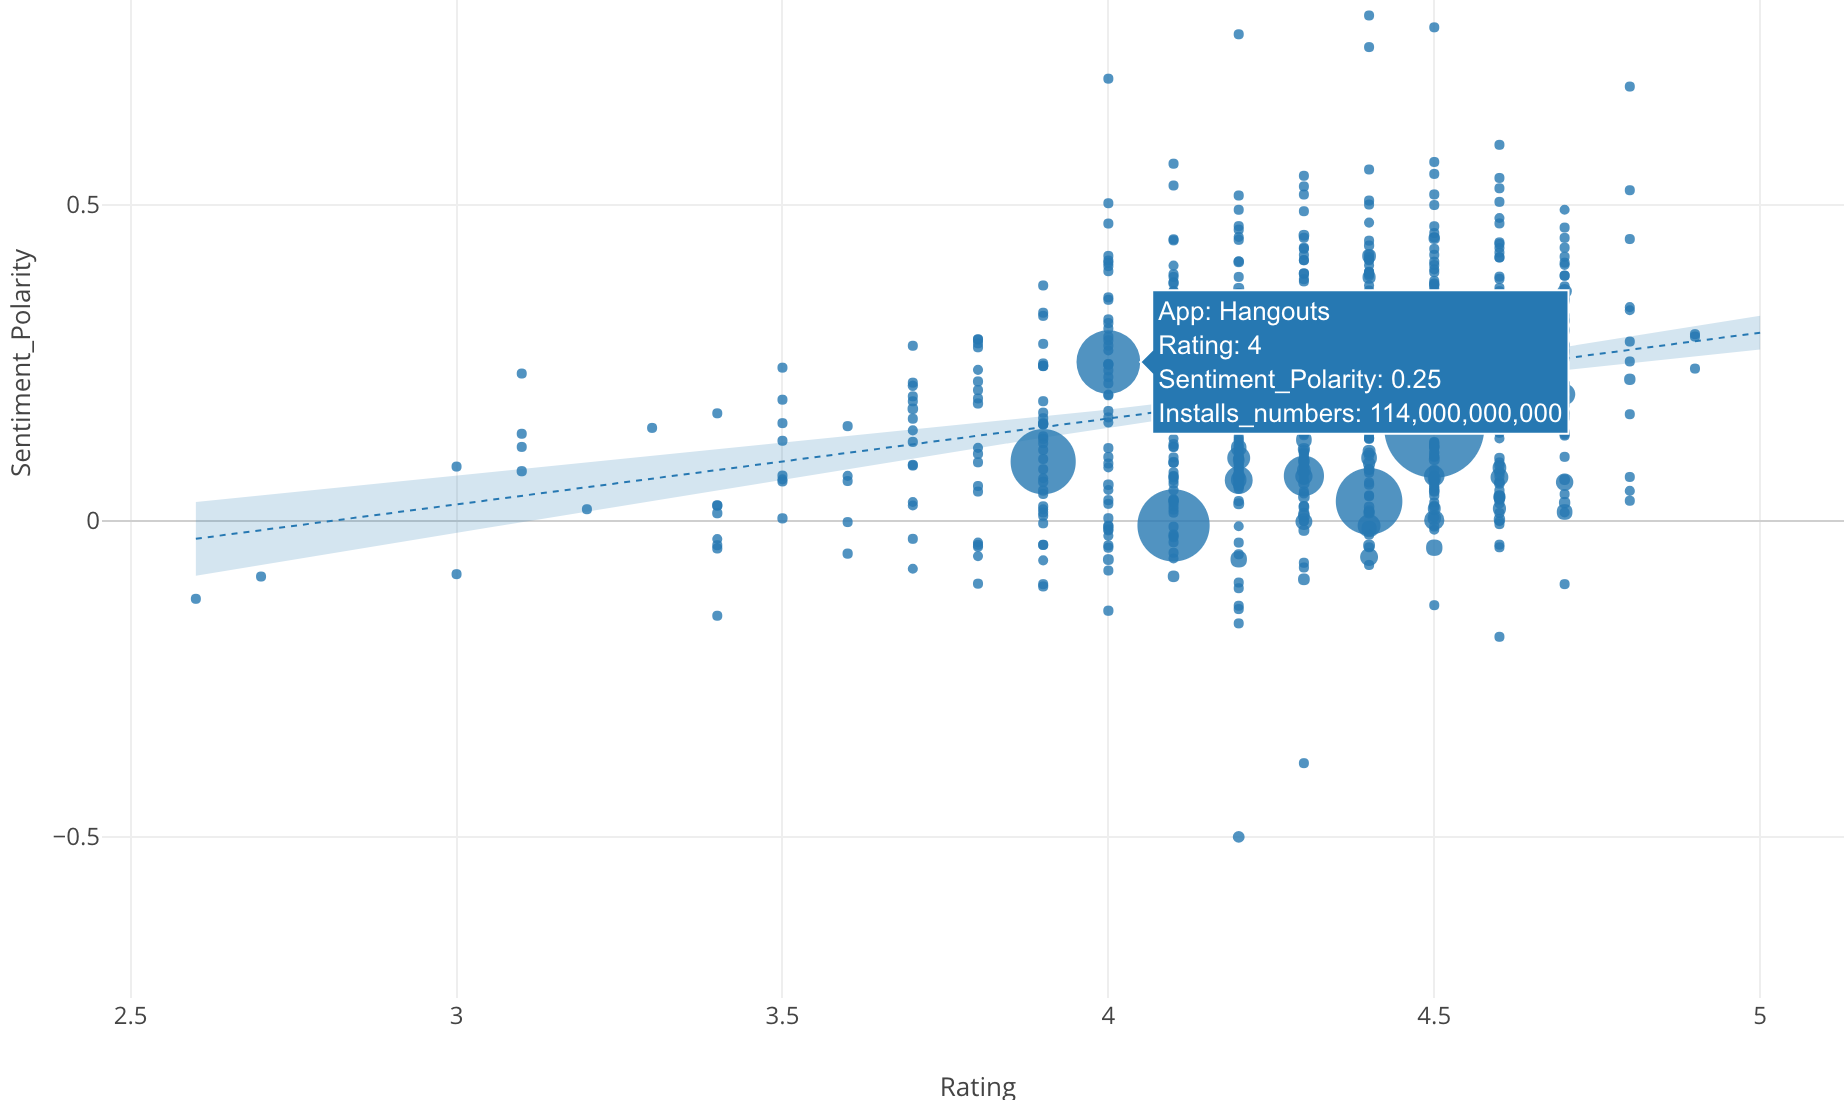
Another big app that is interesting is Google Hangout. It gets even higher score of the sentiment that is 0.25, but the rating score is not as high as the other big apps.
The lowest sentiment it gets among the big apps is Facebook, which has -0.01 sentiment score, though the rating score is not as bad as Google Hangout.
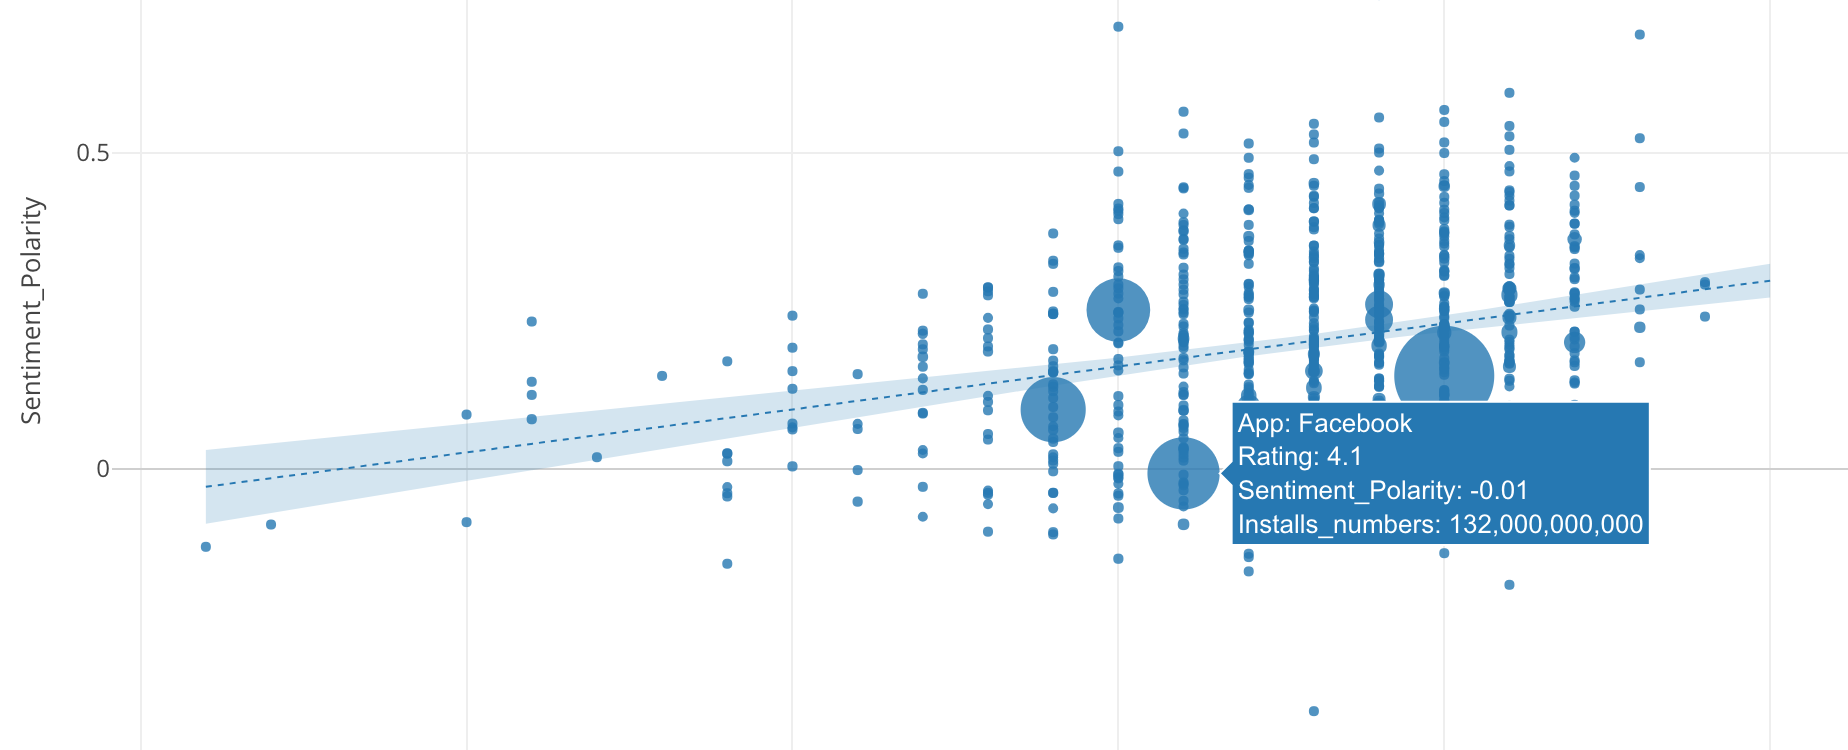
So the sentiment and the rating have some sort of correlation but the sentiment alone is not a great predictor when it comes to see how they will give the rating.
Sentiment of Review Comments for Top Apps
Lastly, I wanted to see how those big apps, whose install numbers are greater than 100,000,000, are getting their review comments. Are they getting positive sentiments or negative ones.
Here is a series of histogram that show a distribution of sentiment scores for each app.
Most of the apps get the sentiments distribution as some what normal distribution. 0 is at the center of the distribution. If the distribution mountain leans towards to the right that means the app tend to have more positive reviews.
When you look at the apps like Dropbox, Gogle Photos, Google News, Google Hangouts, you can see these apps are getting more positive review comments.
Conclusion
So far, we have learned that the following things might affect the rating.
- Whether it’s Free or Paid.
- Number of the reviews.
- Sentiment of the review comments.
There is no much surprising factor here, but rather this analysis confirms our intuition regards to when the apps get higher rating scores.