Geocoding US Address Data with zipcode Package & Visualize it
Amazing things about R is that there are more than 15,000 packages (as of writing on 2/8/2019) available to use.
While most of the R packages help you do various data science tasks such as data wrangling, visualization, modeling, etc., some packages simply provide you data!
Today, I want to introduce this package called ‘zipcode’ from Jeffrey Breen that provides literally US zip code data including zip code, city name, state name, longitude, and latitude.
By using this data, you can geocode (longitude and latitude) your data with US addresses by importing the zipcode data and joining it with your data.
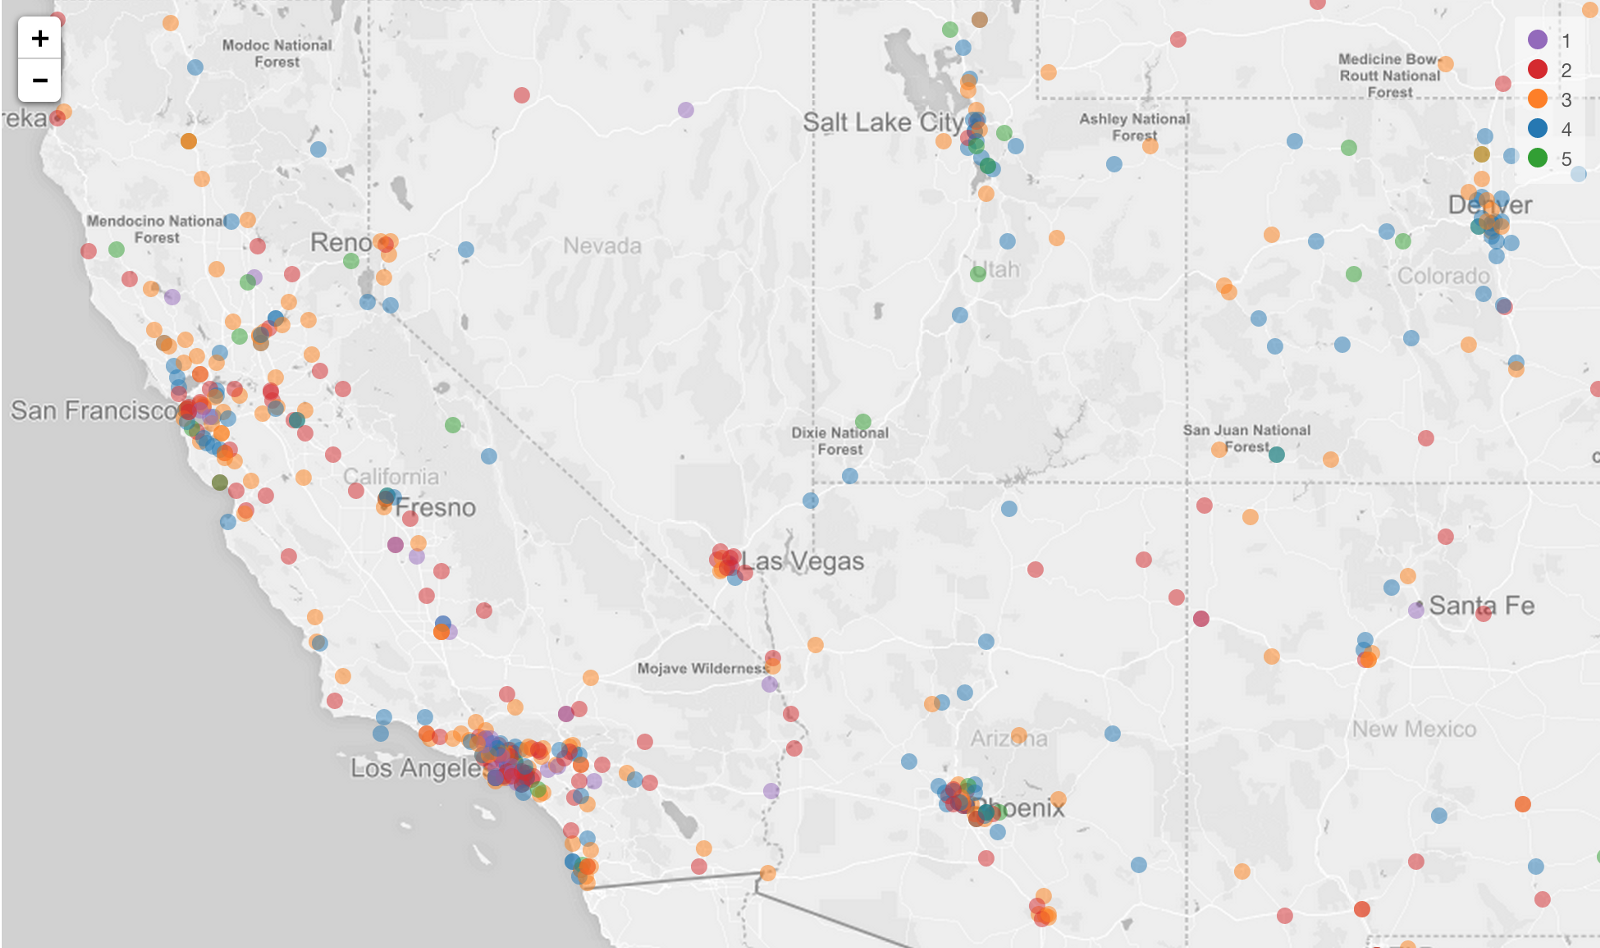
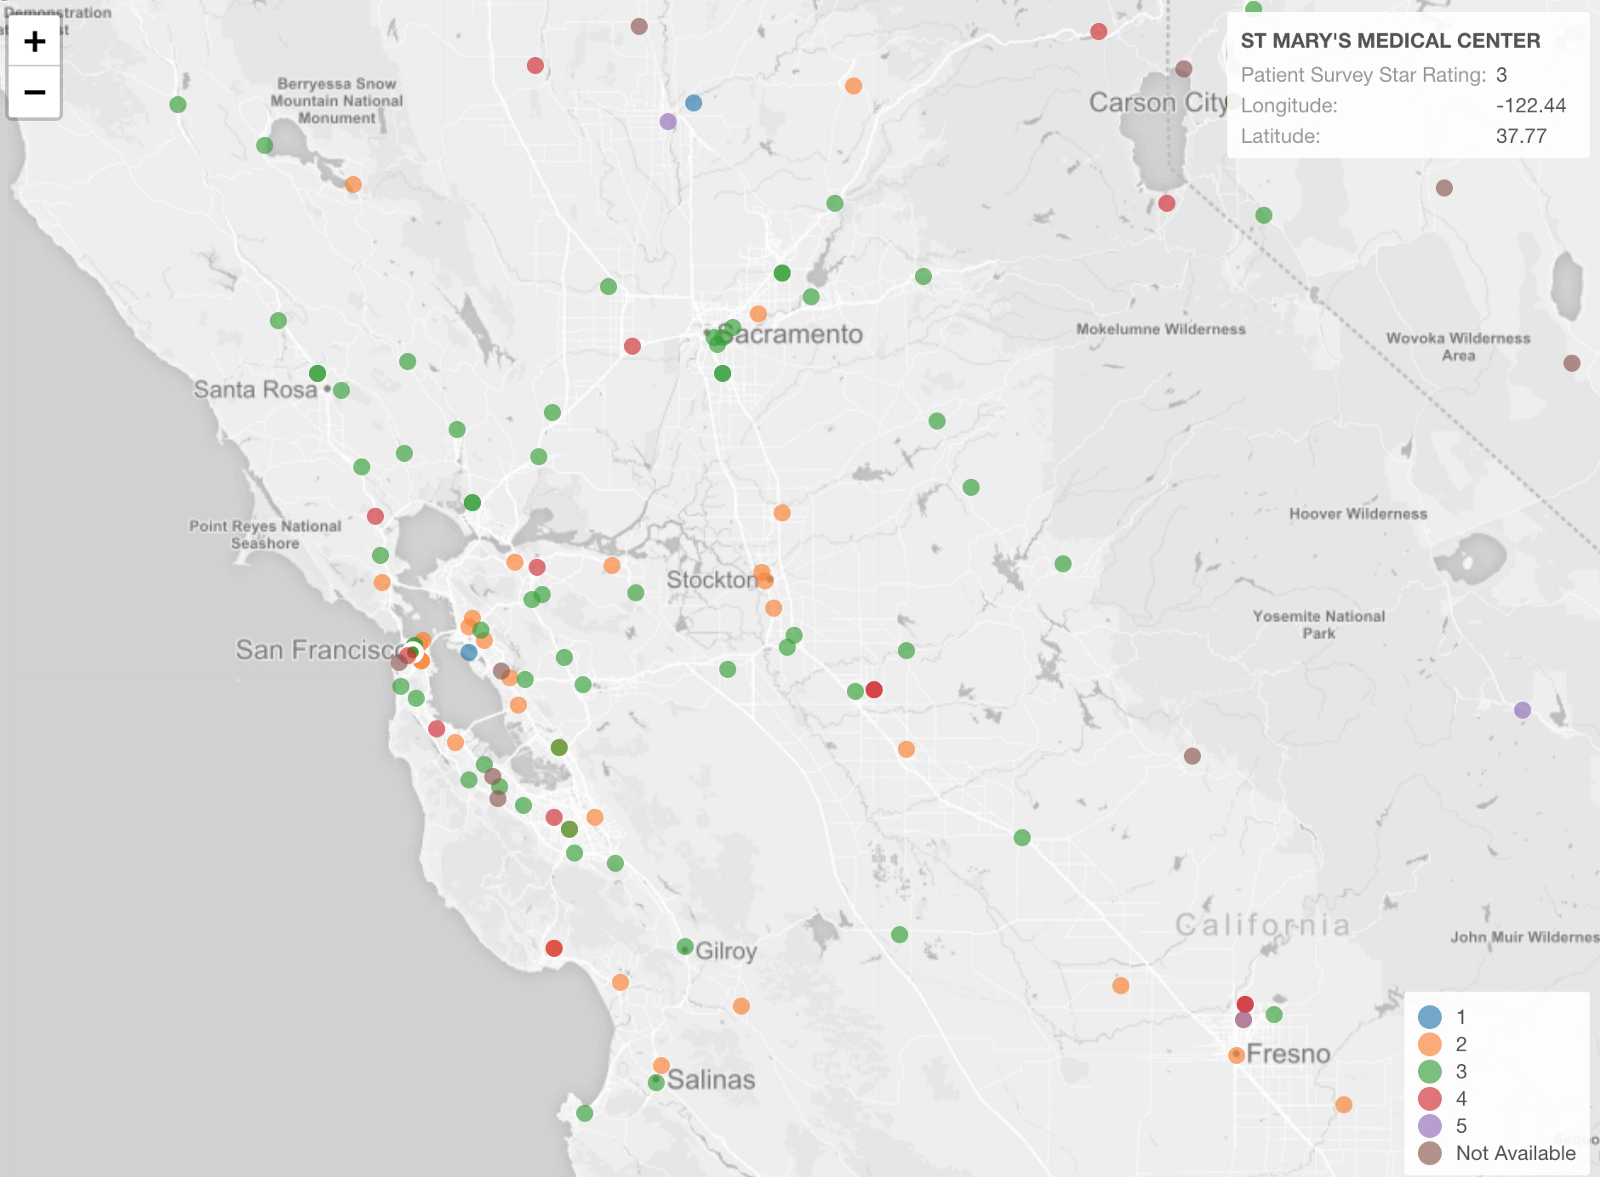
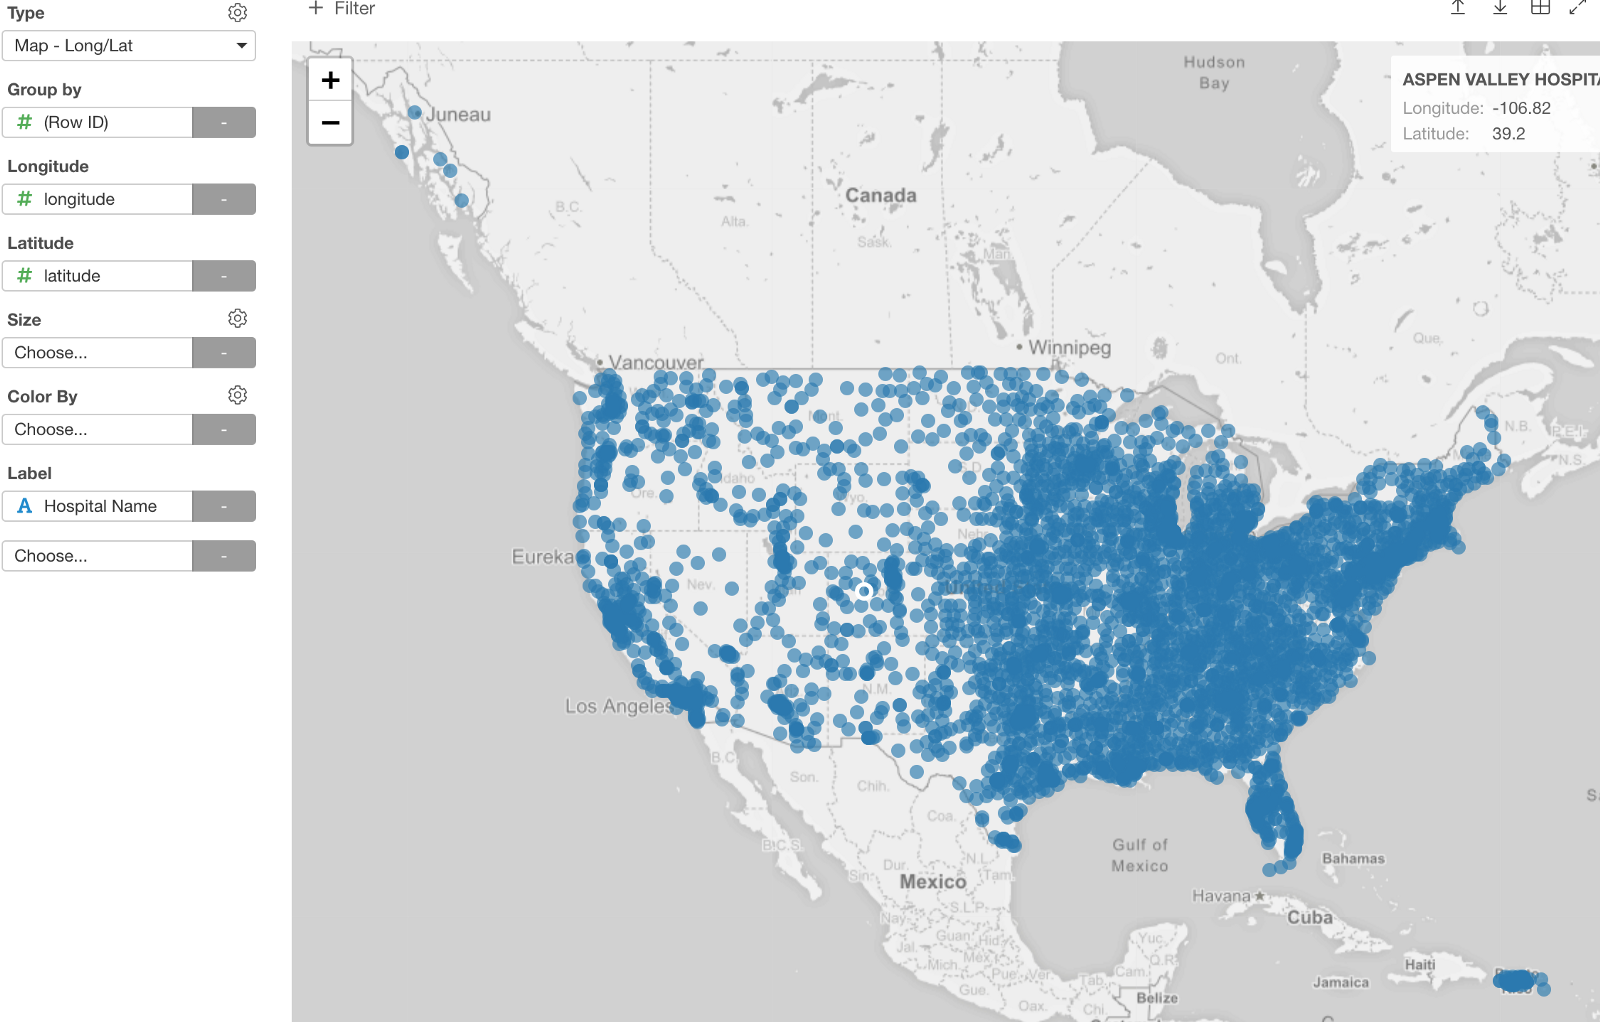
Once it’s geocoded, you can visualize your data with Map like the below!
This could be a good enough ‘geocoding’ solution especially when you don’t want to do the costly and slow geocoding operations using the third party web services like Google’s geocode API, etc.
Let’s take a look at how to install this R package, import the data, join it, and visualize in Exploratory.
Sample Data
To demonstrate, I’m going to use this US hospital survey rating data from The Centers for Medicare & Medicaid Services.
This data was originally downloaded from this link at US Government Medicare.
1. Install zipcode R package
First, let’s install ‘zipcode’ R package.
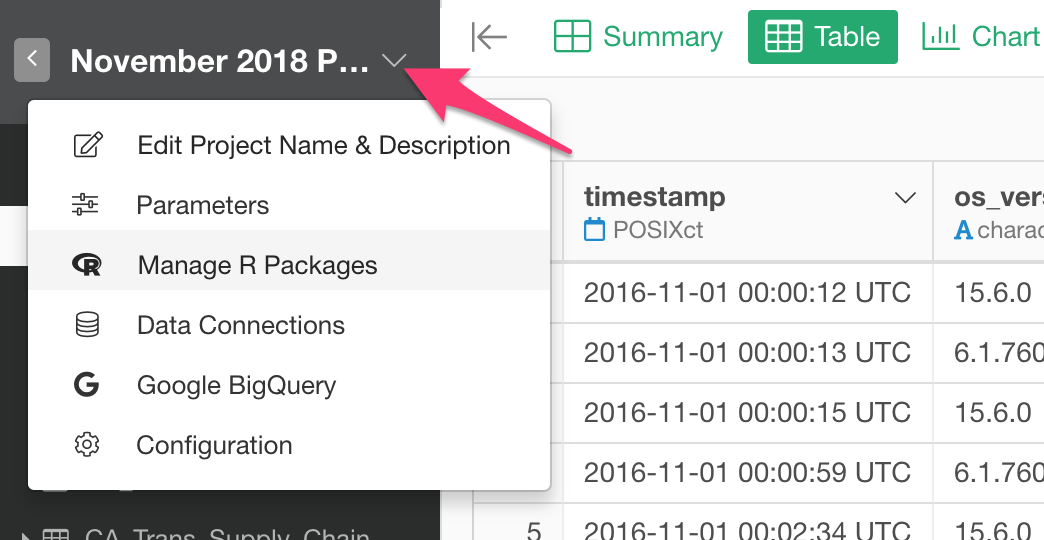
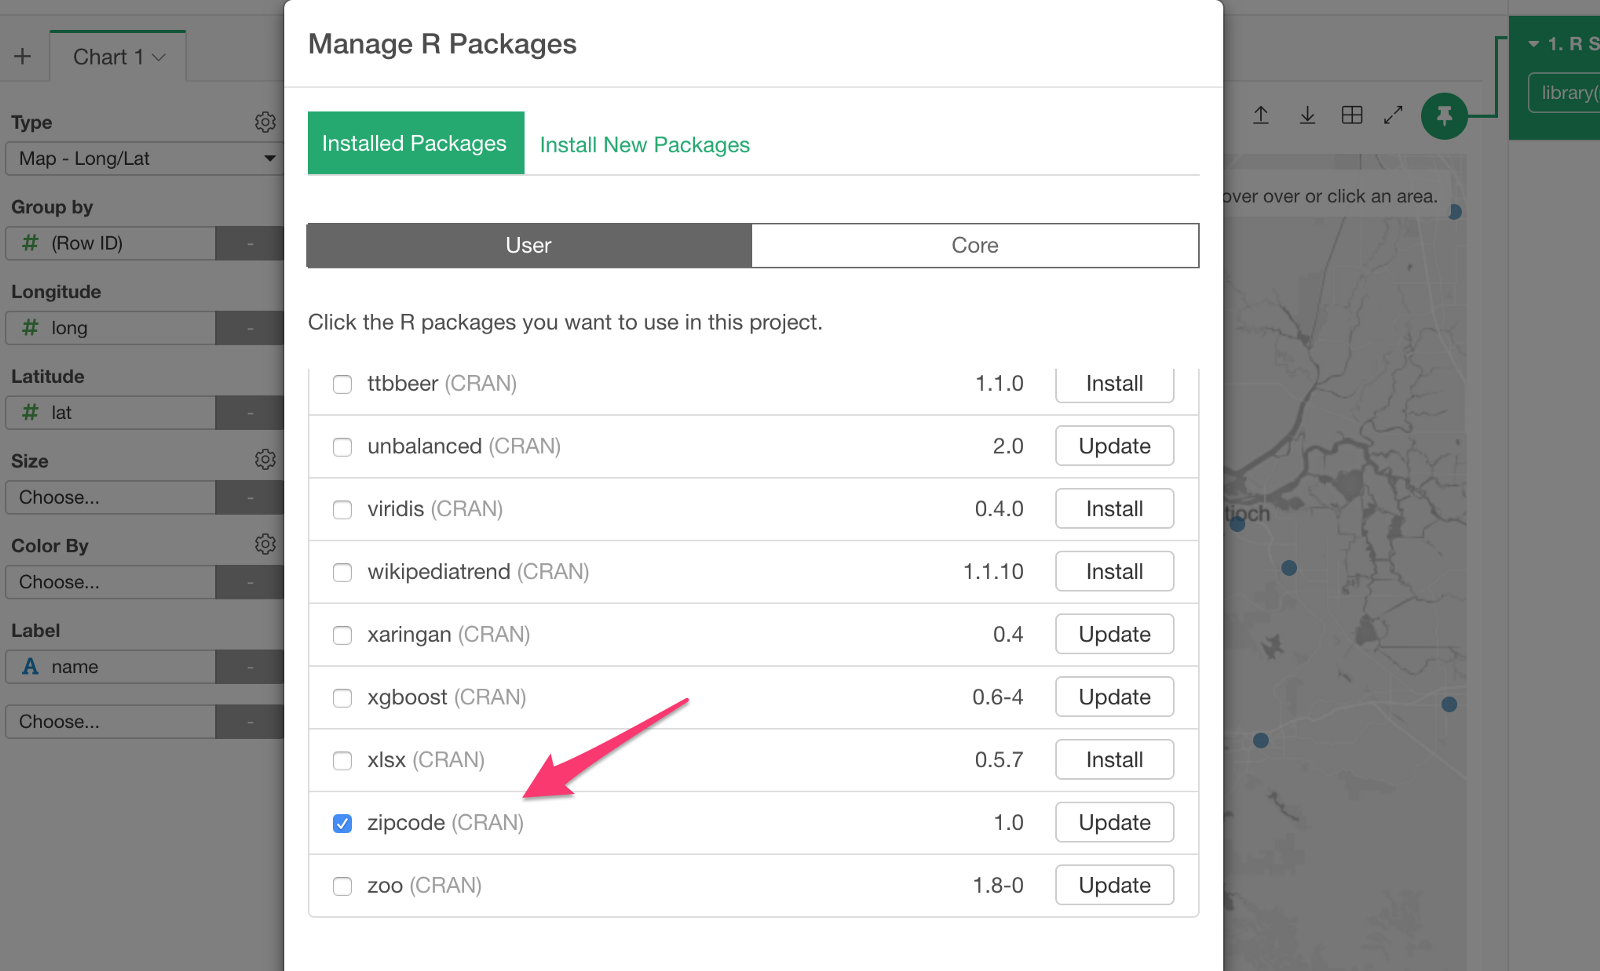
Select ‘Manage R Packages’ from the project dropdown menu.
Type ‘zipcode’ and click ‘Install’ button under ‘Install New Packages’ tab.
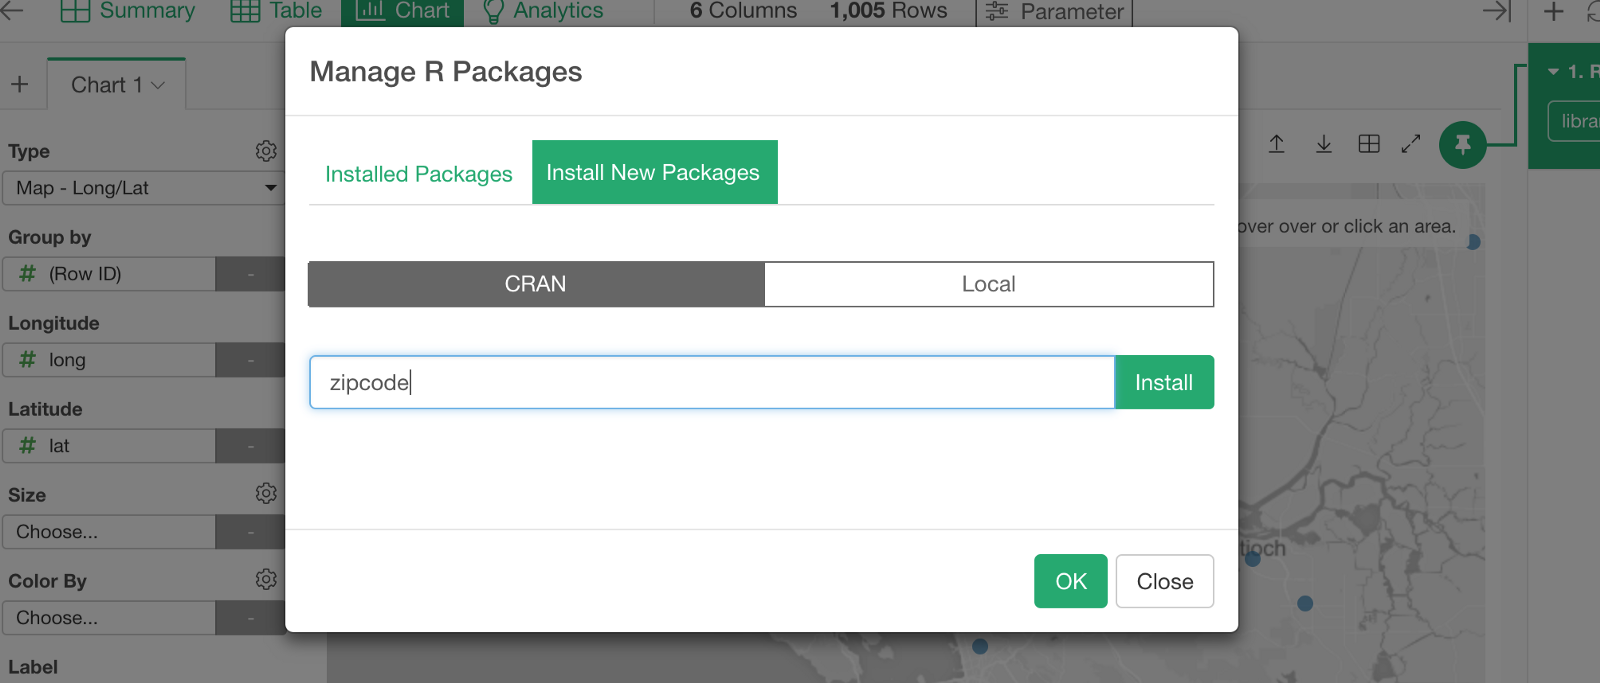
Make sure that ‘zipcode’ package is installed and showing up under ‘Installed Package’ tab.
2. Import zipcode data
Let’s import data from the ‘zipcode’ package.
Select ‘R script’ under Data Frames dropdown menu.
Type the following in the code editor area.
library(zipcode)
data(zipcode)
zipcode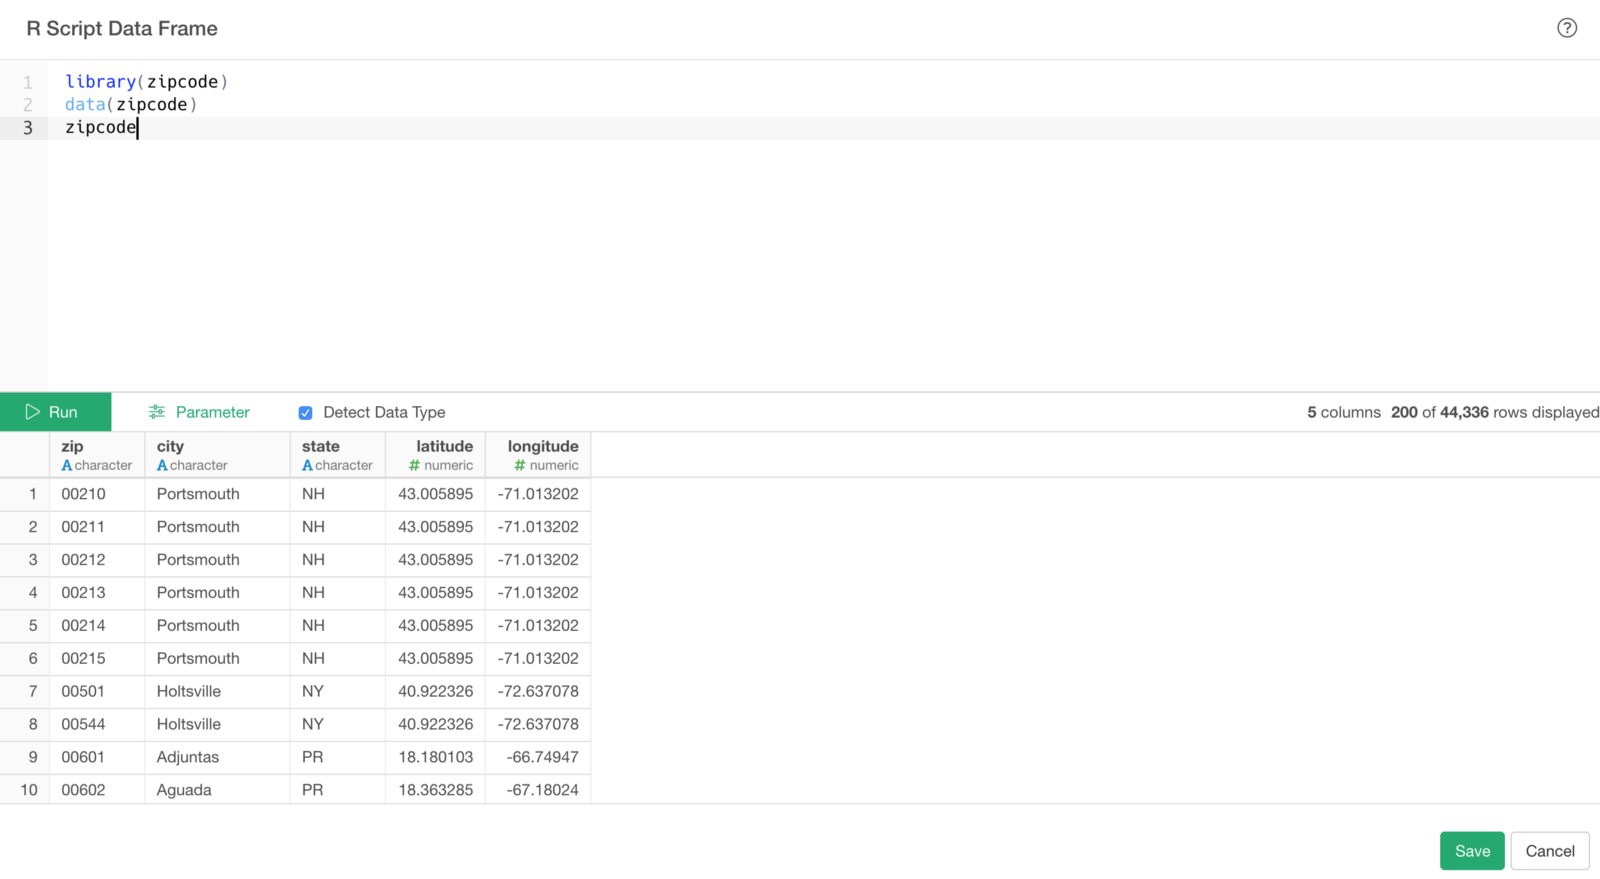
If you are not familiar with R, the first line is loading the ‘zipcode’ package into the current R session.
The second line is using ‘data’ function to extract the ‘zipcode’ data from the package as a data frame called ‘zipcode’.
The last line is calling the data frame to return the data.
If you want to know more about ‘zipcode’ package functionality, take a look the reference doc for ‘zipcode’ package.
Click ‘Run’ button to get the data and click ‘Save button to create a data frame inside Exploratory.
Now you have the zip code data imported from ‘zipcode’ R package.
It’s that simple!
Join Hospital Survey Data with Zip Code Data
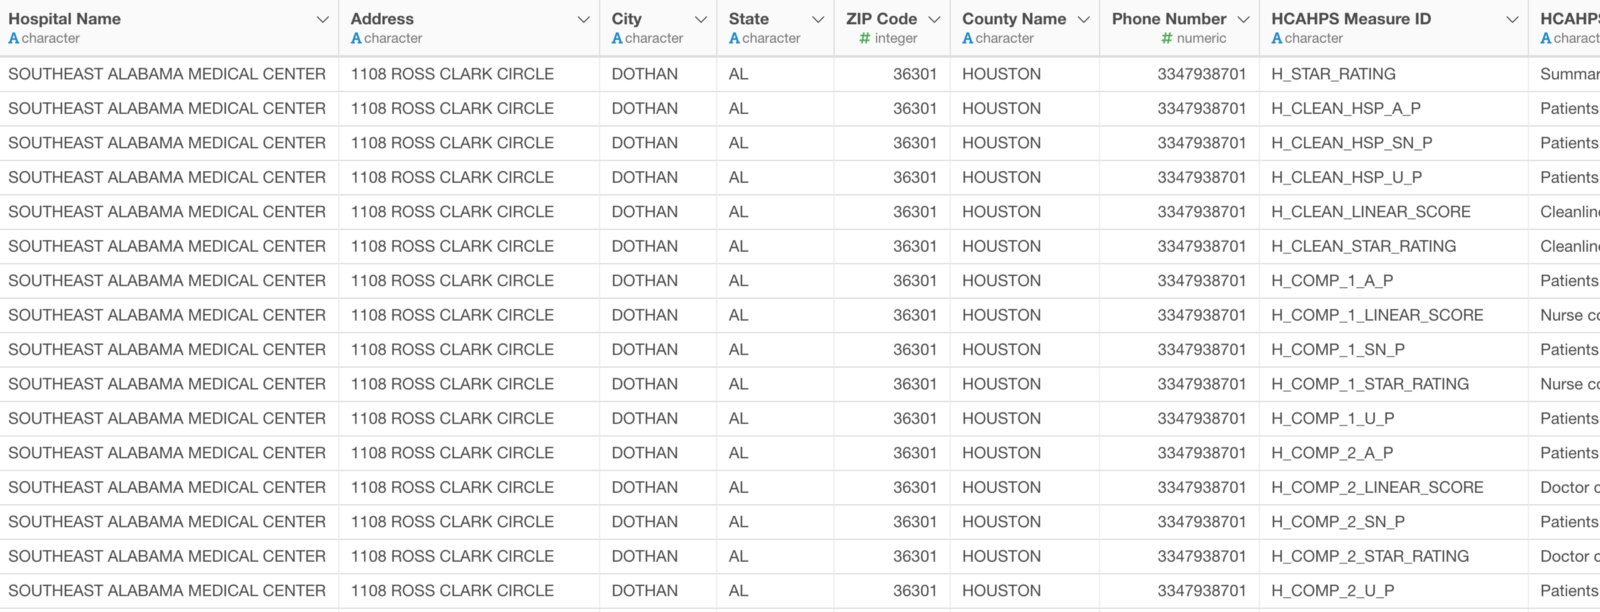
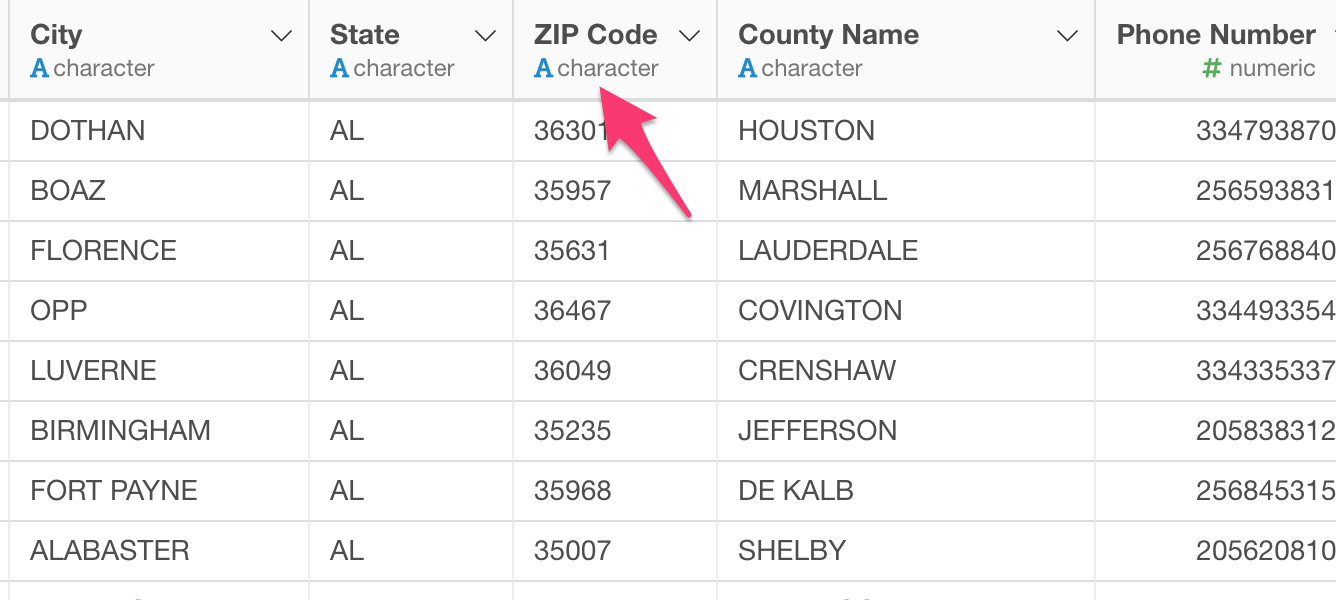
Here is the hospital data that has a list of the hospitals that are surveyed for the service quality by the patients.
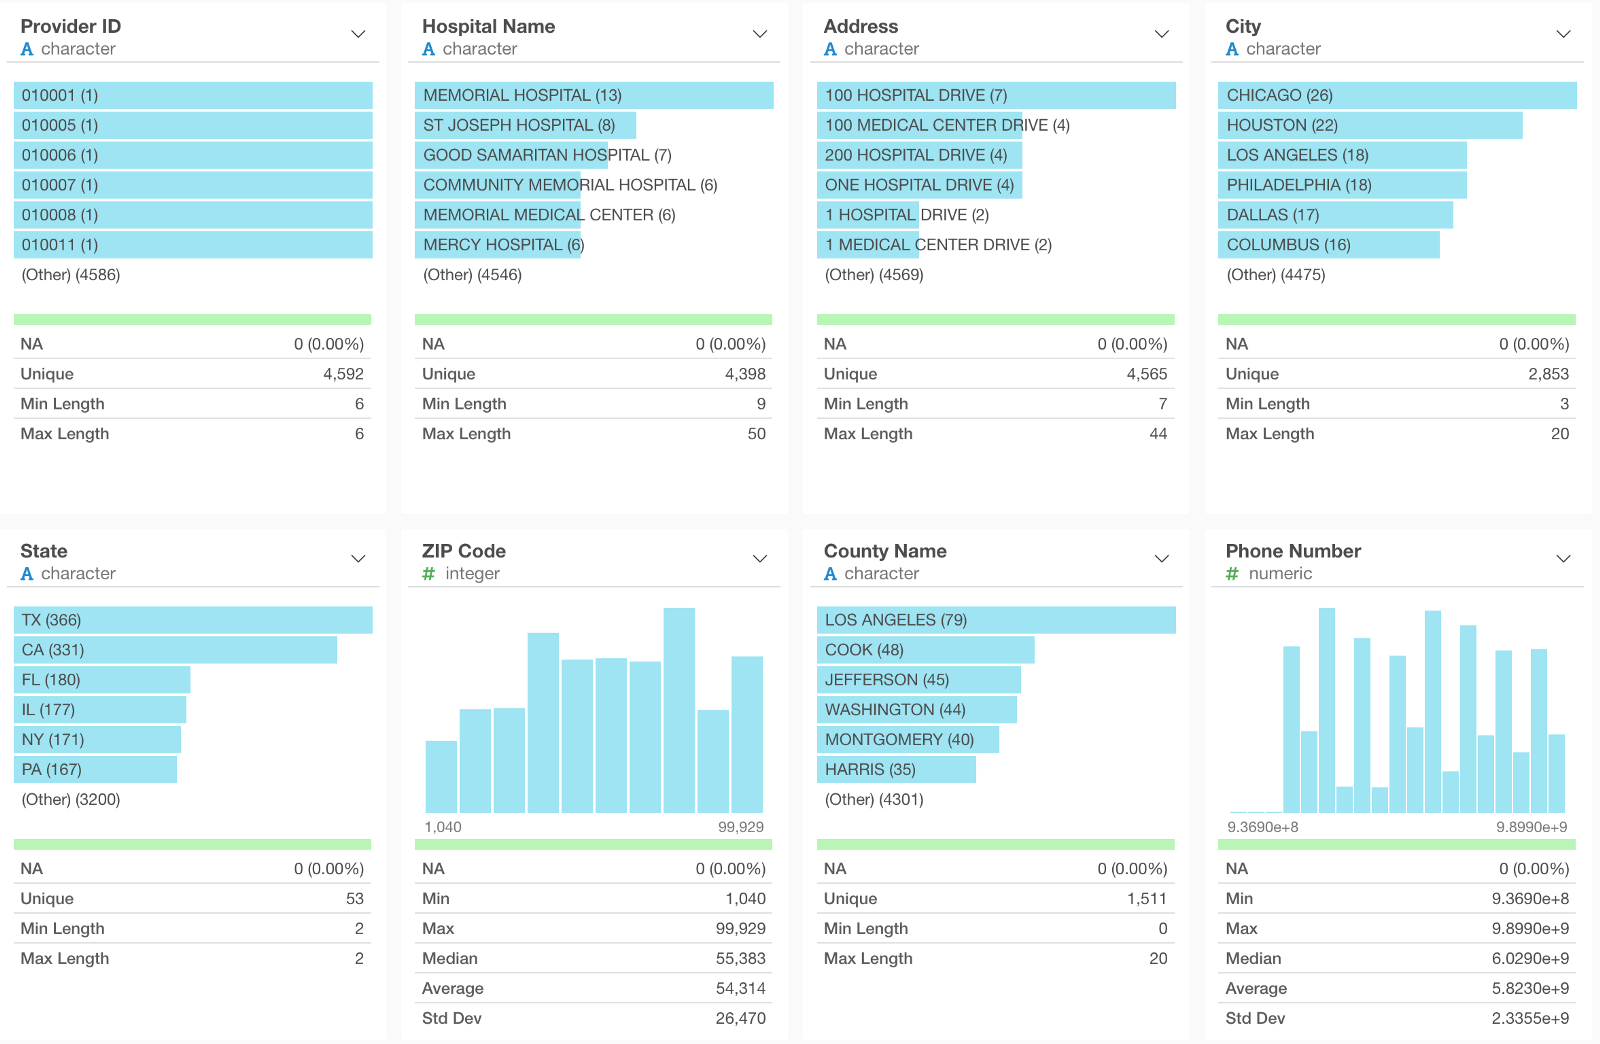
And we want to visualize the hospital locations on Map.
There are a few data problems I need to address before.
First, there are multiple rows per hospital because there are different survey questions/answers for each hospital. I want to keep only the unique row, one hospital per row.
Second, the zip code column in the hospital data is numeric data type and this is a problem.
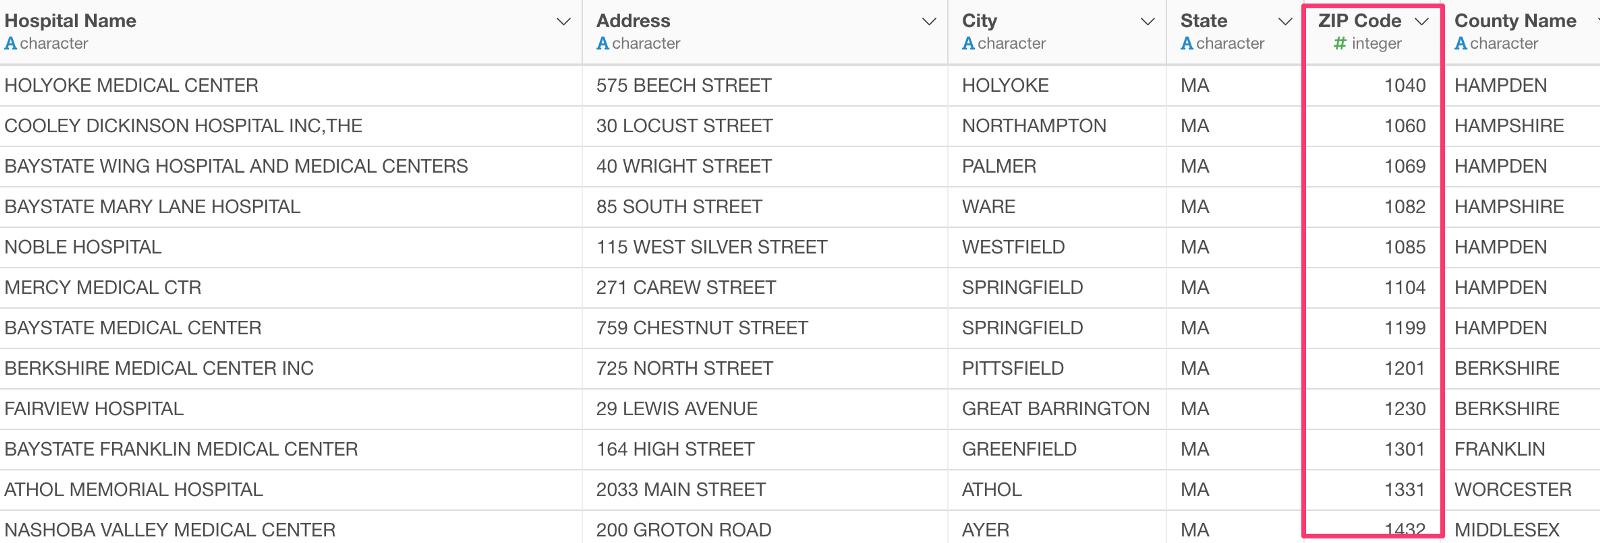
US zip code is always 5 digits. For example, the above case, the zip codes for the hospitals in Massachusetts have only 4 digits but these should be filled with zero at the biginning. So 1040 should be 01040.
Let’s take a look at how we can address these problem with Data Wrangling.
Clean up Data with Data Wrangling
1. Keep Only Unique Hospital Data
There is a hospital id column and we can use this to keep only the unique hospital rows.
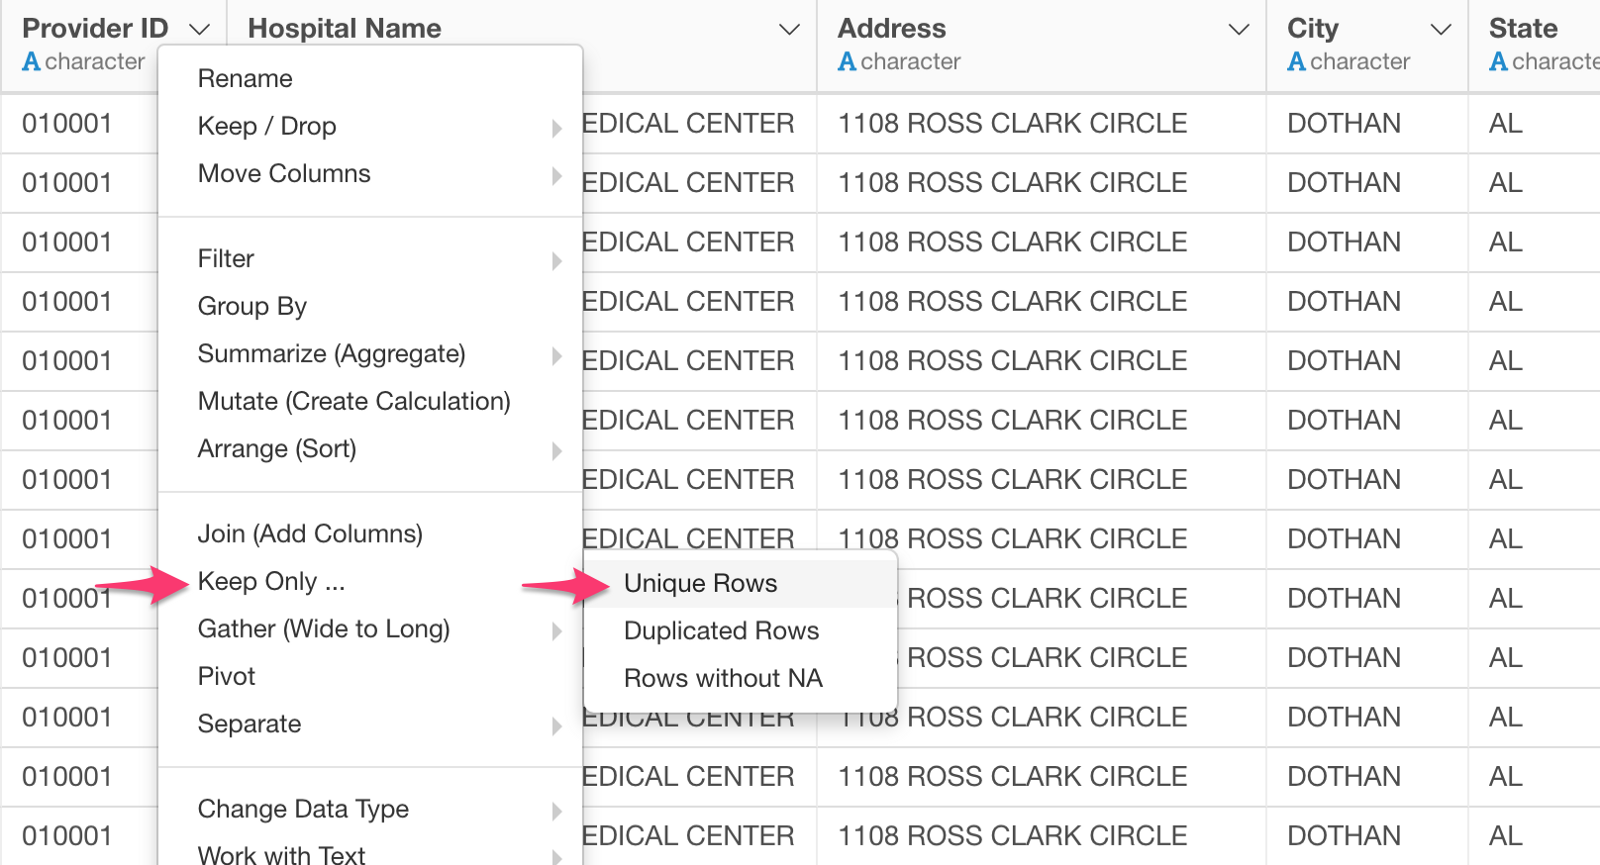
This will remove all the duplicated rows and keep only the unique rows based on the hospital id.
2. Clean up Zipcodes in Hospital Data
We’ll take the following 2 steps.
- Convert ‘zip’ column to Character Type.
- Pad 0 to make all the data to have 5 fixed width.
Convert to Character Type
We can change the data type of Zip Code column by selecting
Change Data Type -> Convert to Character
from the column header menu.
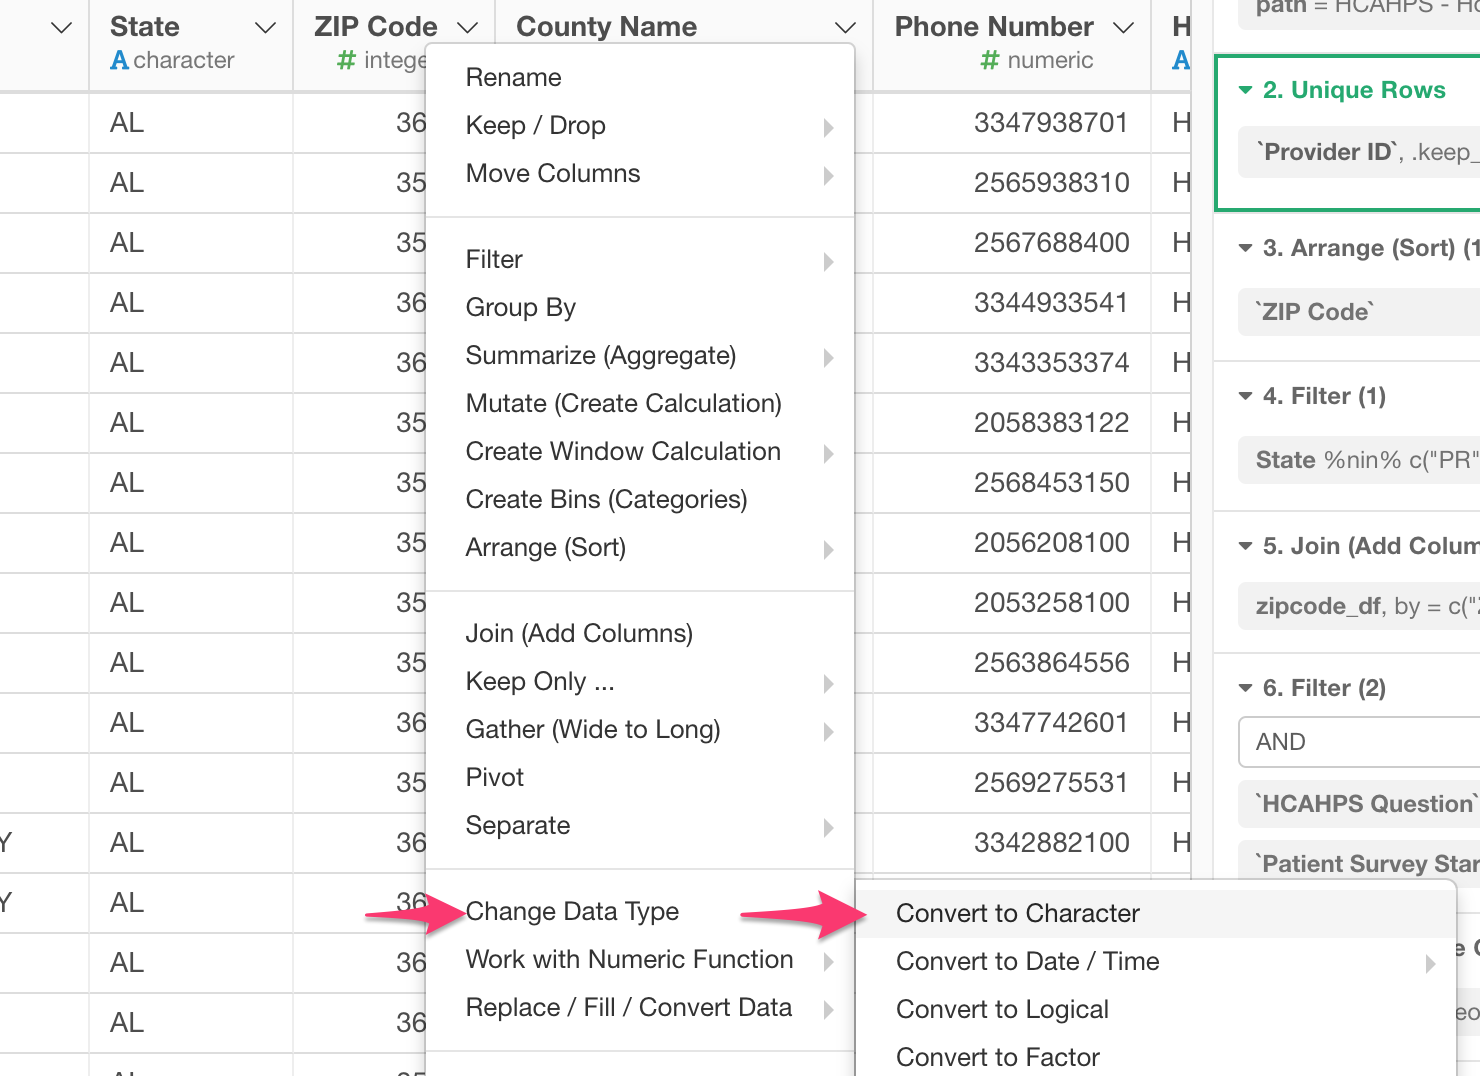
Notice that the data type for ZIP Code column indicates as Character type.
Pad 0 at the beginning
We can select
Work with Text -> Pad Text
from the column header menu.
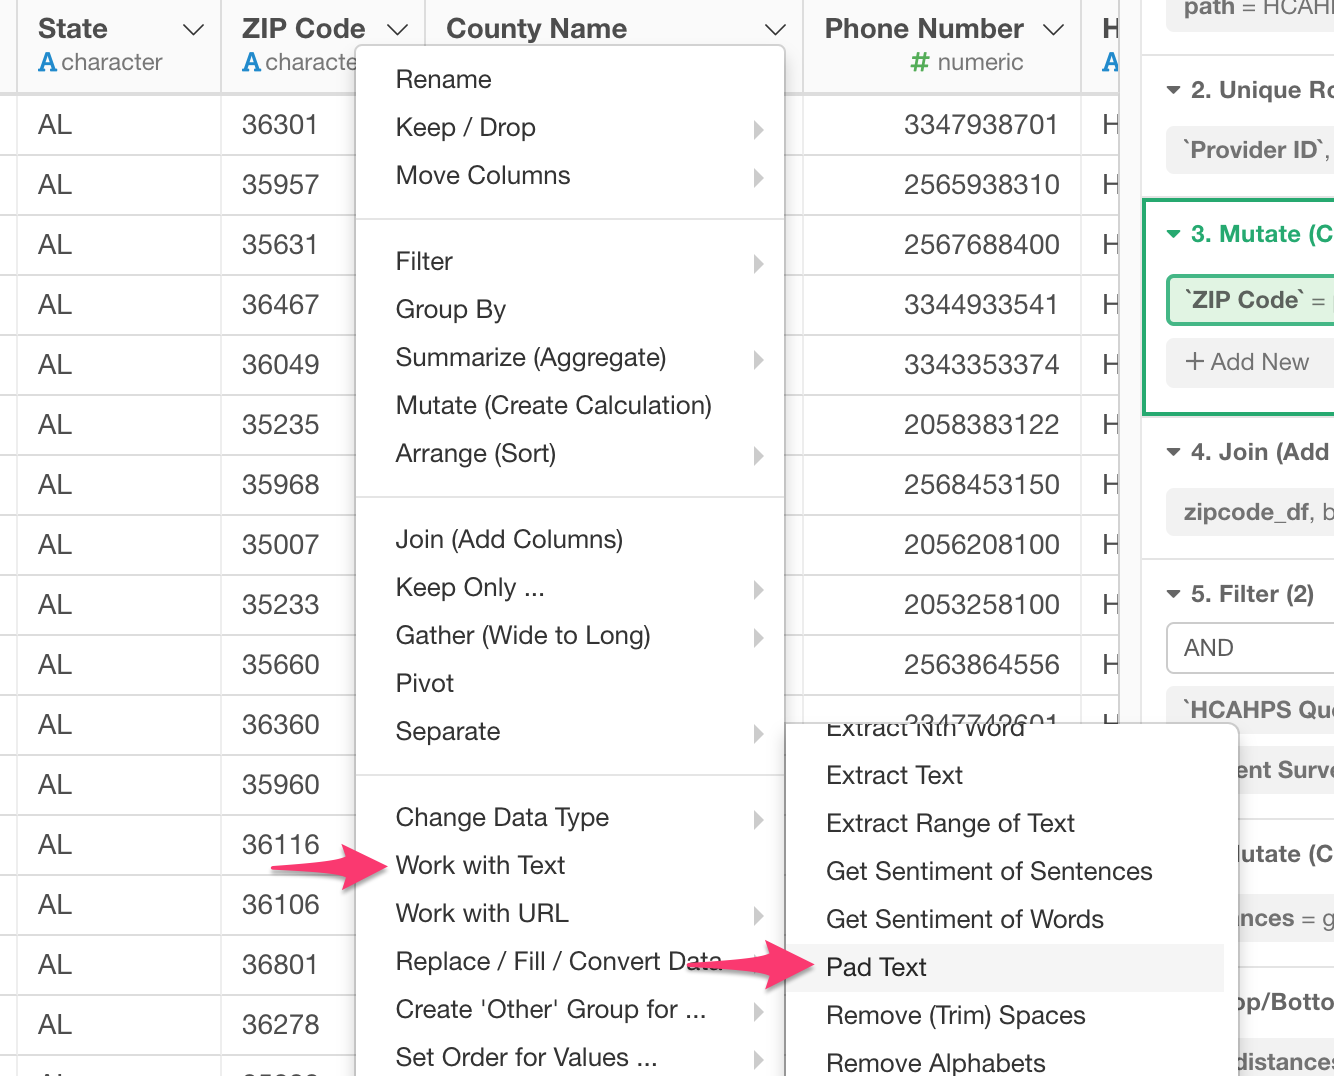
This will bring up Mutate dialog with ‘str_pad’ function being pre-populated.
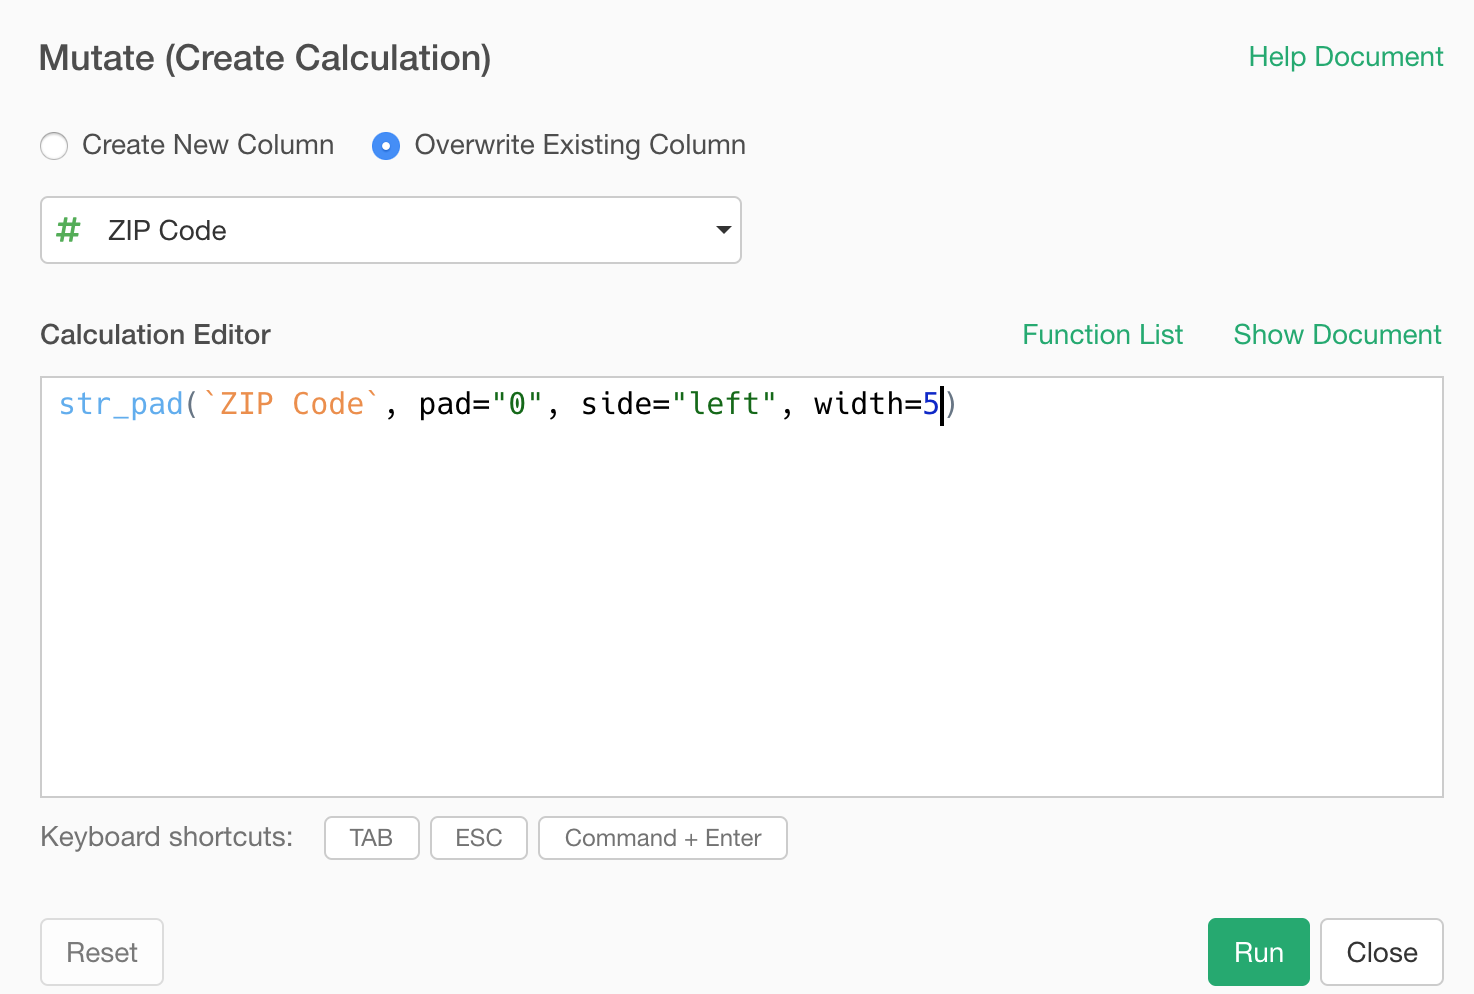
We can make it to be something like this.
str_pad(`ZIP Code`, pad="0", side="left", width=5)Here’s how it looks in the dialog.
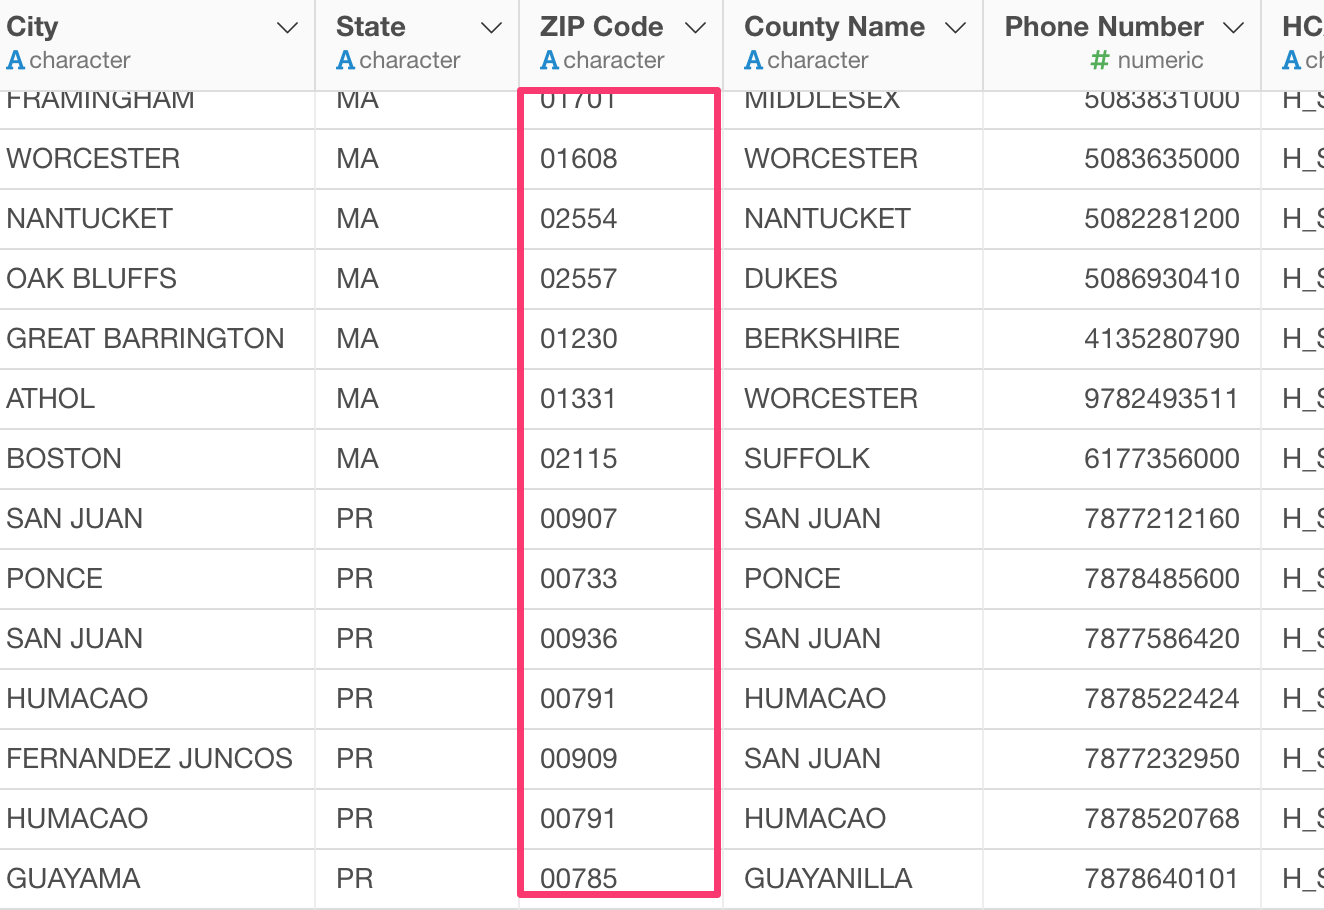
Once you run it, we can see that ‘0’ is filled at the left hand side of each text to make all the zipcode values to have 5 digits width.
Now it’s ready to join with the zip code data!
3. Join with the zip code data
We’ll use ‘ZIP Code’ column as the join key to join with the zip code data frame.
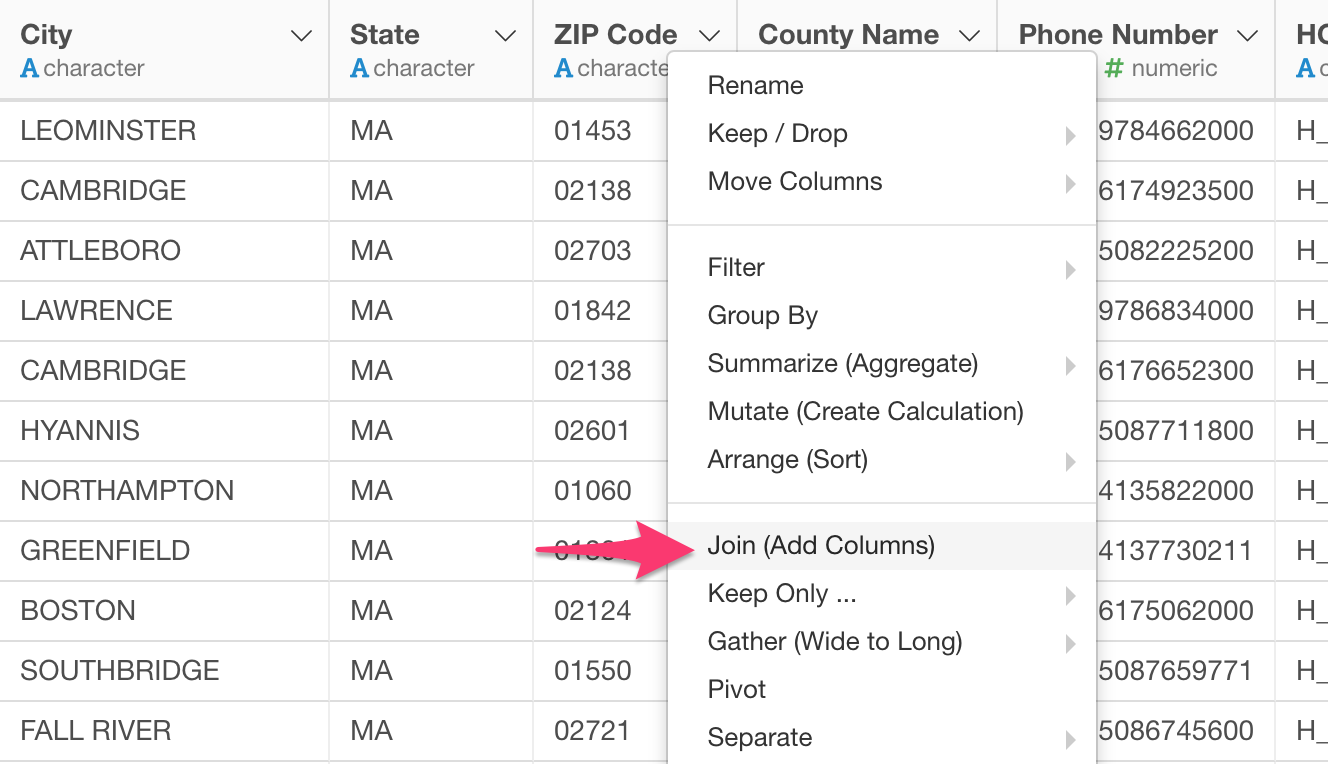
Select ‘Join (Add Columns)’ from the column header menu.
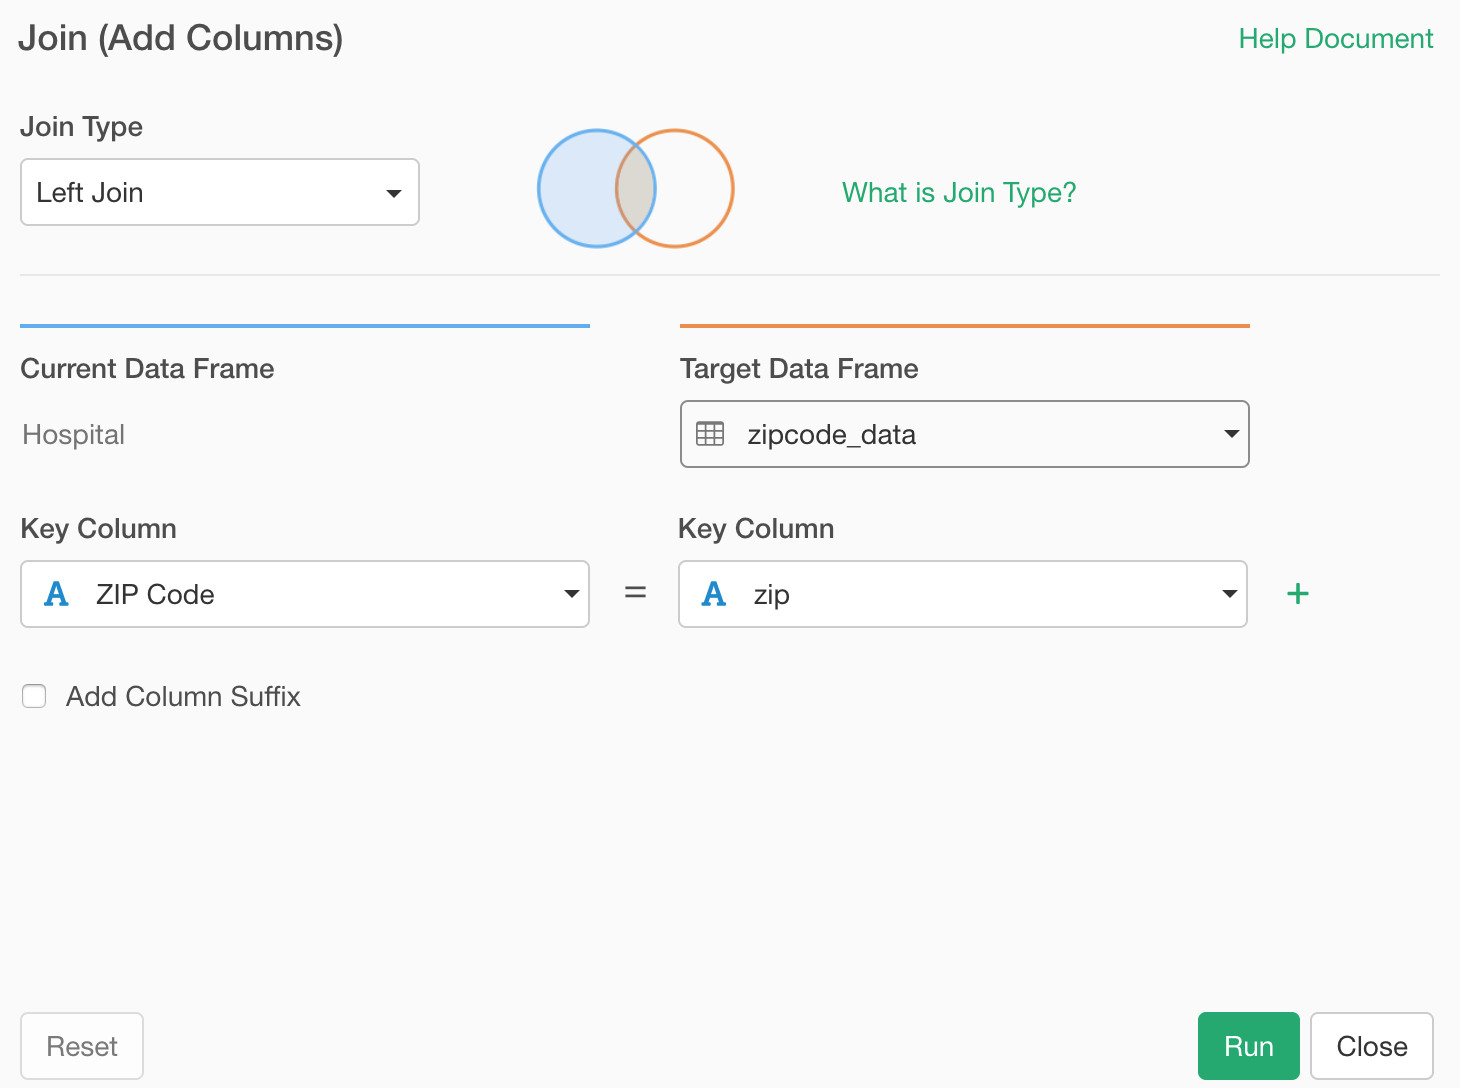
In the dialog, select the data frame that has the zip code and longitude/latitude information.
In my case, that is ‘zipcode_data’, and select ‘zip’ column as the key column of the target data frame.
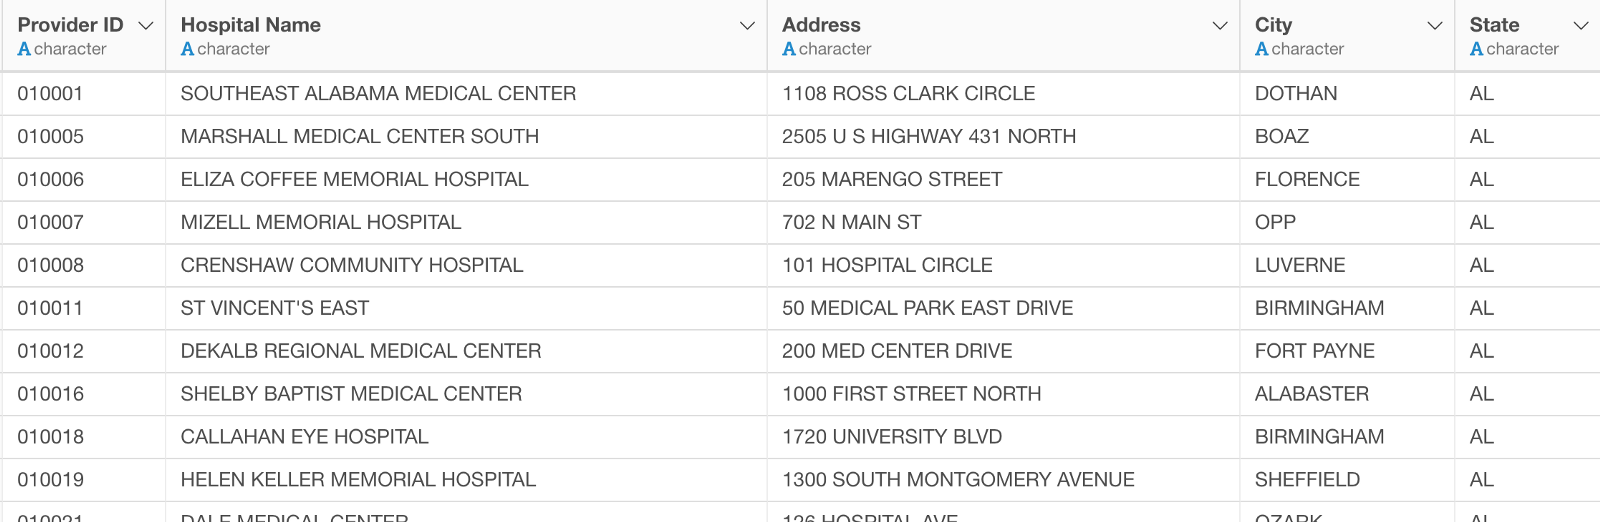
Once that’s done, you’ll see the new column being added at the end.
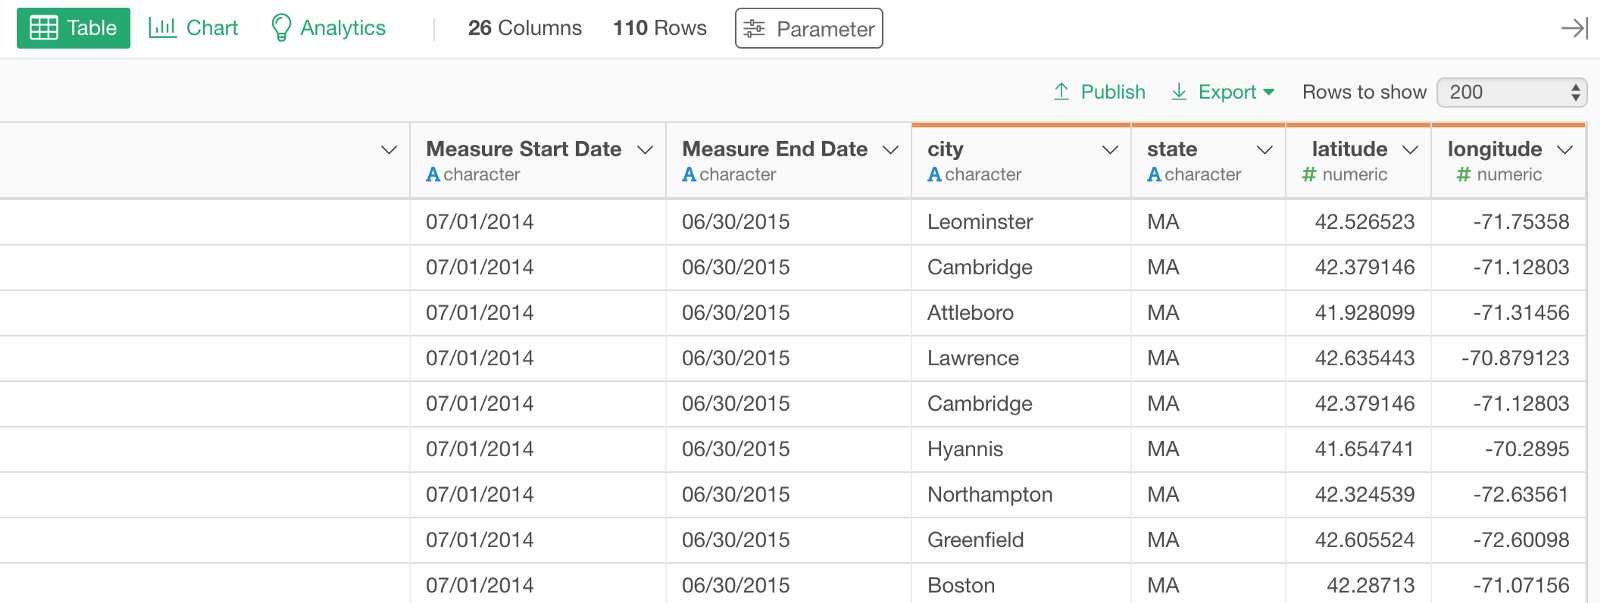
The columns with the orange bar at the top are the ones from the zip code data frame.
4. Visualize Geocoded Hospital Data with Map
We can quickly visualize the hospital locations by using the longitude and latitude columns with Map.
Under the Chart view, select Map - Long/Lat as the chart type.
We can zoom in if you like.
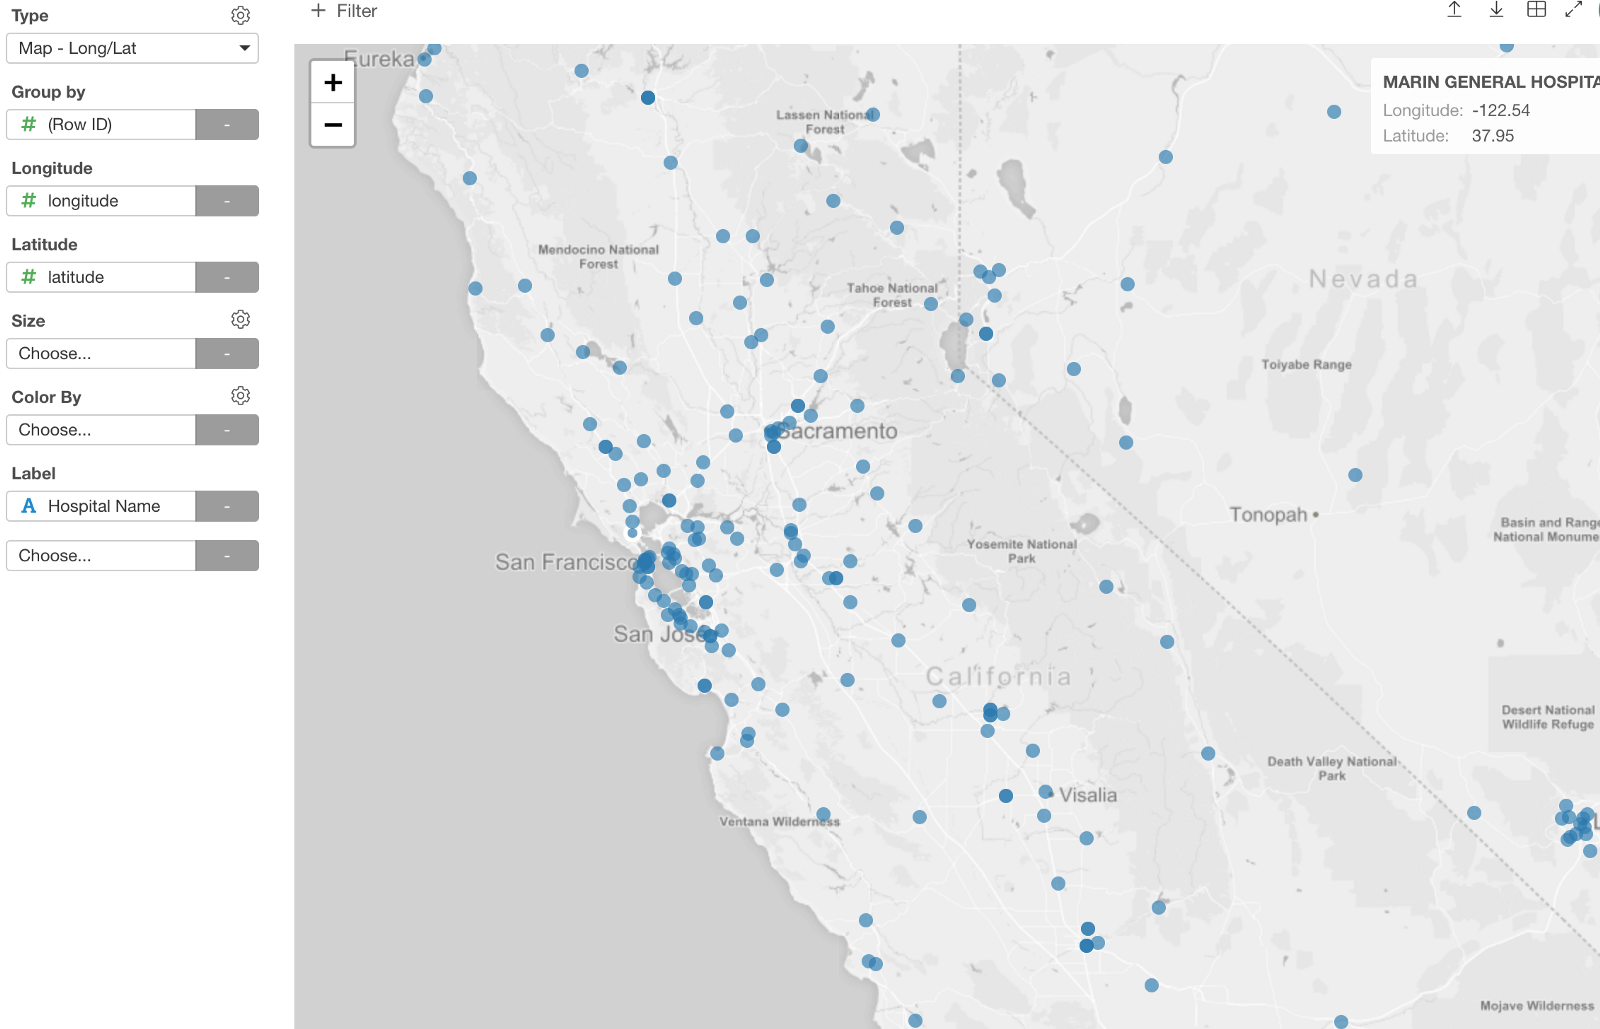
And we can assign the survey rating column to Color.
That’s it!