Though The summary statistics like average, median, min, max, etc. don’t tell us the full story about our data, but still they help us understand the data at high level.
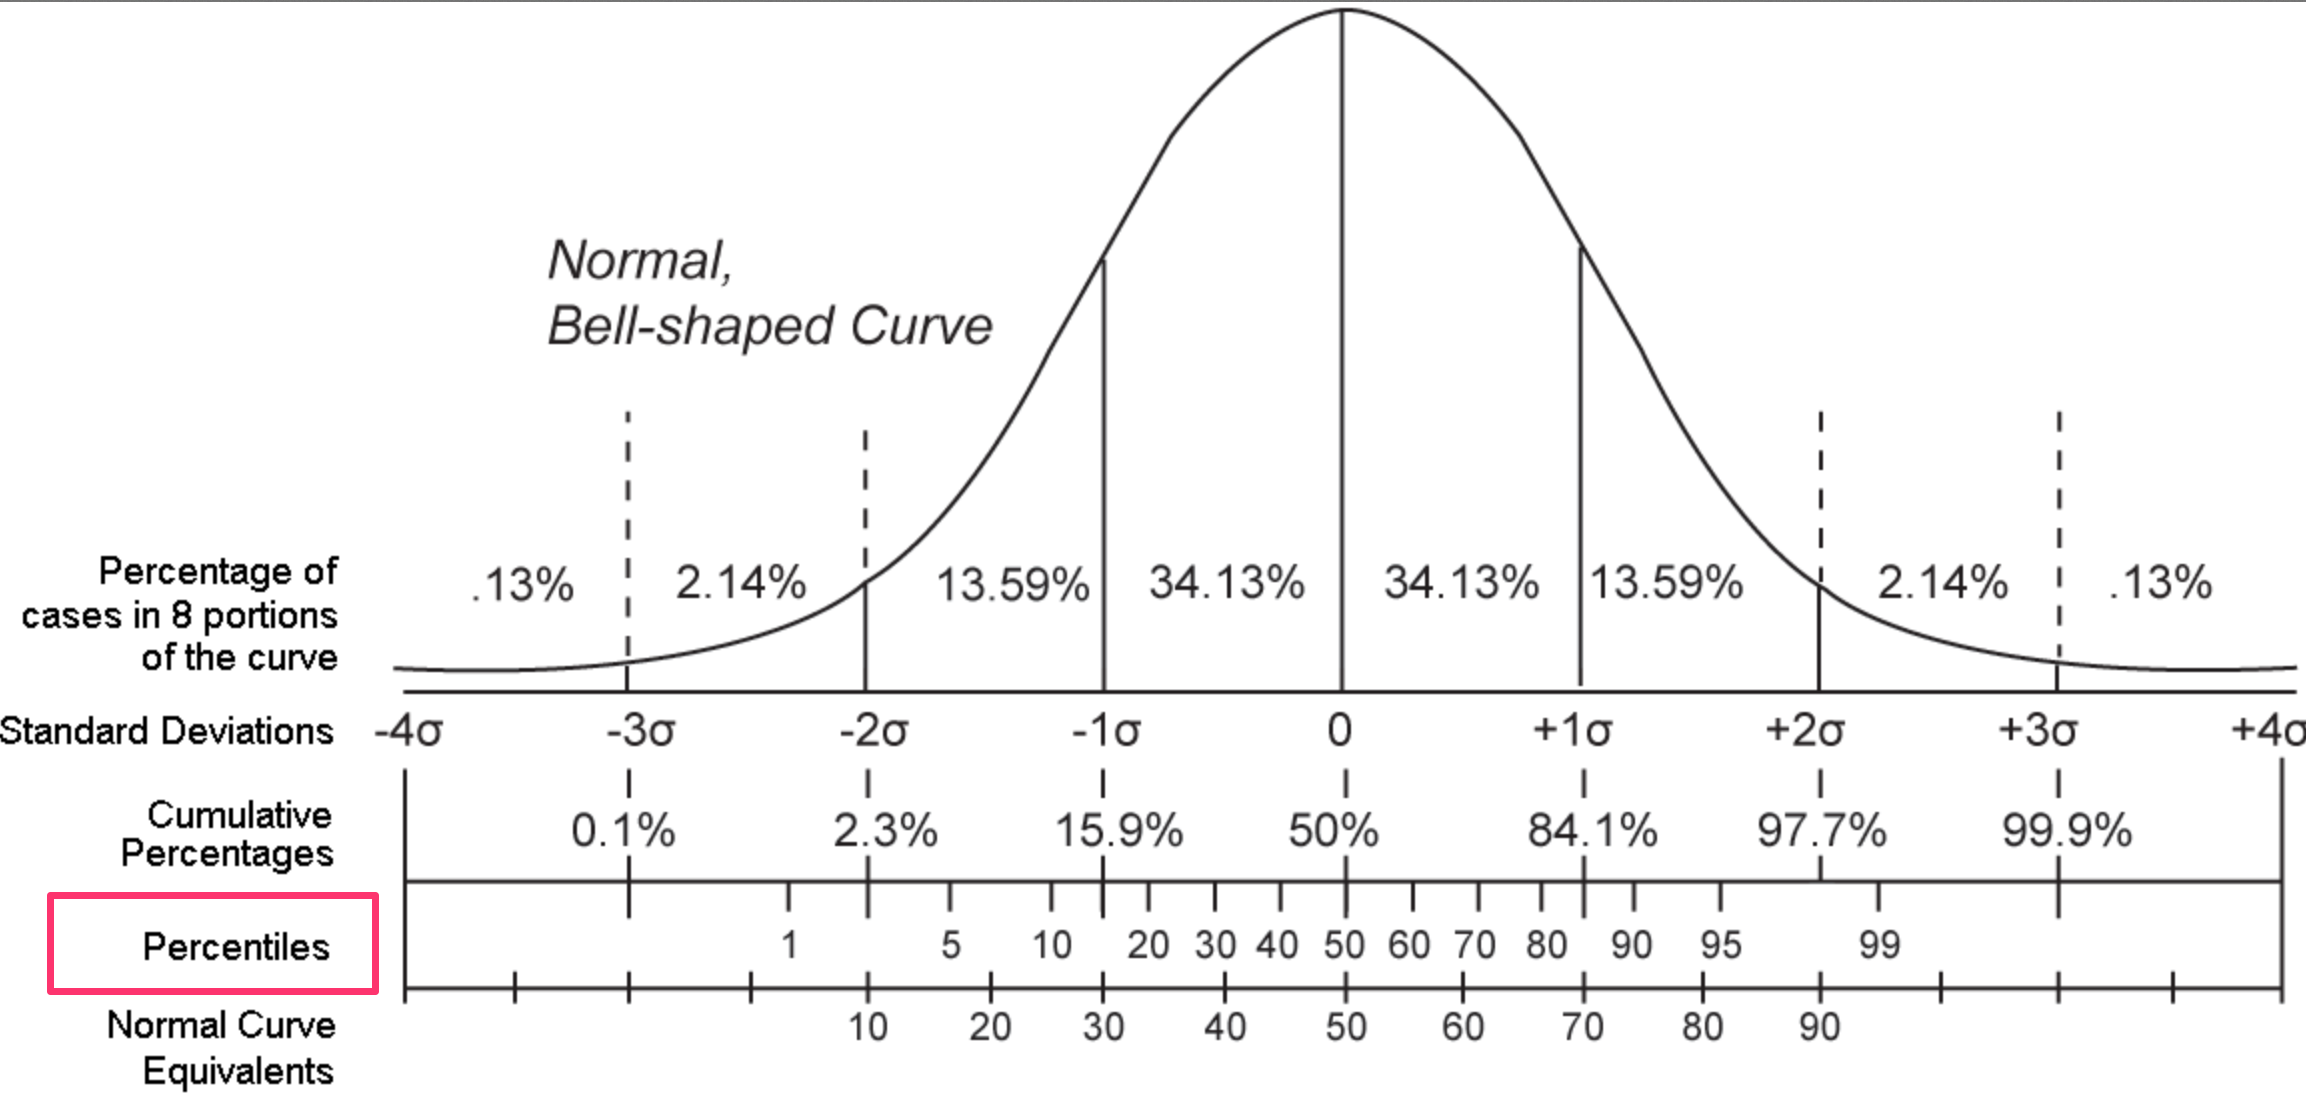
One of such statistics that is not as common as average but is still userful sometimes is percentile. In fact, median is actually 50 percentile.
I have 6 months old baby and the doctor tells us that his height is 90 percentile, which means there are 90% of the babies before him you sort all the babies from the shortest to the tallest.
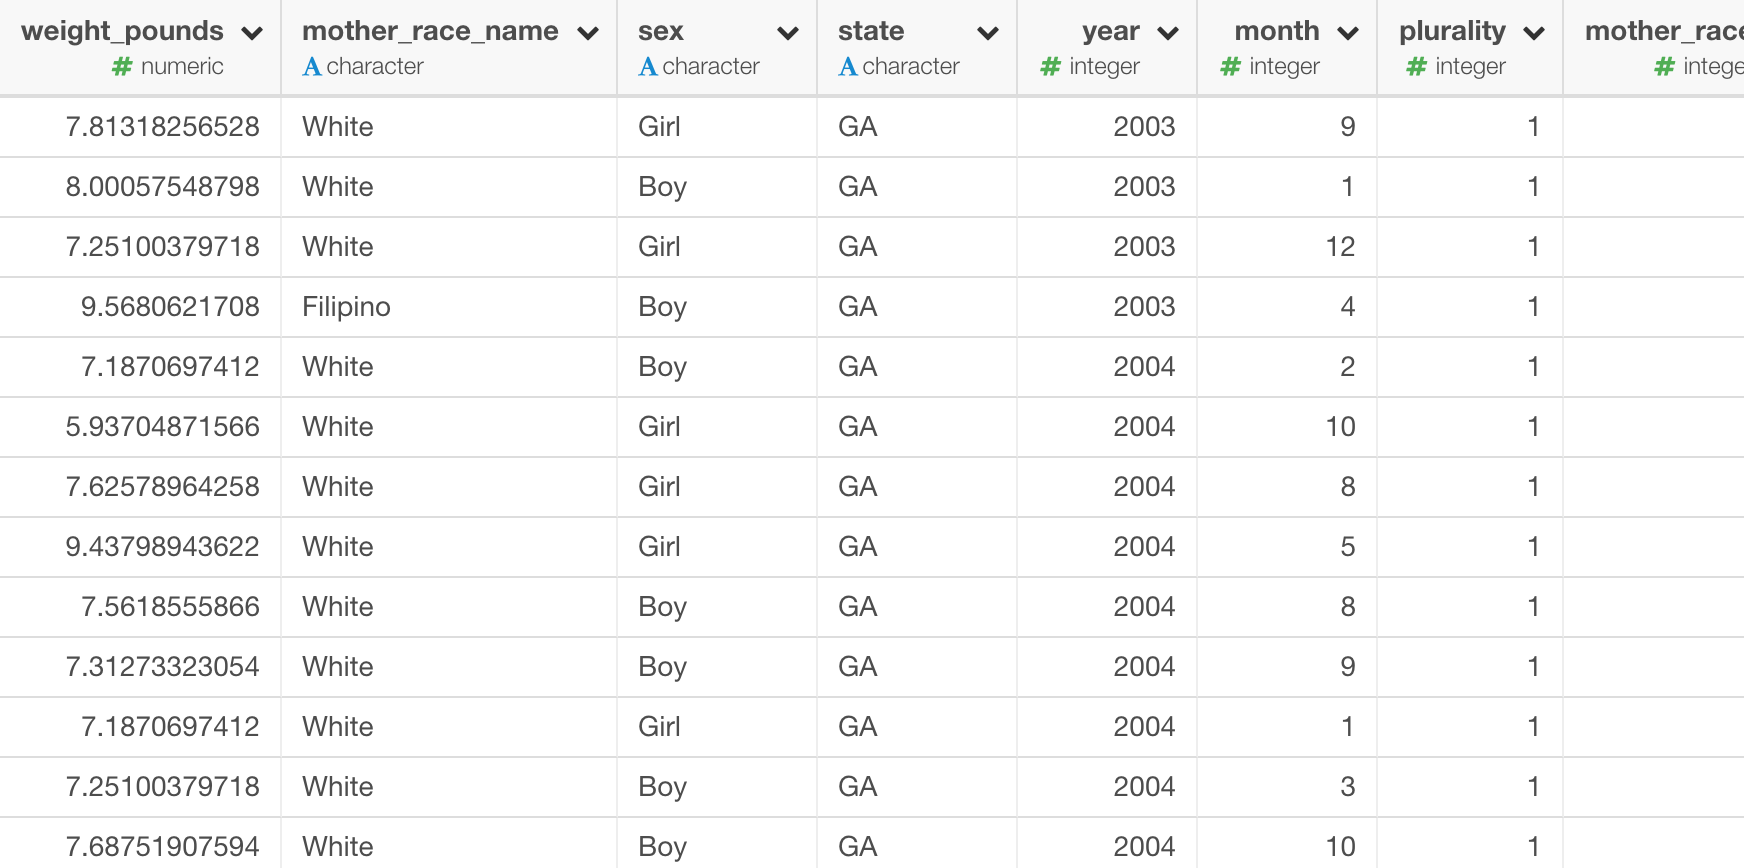
Here is US baby data with columns like weight pound, mother’s race name, sex, etc.
Now, how can we calculate the 90 percentile of the weight for all the babies.
Luckily, we have quantile function in R, which we can use in Summarize command to calculate any number of percentile.
summarize( weight_90pct = quantile(weight_pounds, probs=0.9, na.rm=TRUE)How about calculating the 90 percentile for each mother race?
All you need to do is to use Group By command to group your data, say by Race, then use Summarize command to have whatever the percentile calculated.
Let’s take a look.
Use Quintile Function with Summarize
Select ‘Summarize’ -> ‘Custom’ from the column header menu of ‘wegith_pound’ column.
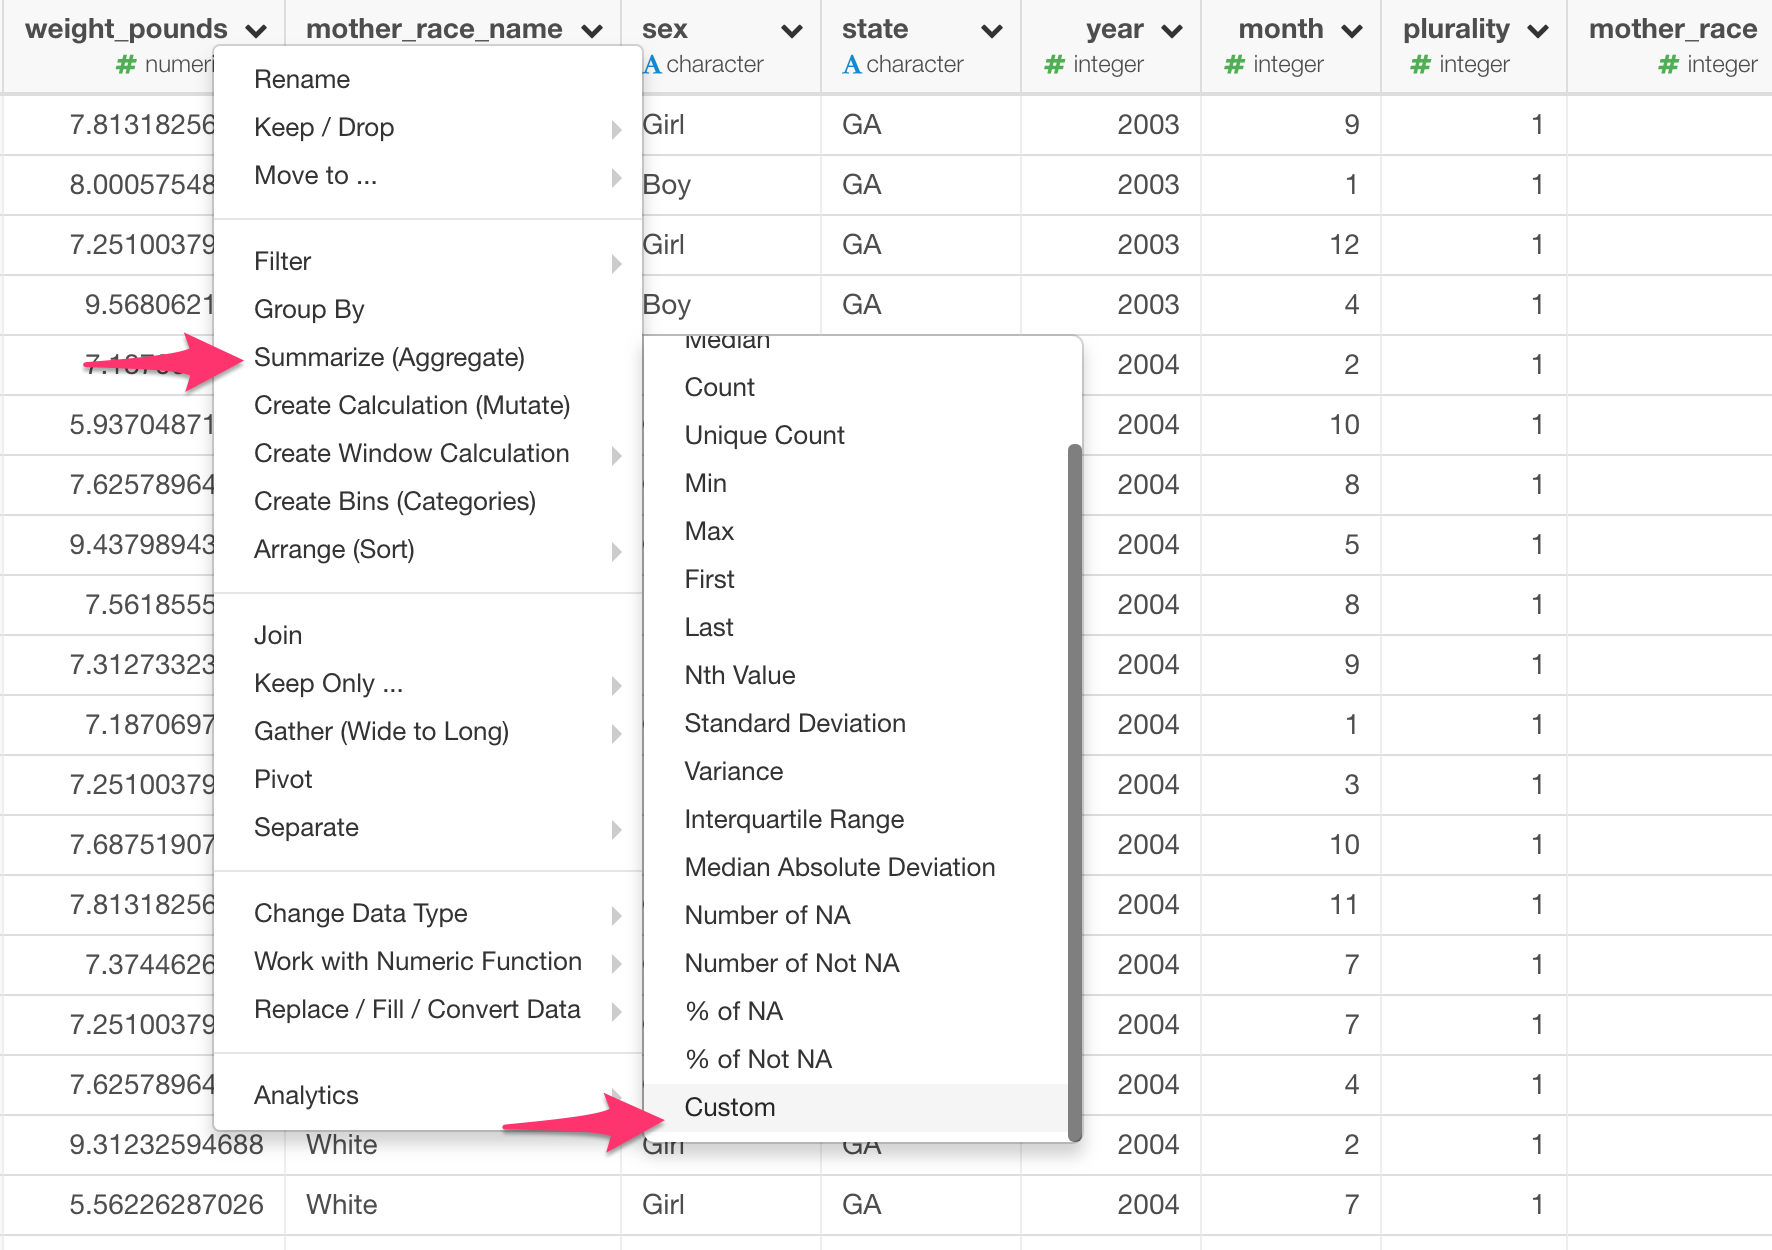
Type the quantile function syntax in the expression input under Custom tab.
quantile(weight_pounds, probs=0.9, na.rm=TRUE)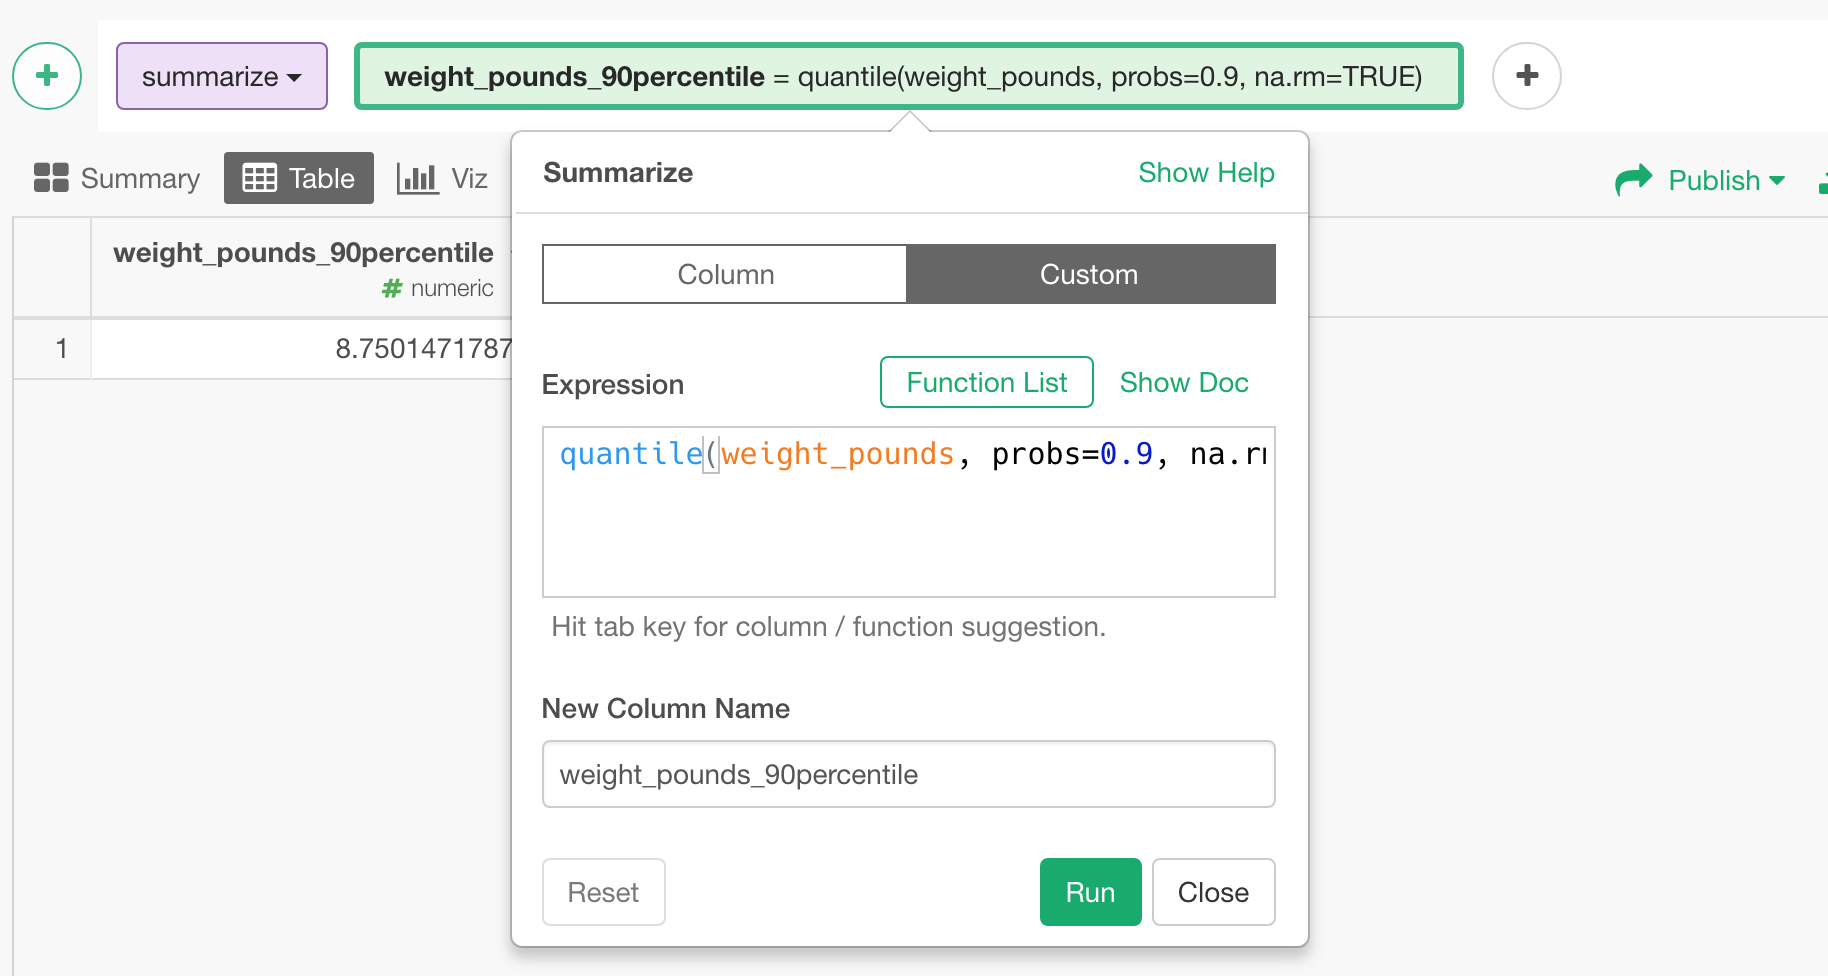
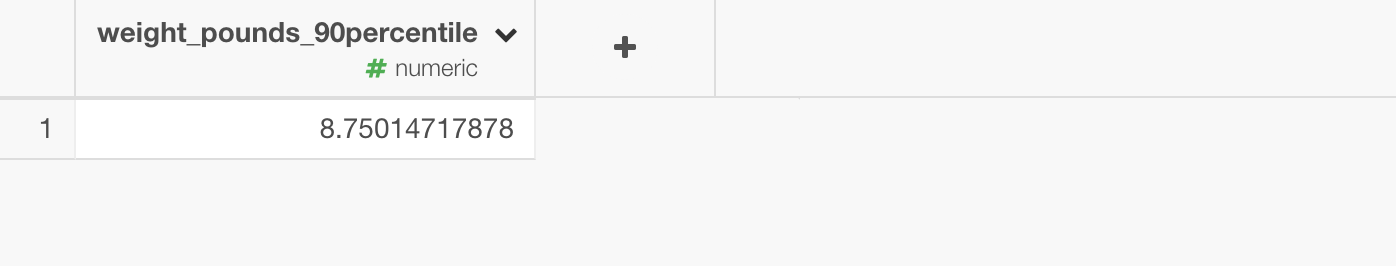
We’ll get just one row of the result. This is the 90 percentile of the wegith for all the babies.
Here is a histogram that shows the 0-90 percentile as blue and 90-100 percentile range as orange.
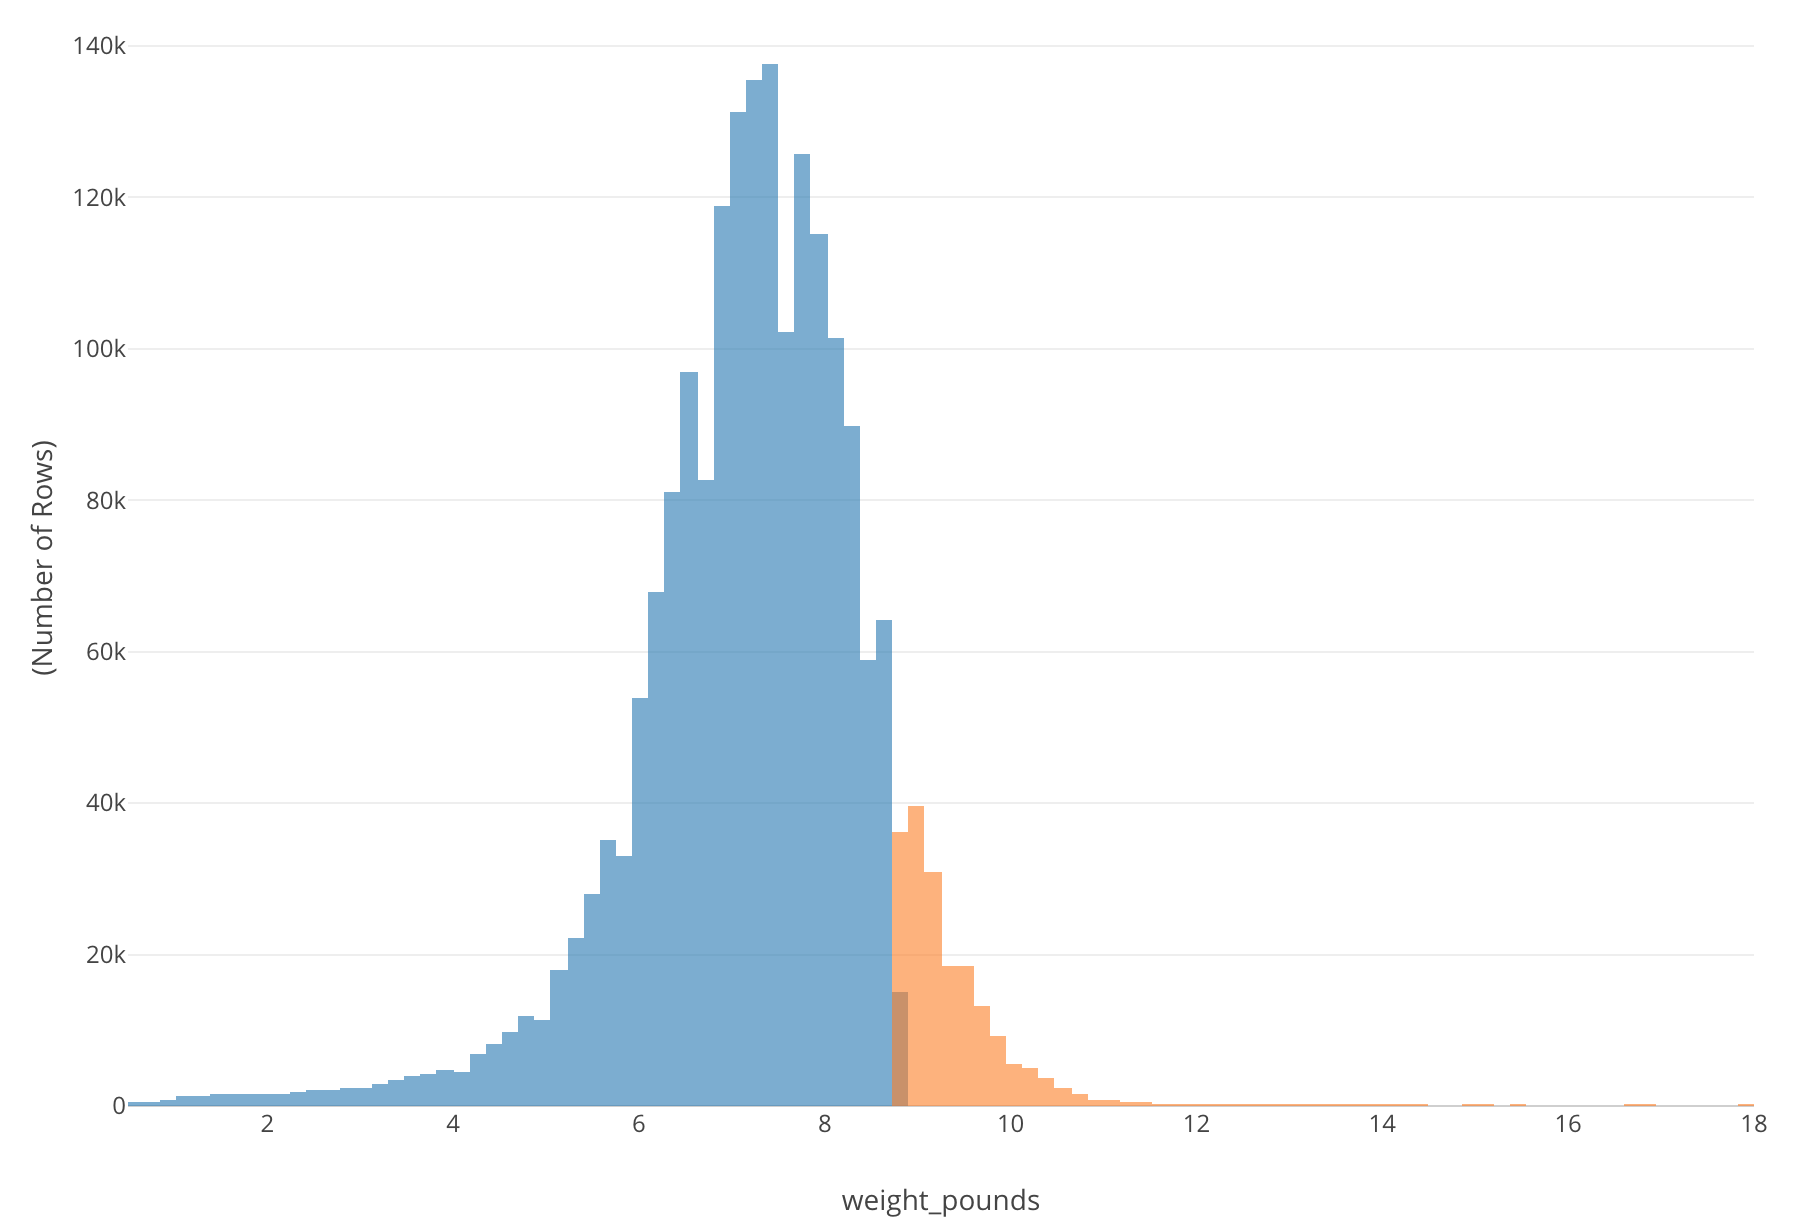
You can see 8.750 is just between the blue and the orange.
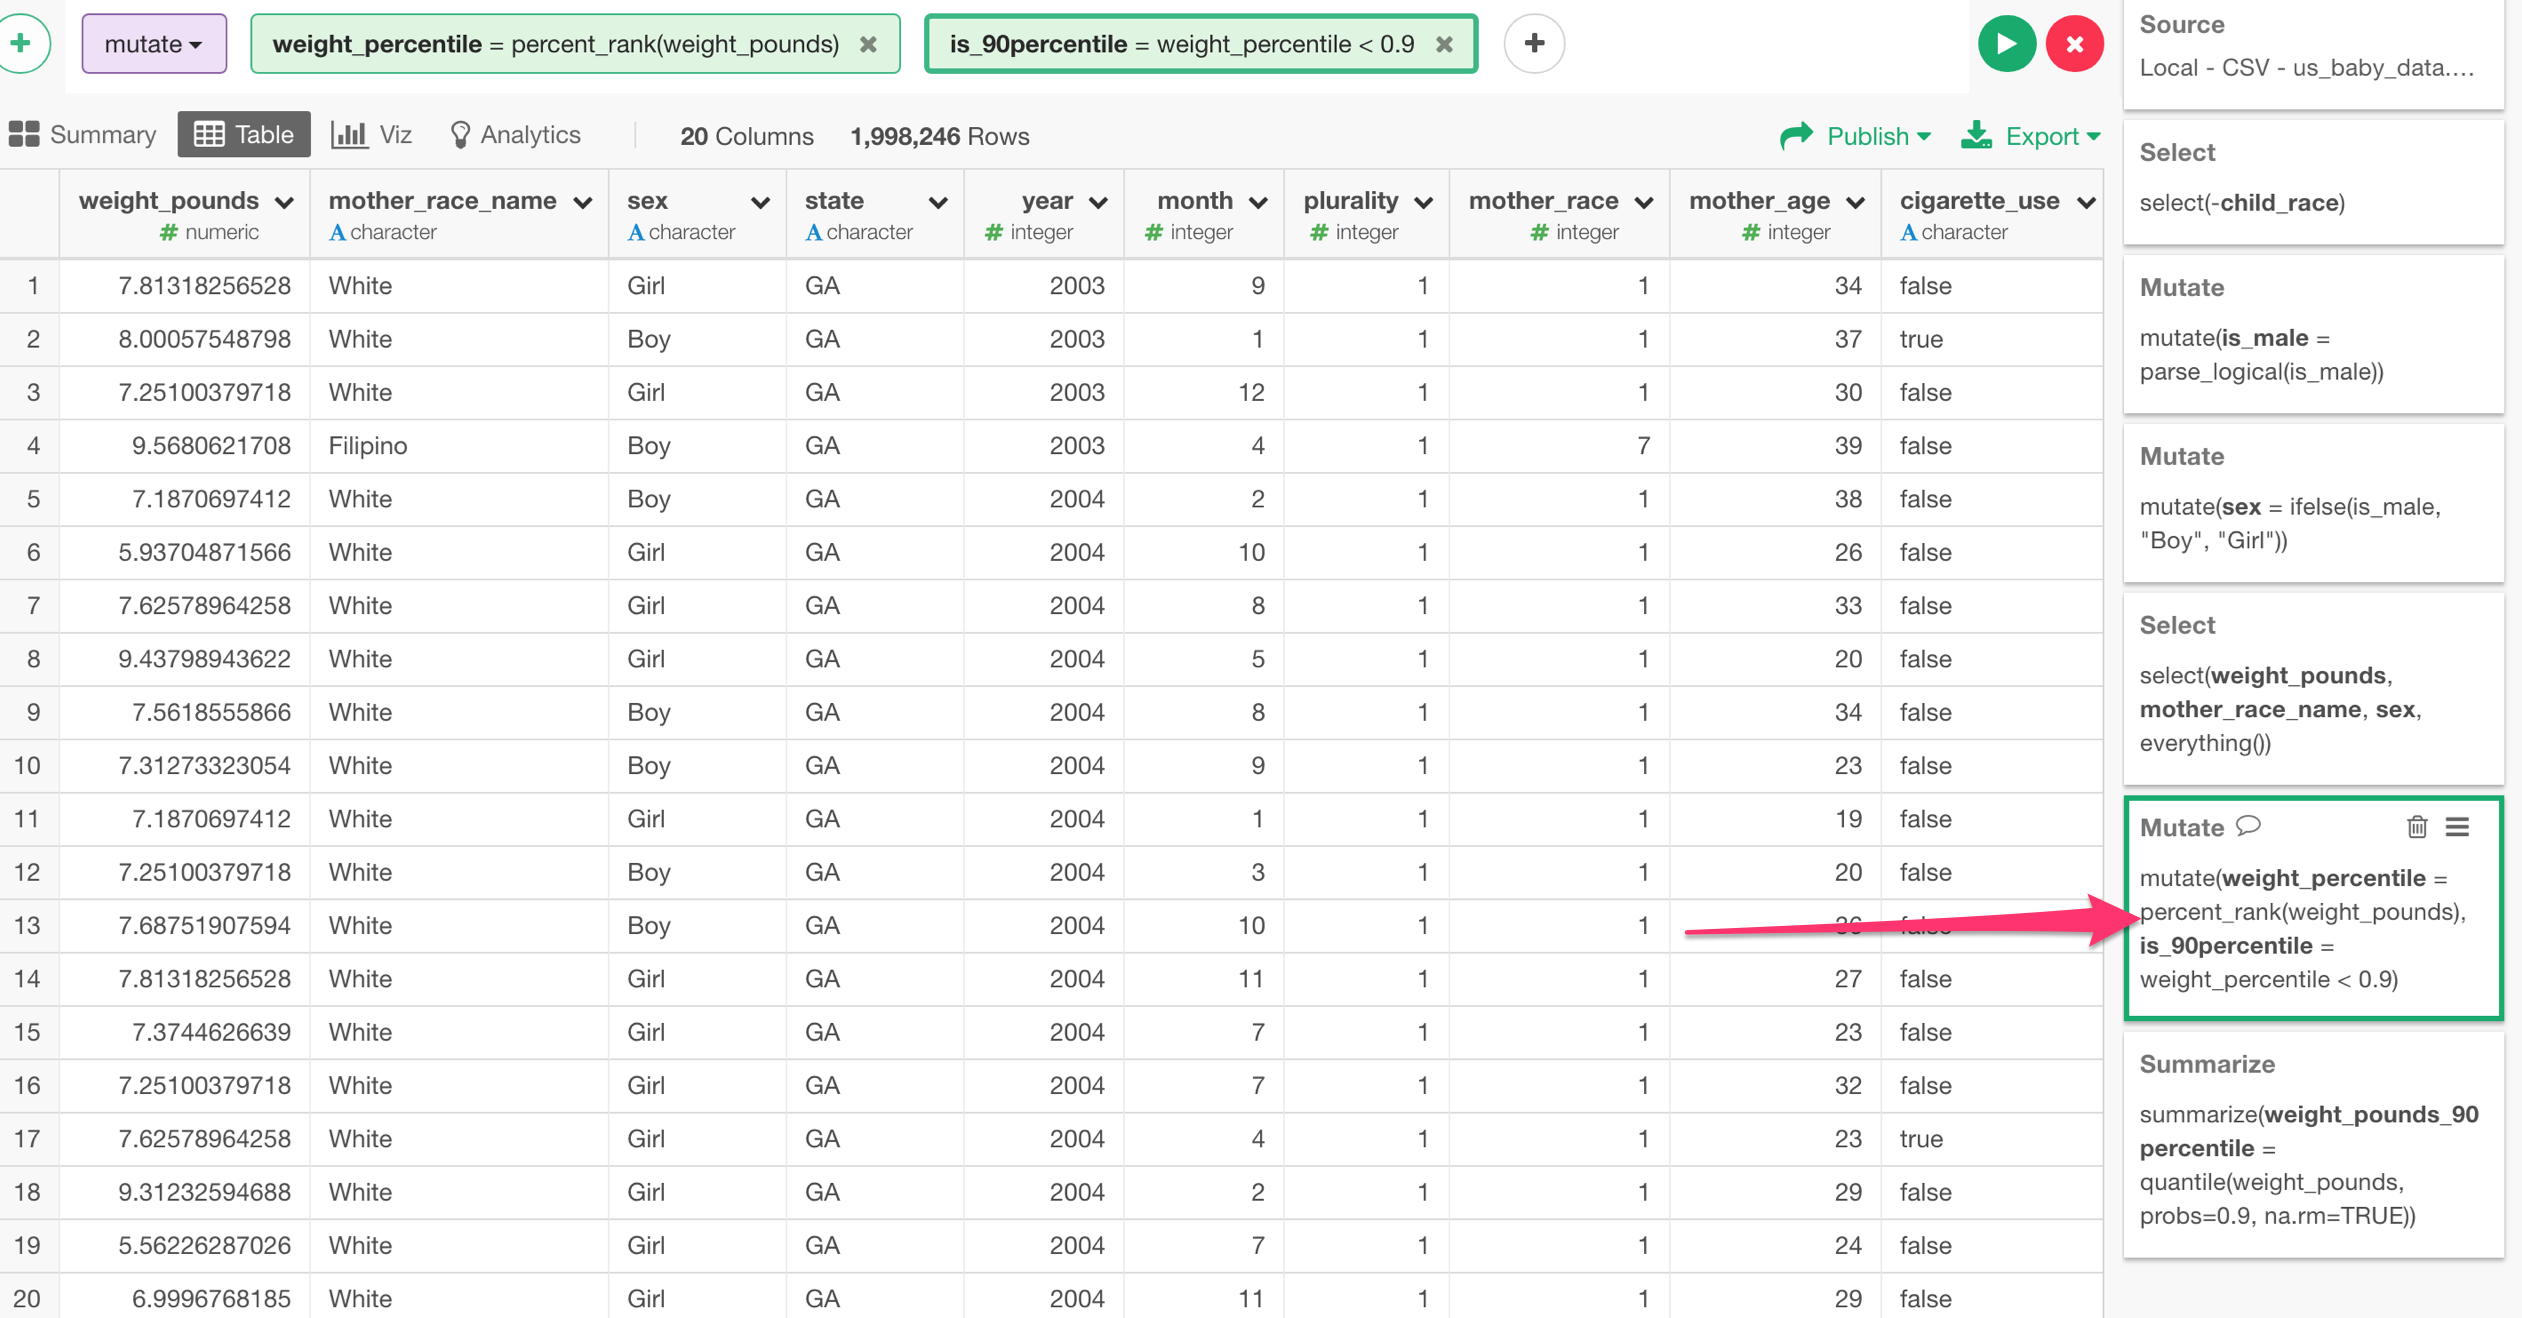
I’ve used ‘percent_rank’ function to calculate each baby’s percentile rank. Take a look at this post for more details on the percentile rank calculation.
Group the Data Frame
Now, let’s calculate the 90 percentile for each race.
All we need to do is to group the data frame by the race right before the summarize step that we created above. This will make the summarize calculation, in this case that is the quantile calculation, to be done for each group.
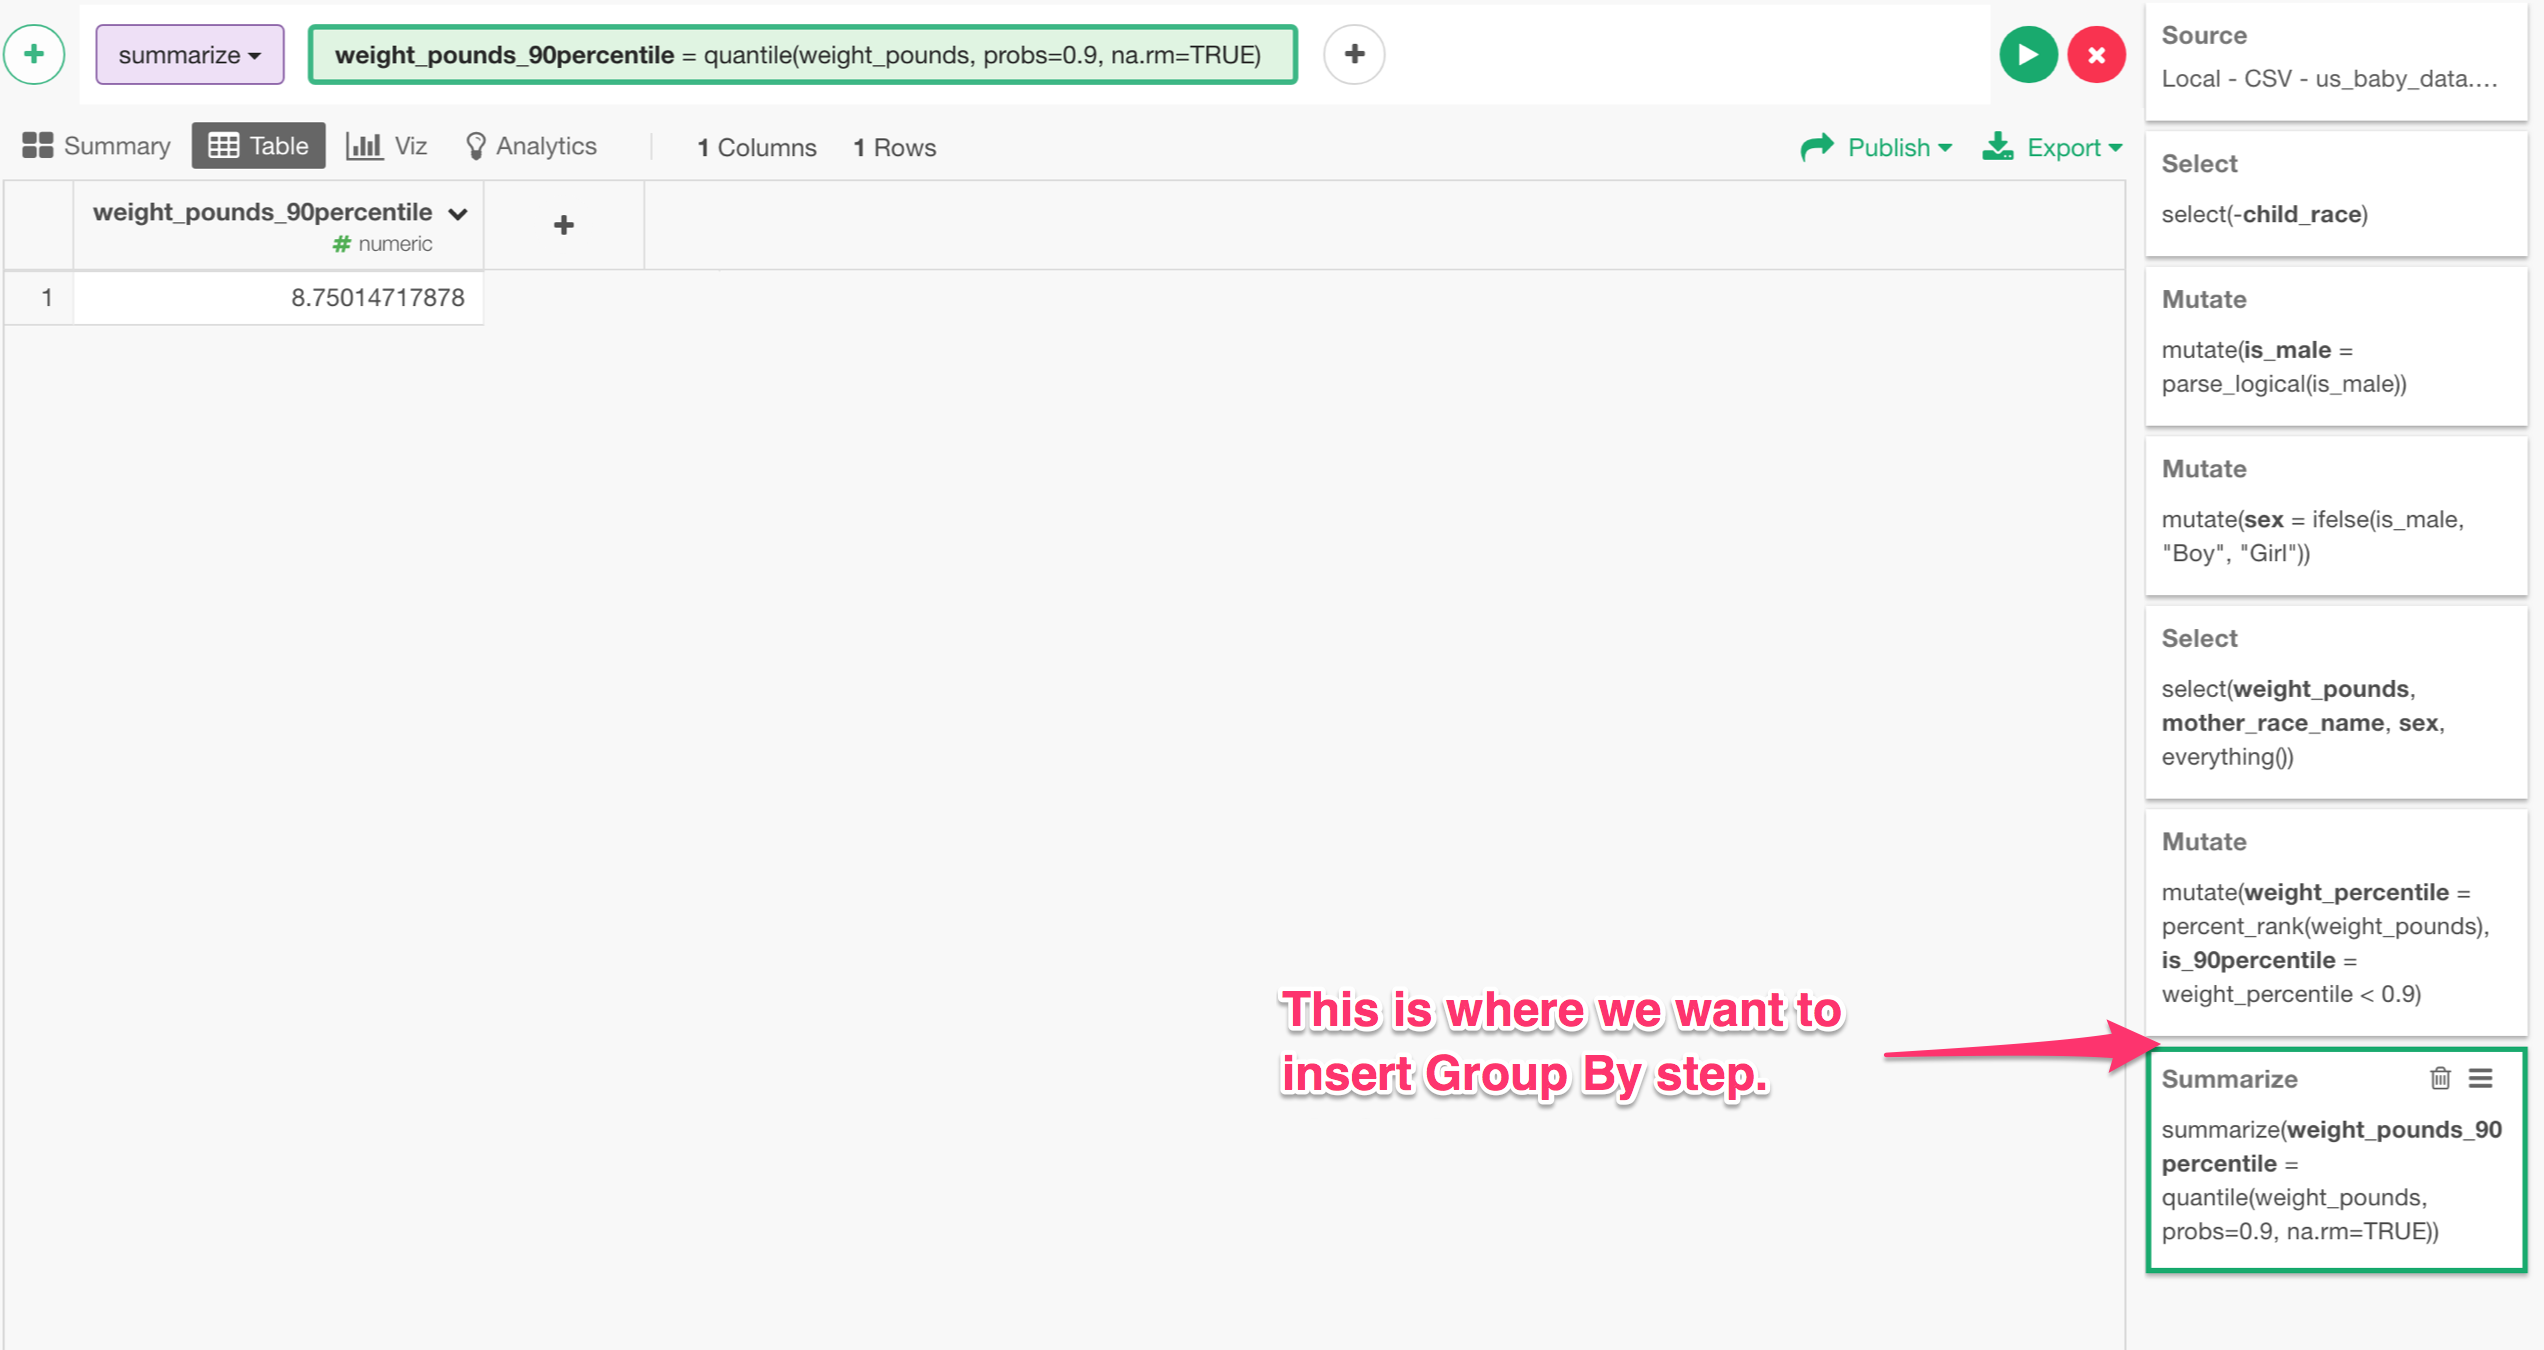
So, select a step right before Summarize step. In my case, I’m select ‘Mutate’ step that happens to be the step before the Summarize step.
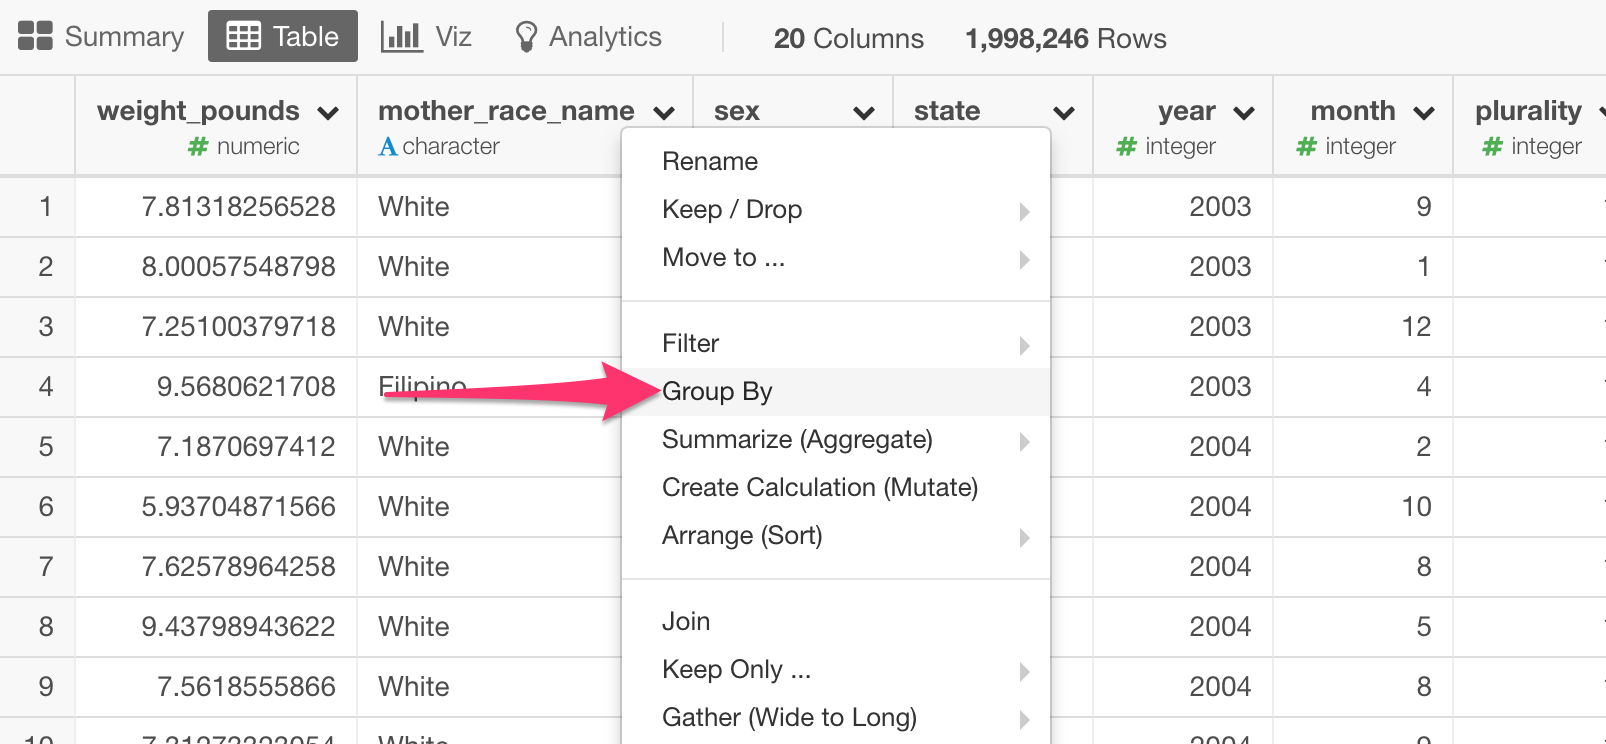
Then, select ‘Group By’ from the column header menu of ‘morther_race_name’ column, by which we want to group the data frame.
Once you run the Group By command, you want to click on the Summarize step to do the quantile calculation against the ‘grouped’ data.
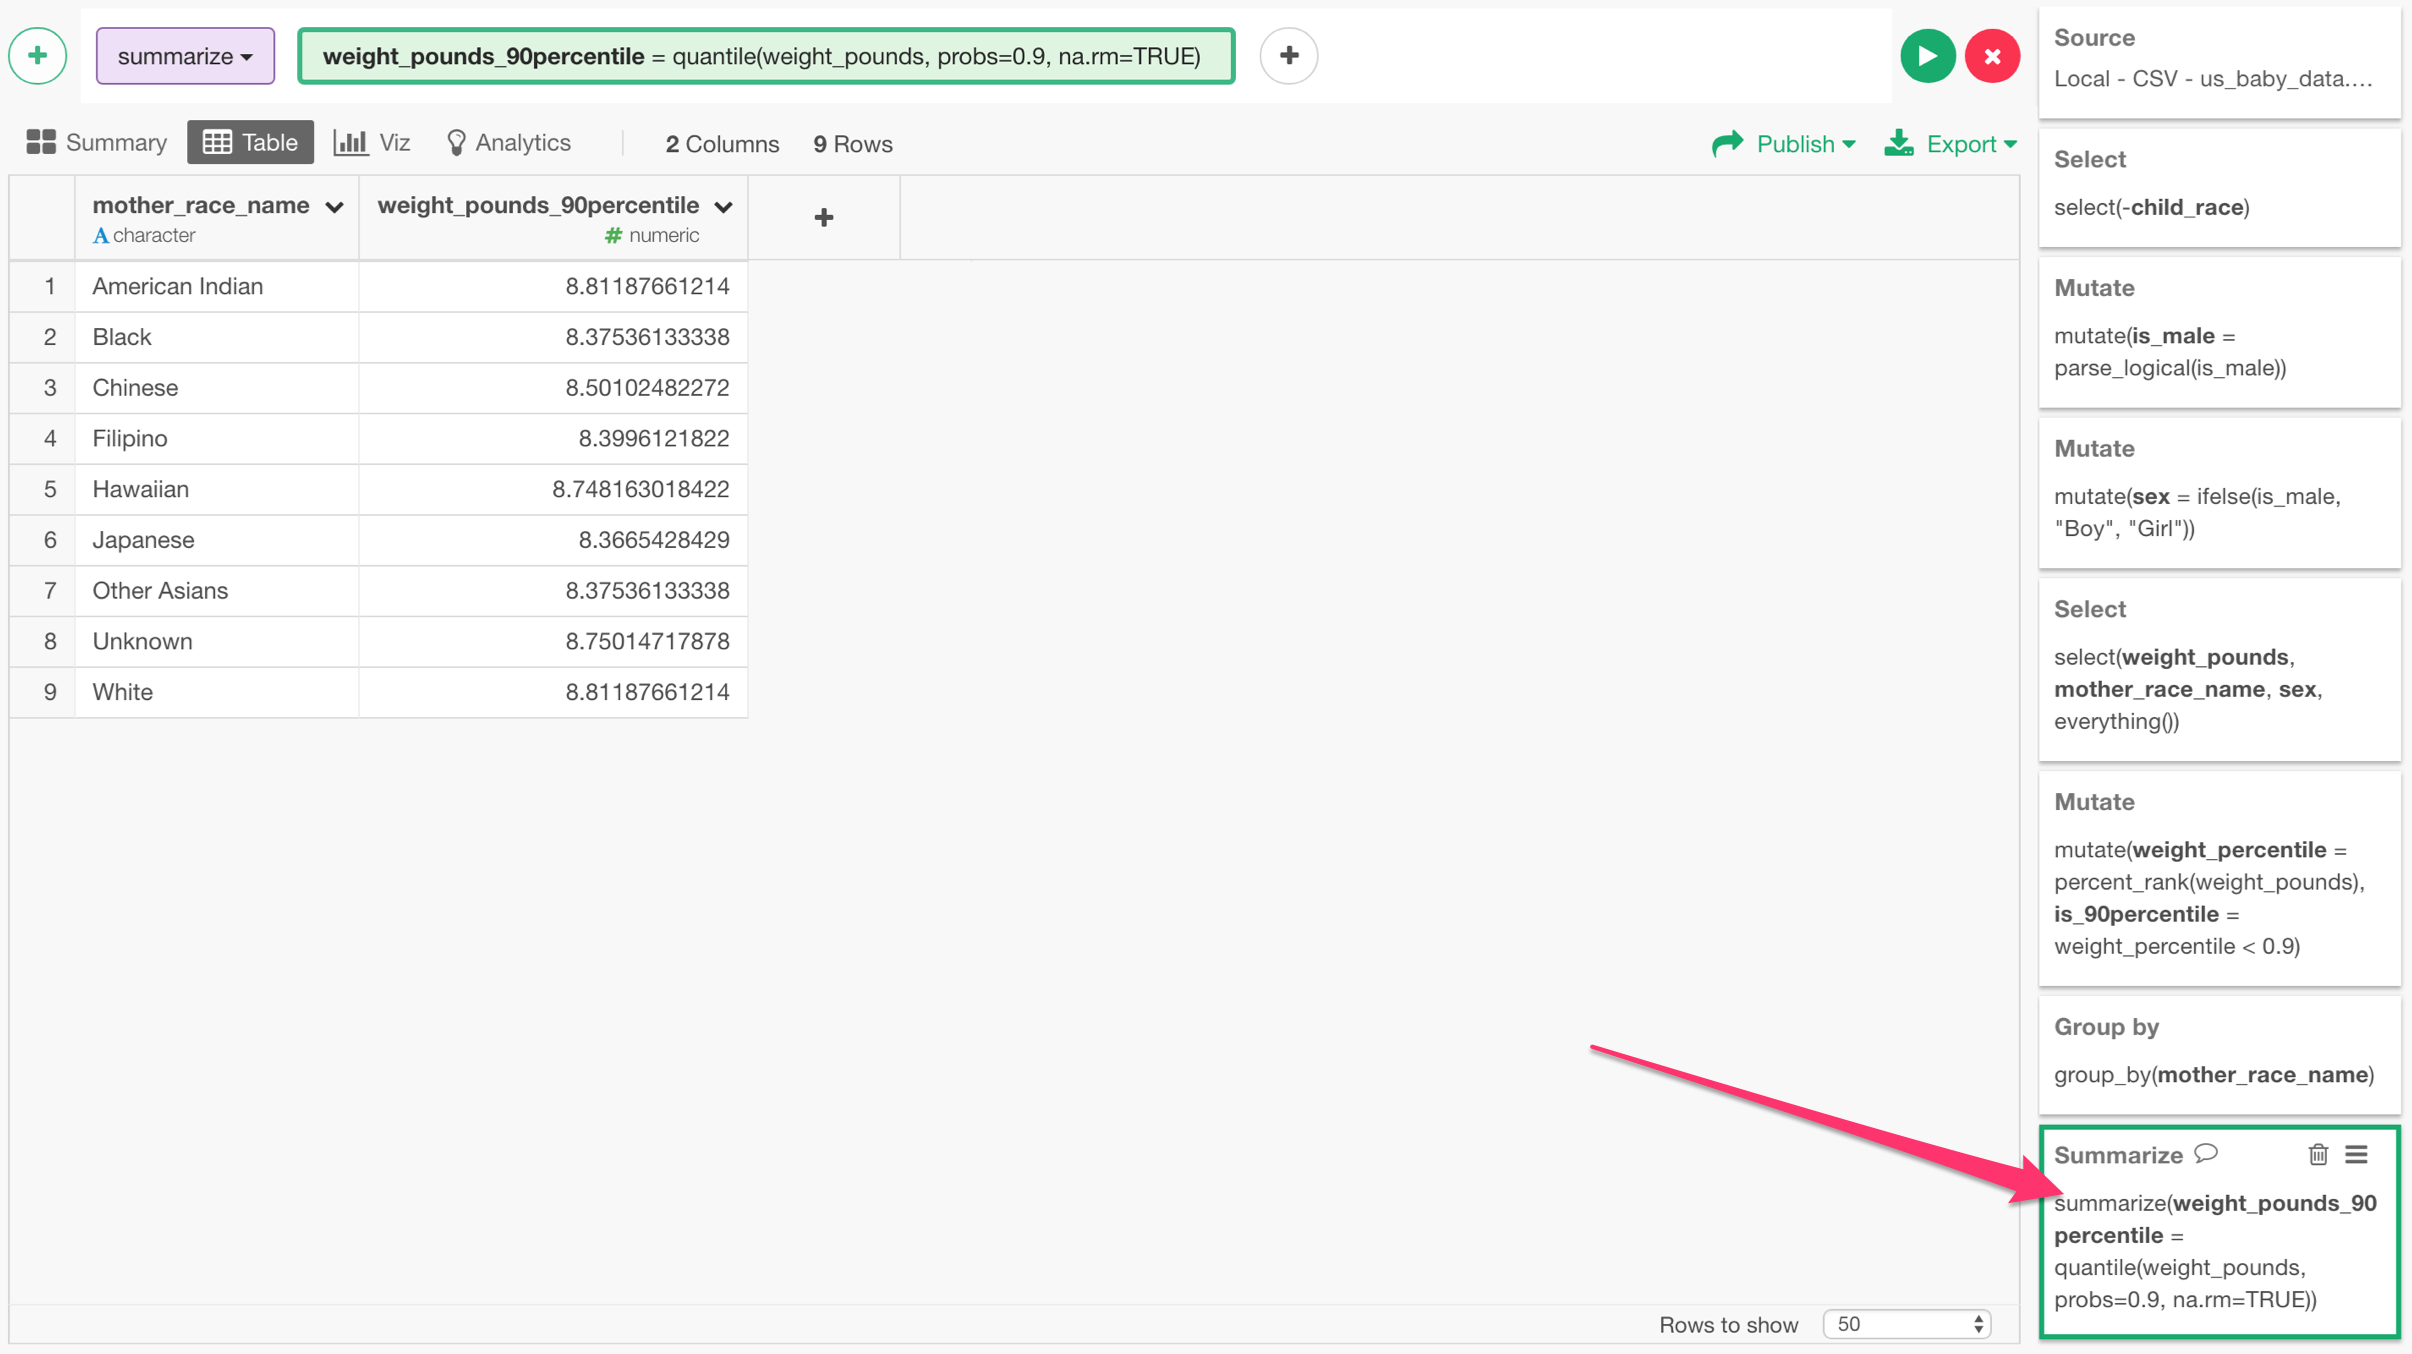
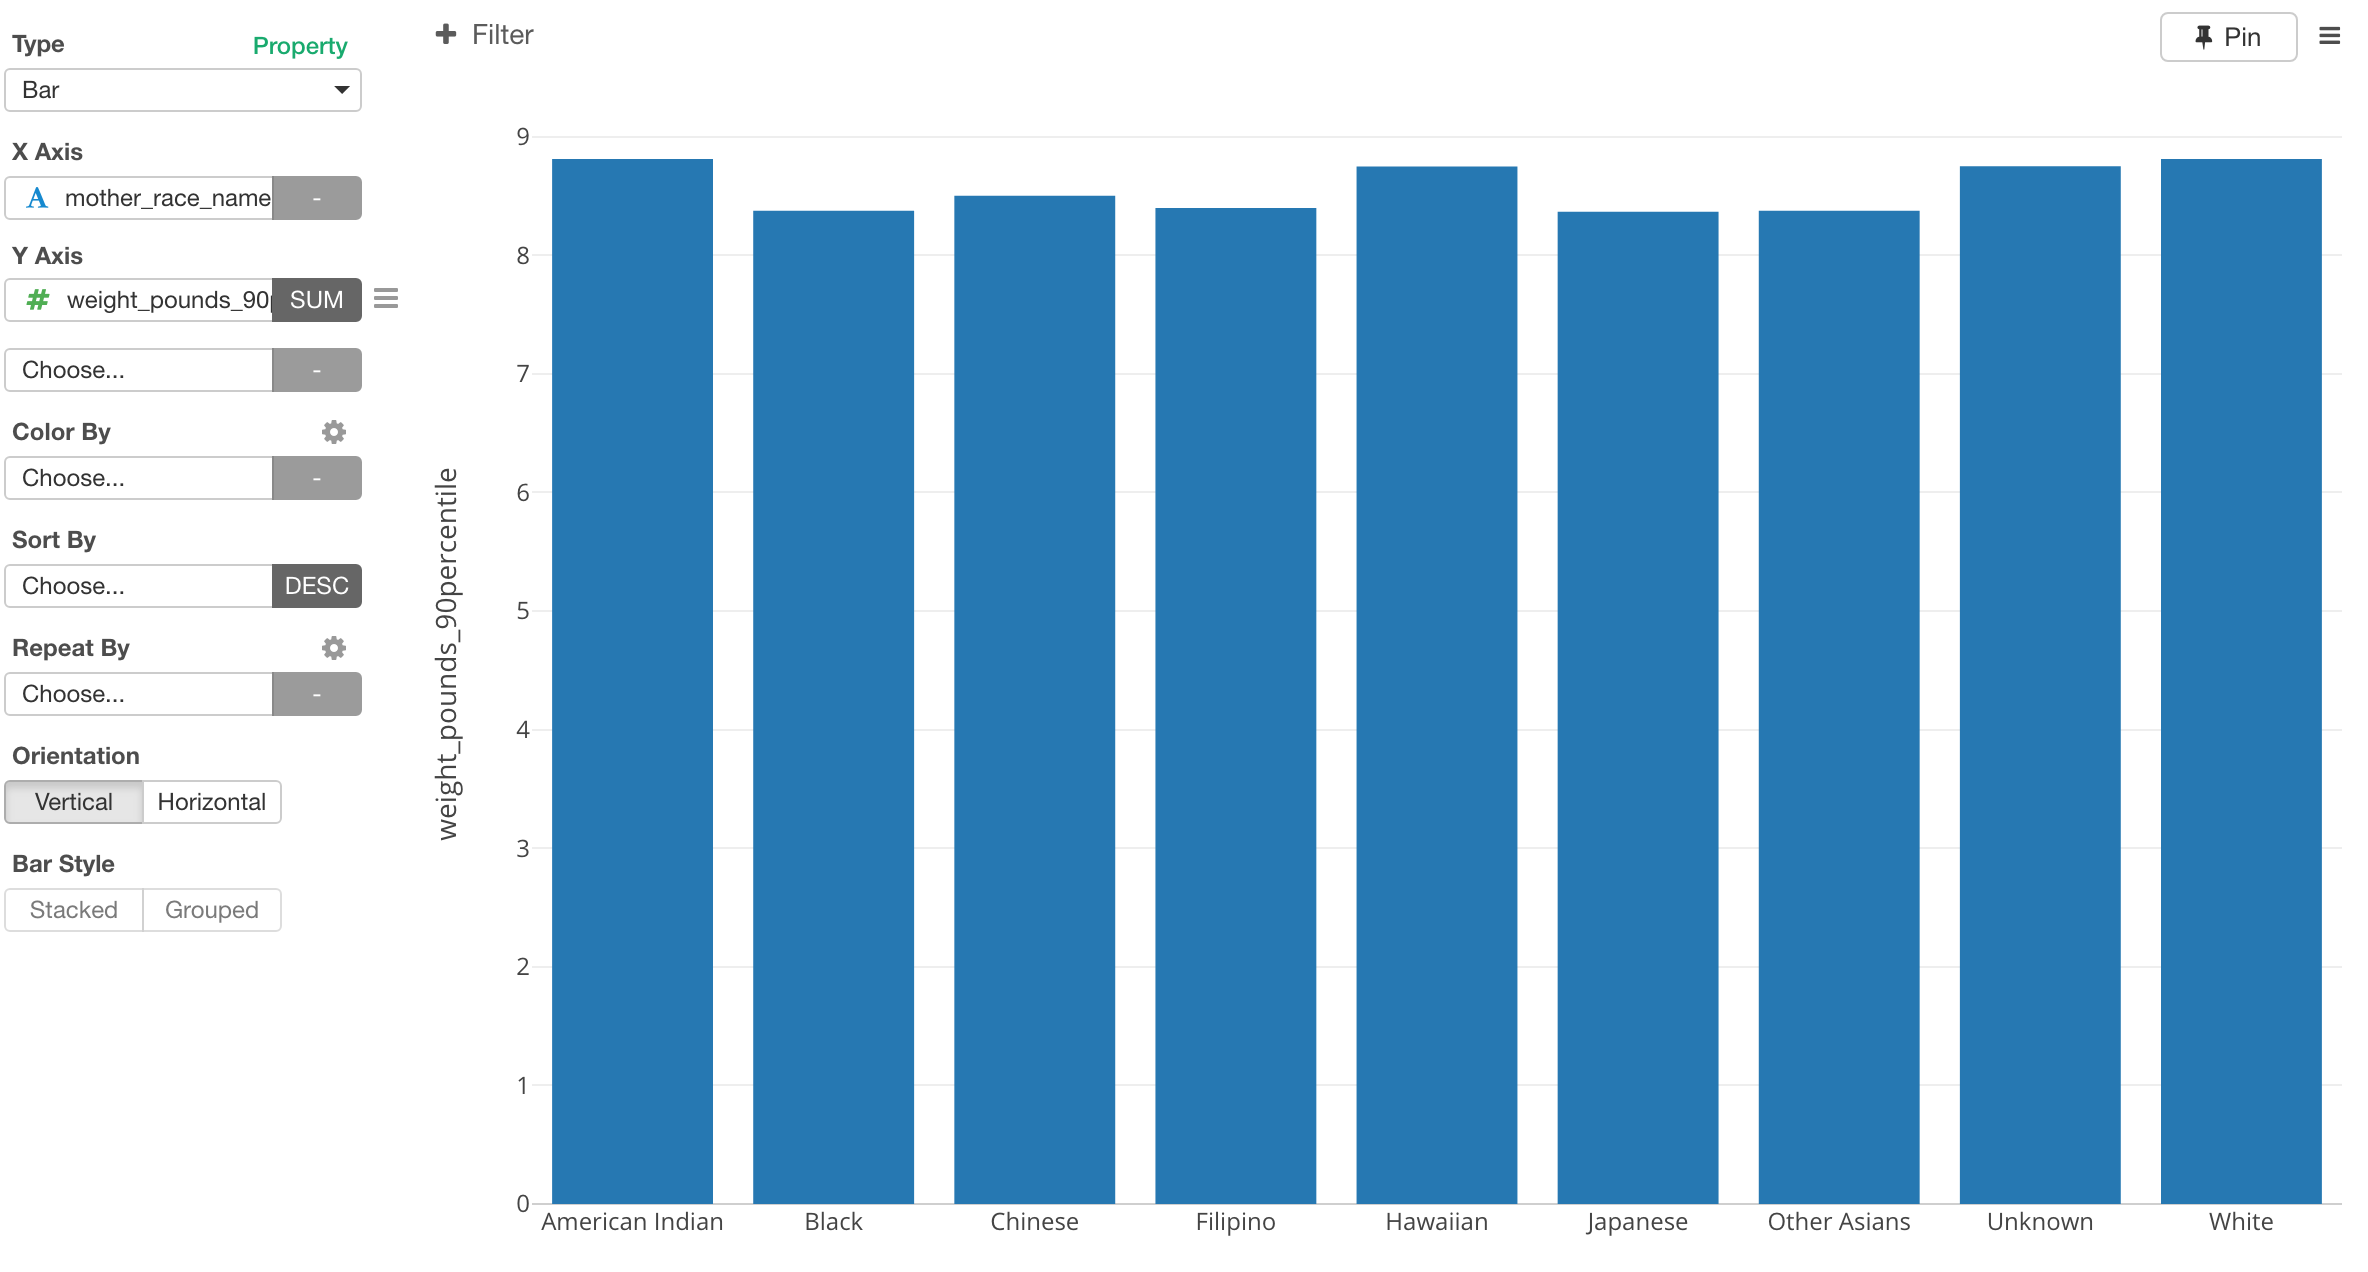
This will calcualte the 90 percentile for each race.
You can see slight differences when you visualize the result with something like a bar chart.