How to Calculate the Duration Between Two Date/Times
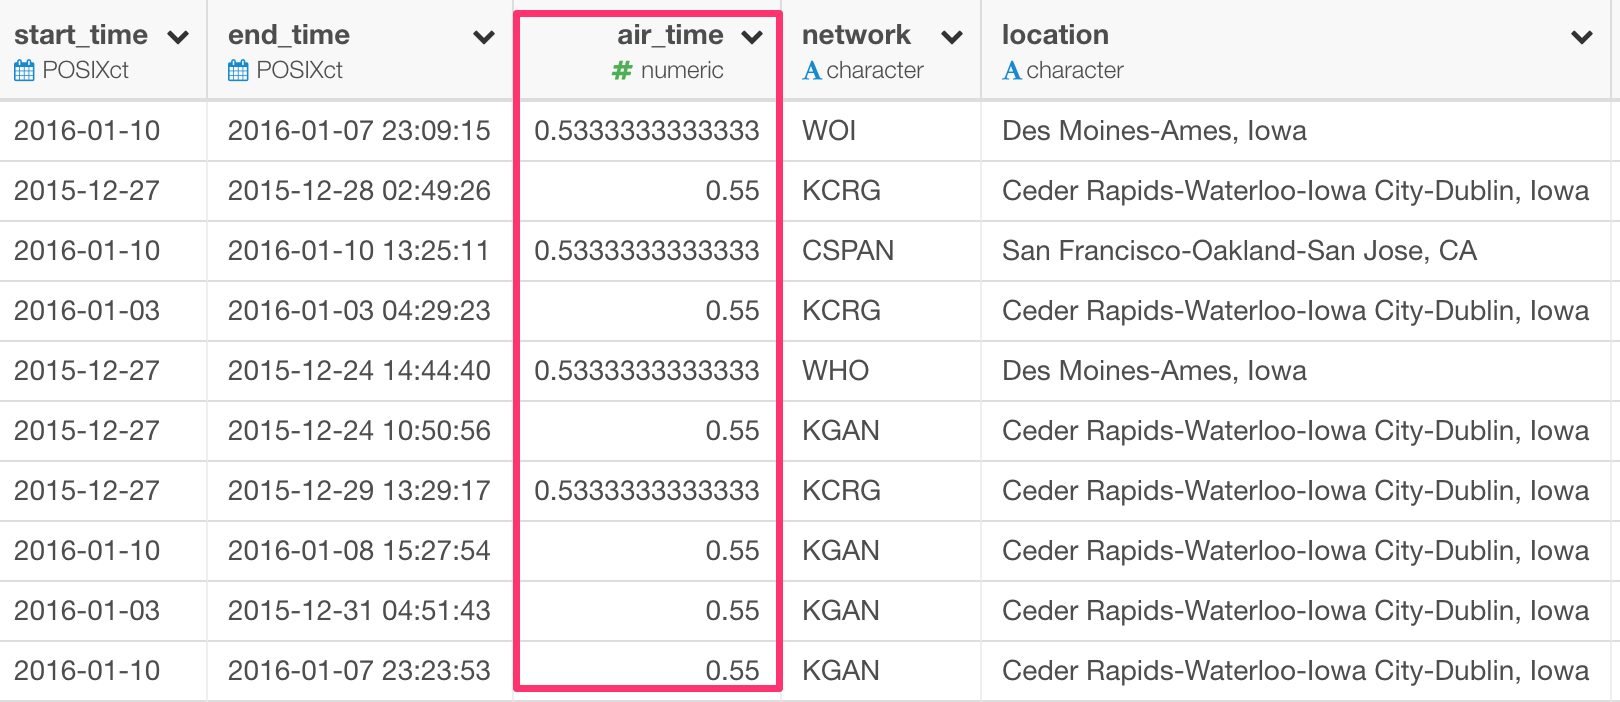
We have this 2016 US Election TV Advertisement Campaign data.
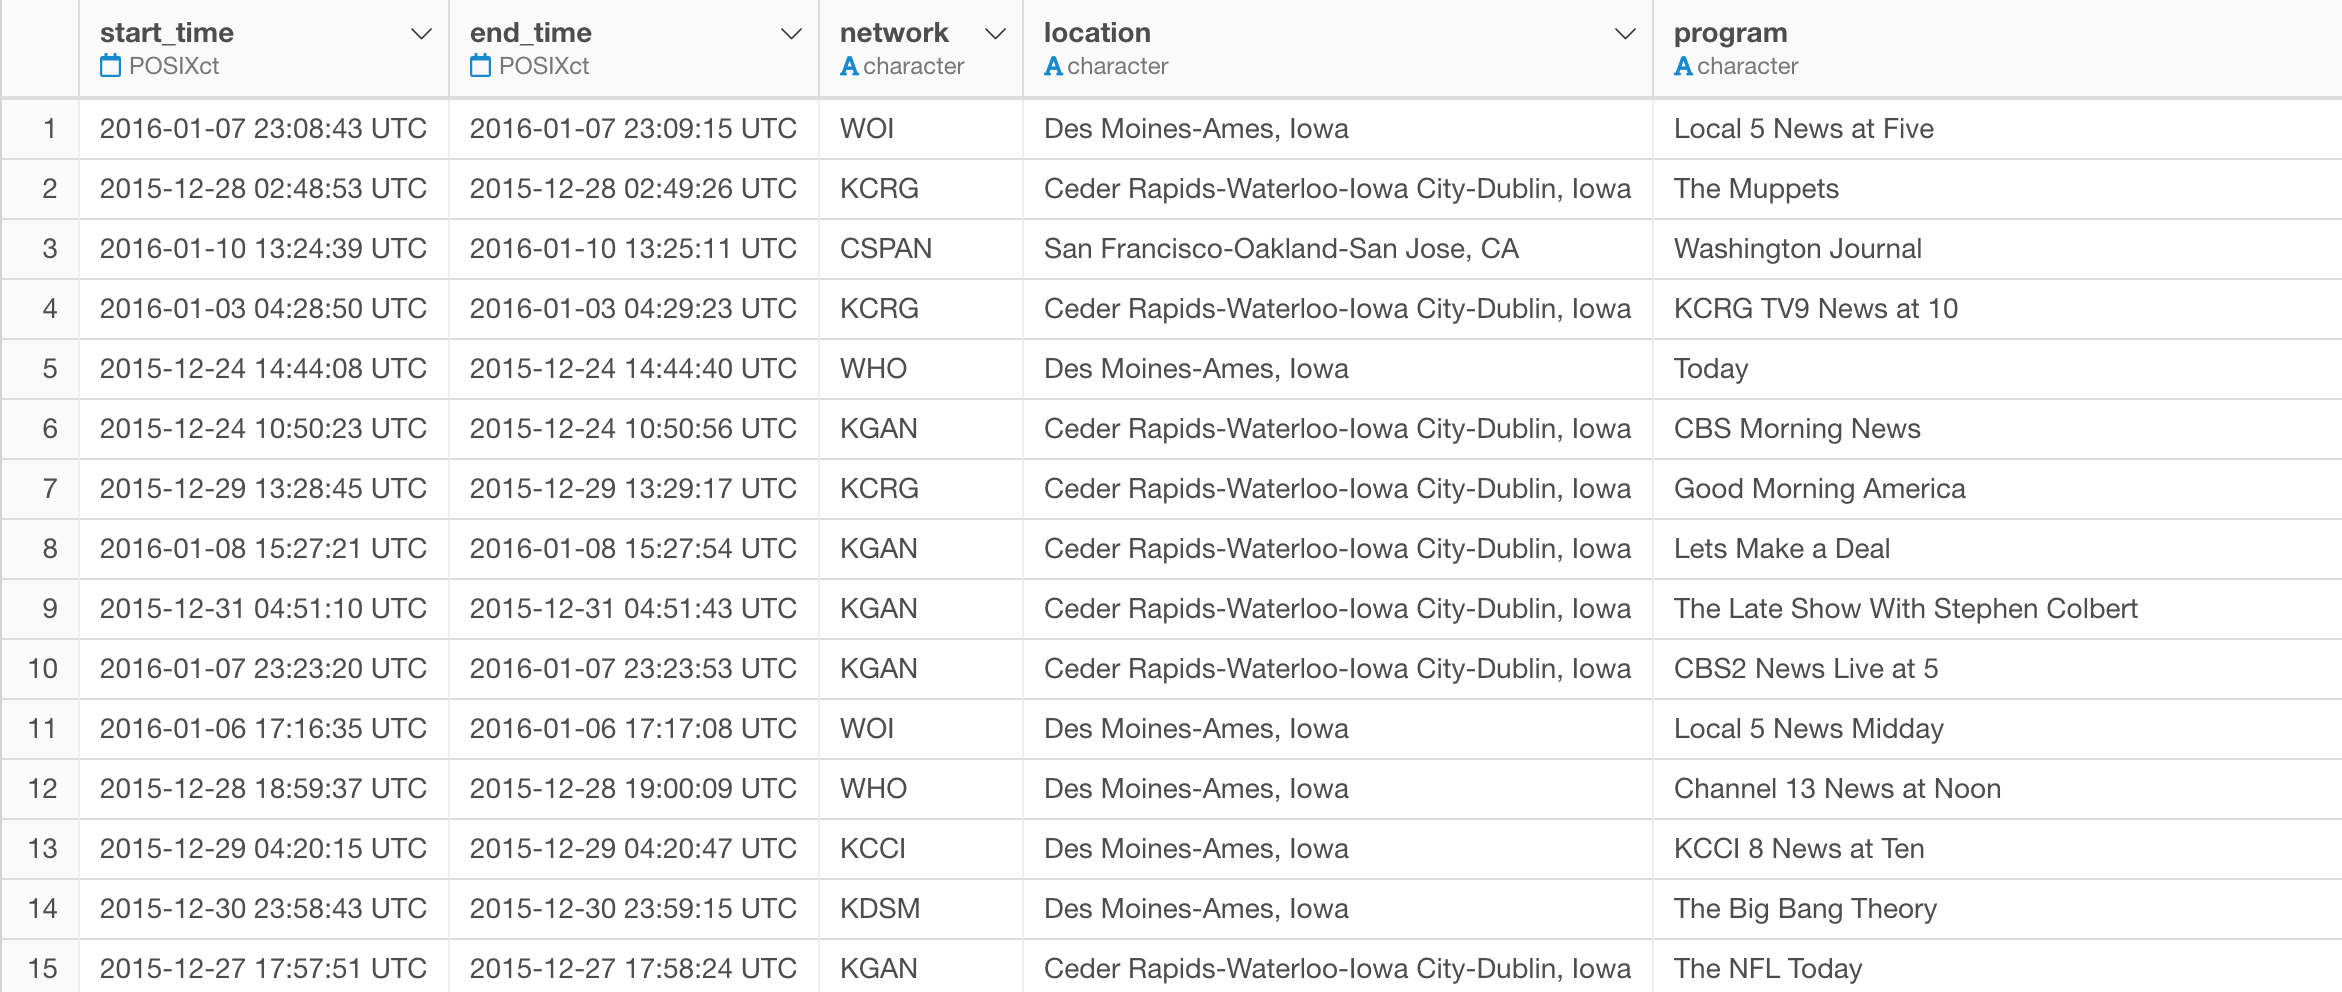
Each row represents each TV commercial.
Let’s say we want to calculate how long each commercial was running for by using the start and the end times.
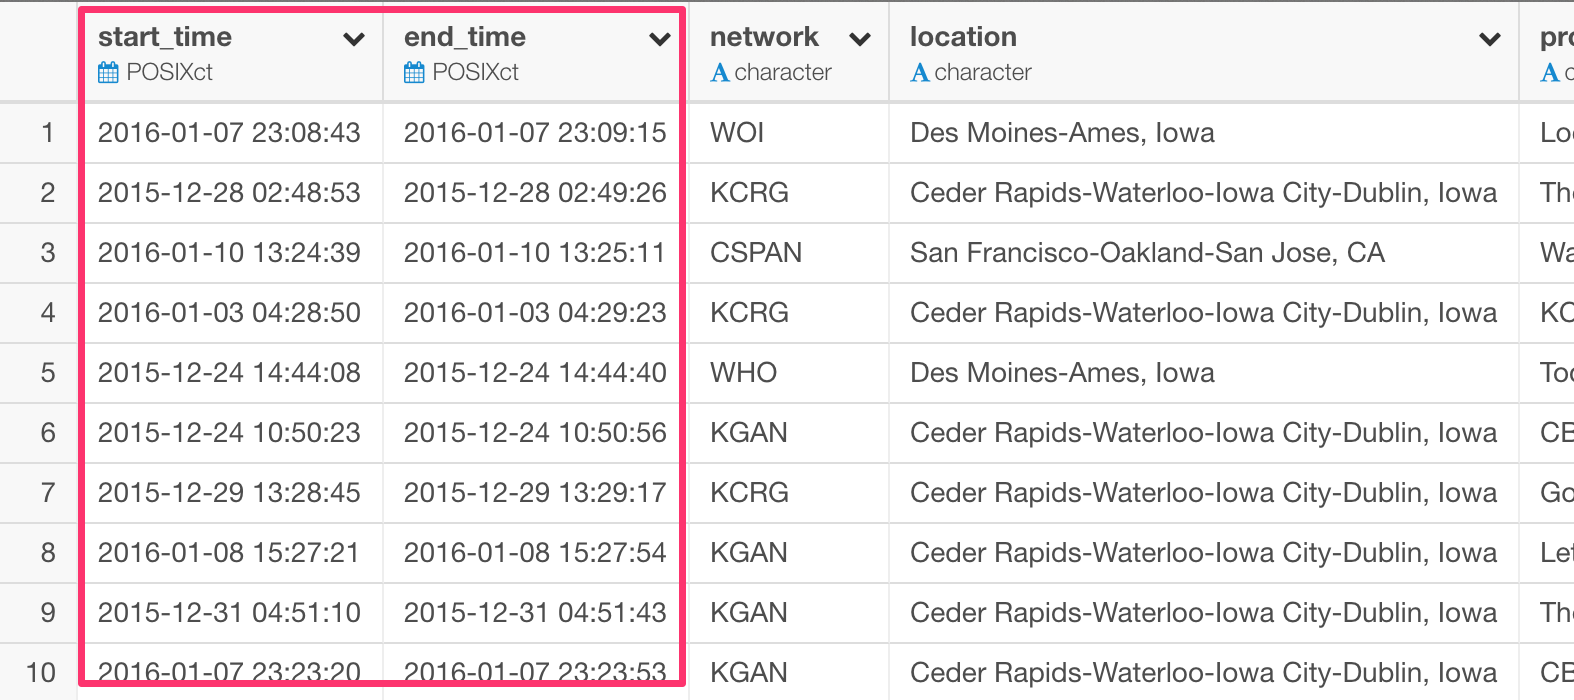
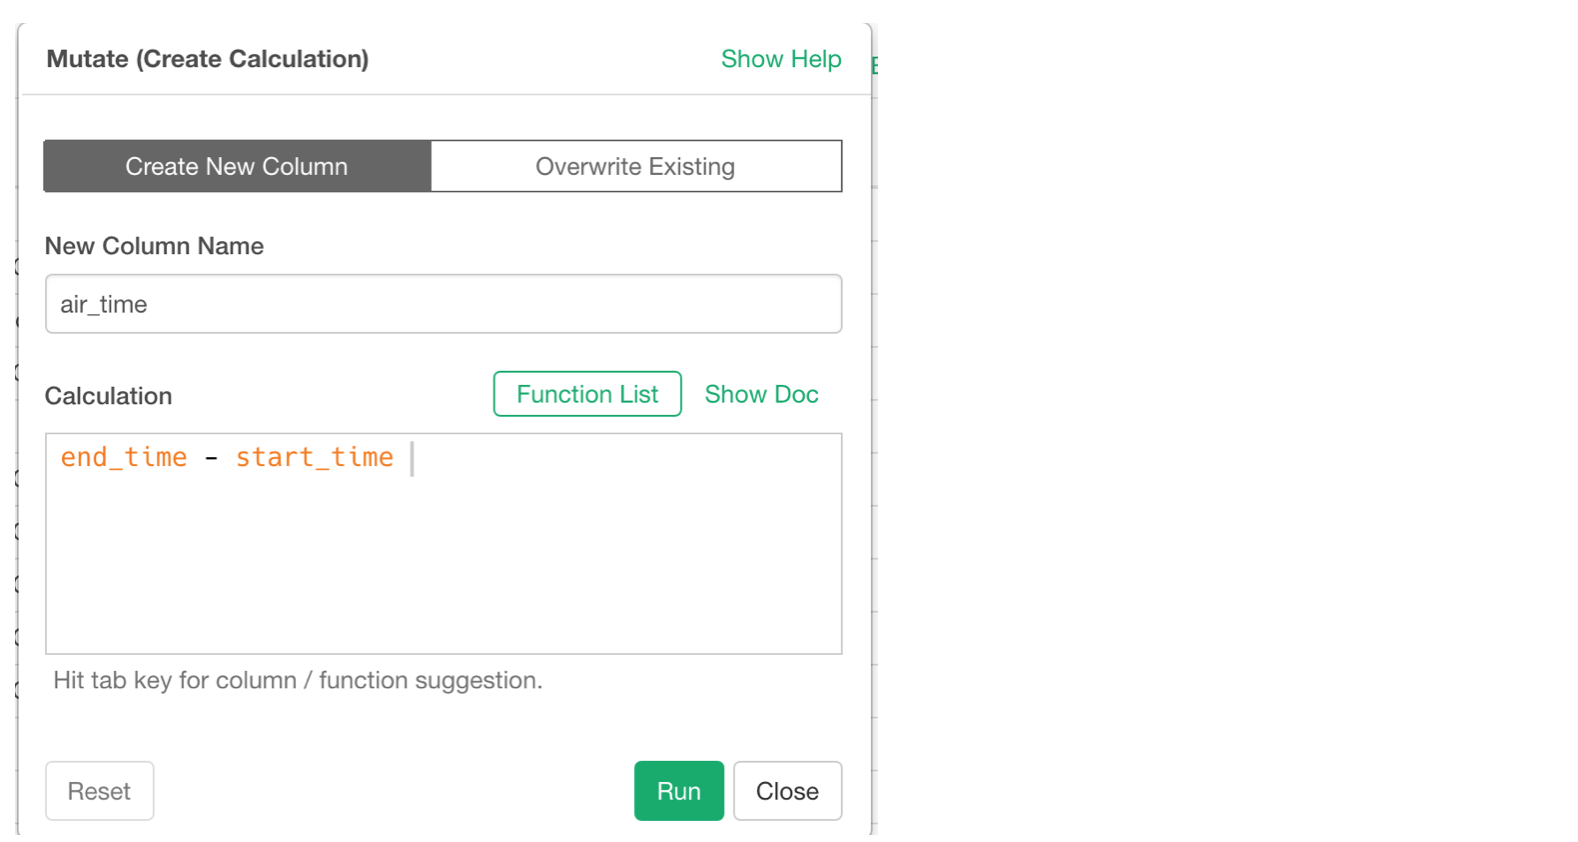
We can simply use ‘-’ to subtract ‘start_time’ from ‘end_time’ like below.
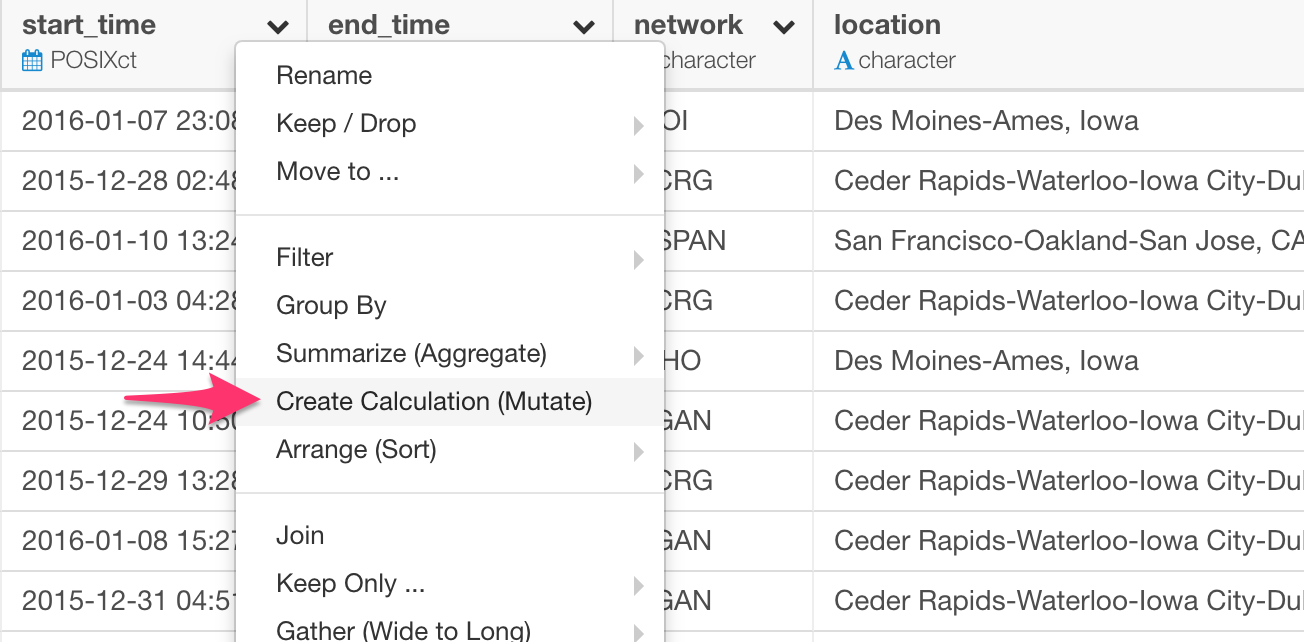
end_time - start_timeAnd we can use ‘Mutate (Create Calculation)’ step for creating the calculation.
Select ’Create Calculation (Mutate) from the column header menu.
And type the calculation and click ‘Run’ button.
This will create a new column as ‘difftime’ data type, which is a special data type in R that holds the date/time duration information.
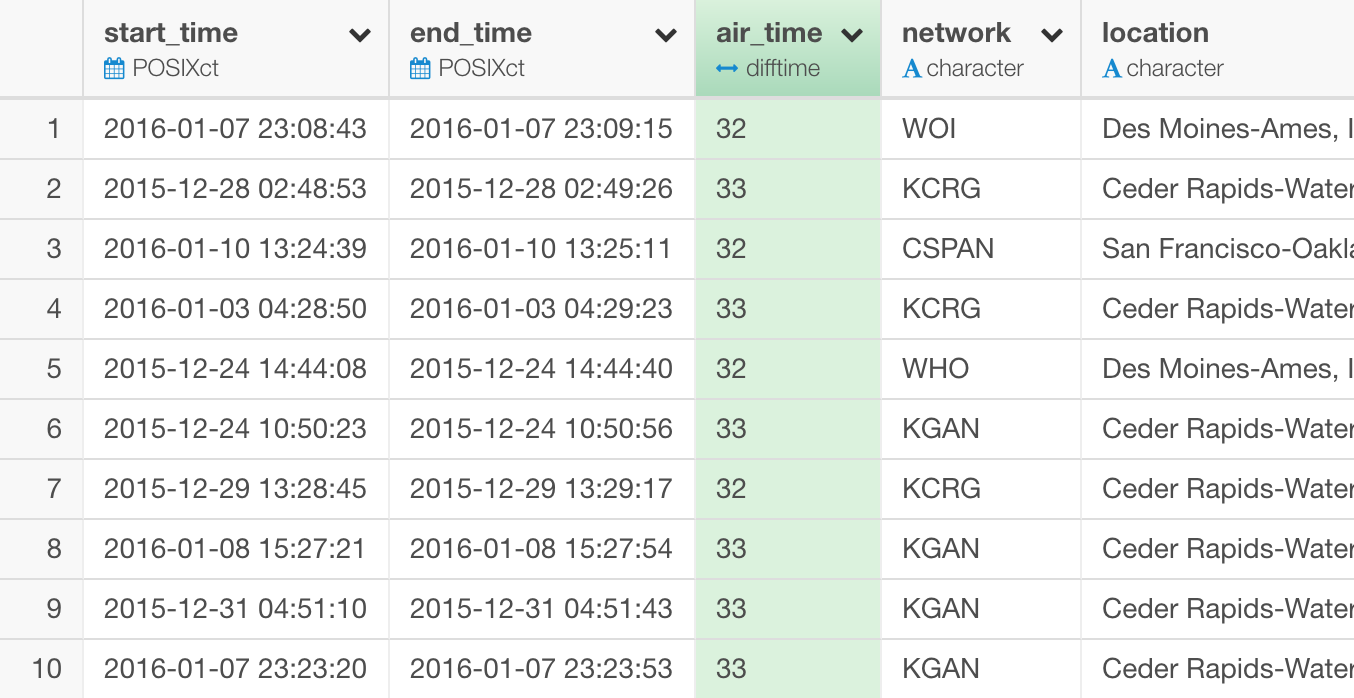
The unit is seconds for the calculations with POSIXct data type. If the original data type was Date it would be days.
Convert from Difftime to Numeric
In most cases though, we want to see the values presented as Numeric data type, which makes all the calculations easier later.
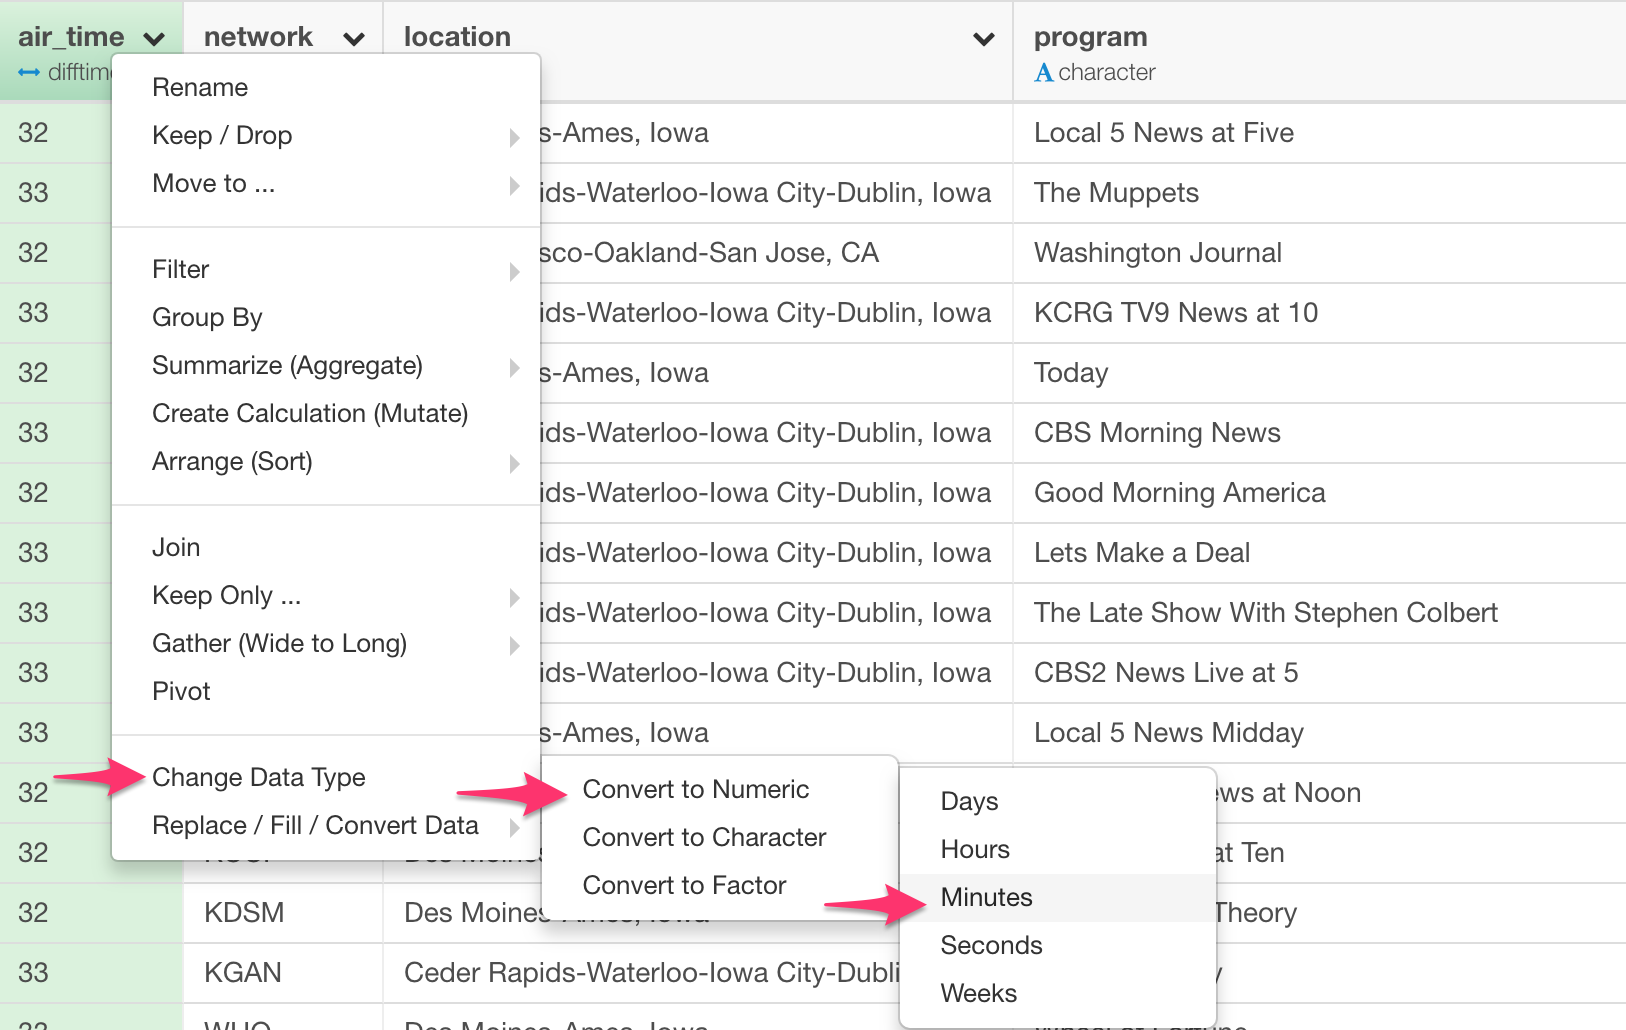
Let’s say we want to convert it to Numeric data type and have the numerical values to be in minutes.
Select ‘Change Data Type’ -> ‘Convert to Numeric’ -> ‘Minutes’.
This will populate as.numeric function like the below.
as.numeric(end_time - start_time, units="mins")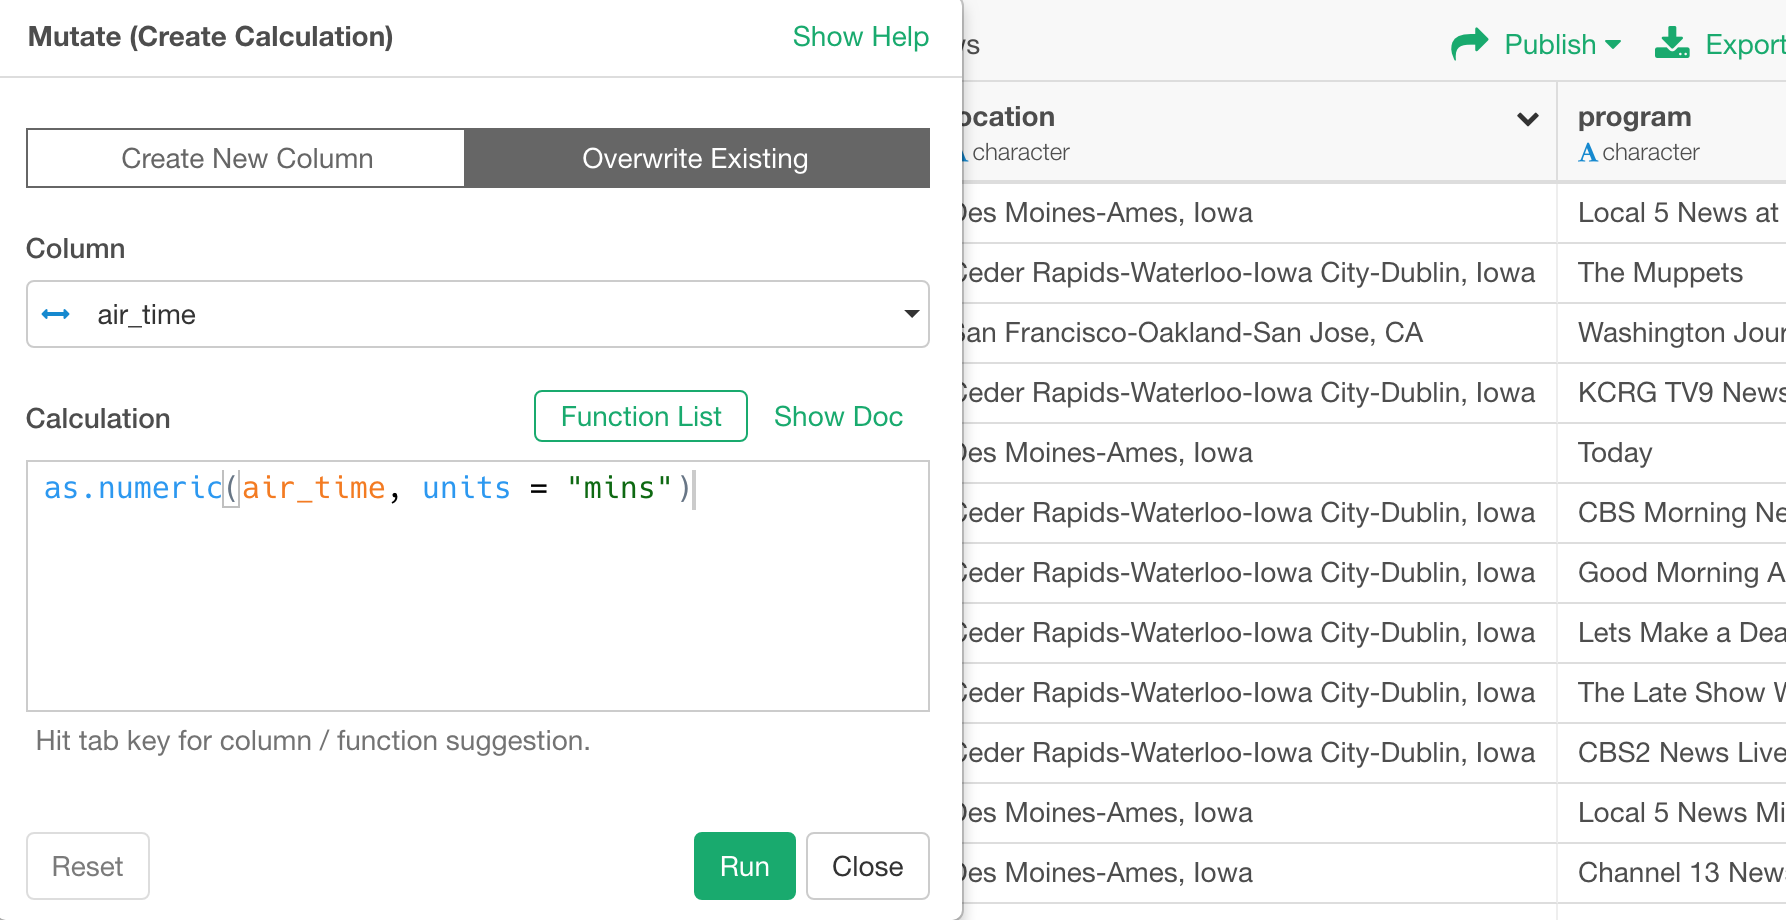
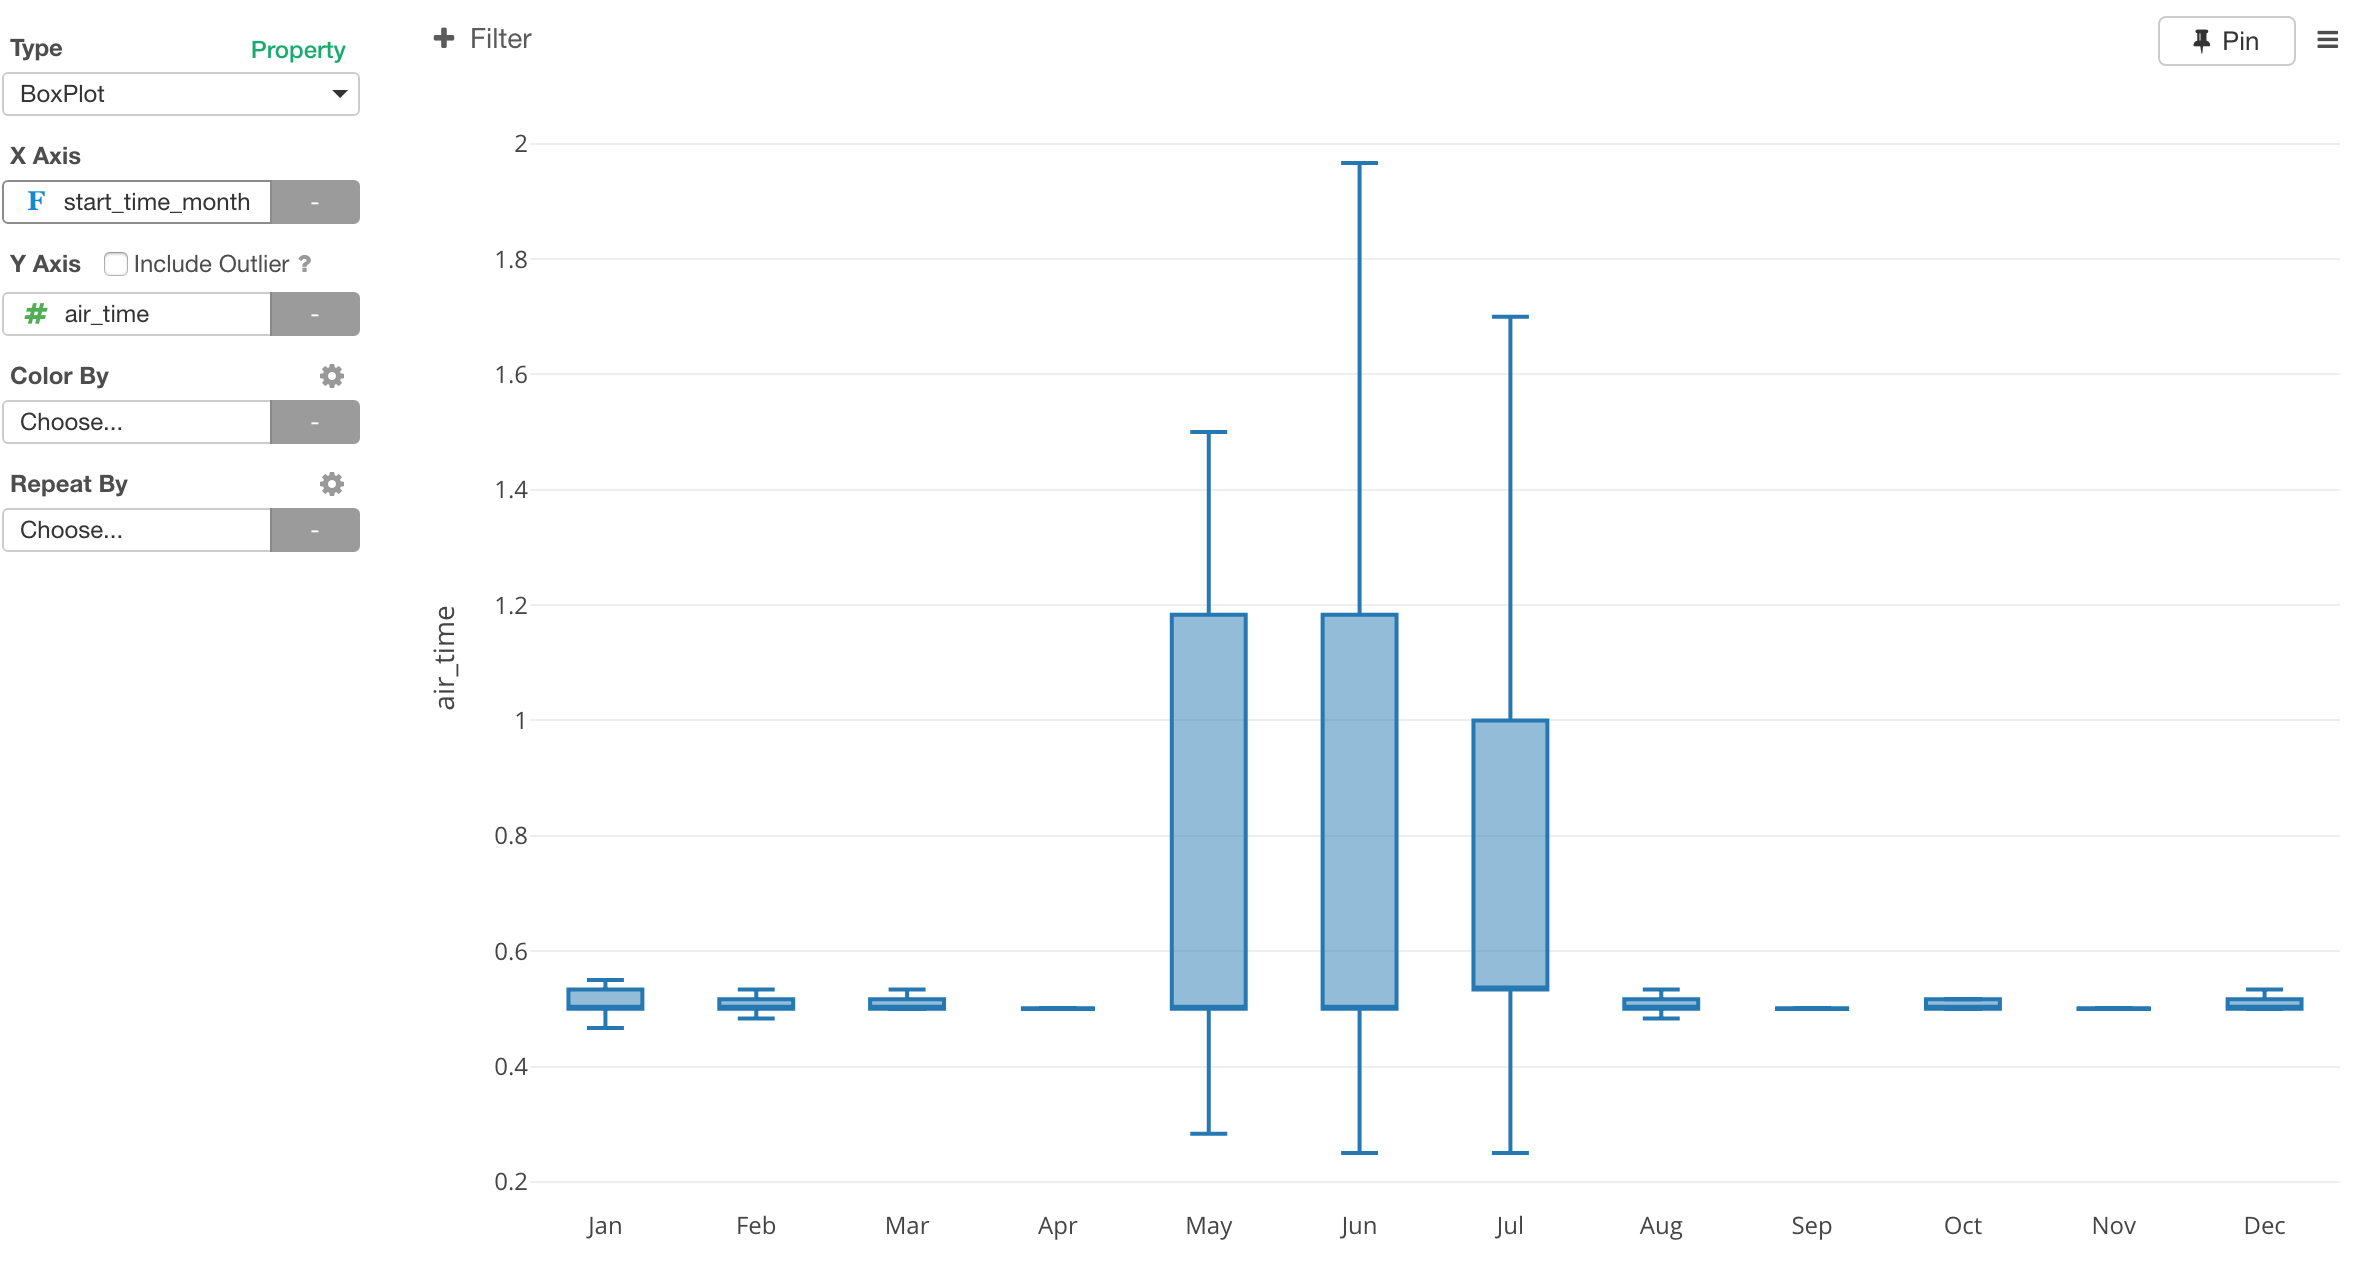
Clicking the ‘Run’ button will create a new column as Numeric data type.
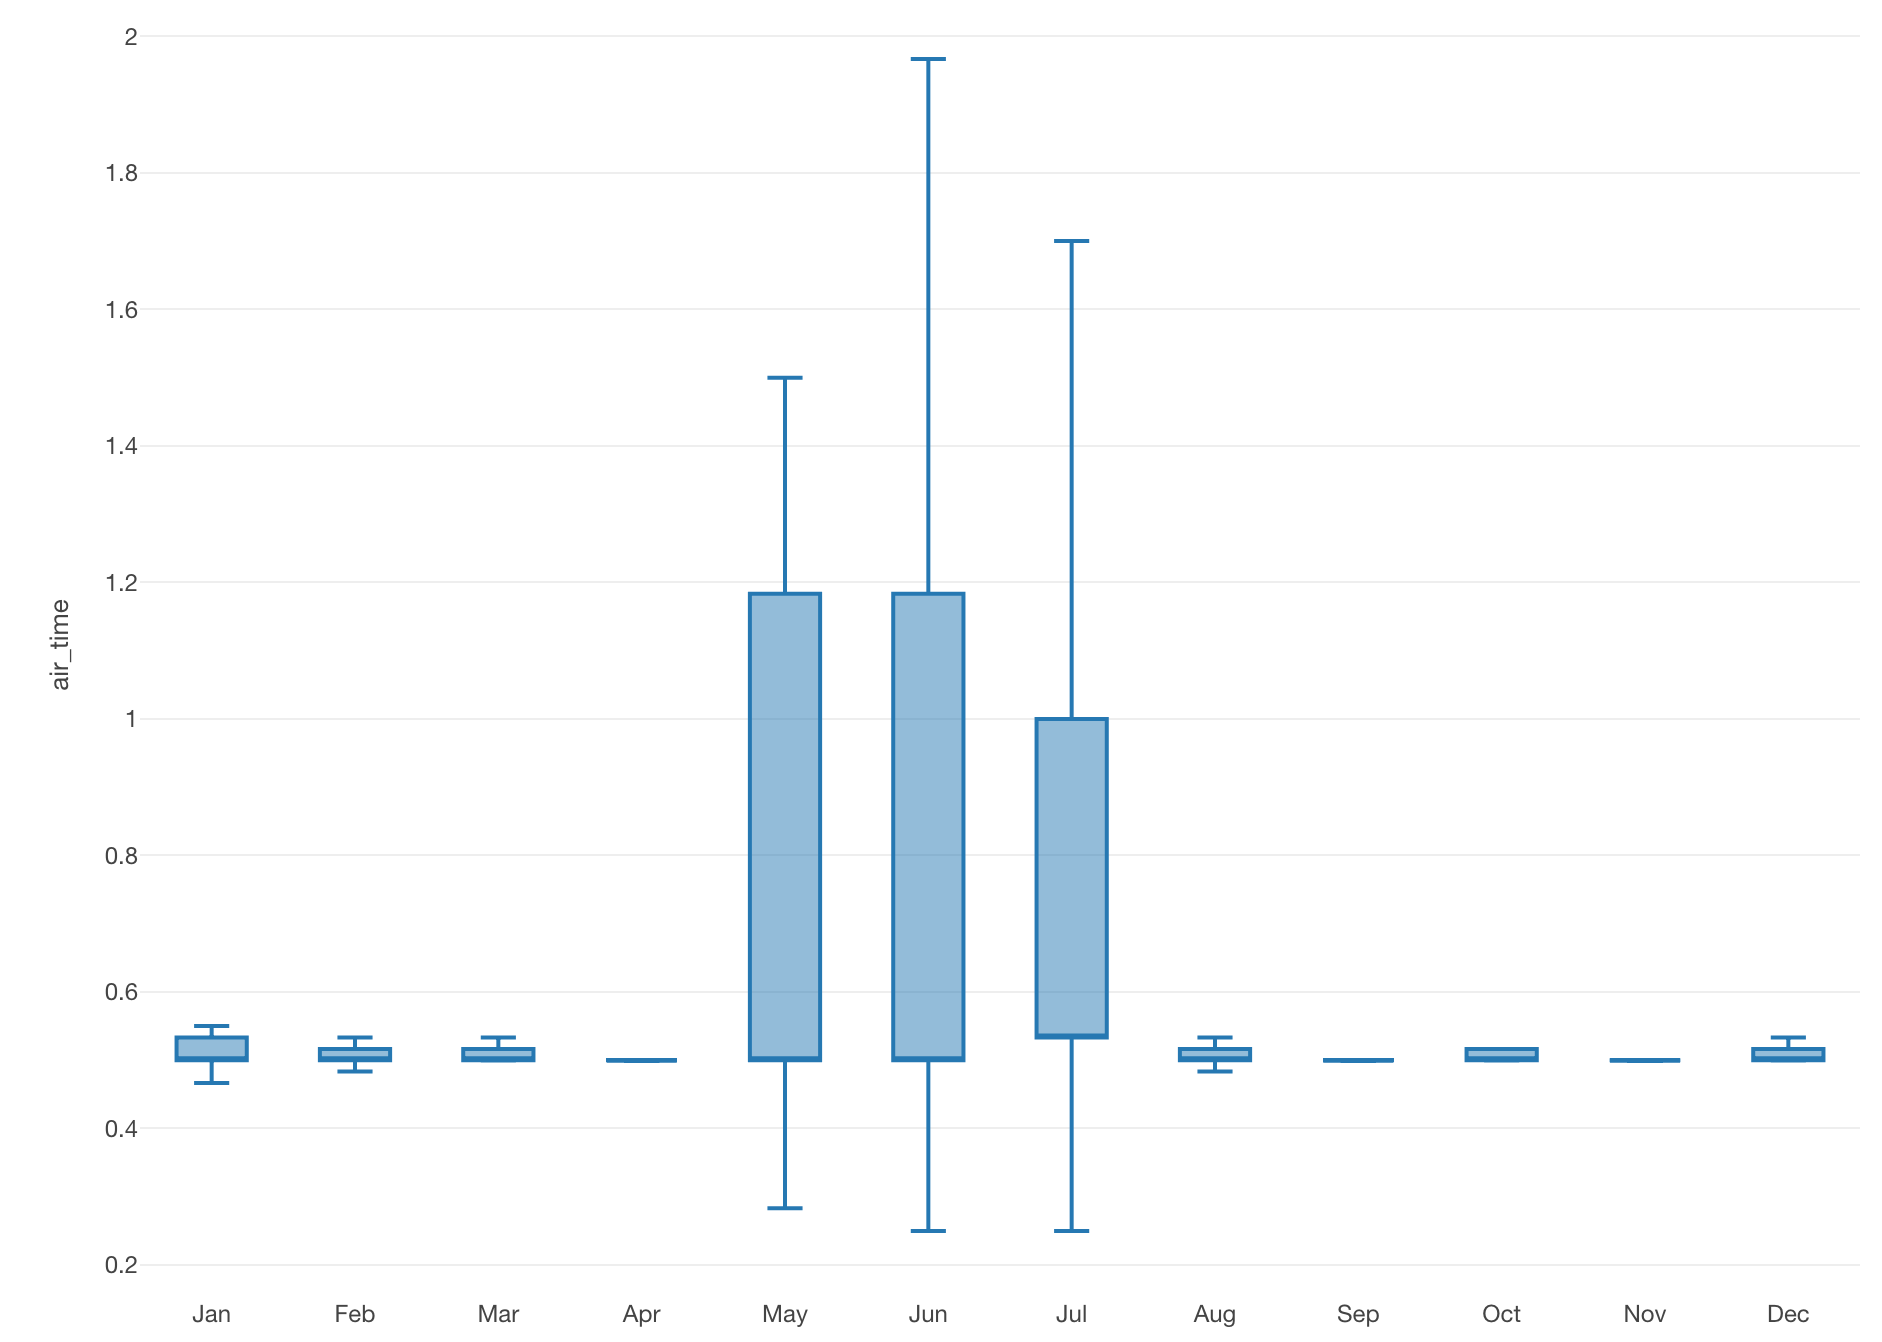
We can visualize this data to see which months were running longer or shorter TV commercials.
Sample Data
This data was originally hosted at Political Ad Archive and I have cleaned up and shared it here. You can download it as either CSV or EDF (Exploratory Data Format) and import it into Exploratory.