How to Compare Current & Previous Year Values in Line Chart?

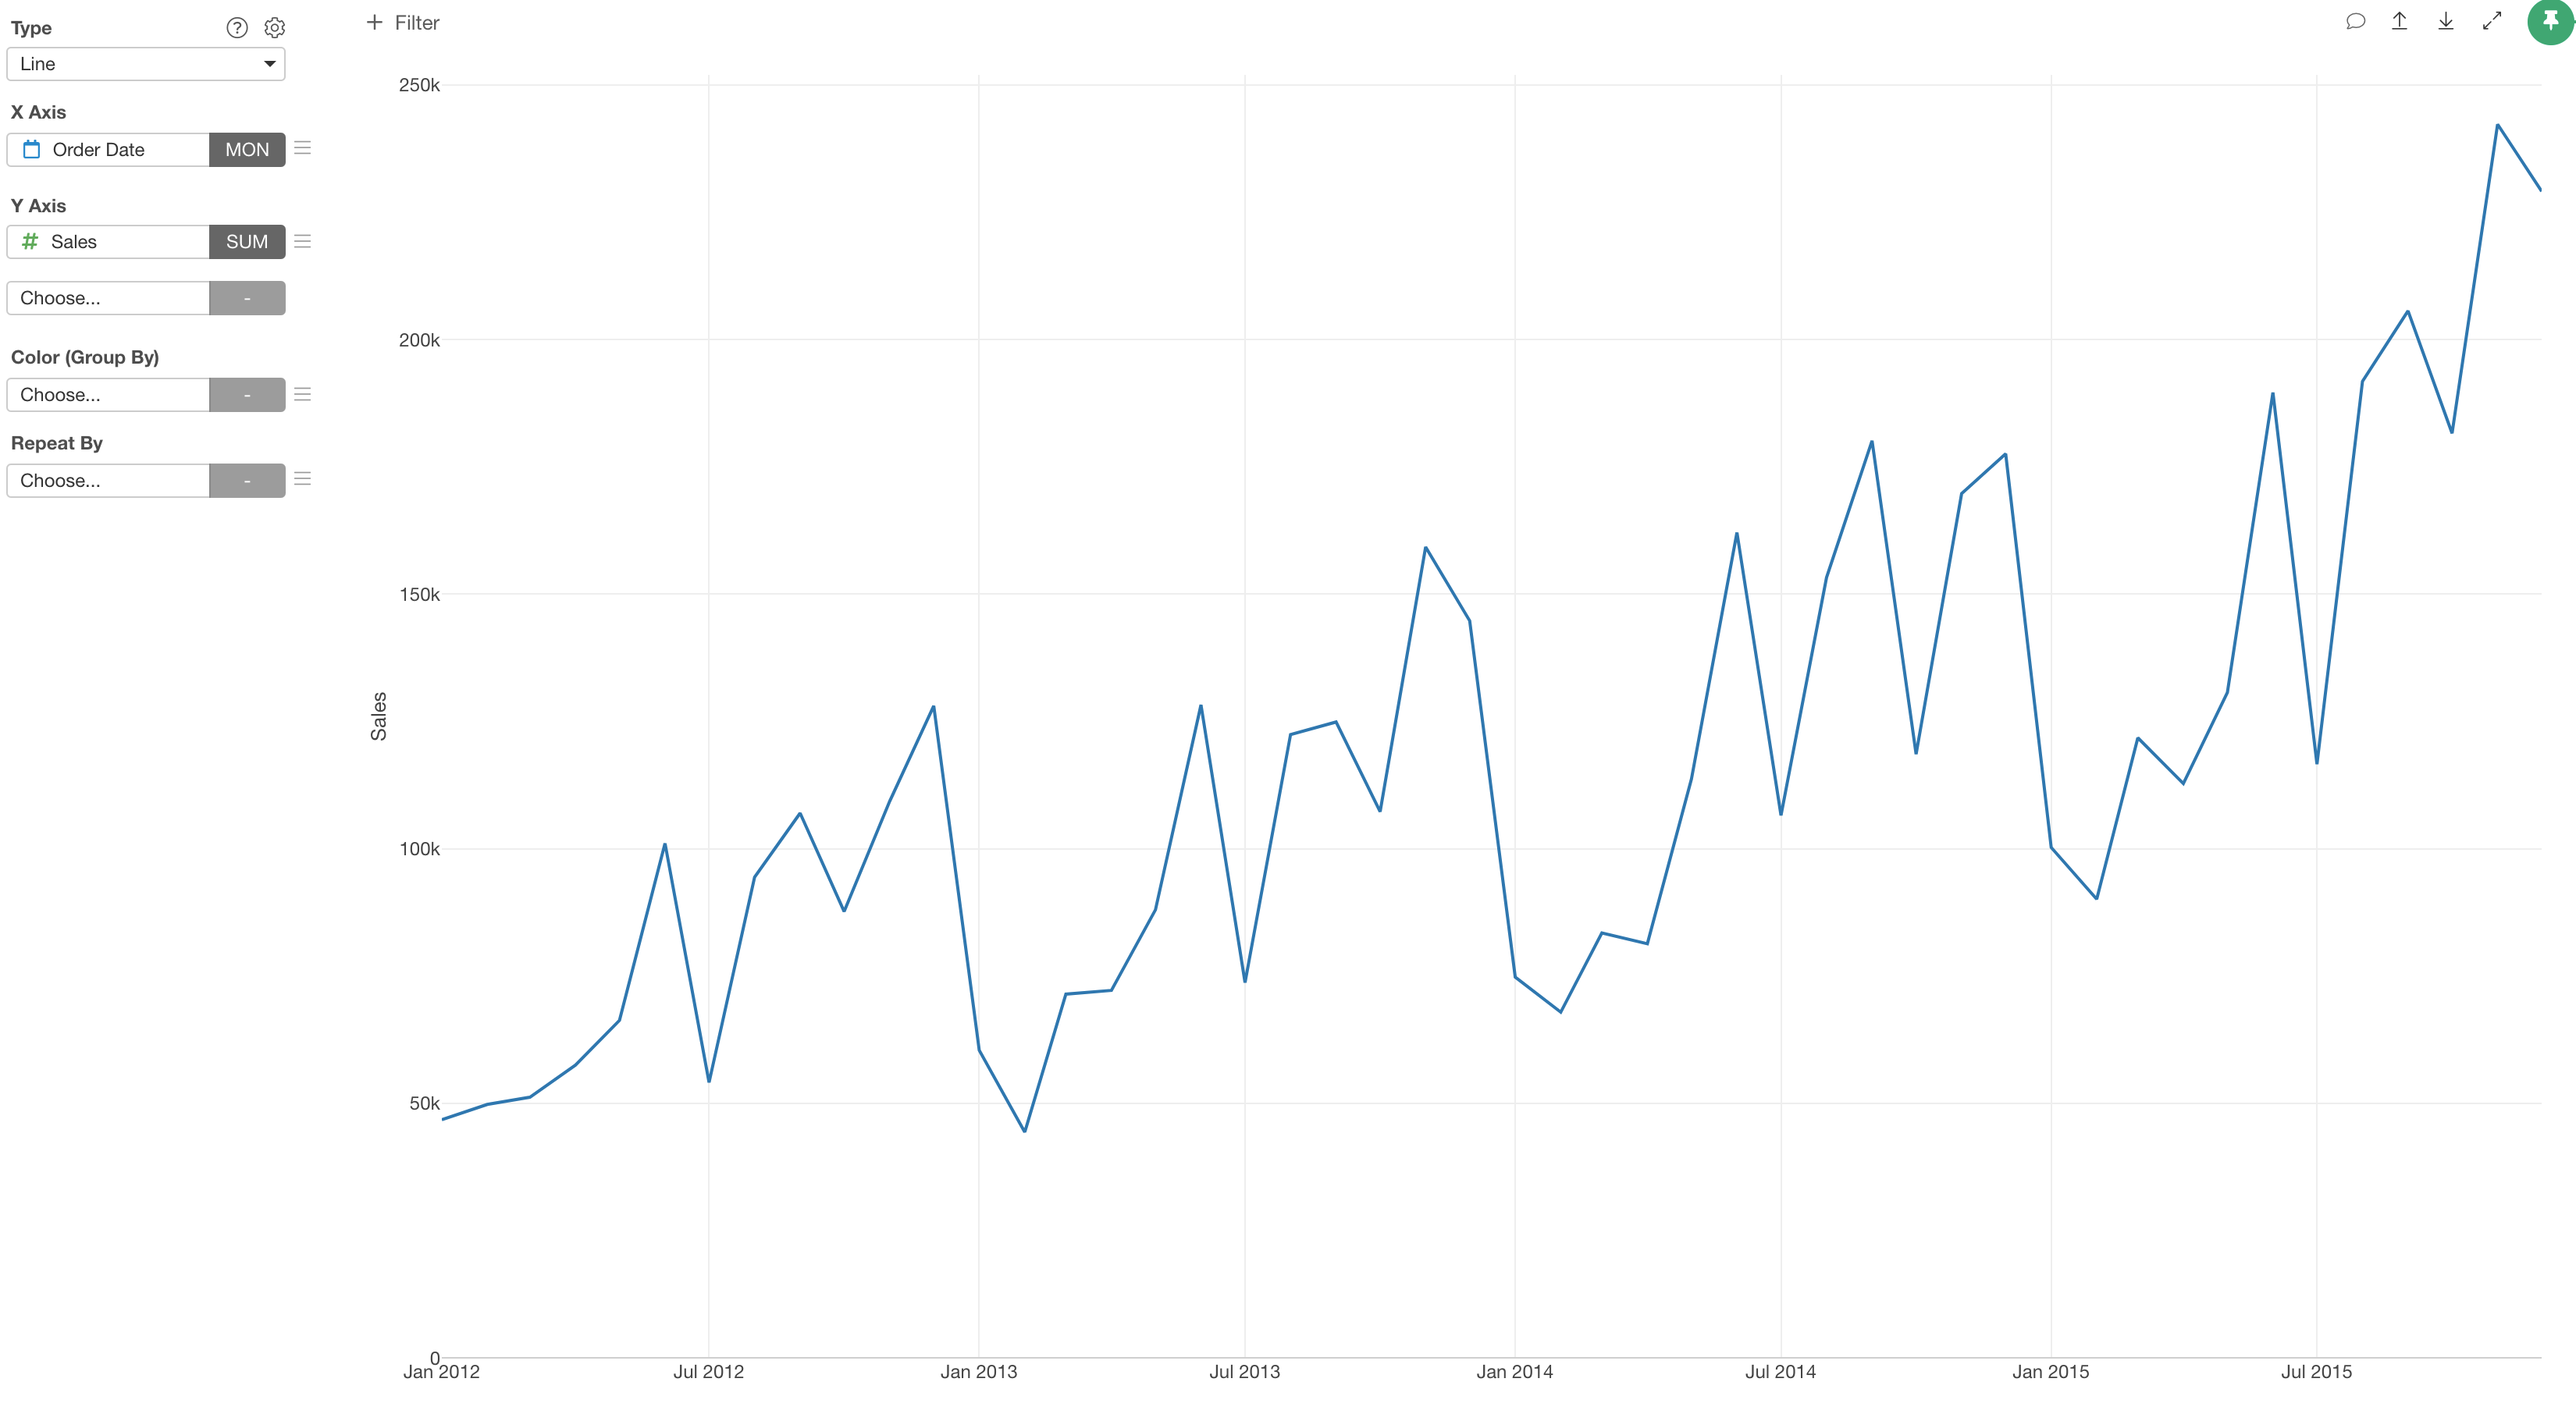
Here is a chart that shows monthly sales values over the years.
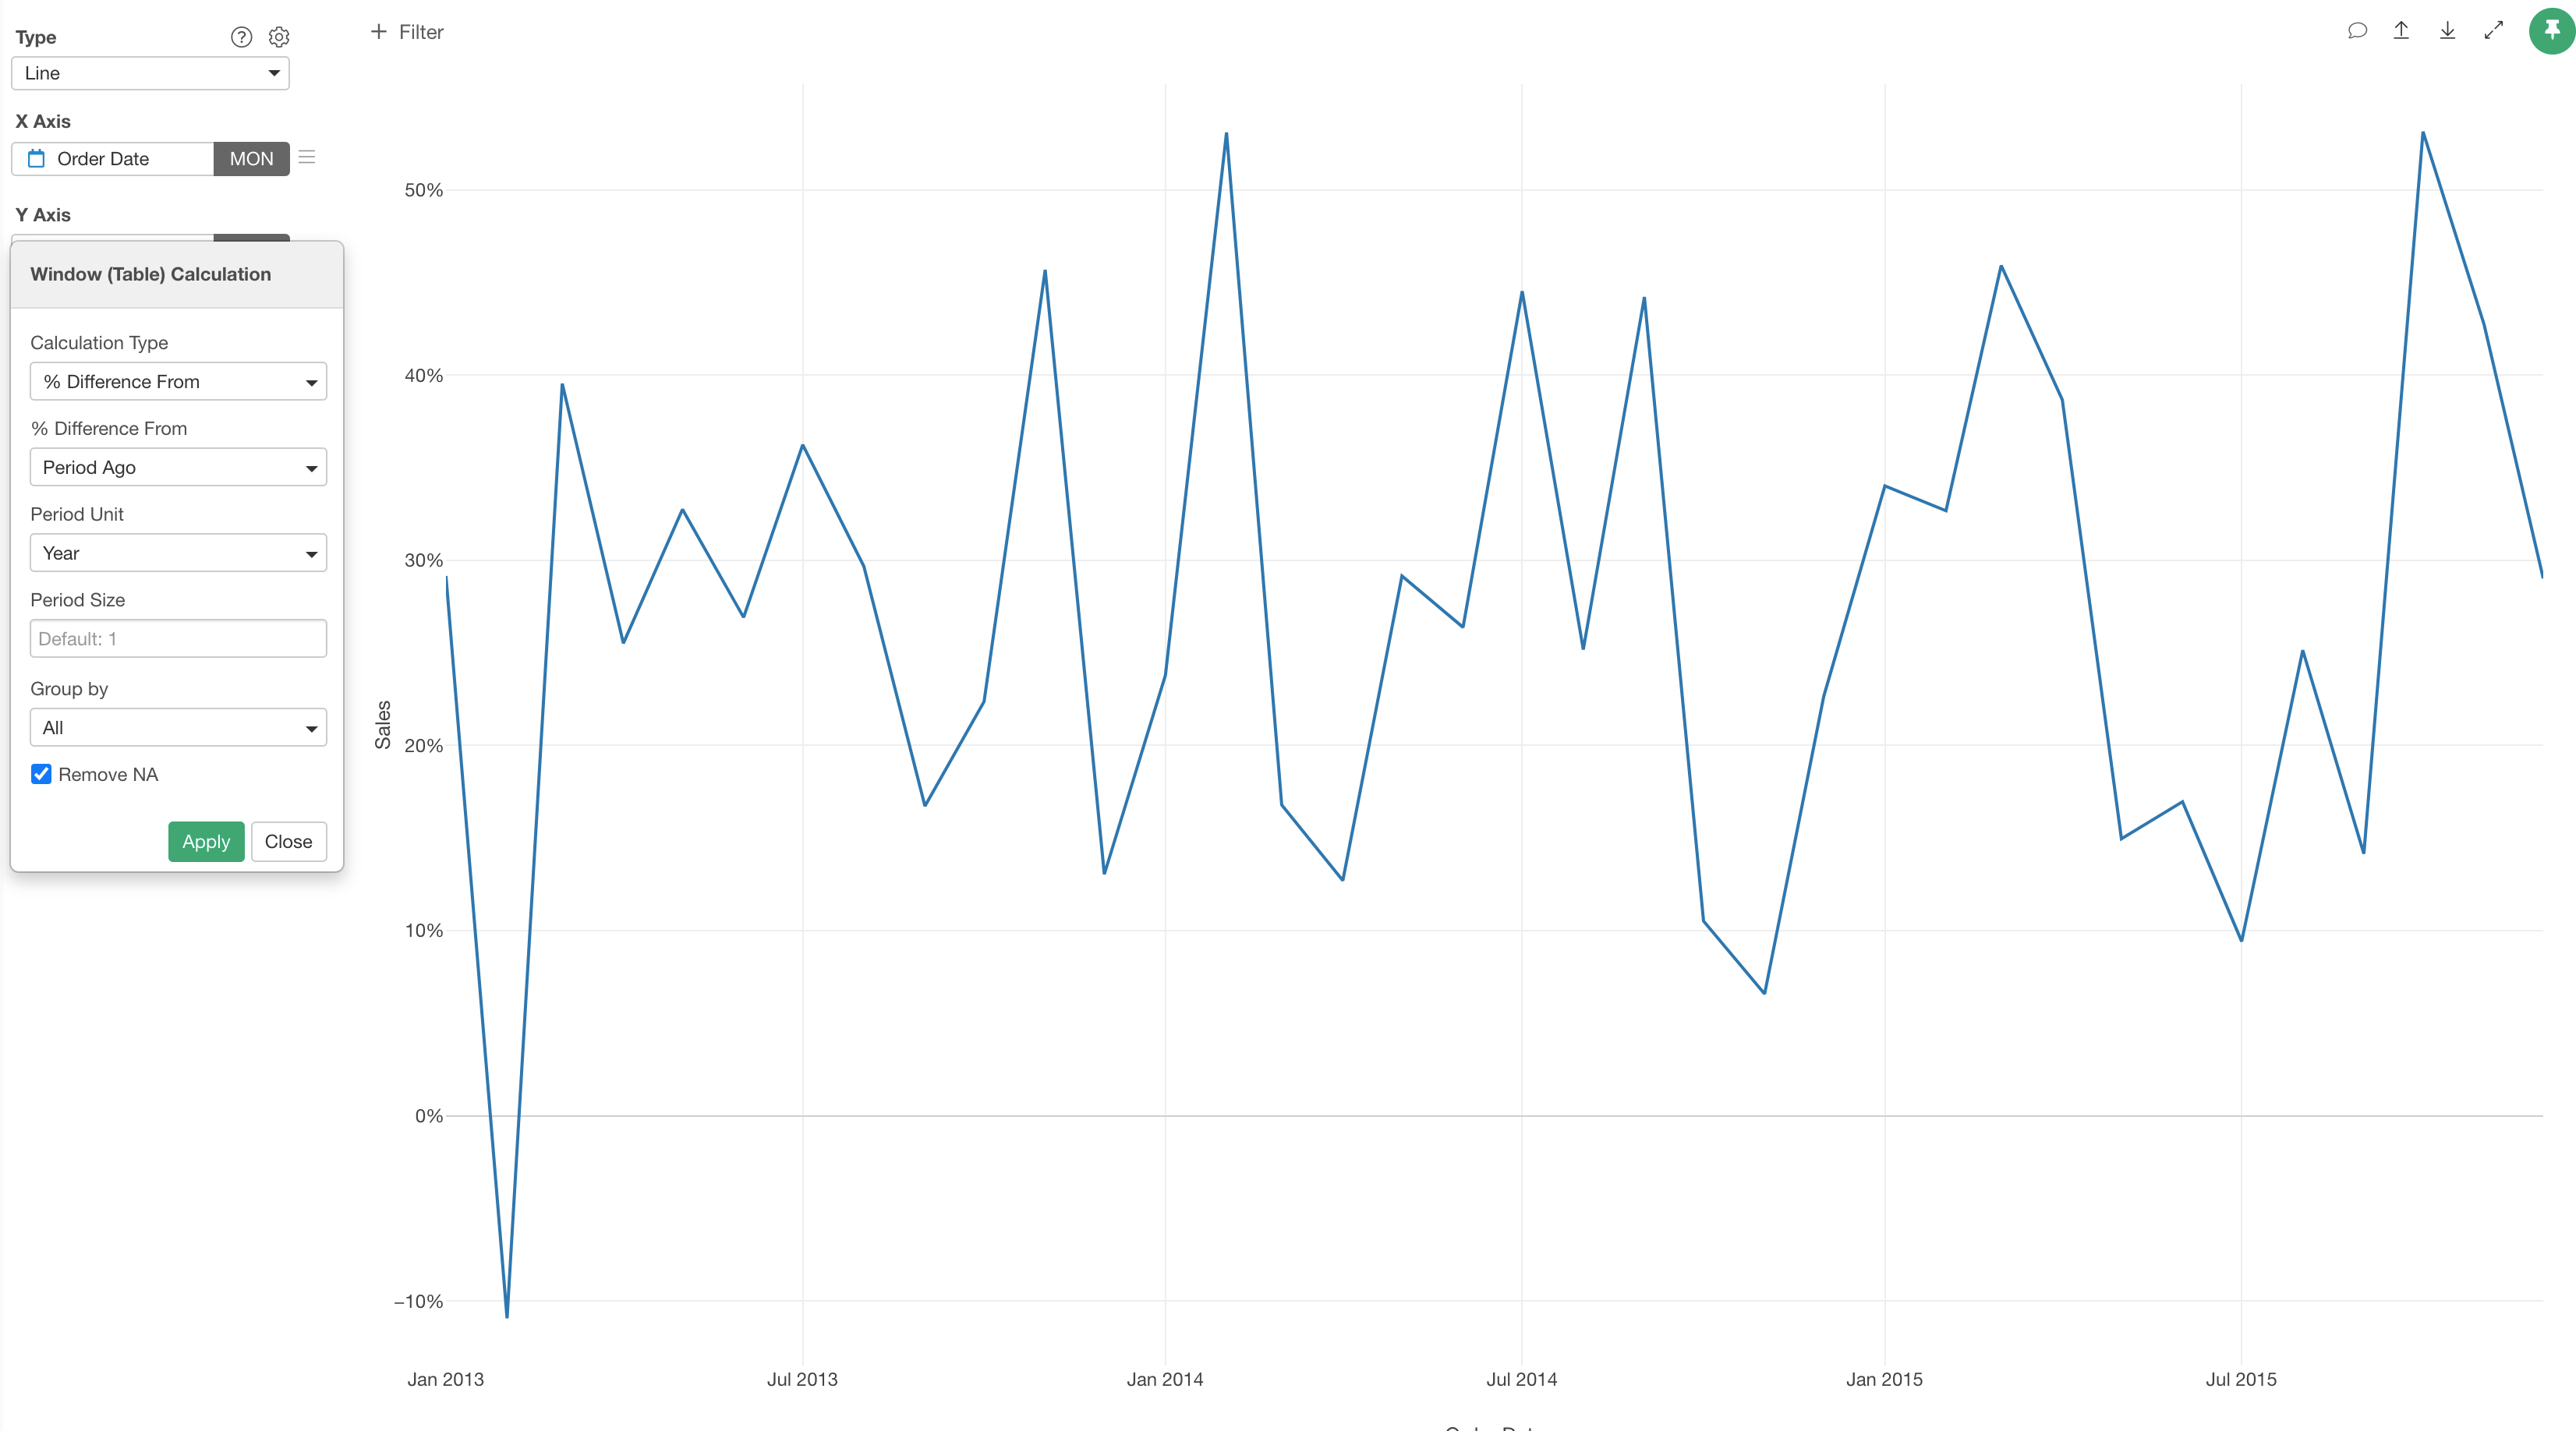
Now, if you want to show how the sales were changed compared to the year before (year over year) then you can use 'Window Calculation' inside the chart.
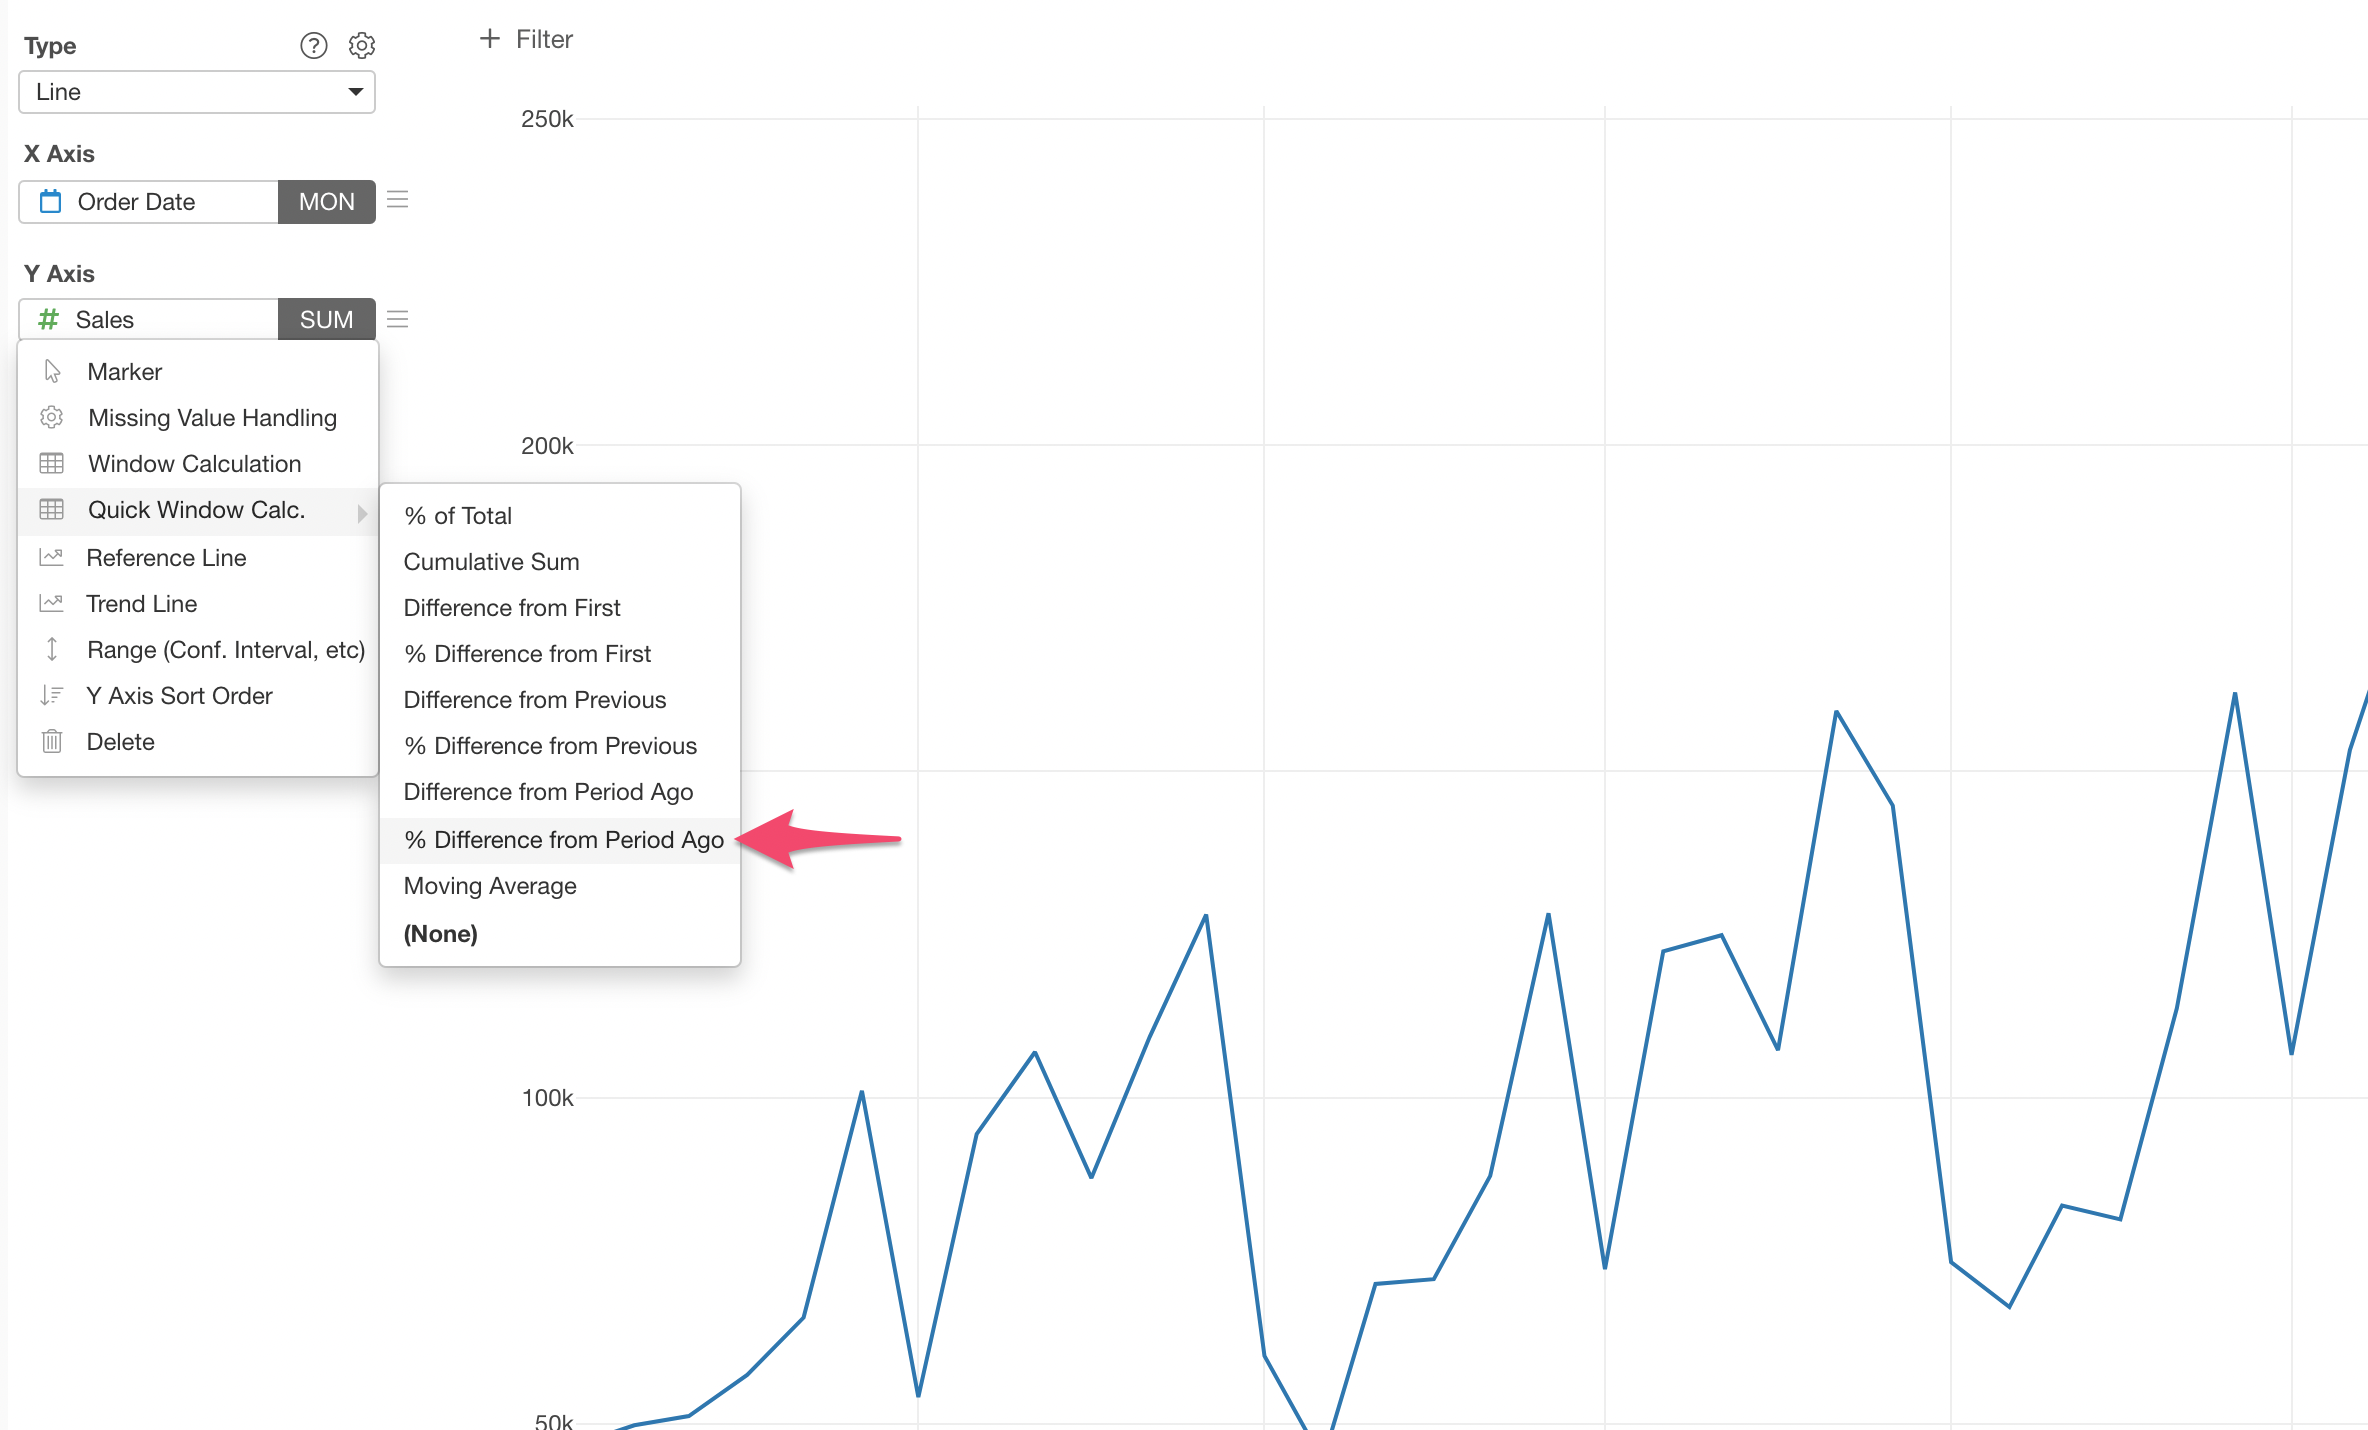
With this feature, you can show the percentage difference from a year ago, a quater ago, a month ago, etc.
Show Previous Period Value Alongside with Current Value
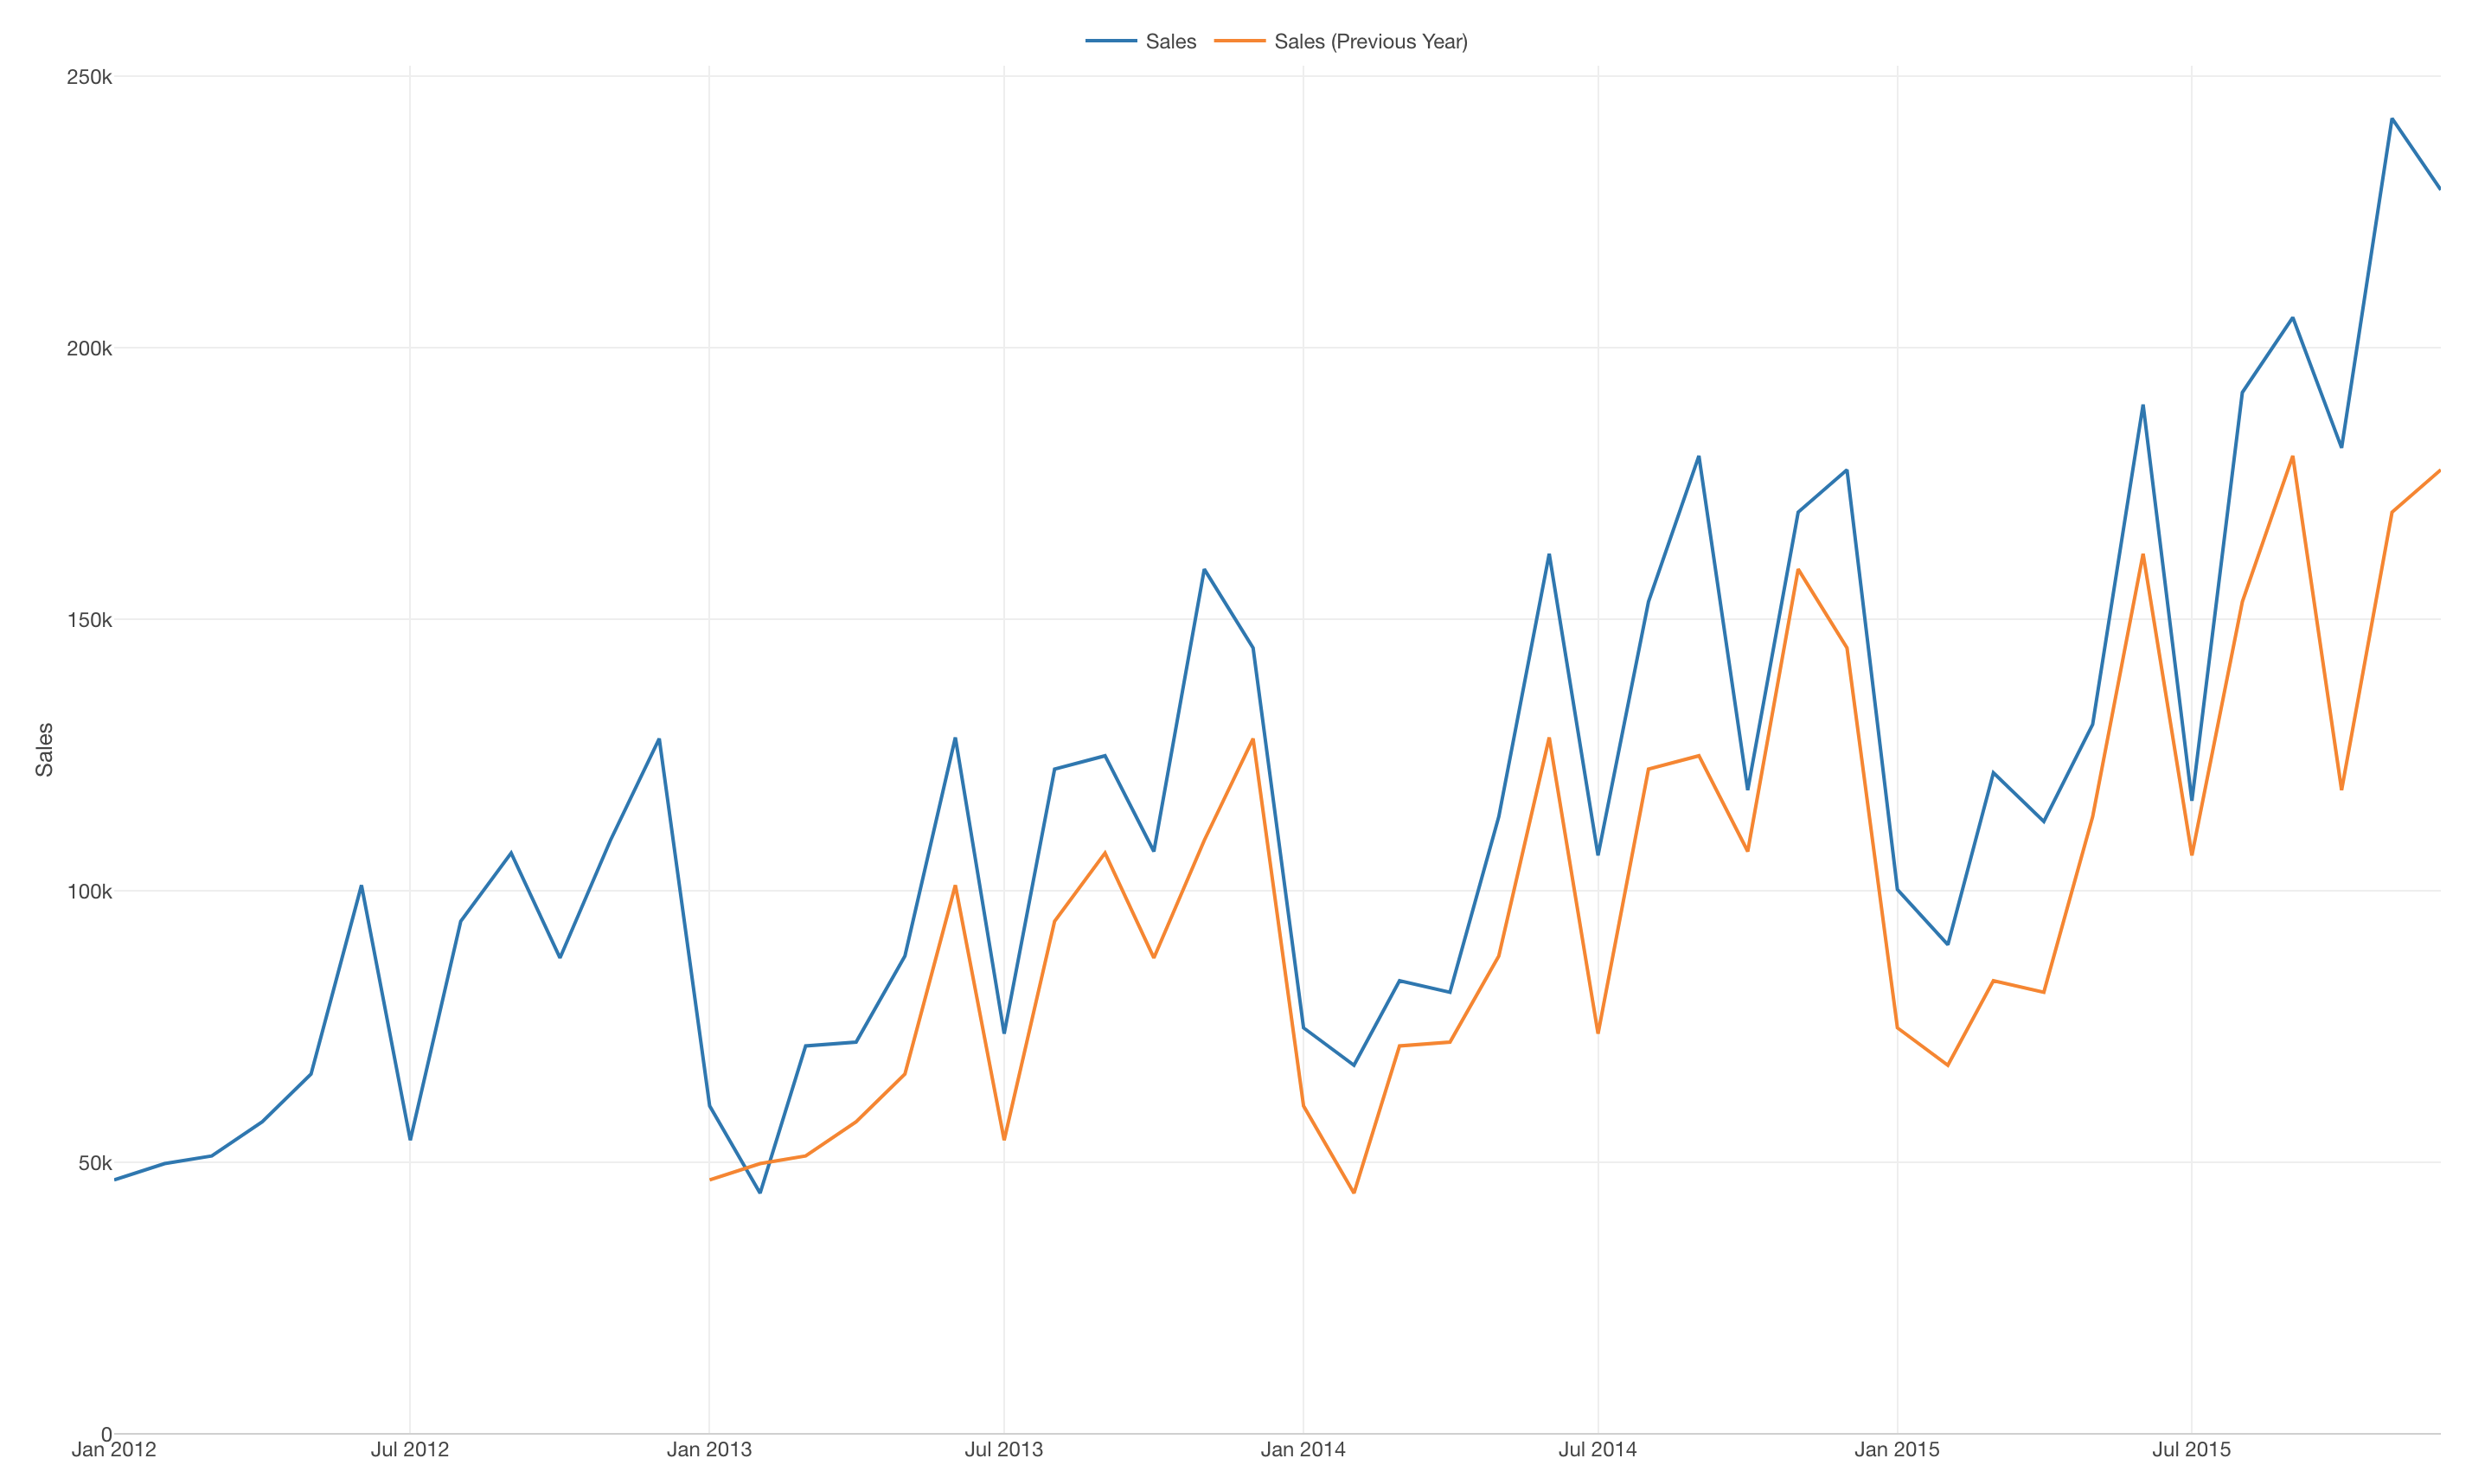
But what if you want to show the previous period (e.g. a year ago) values alongside with the current values?
For this, you need a little bit of Data Wrangling to manually create the data, then you can show the data with the chart.
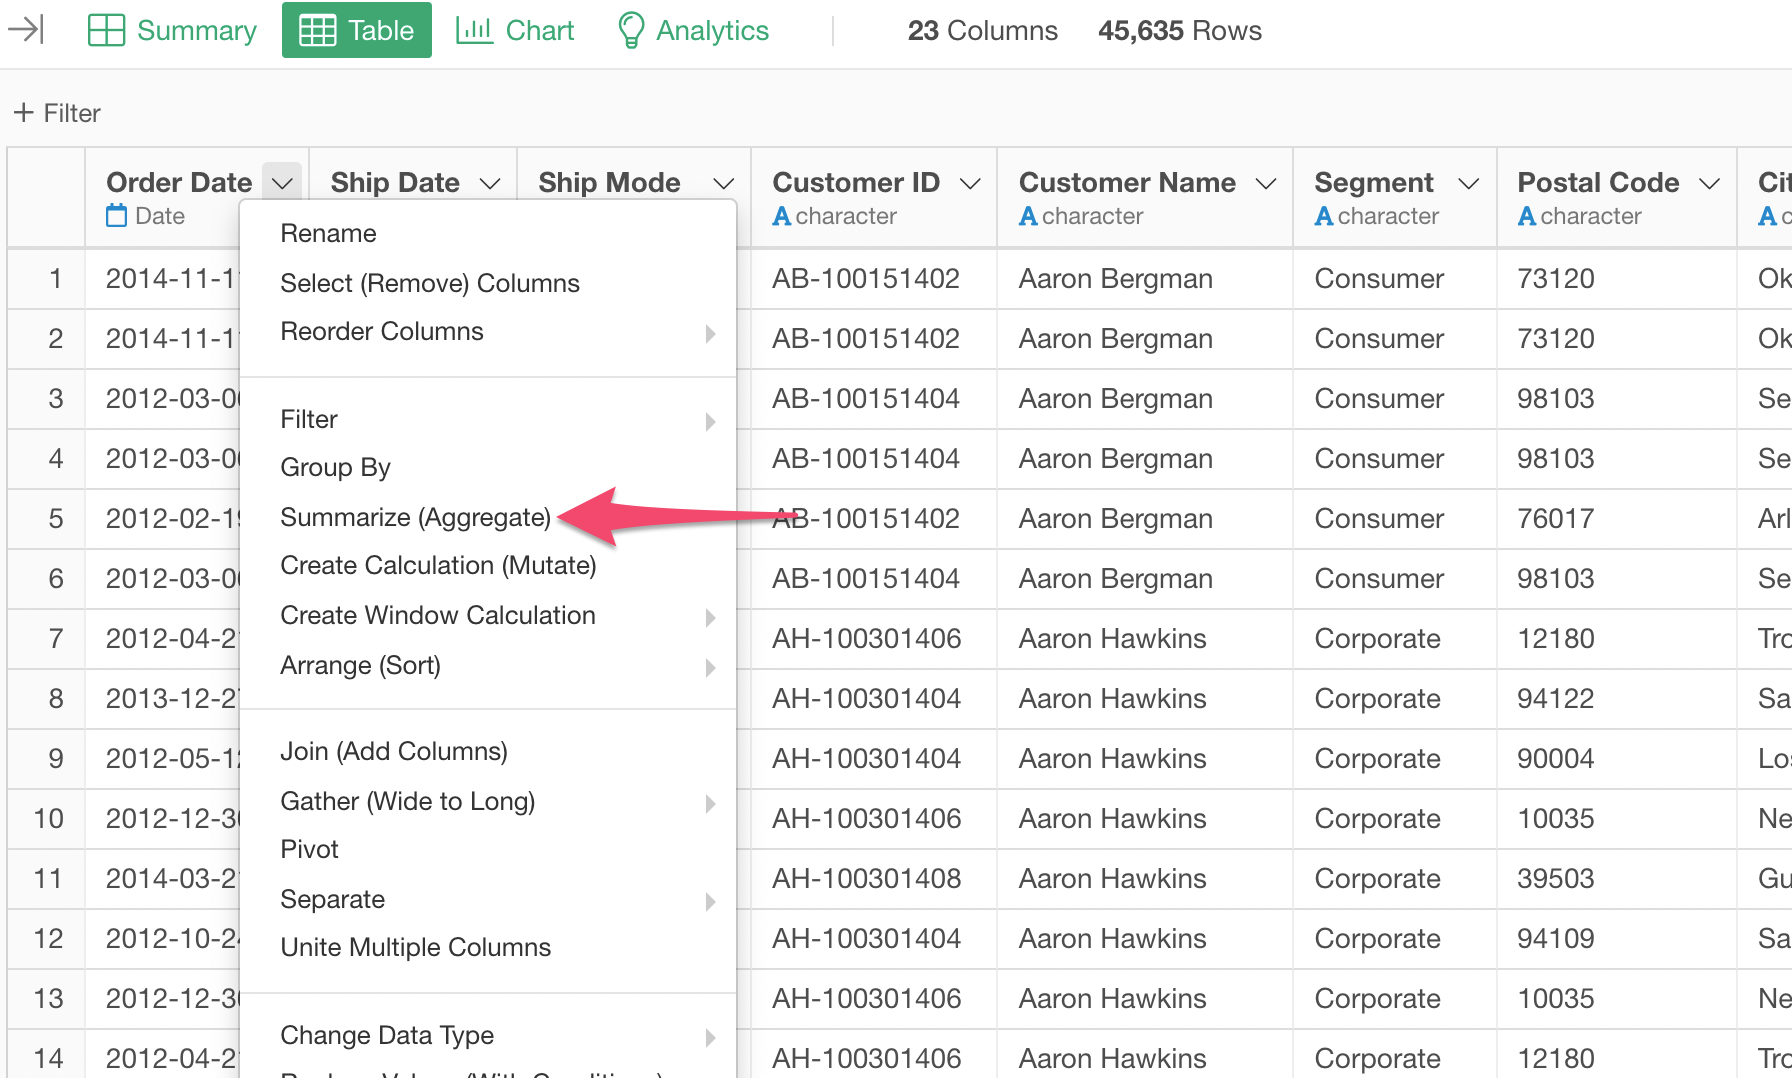
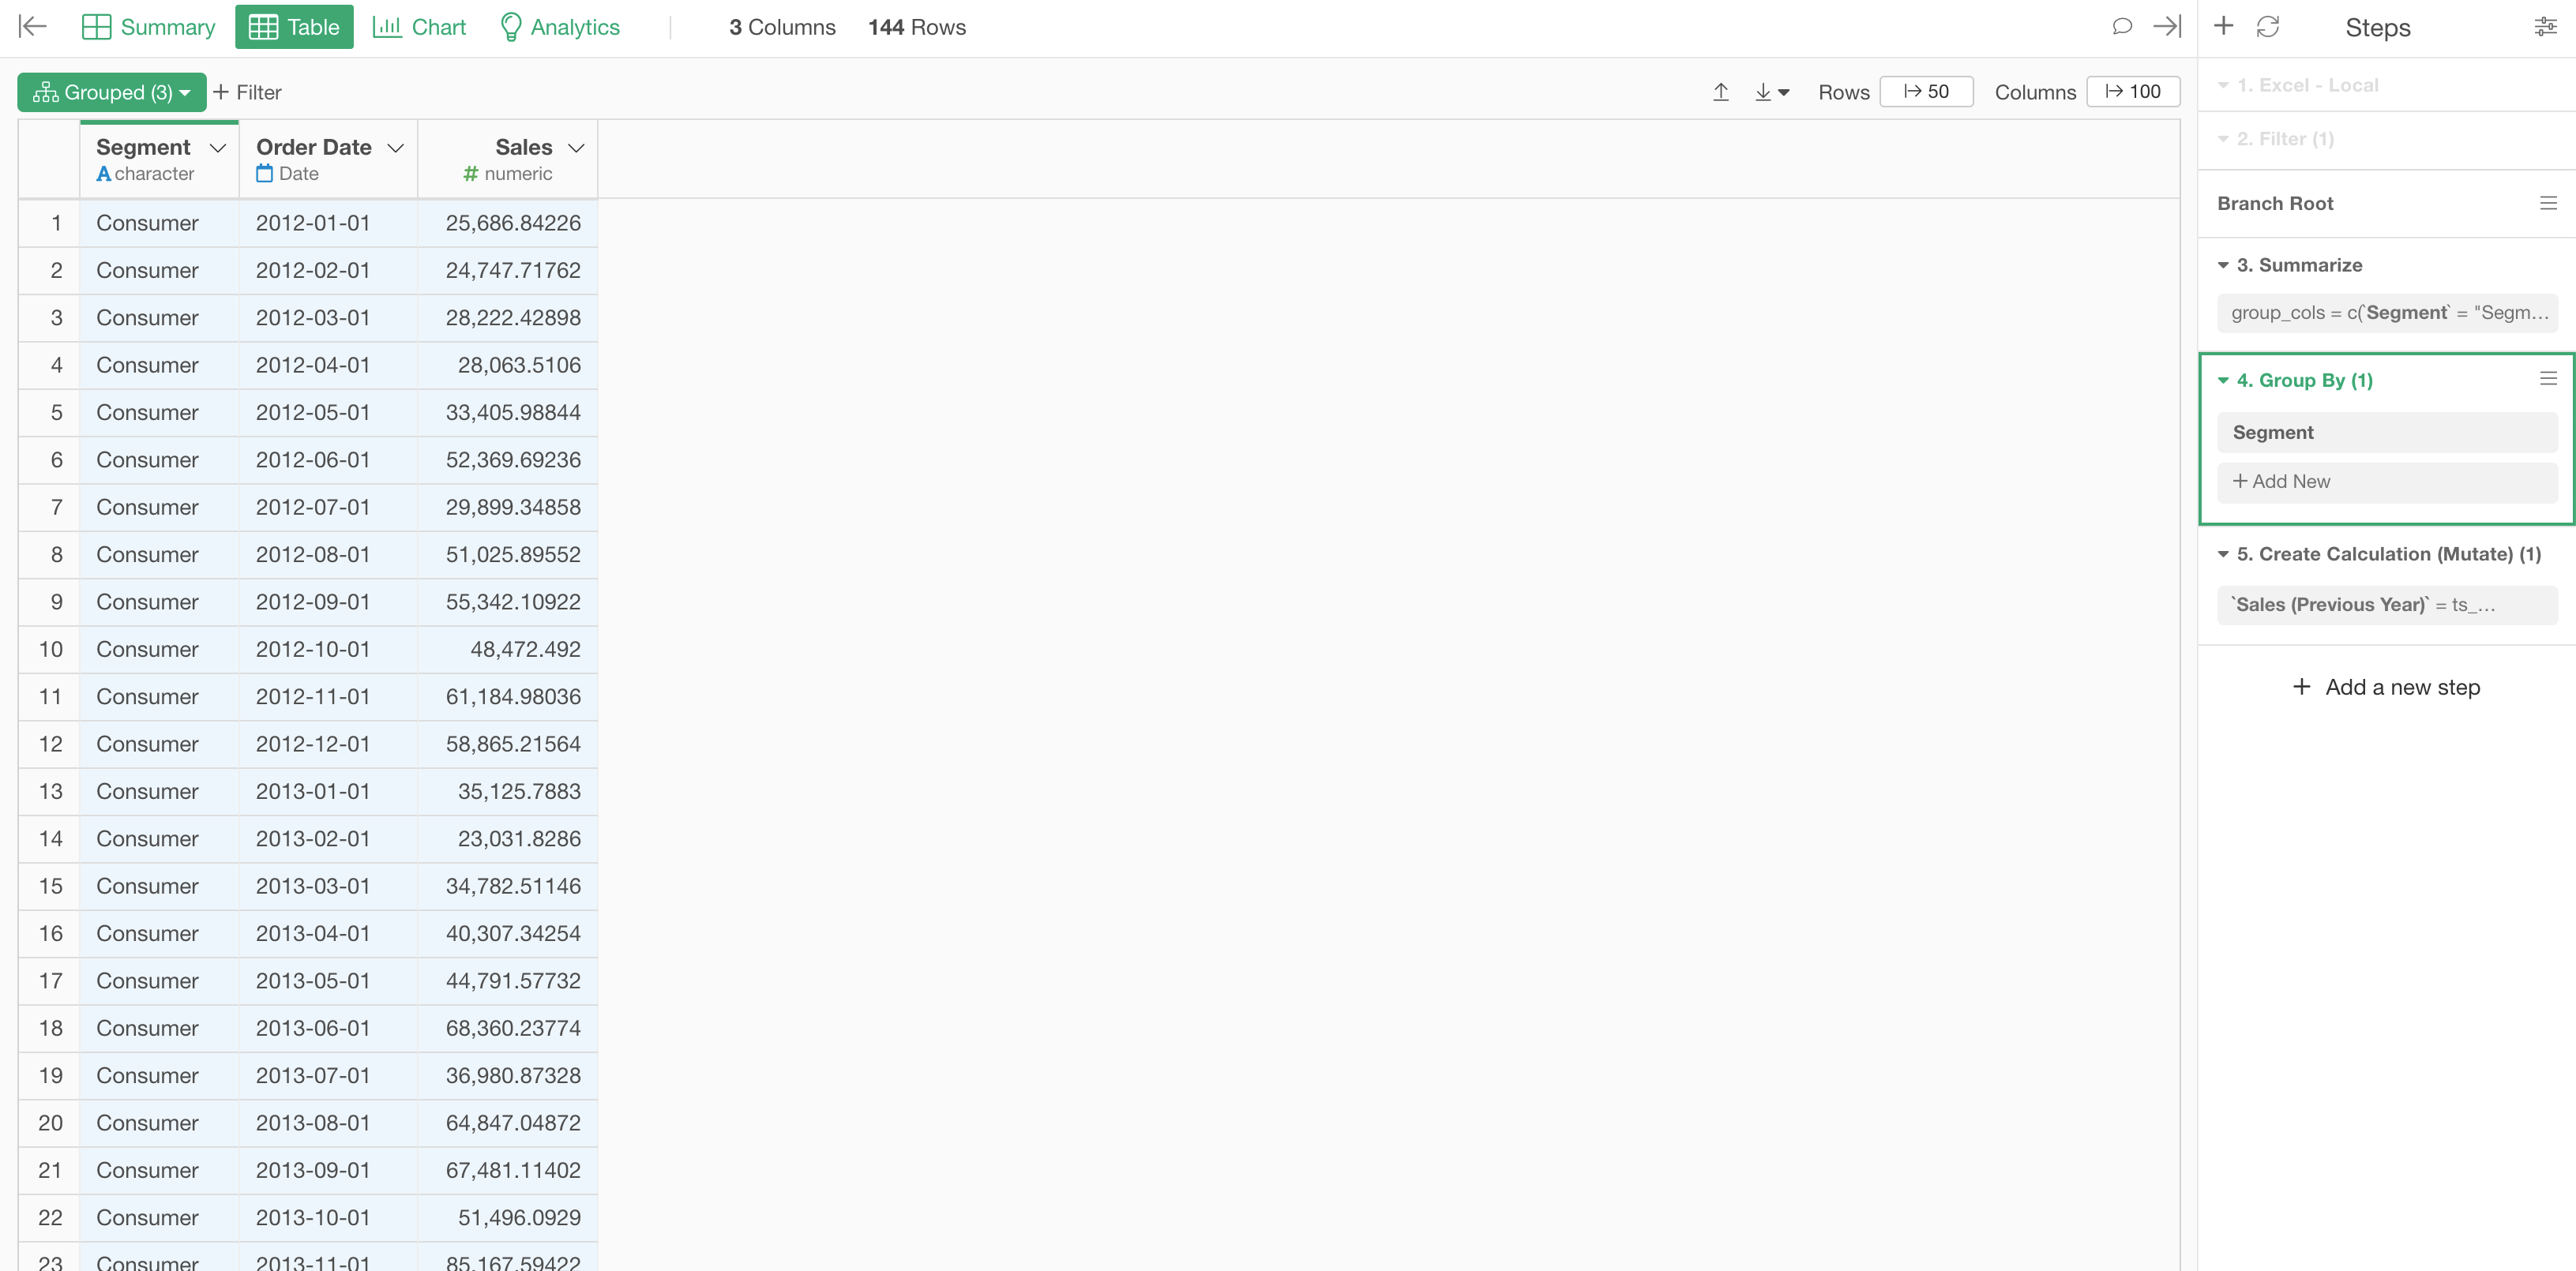
1. Summarize (Aggregate) Data by Month
Here is a sales data, each row represents each order.
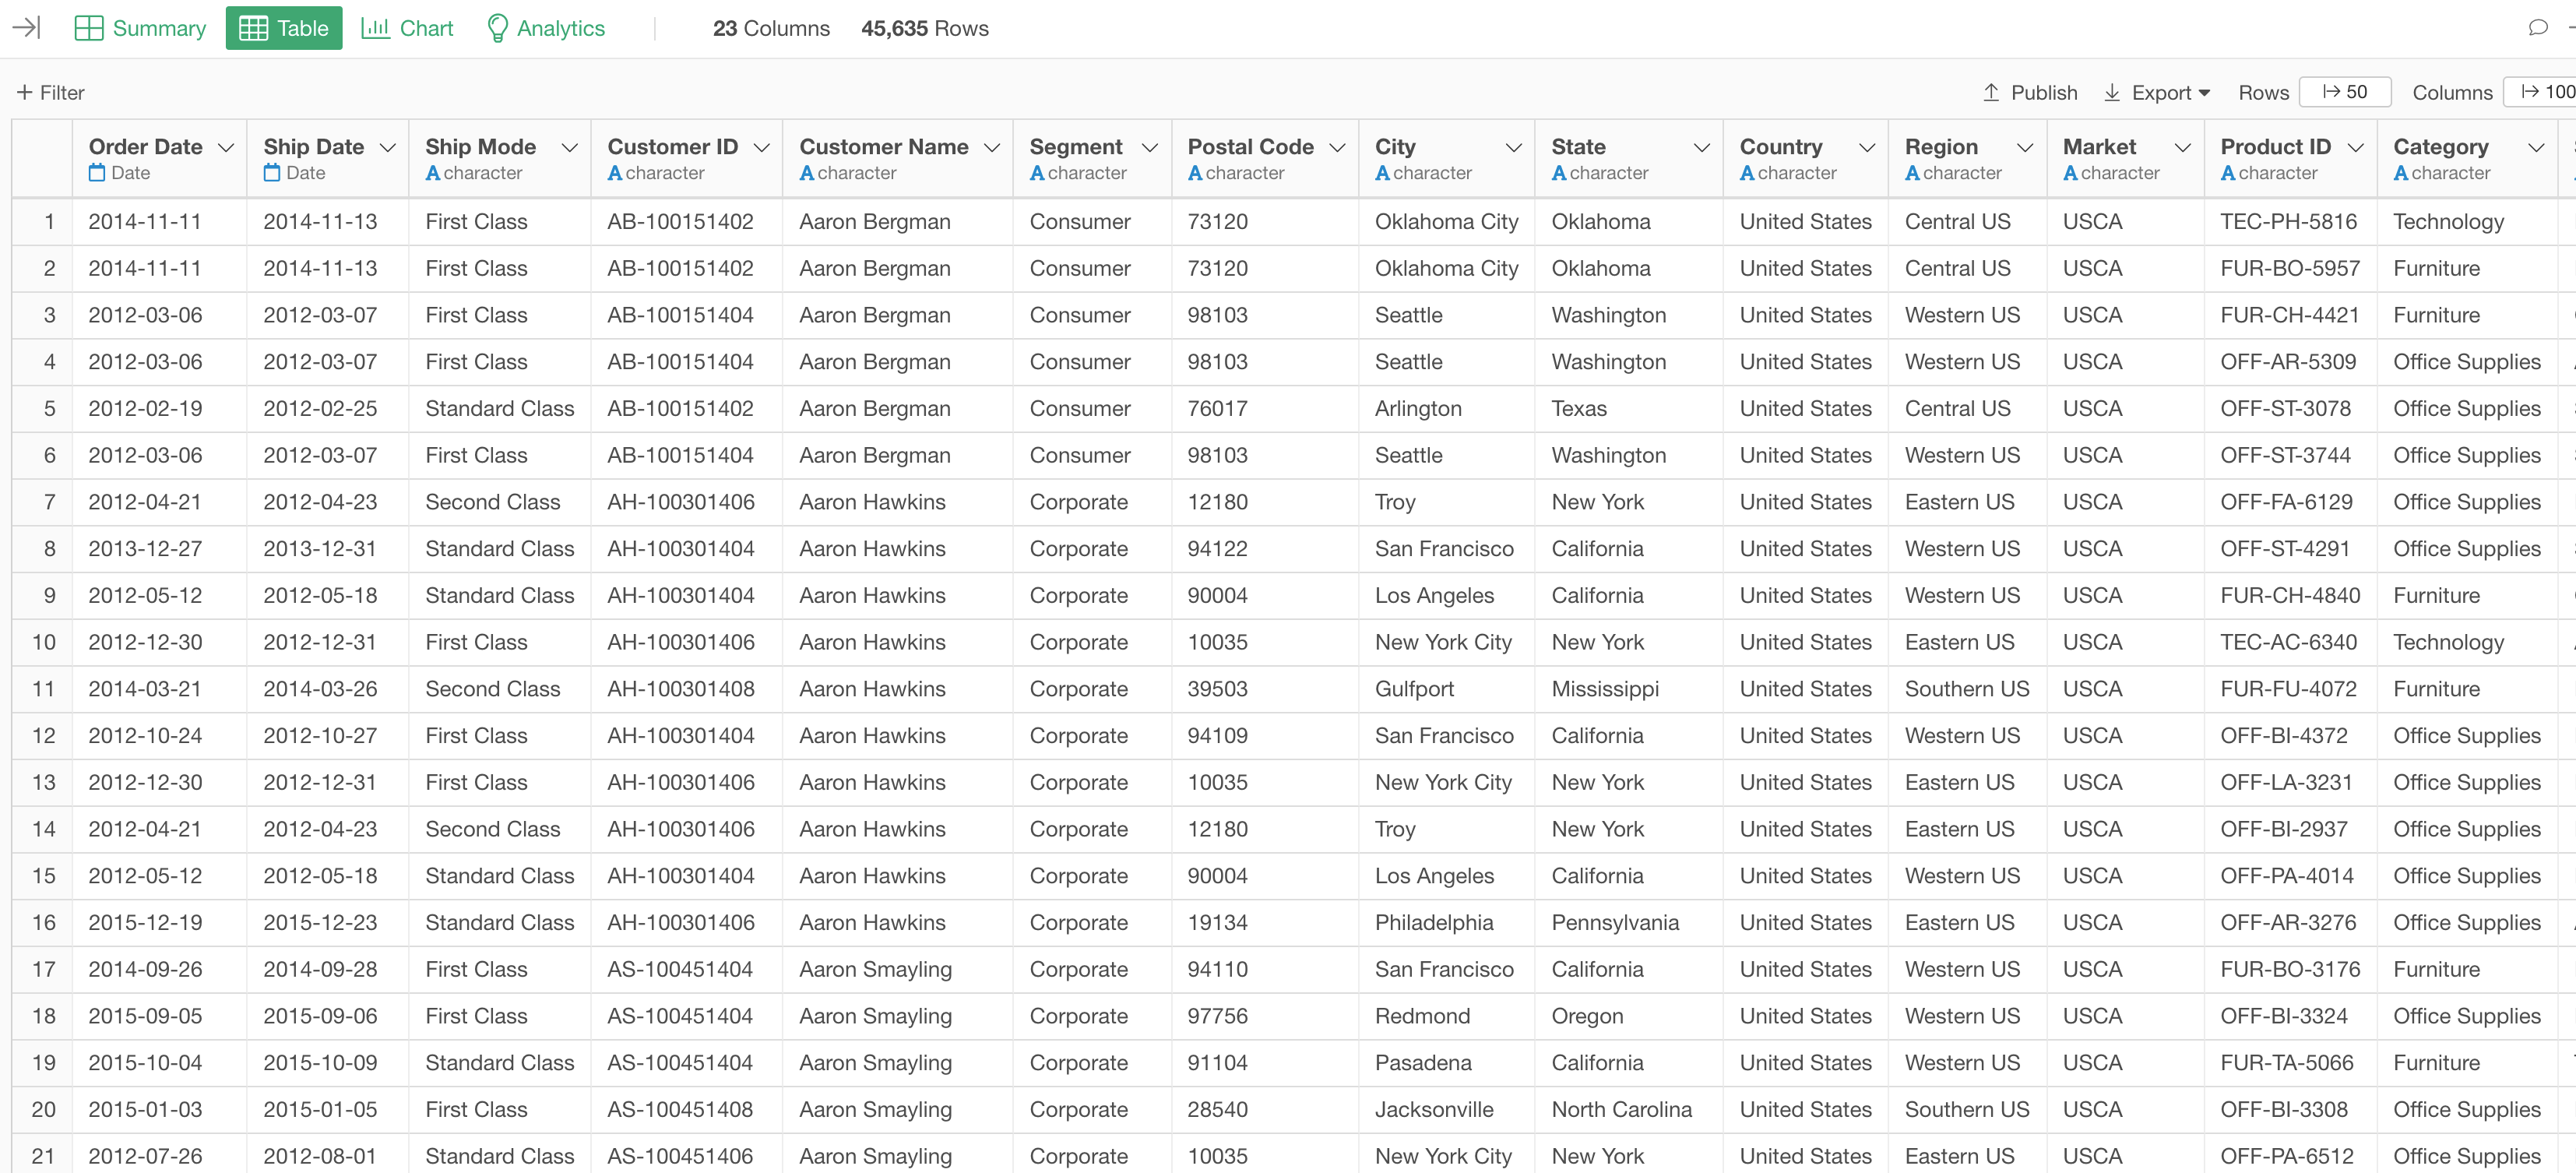
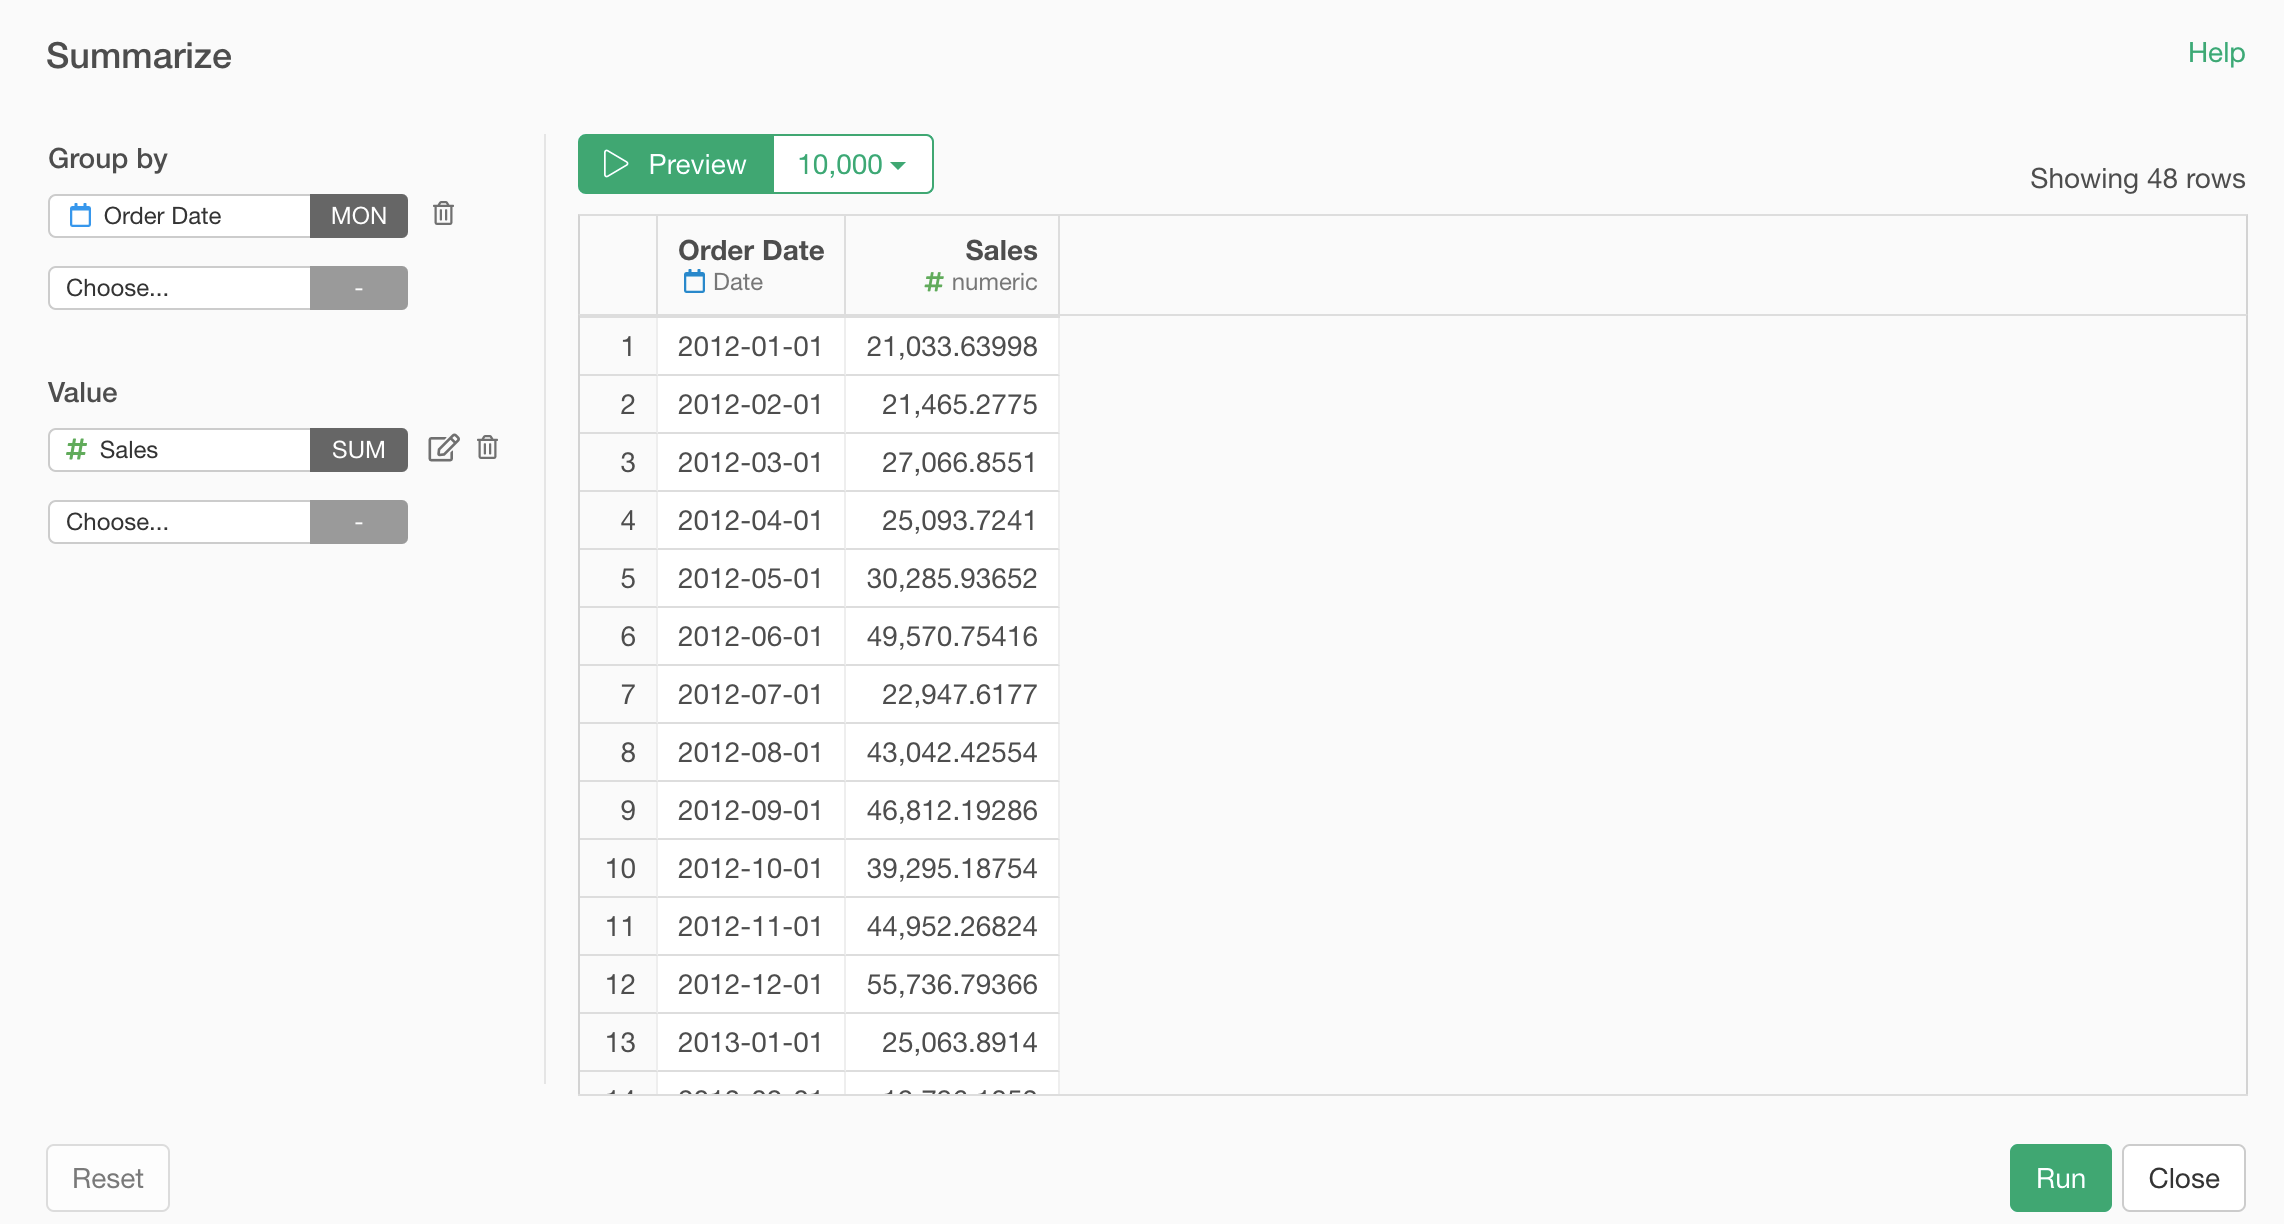
First, you want to summarize the data, for example, by month.
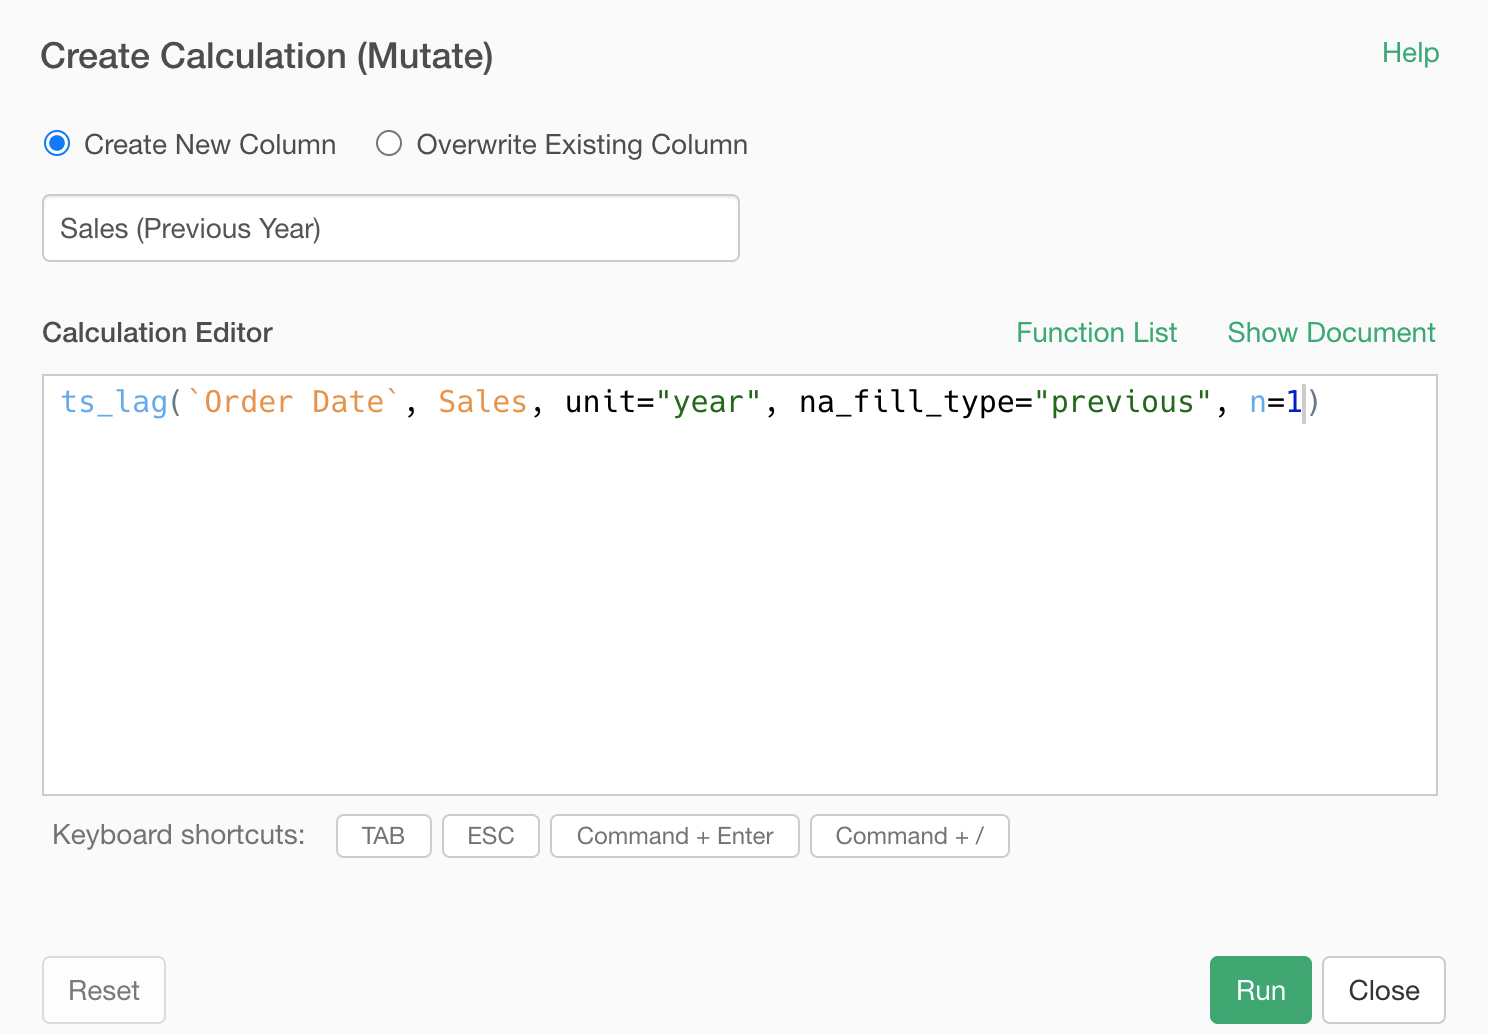
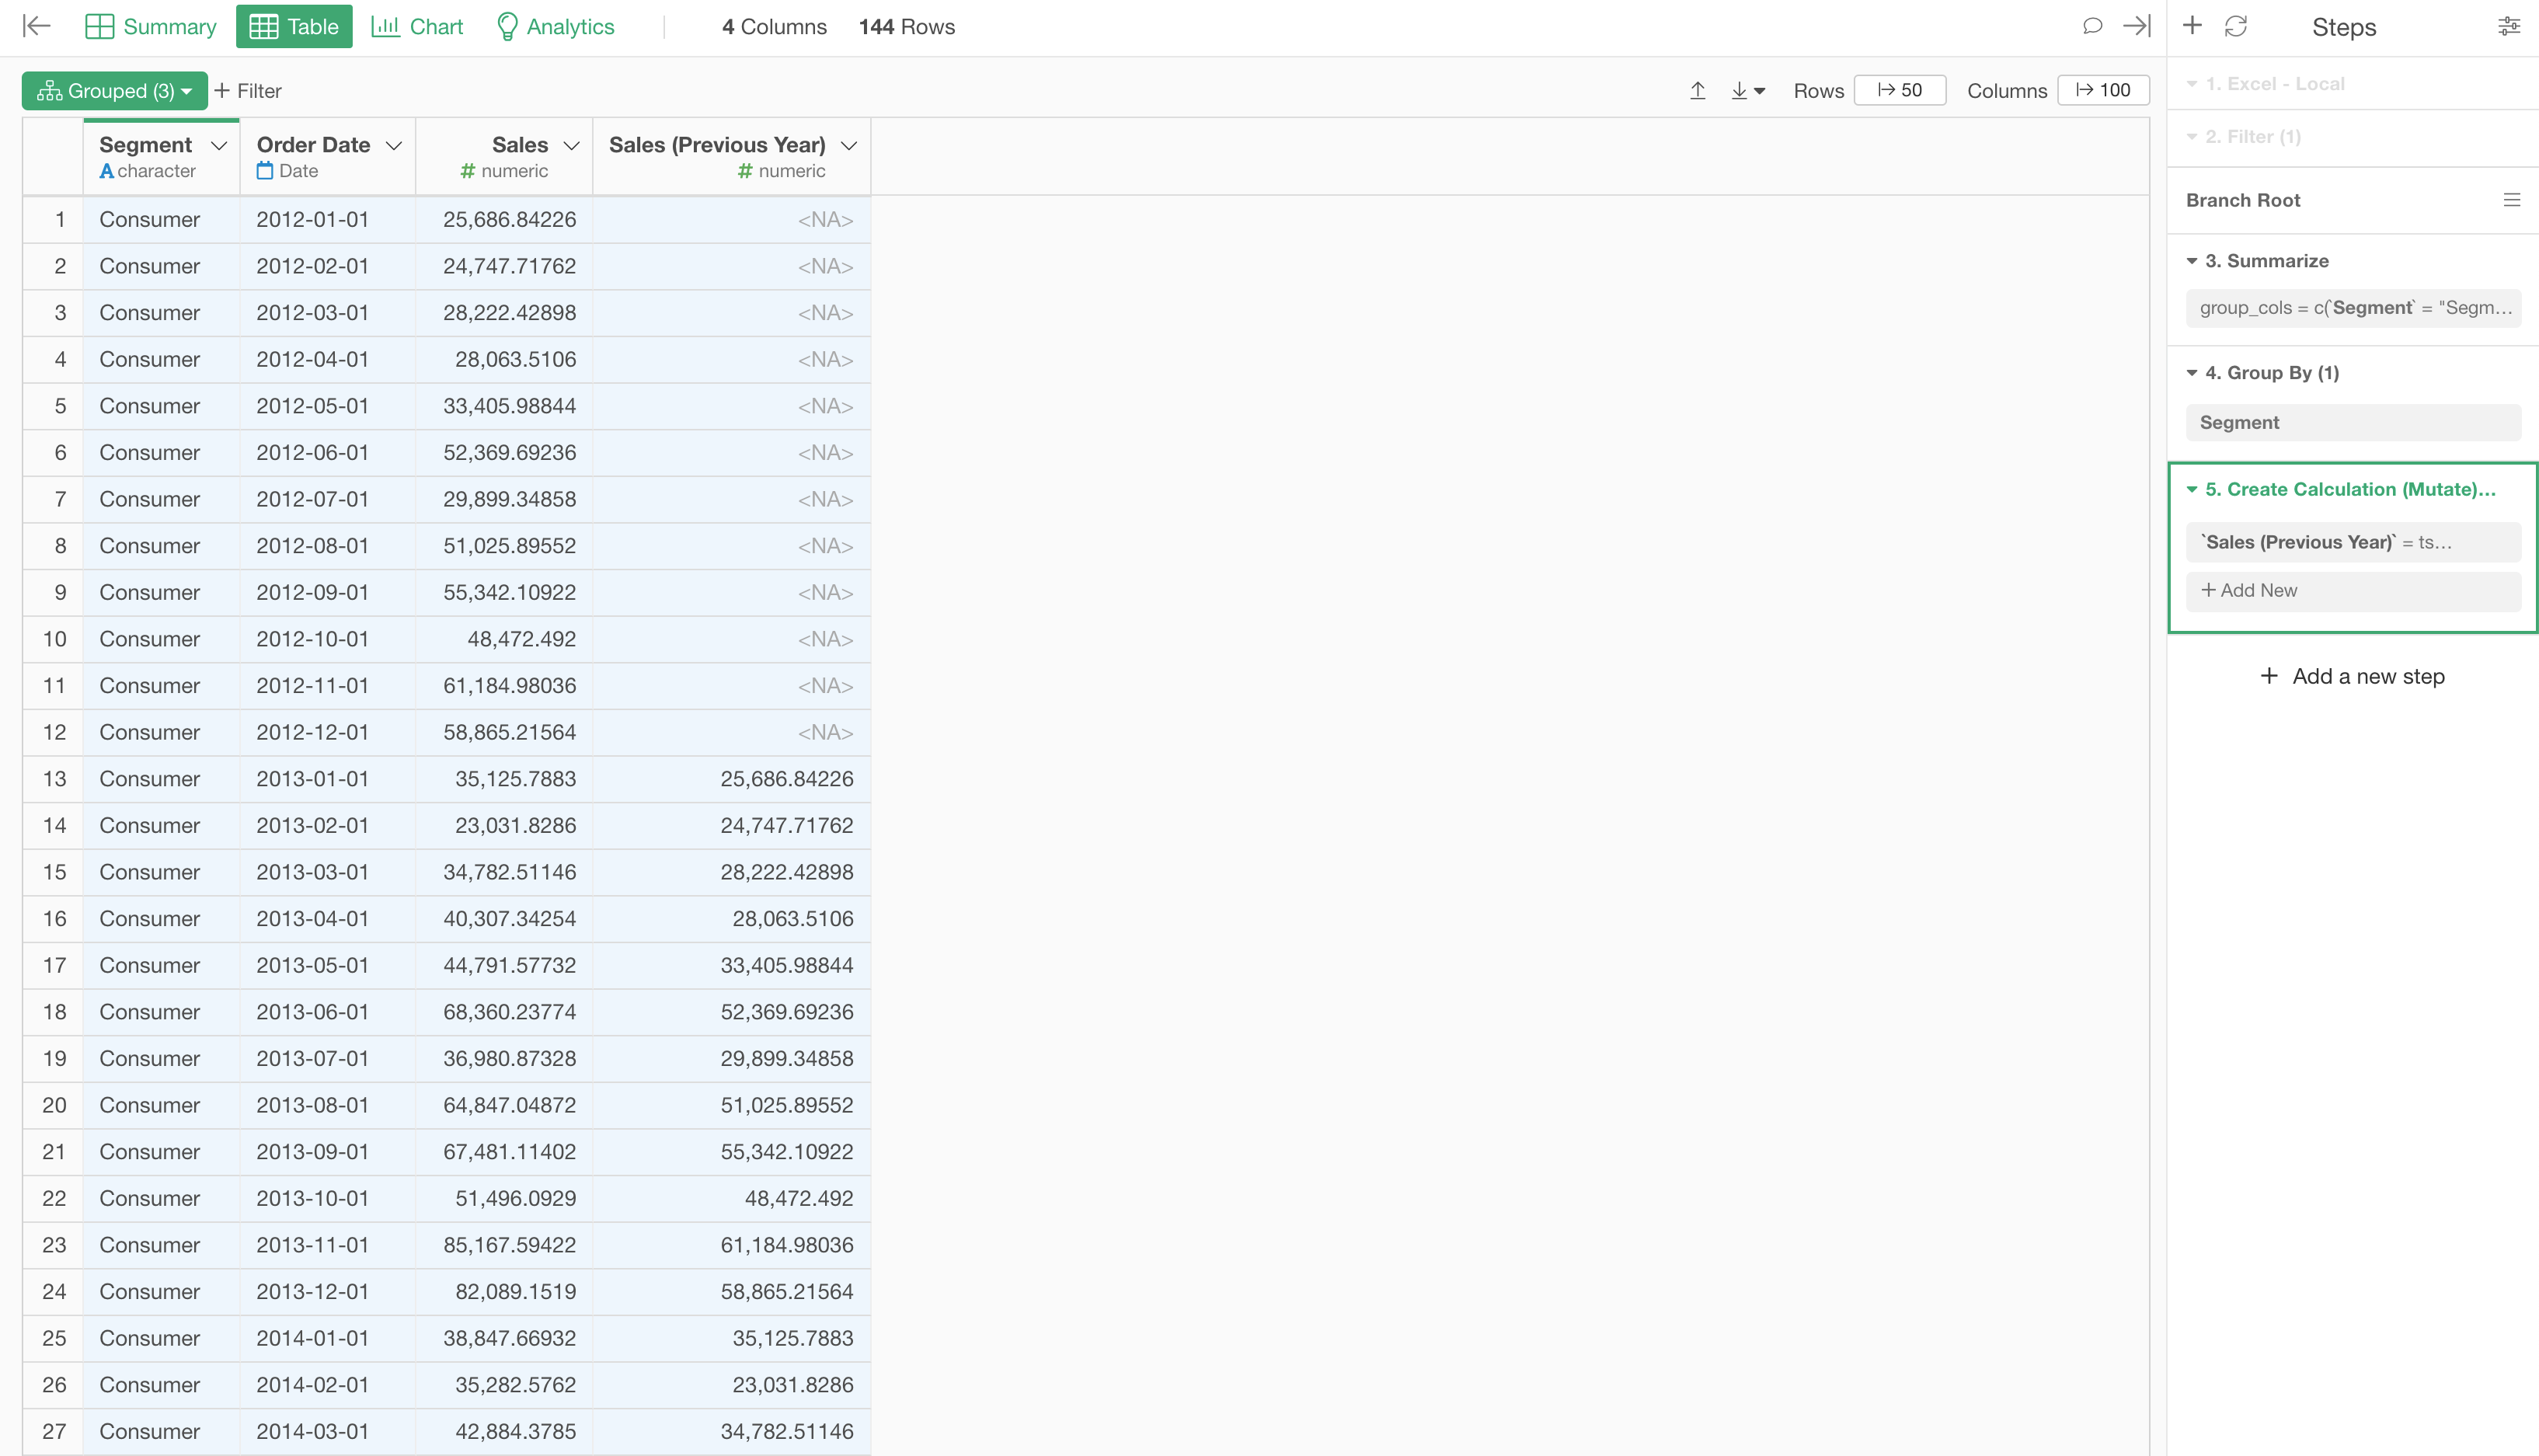
2. Caluculate with 'ts_lag' Function
Then, you can use 'ts_lag' function to get a value from a previous period that you specify for each row value. Here's an example.
ts_lag(`Order Date`, Sales, unit="year", na_fill_type="previous", n=1)The 'unit' argument inside the function is to set the period such as 'year', 'quarter', 'month', etc. And the 'n' arugument is to set 'how many periods ago'. So the above example is setting 1 year ago.
Once you run the calculation you will get something like below.
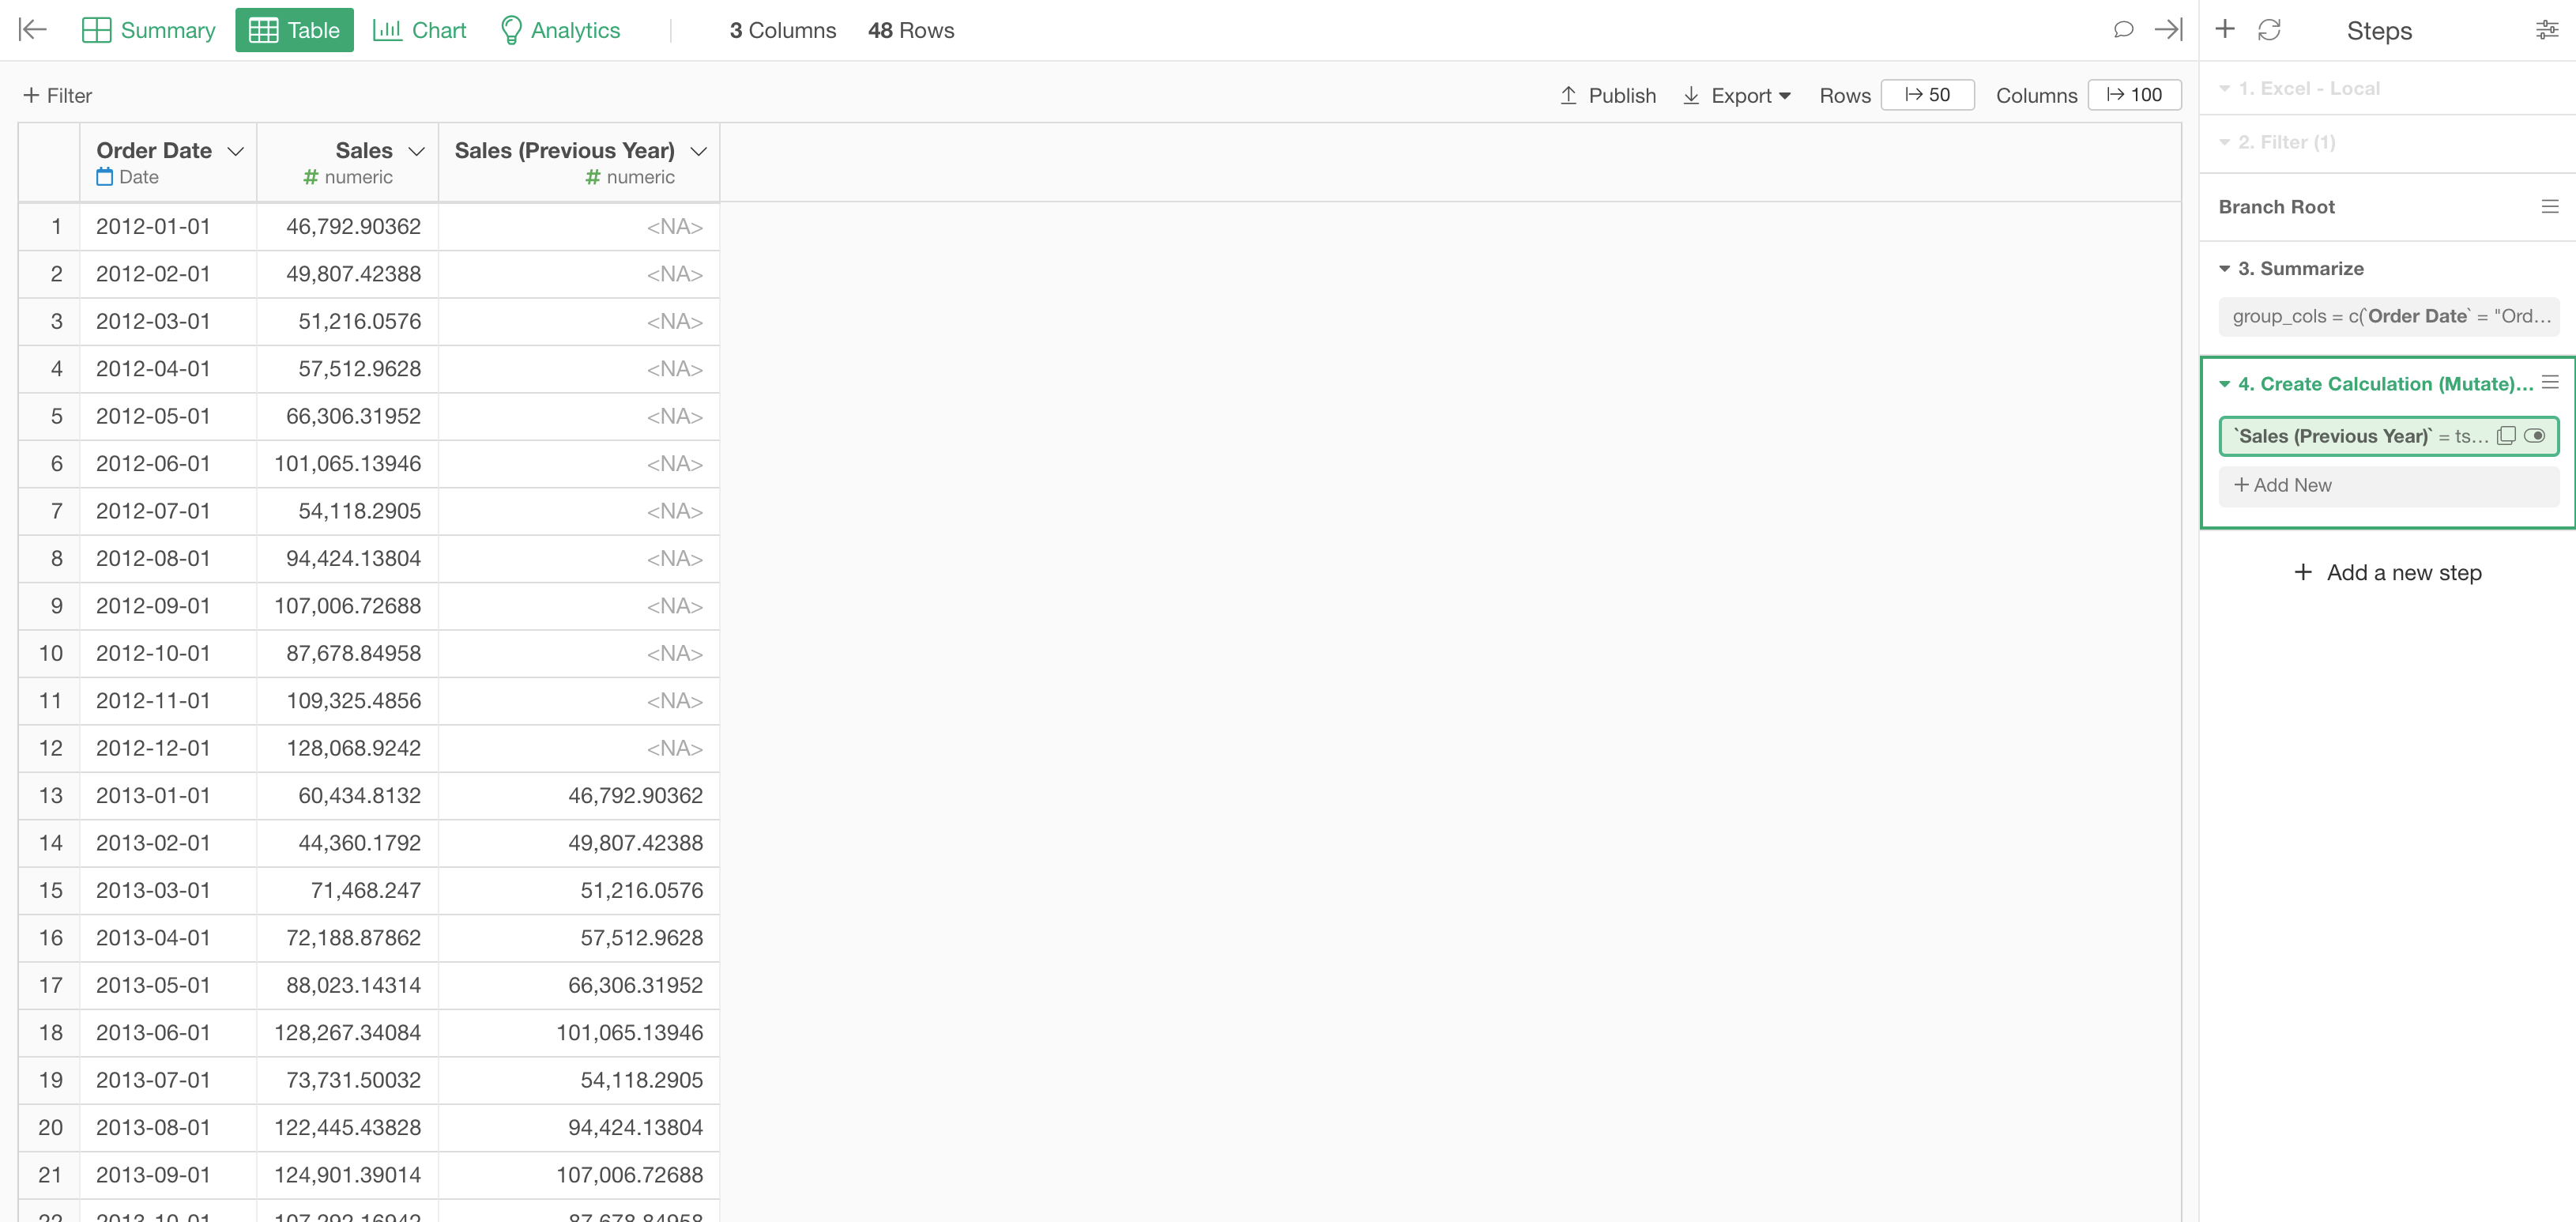
Notice that the value for '2013-01-01' is same as the Sales for '2012-01-01'.
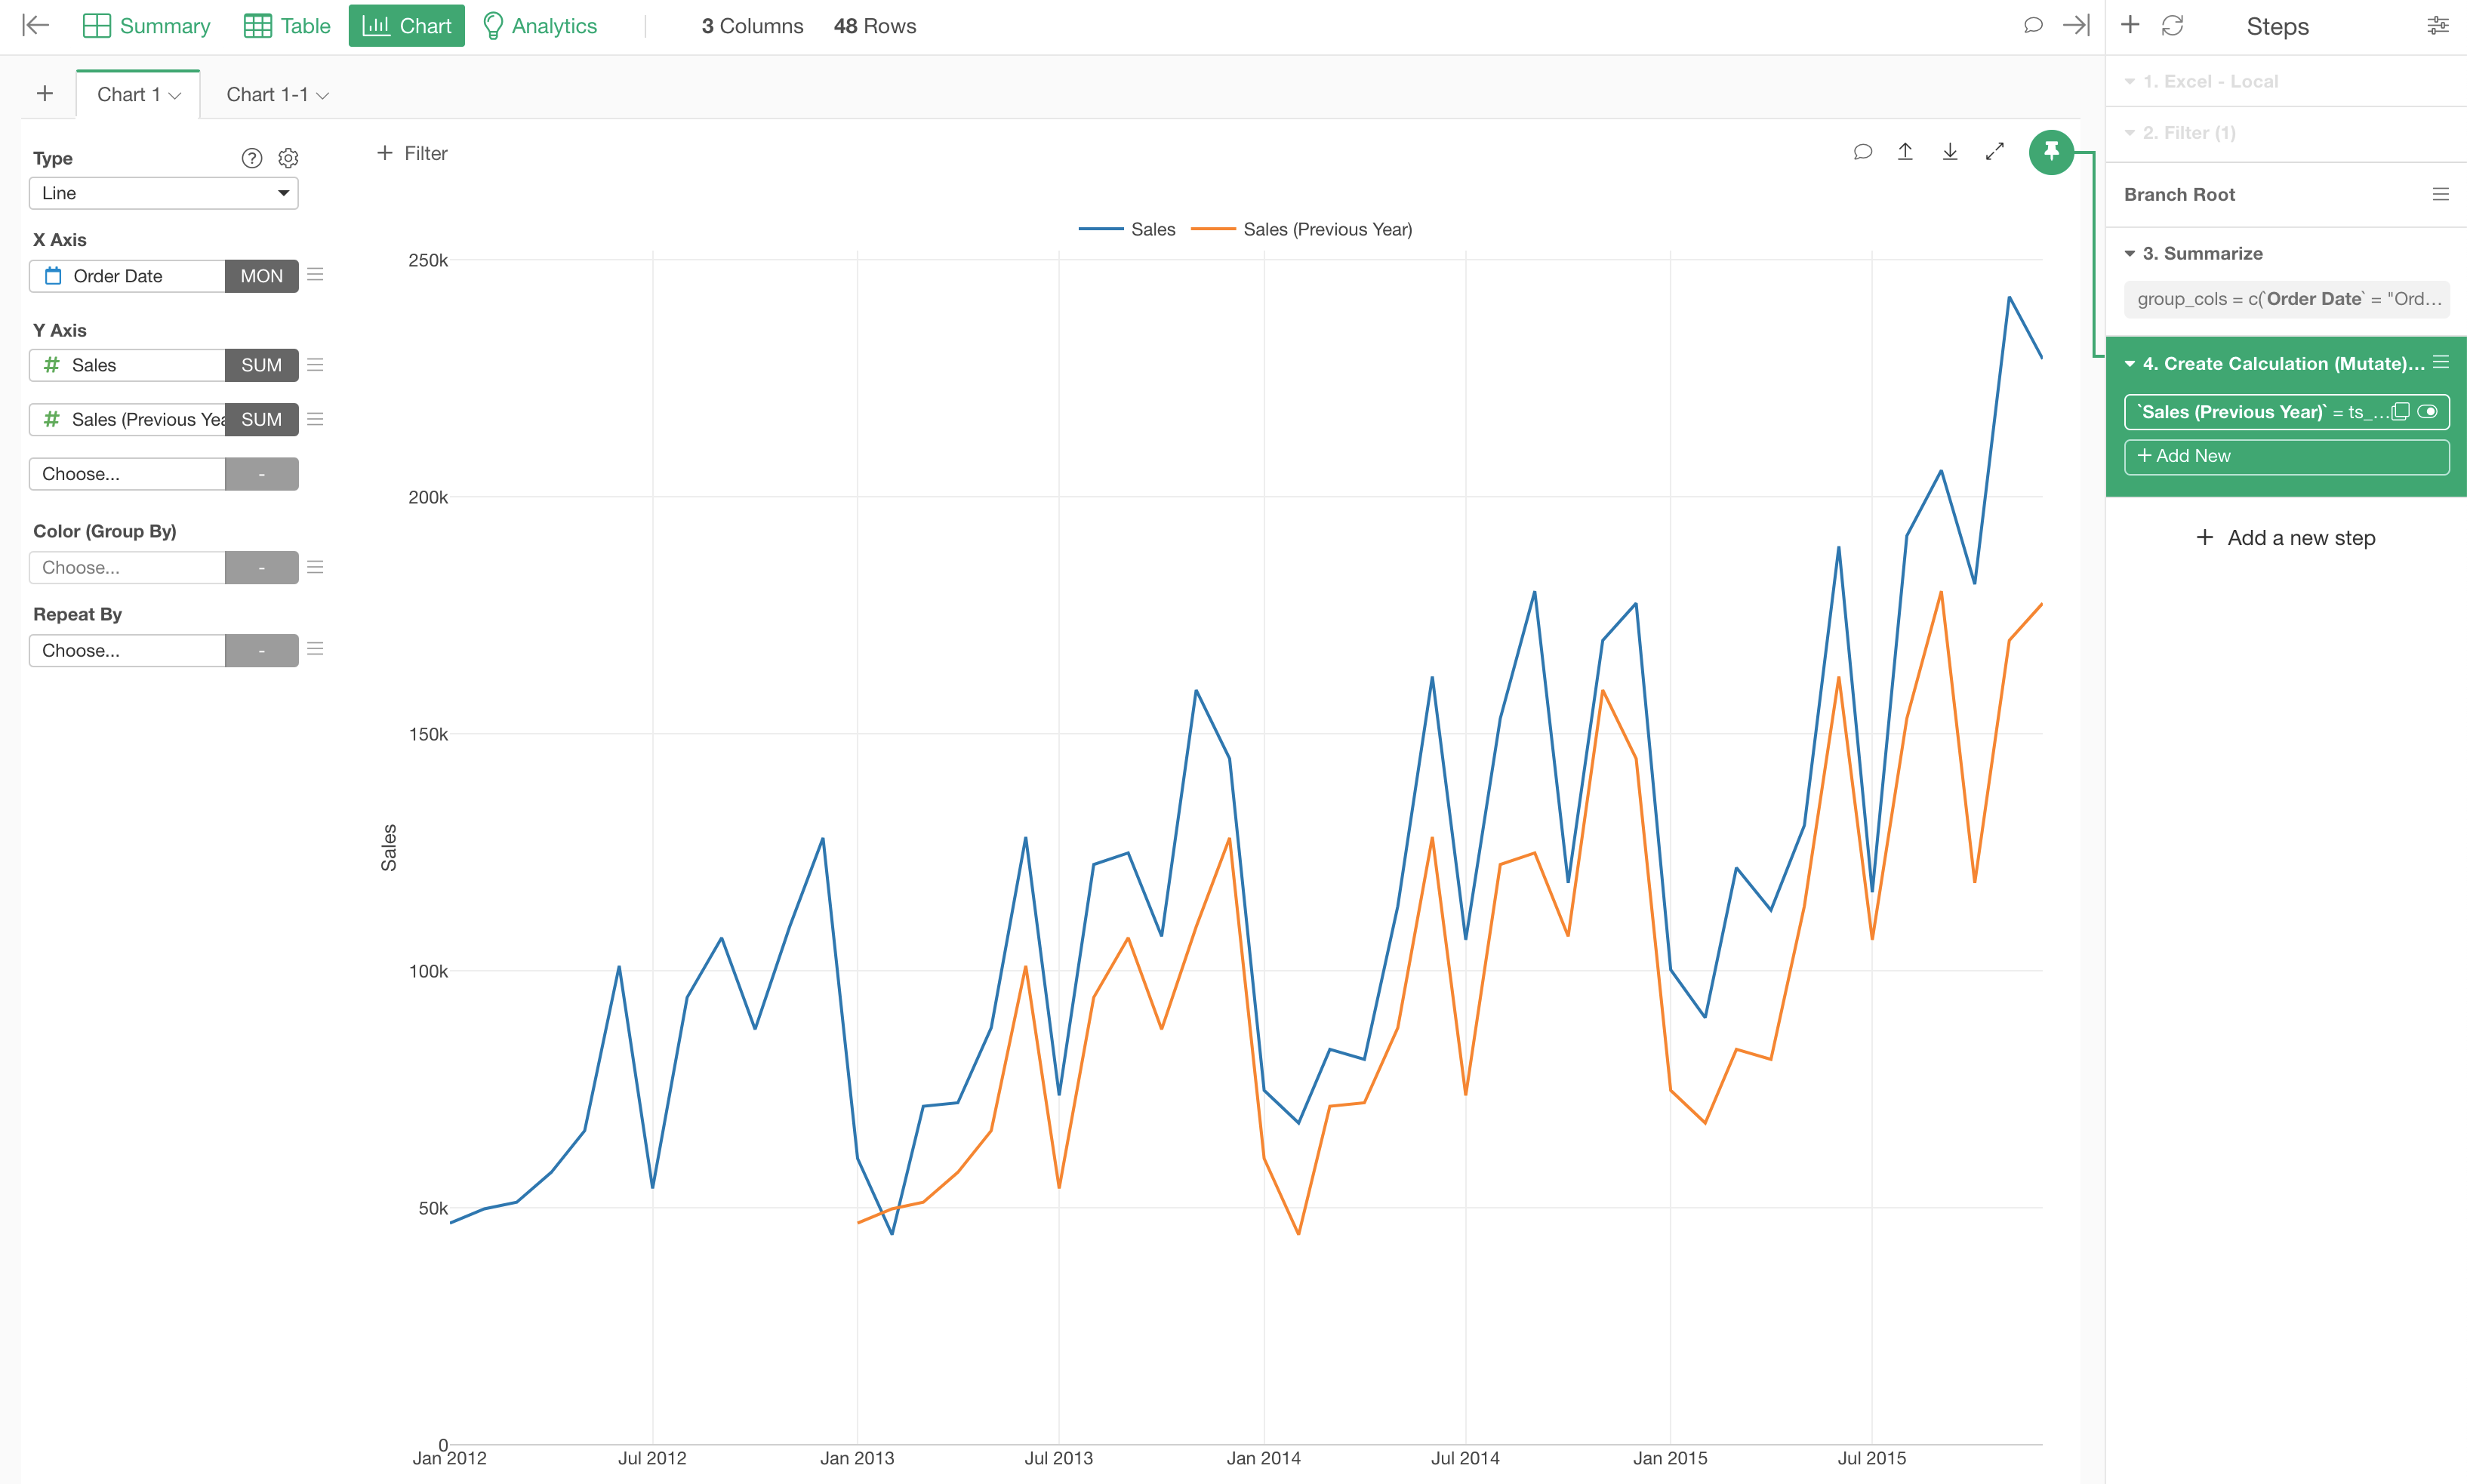
Now, you can go to the Chart view and simply assign the original 'Sales' column and the new 'Sales (Previous Year)' column.
Get Previous Period Value within Group
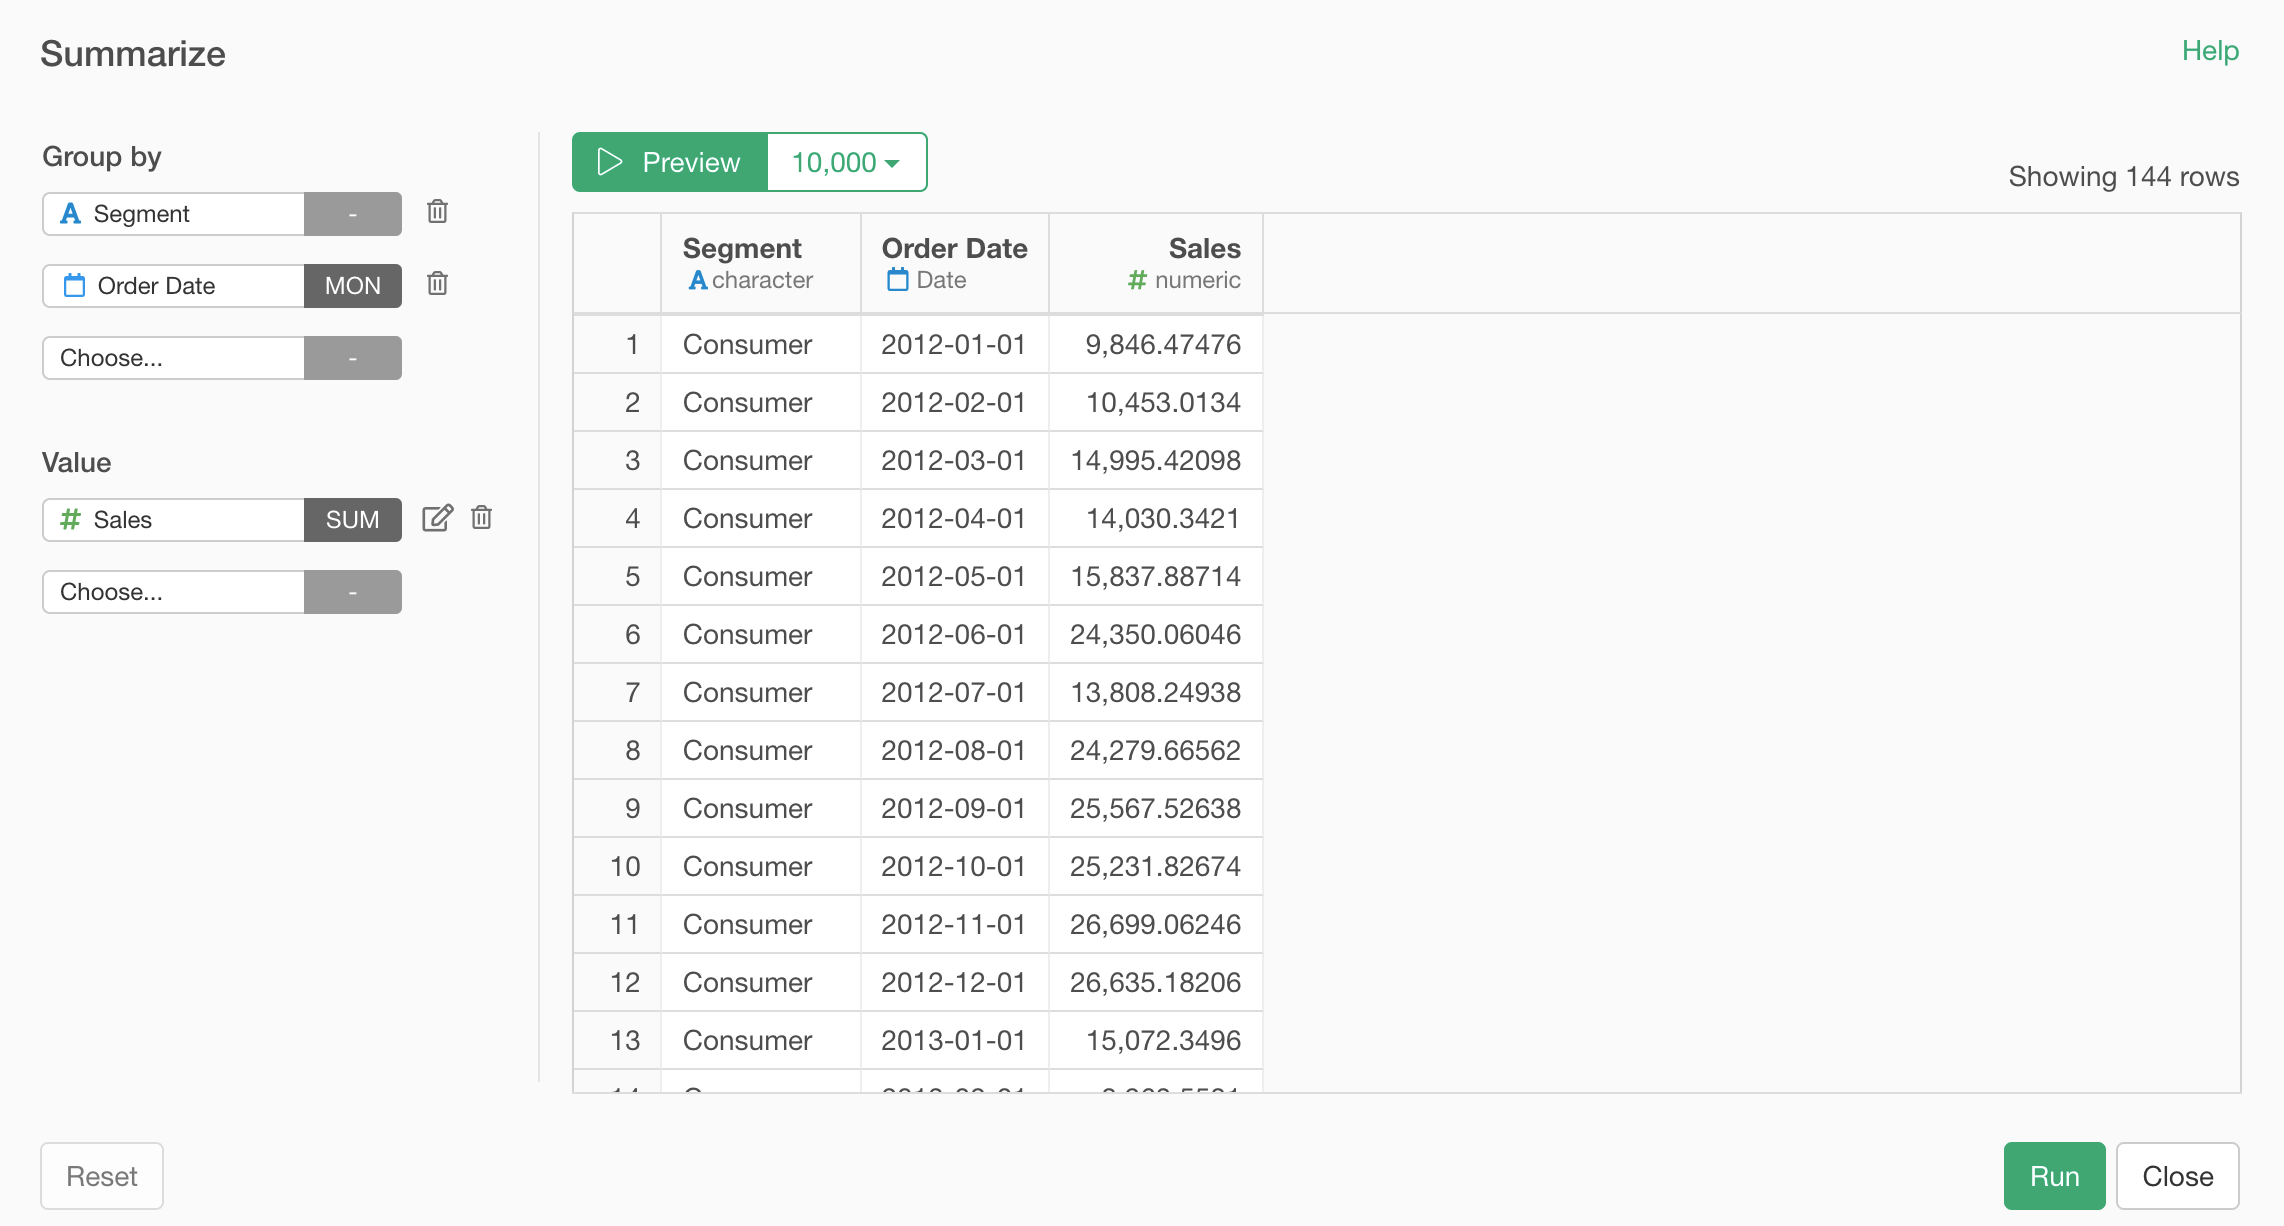
Now, let's say you have multiple groups such as Segments, Regions, etc. and you want to calculate the above 'year ago' for each group?
If such cases, you can add the group column to the Summarize then use 'Group By' to group the data before the calculation with 'ts_lag'.
Here's how.
First, go back to the Summarize step and open the dialog, then add a group column. I'm using 'Segment' column in this example.
Once you run it, then select 'Group By' from the column header menu of the grouping column (Segment).
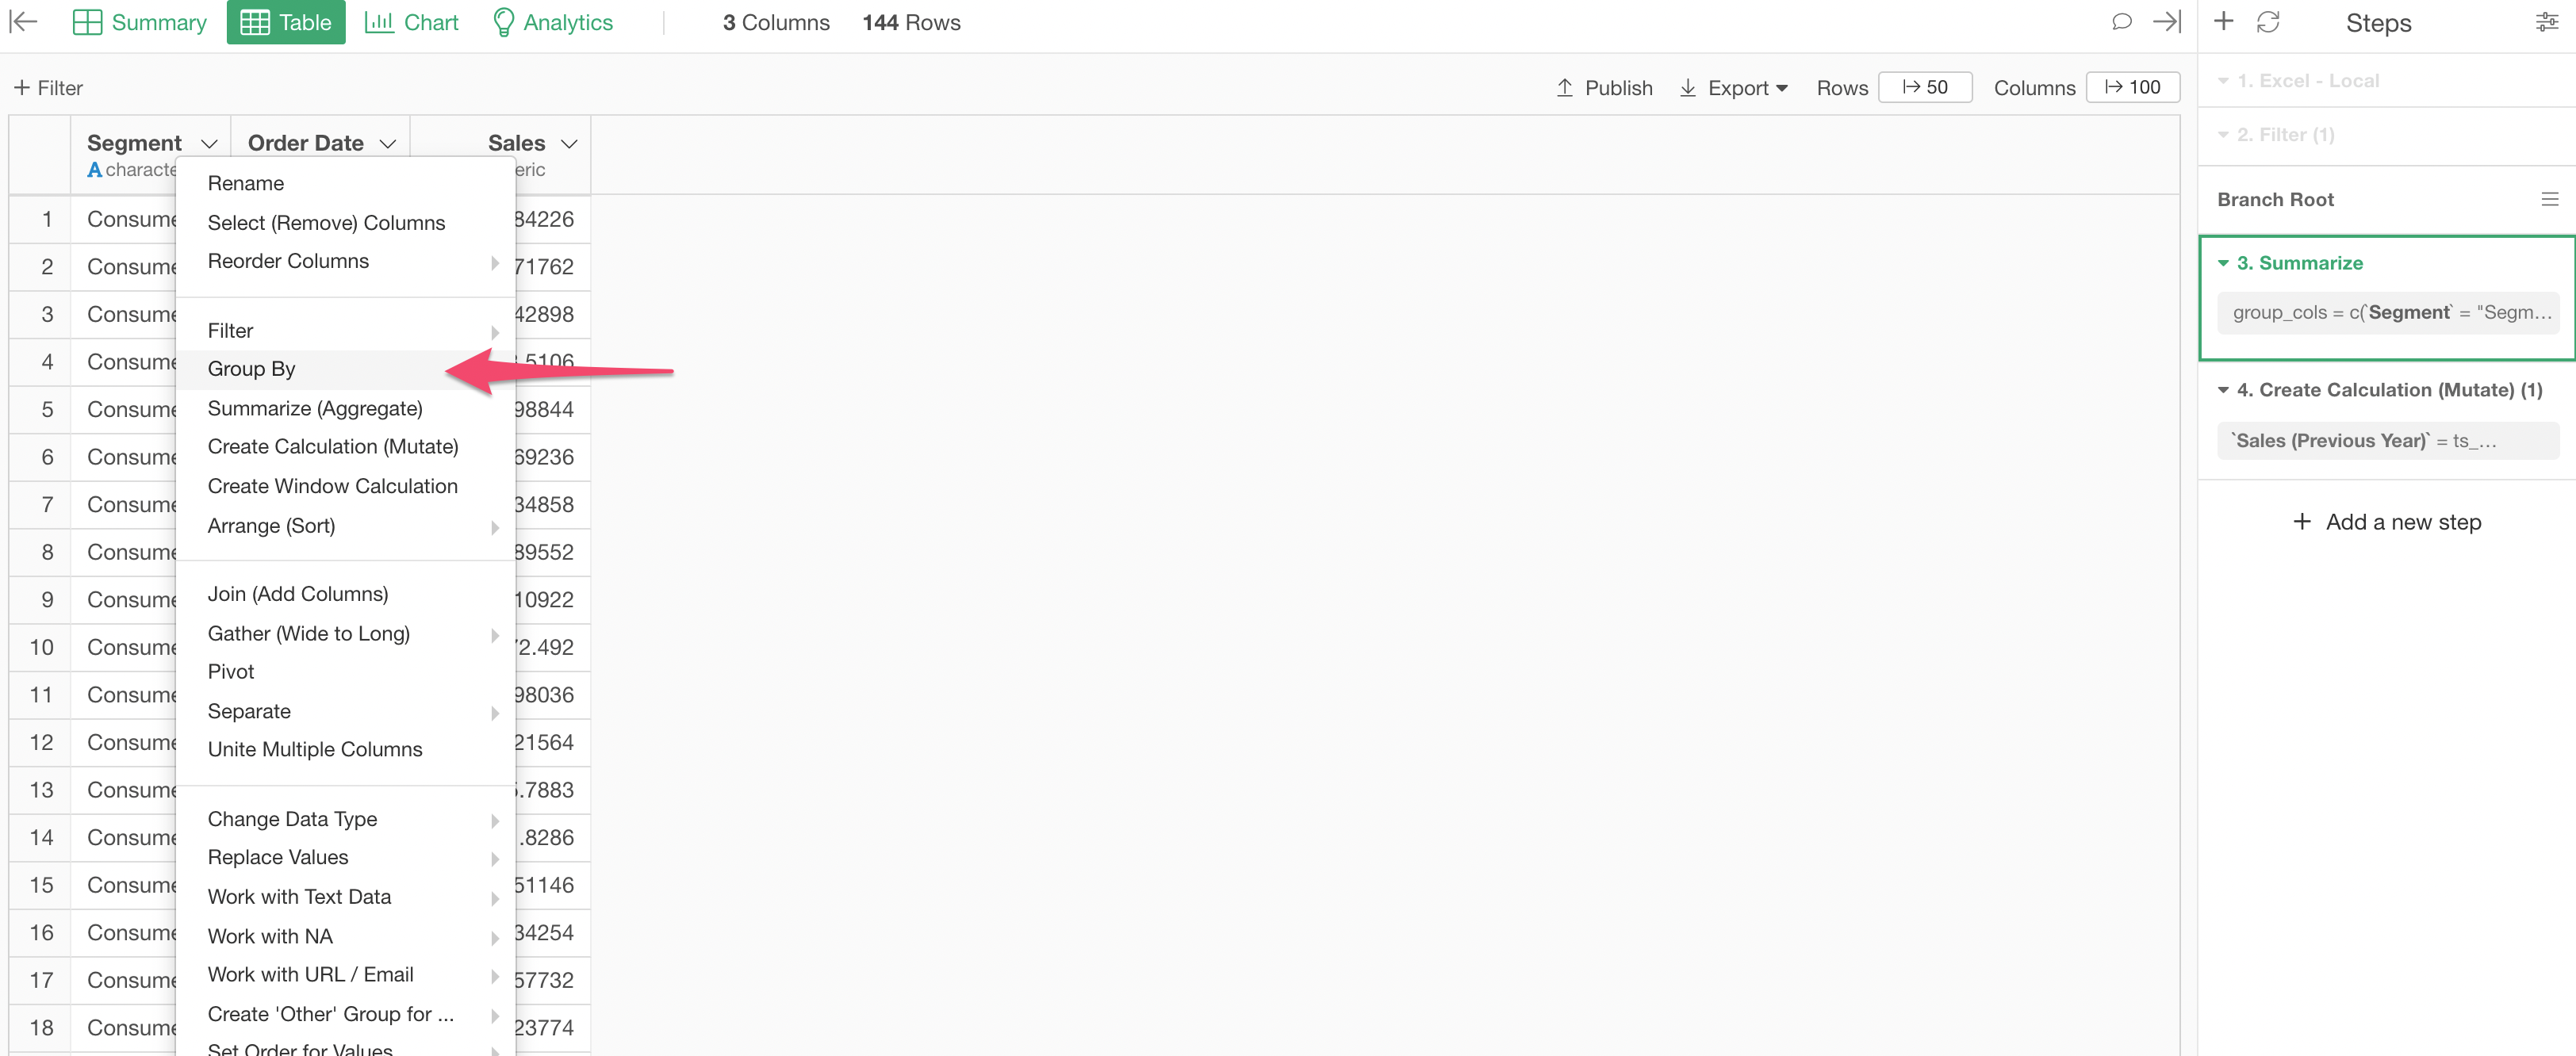
This partitions the data by the specified group values.
Then, you can simply click on the last step where you have calculated the 'year ago' calculation at the right hand side.
The Grouping make sure to have the 'ts_lag' calculation picks the value from the previous year of the same group, not across the groups.