Convering Data Type
When you import data into Exploratory it automatically tries to detect the most appropriate data types for all the columns. But sometimes they are not what you would expect.
This happens, for example, when there are characters in the columns that are supposed to be the numeric or the date data columns.
But, you can quickly fix these from the UI menus. Here’s how.
Data
We’ll use the Unicorn companies data.
If you like to get the latest, you can directly get the data from this page by ‘web-scraping’.
Convert from Character to Numeric
The ‘Valuation($B)’ column is registered as Character type.
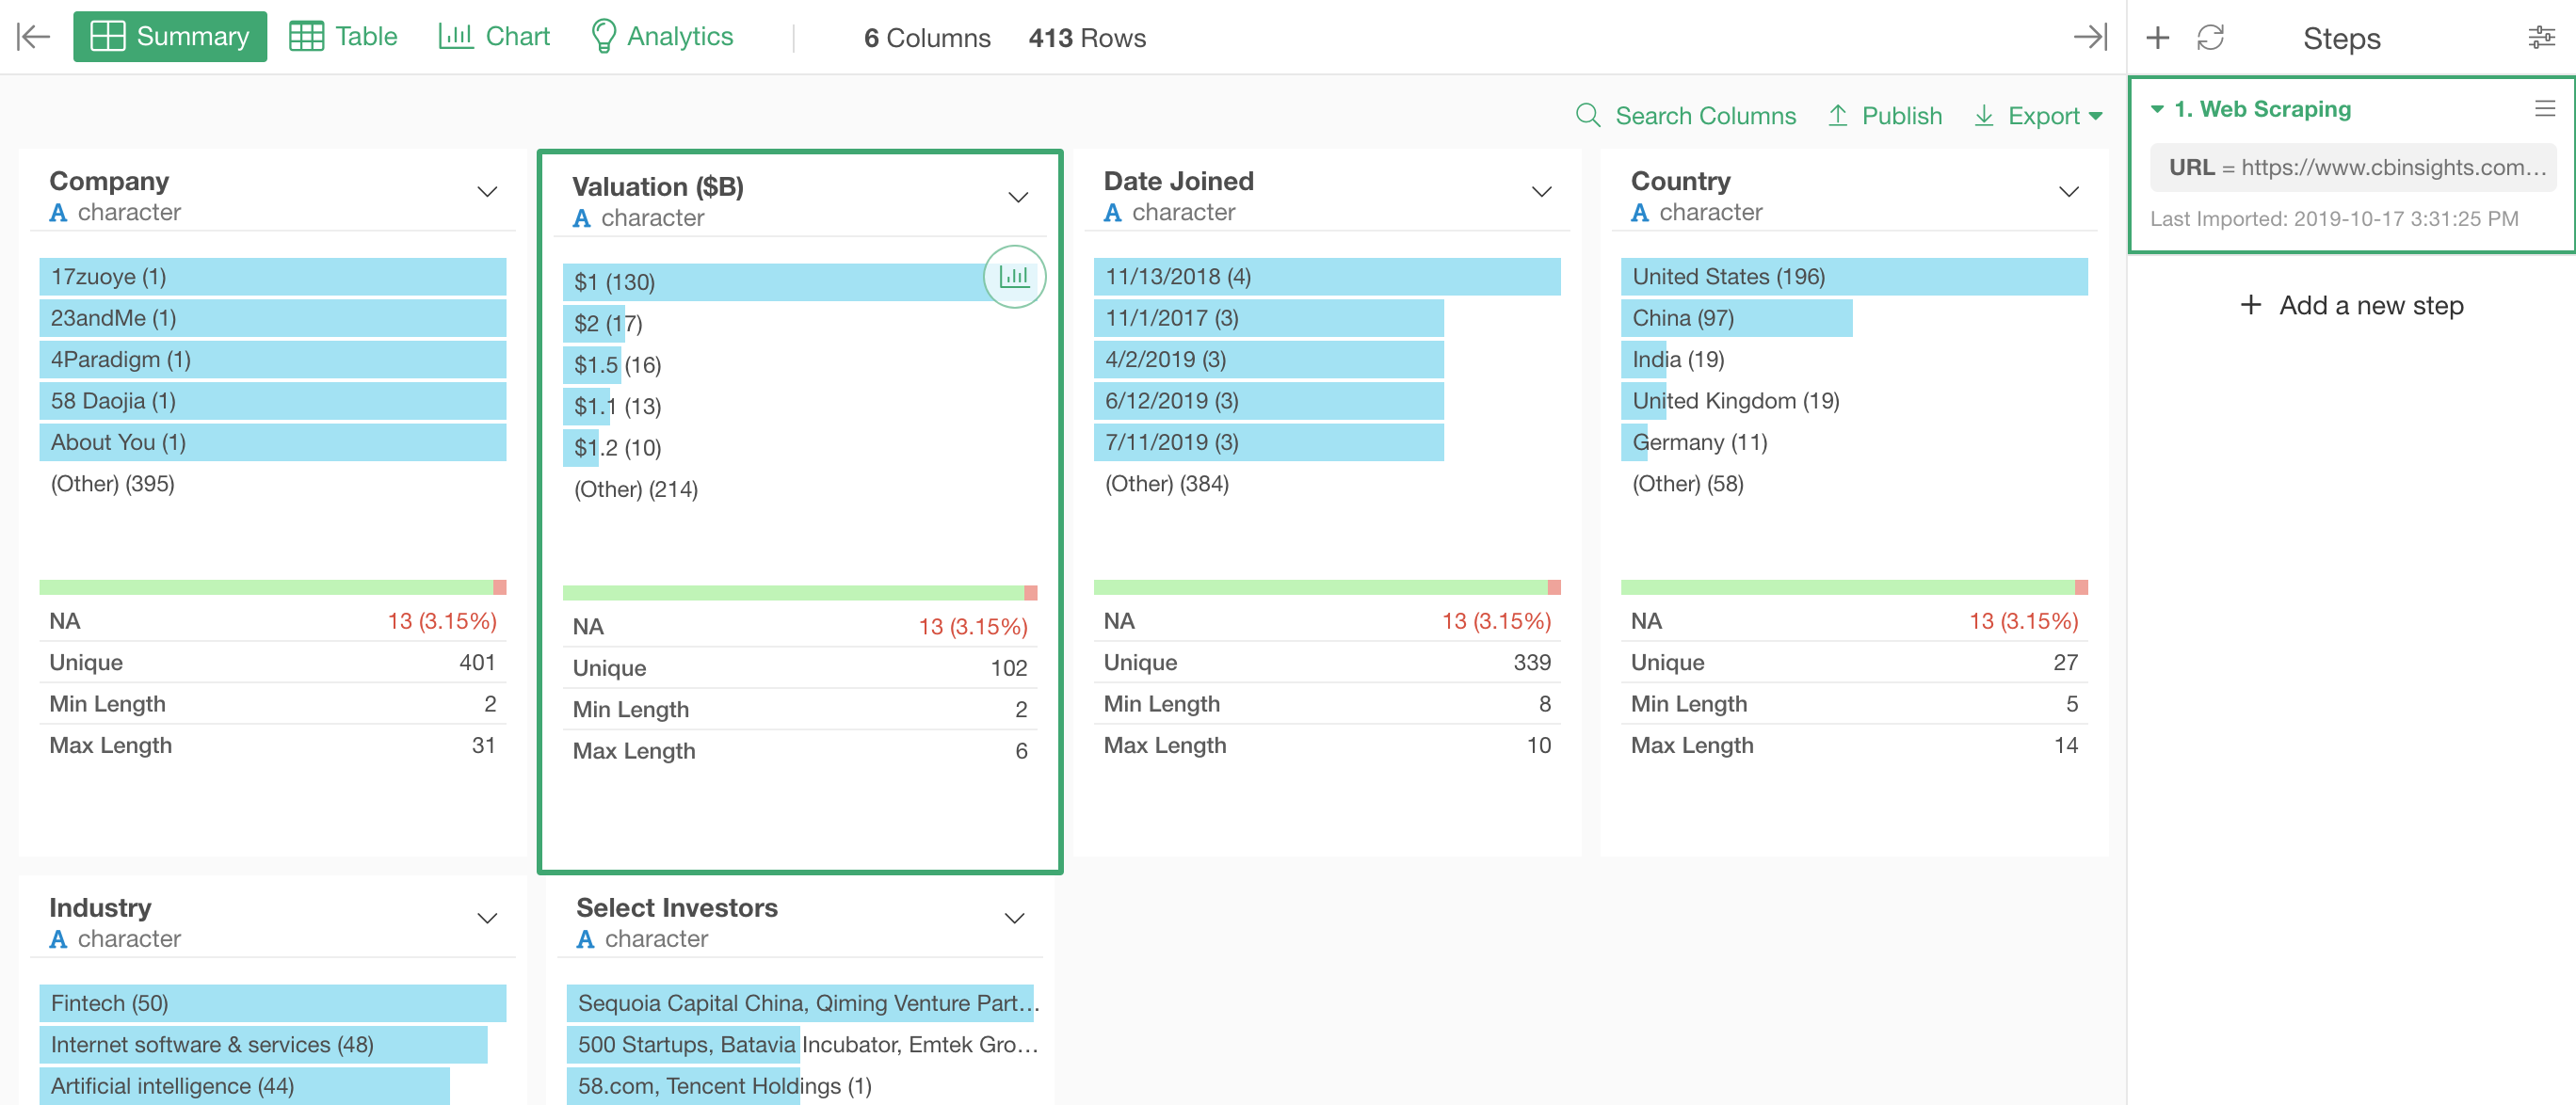
This is because there is a letter ‘$’ inside the data long with the numbers.
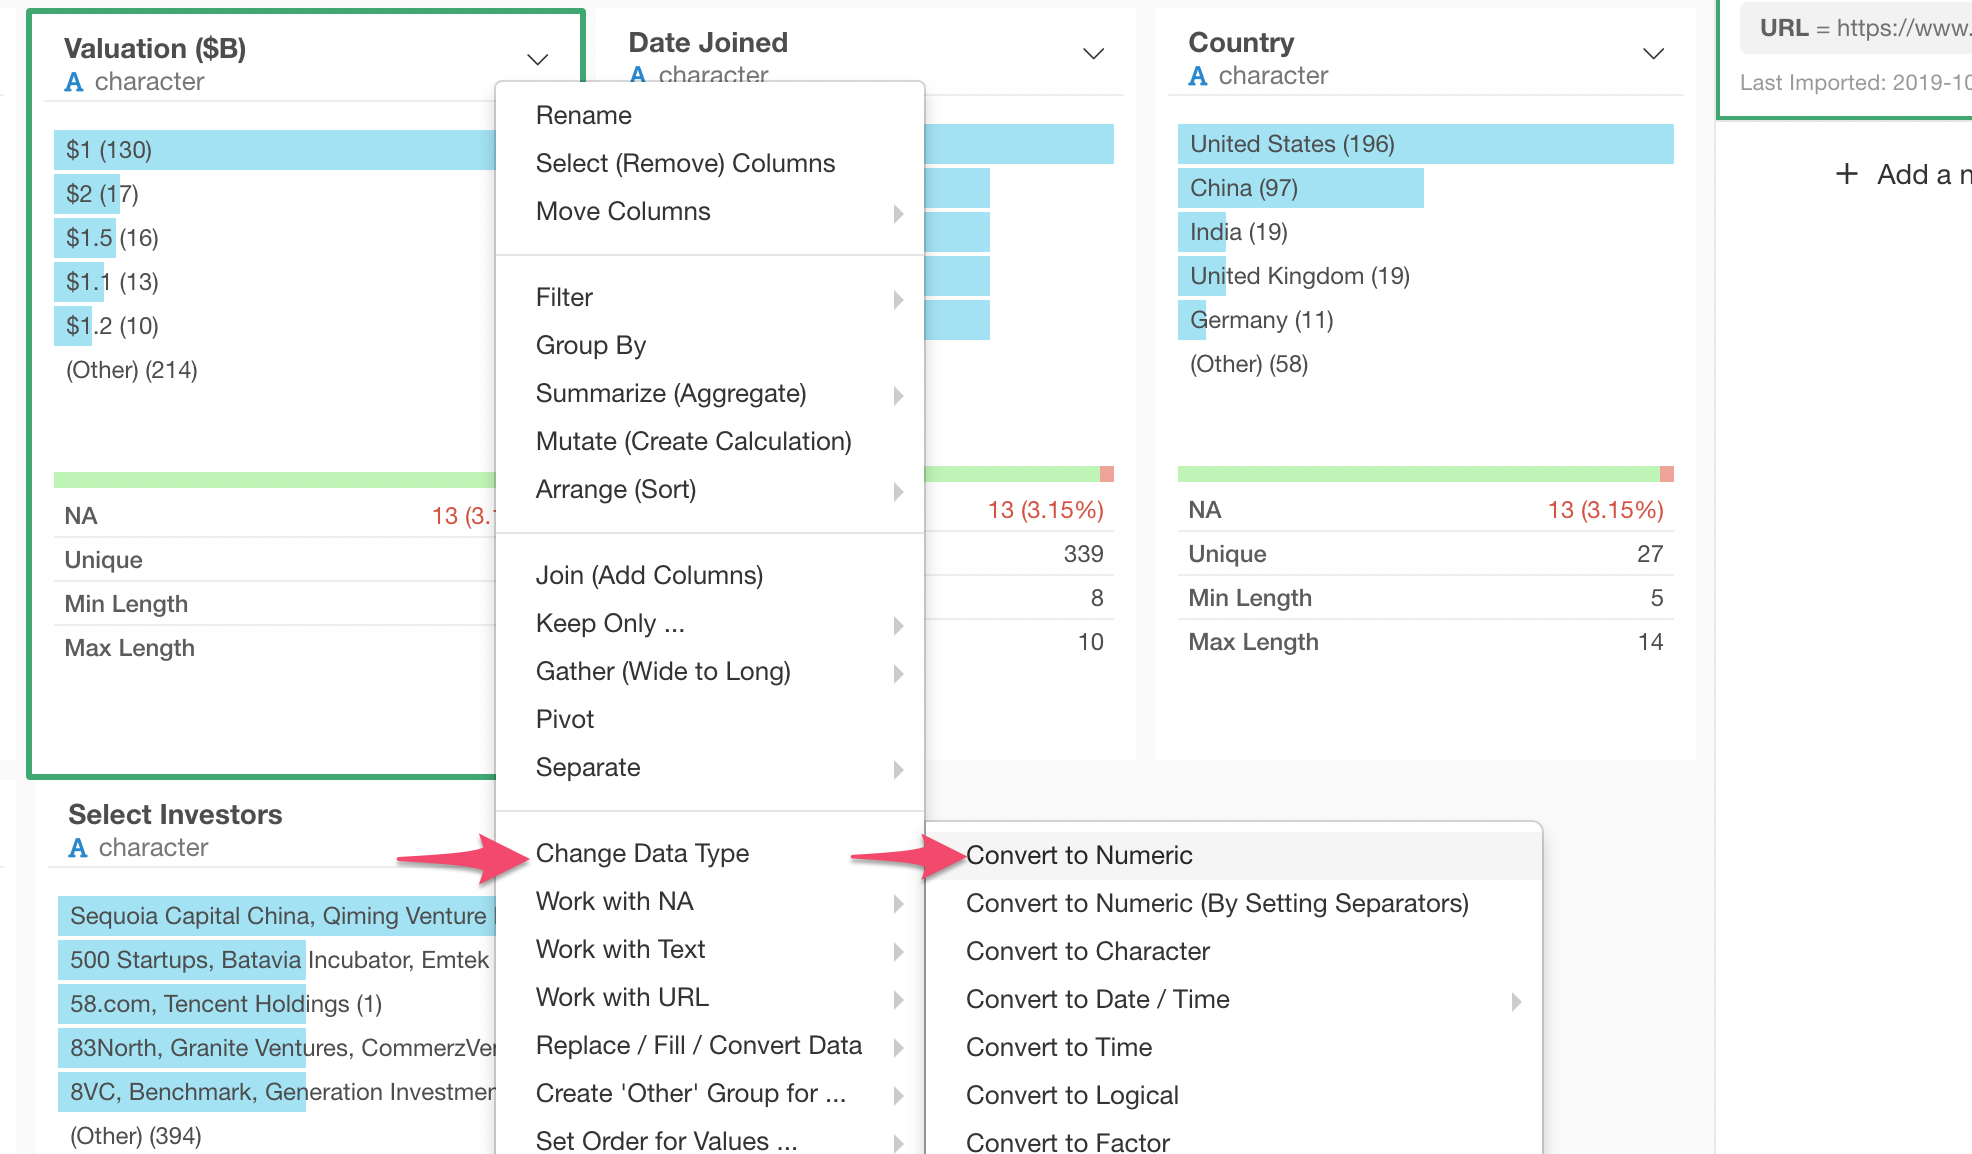
We can extract only the numeric part of the data and convert it as Numeric data type column.
Select ‘Change Data Type’ -> ‘Convert Numeric’ from the column header menu.
You will see the ‘parse_number()’ function along with the column name populated in the Mutate dialog.
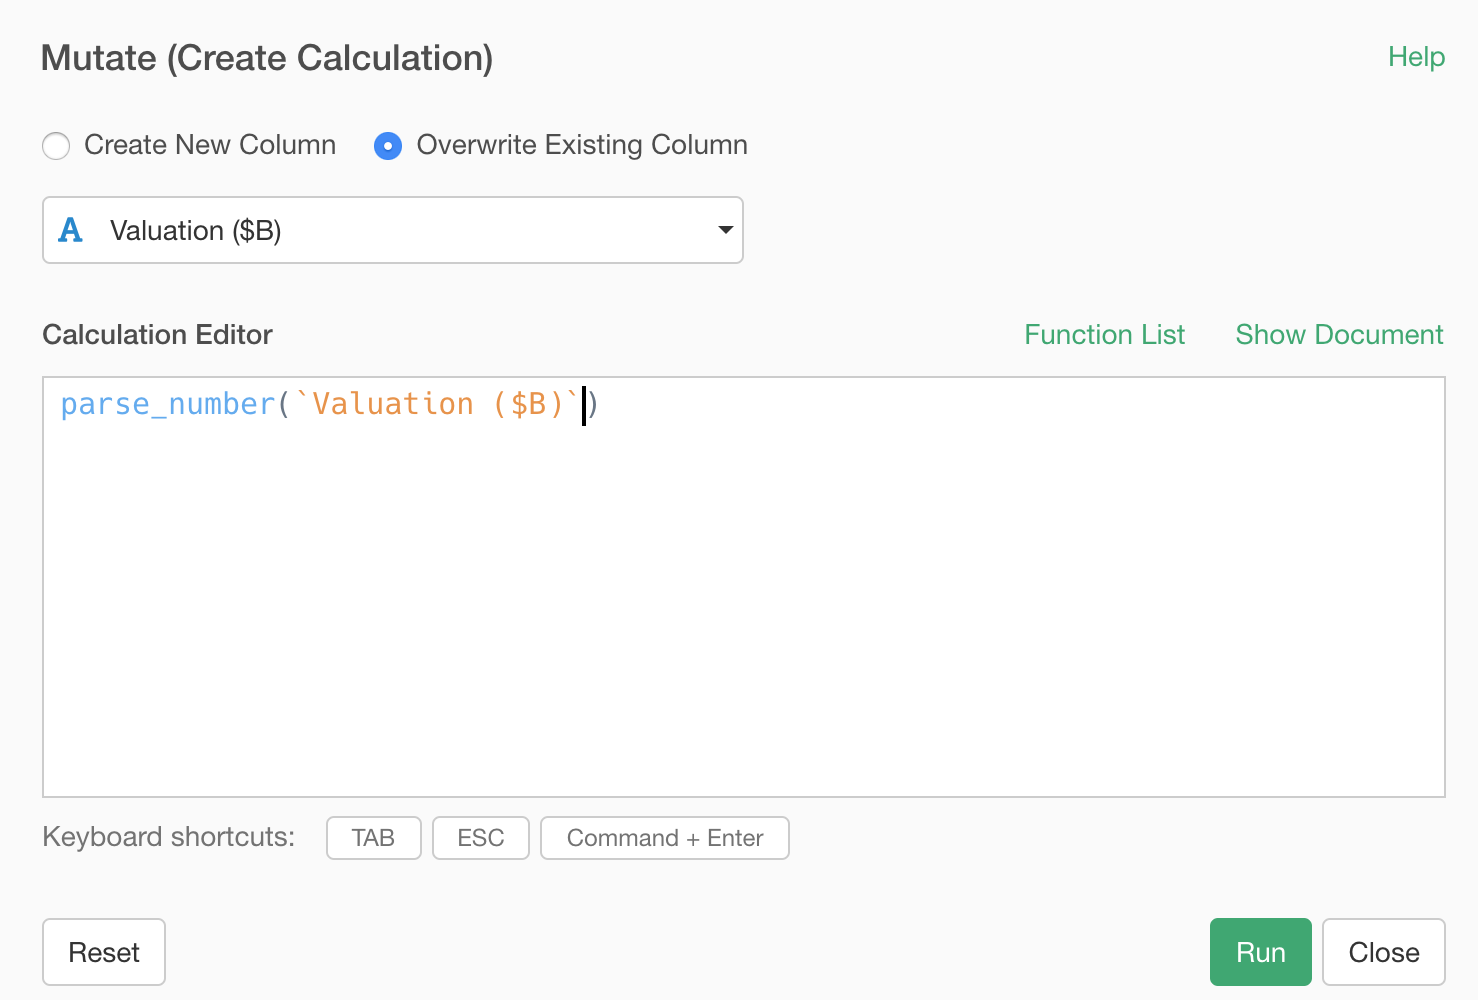
You can simply click on ‘Run’ button to execute.
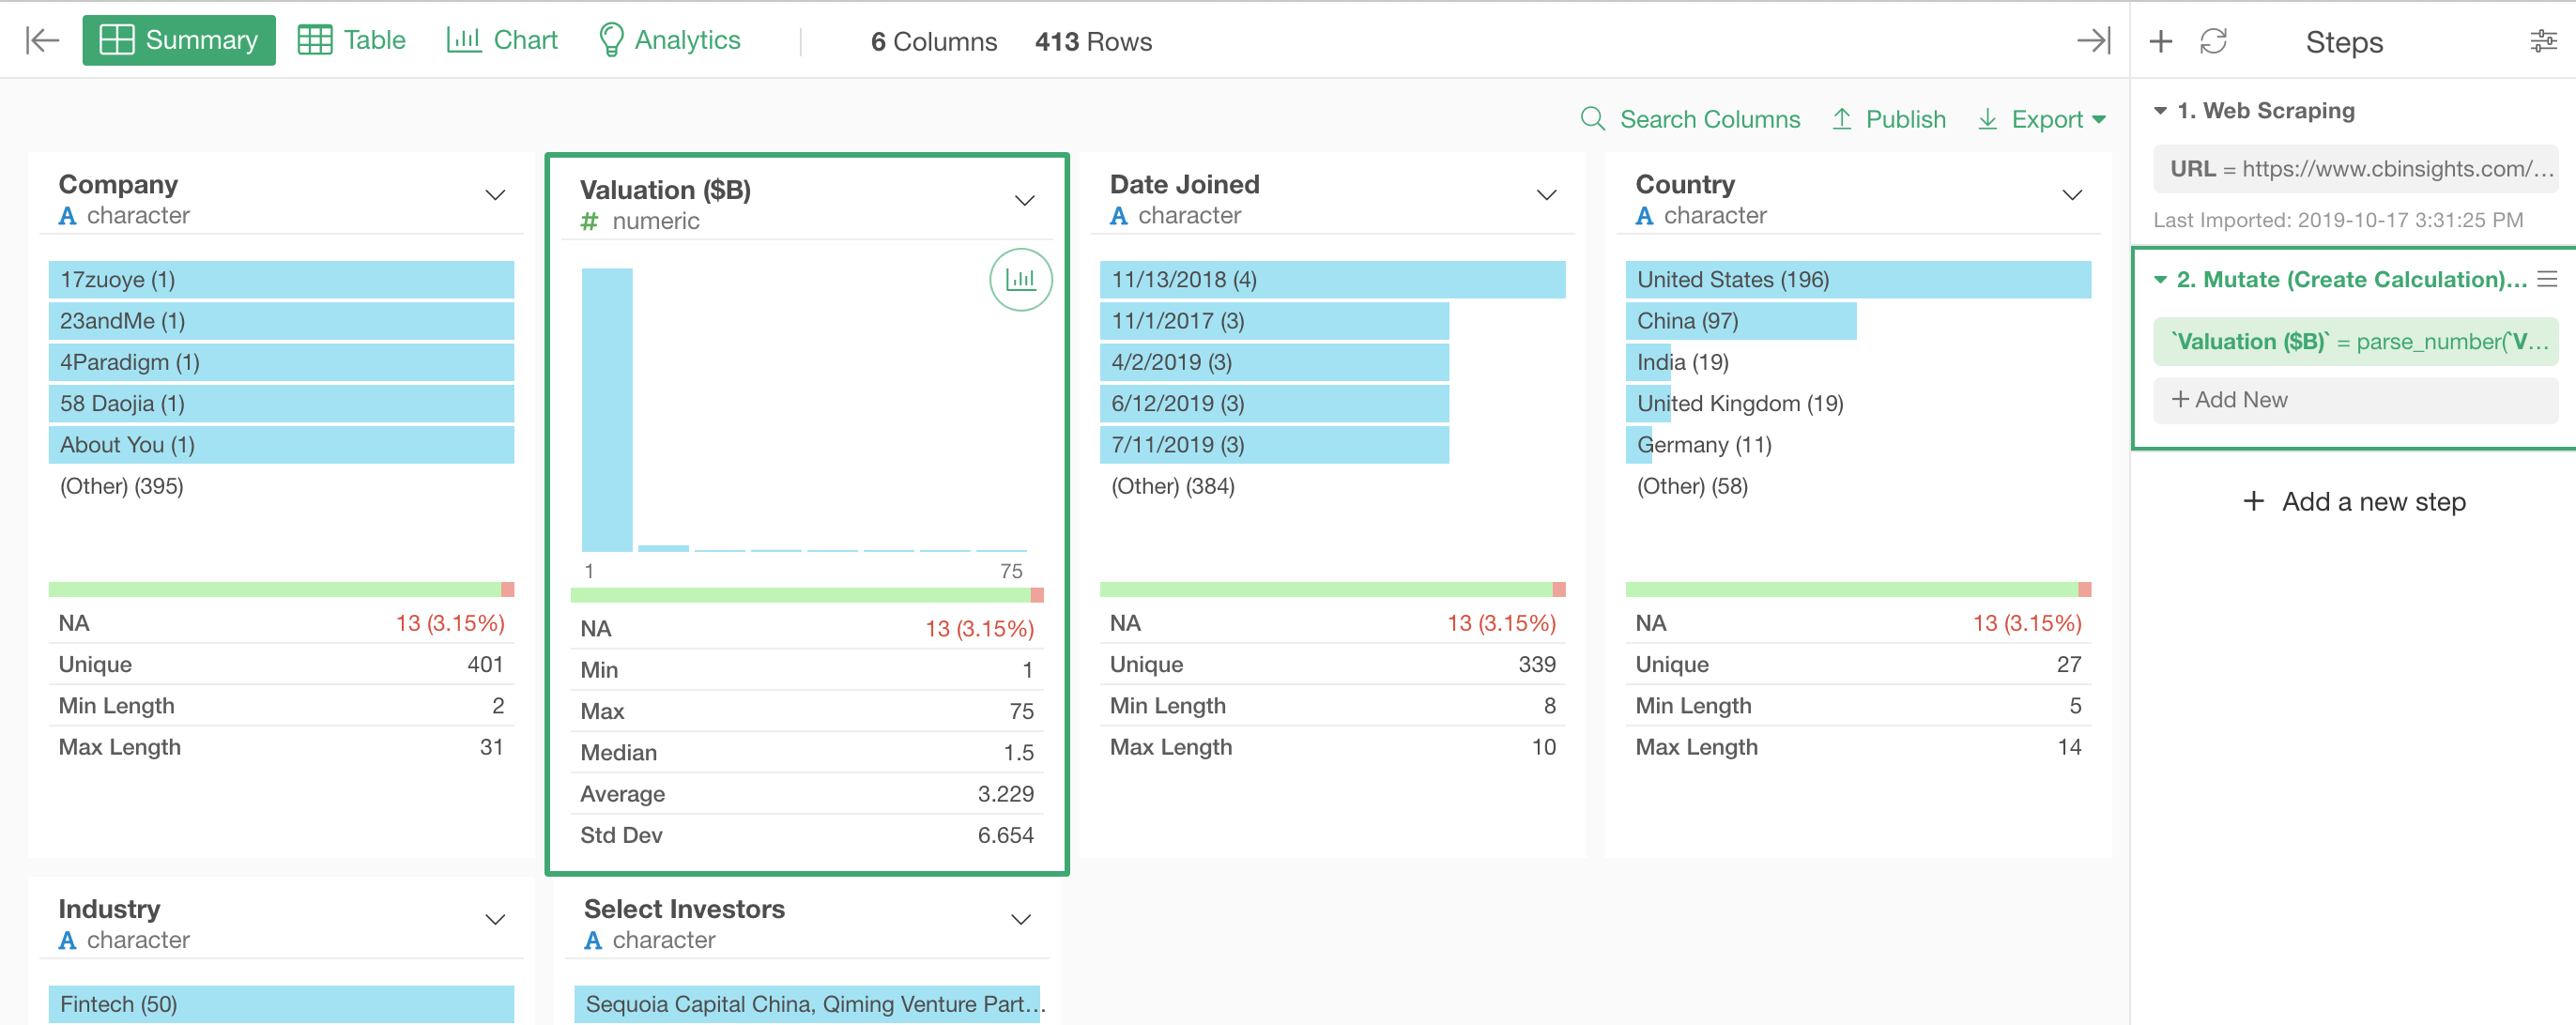
Now it’s shown as Numeric data type column and the chart has changed to a histogram visualizing the numeric distribution.
Convert from Character to Data/Time
Next, let’s take a look at ‘Date Joined’ column.
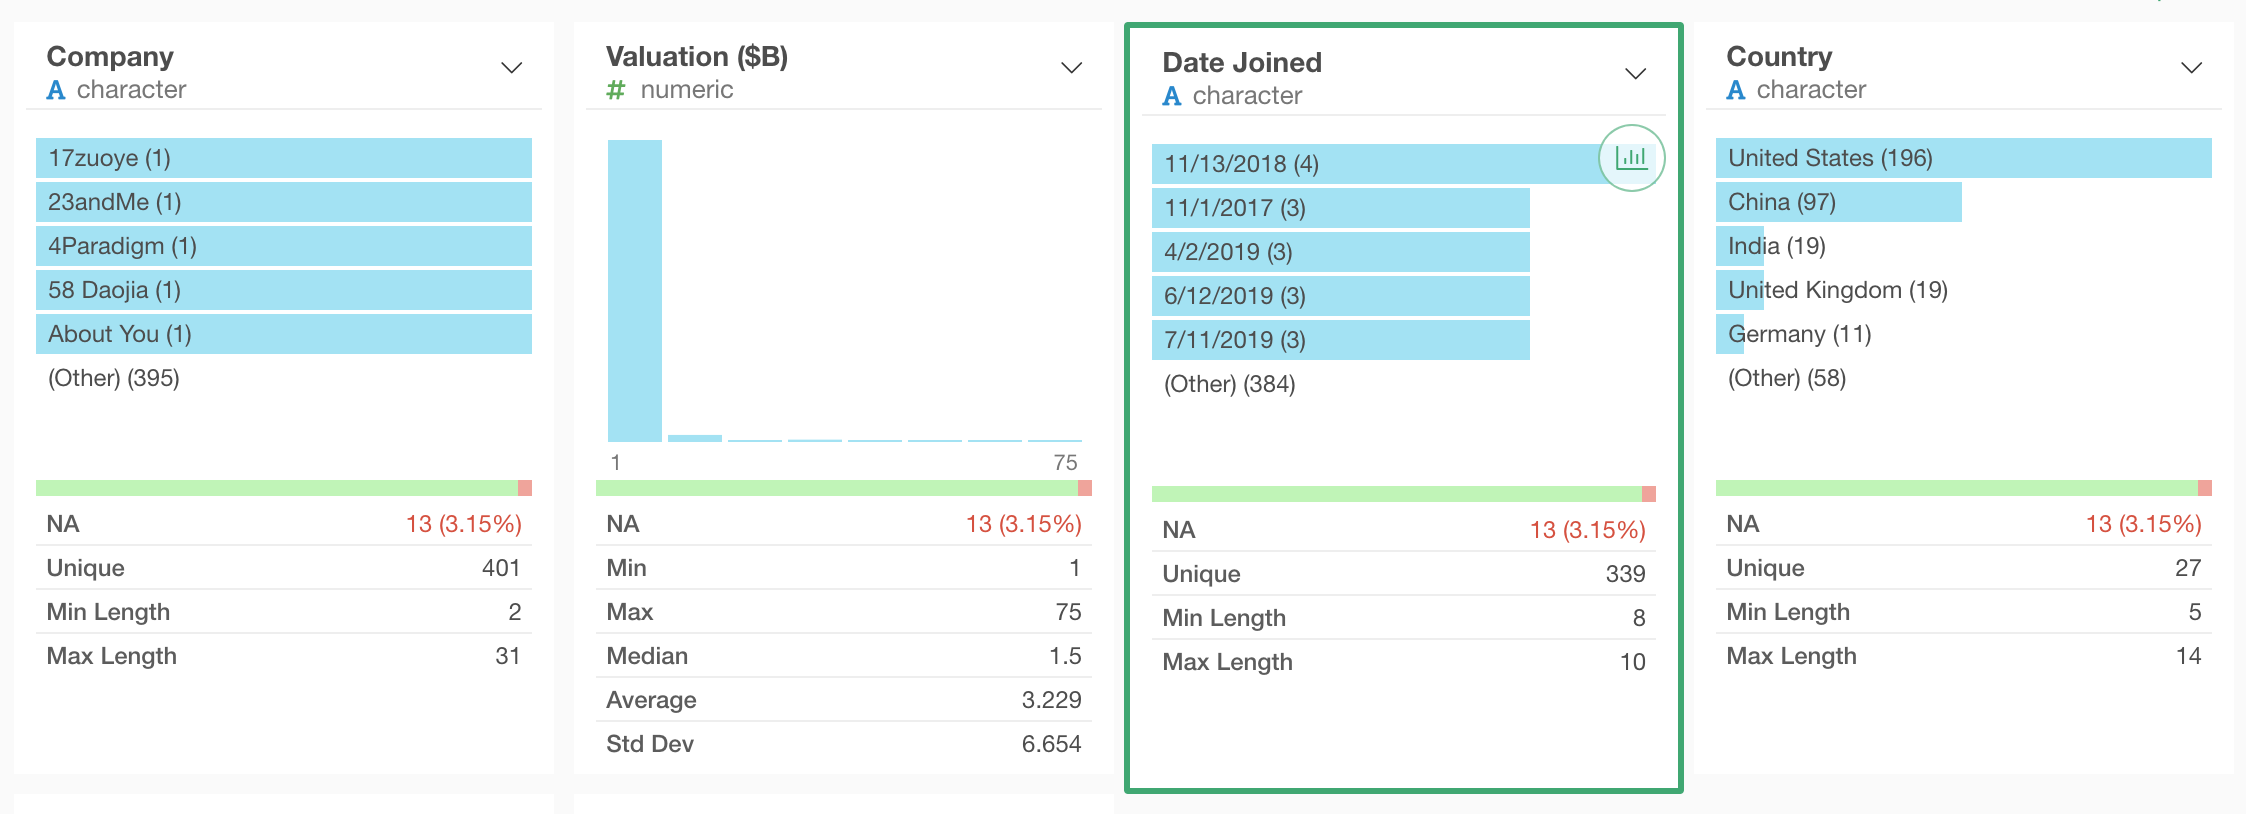
This column is supposed to be showing the date when a given company became a Unicorn, but it’s registered as ‘character’ data type.
We can convert this to Date data type quickly.
Select ‘Change Data Type’ -> ‘Convert to Date / Time’ -> ‘Month, Day, Year’ from the column header menu.
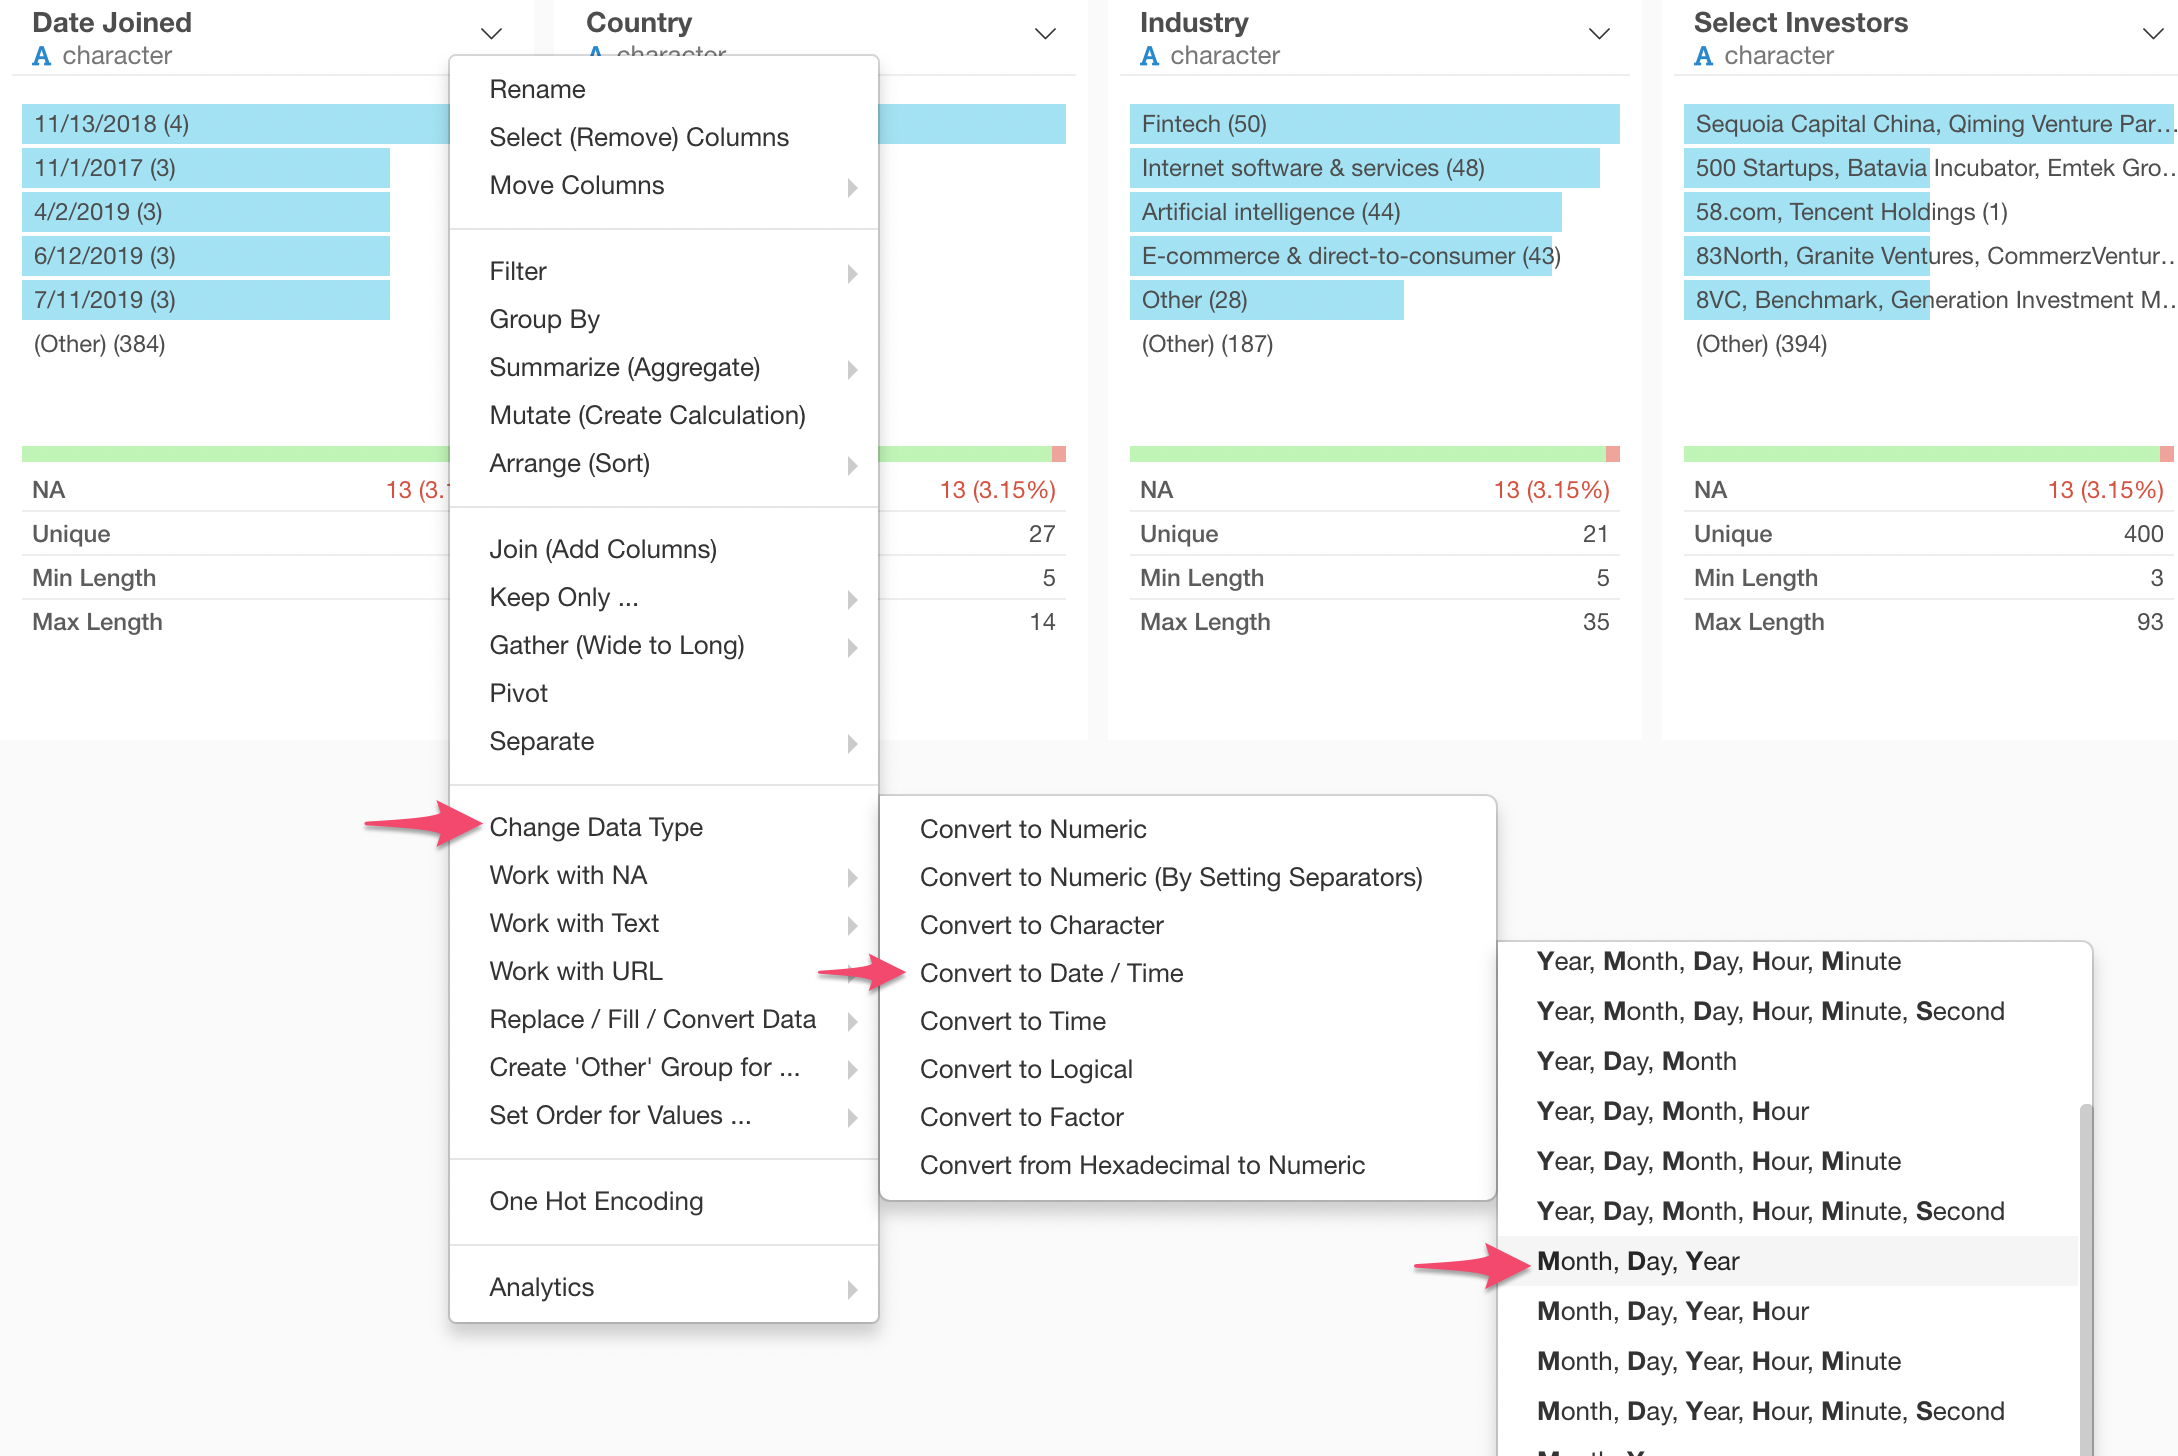
You want to select the entry that reflects the order of the date components (e.g. year, month, day).
In this case, we have the date data following the order of Month, Day, and Year, this is why we chose the menu of ‘Month, Day, Year’.
This will open the Mutate dialog with ‘mdy’ function populated.
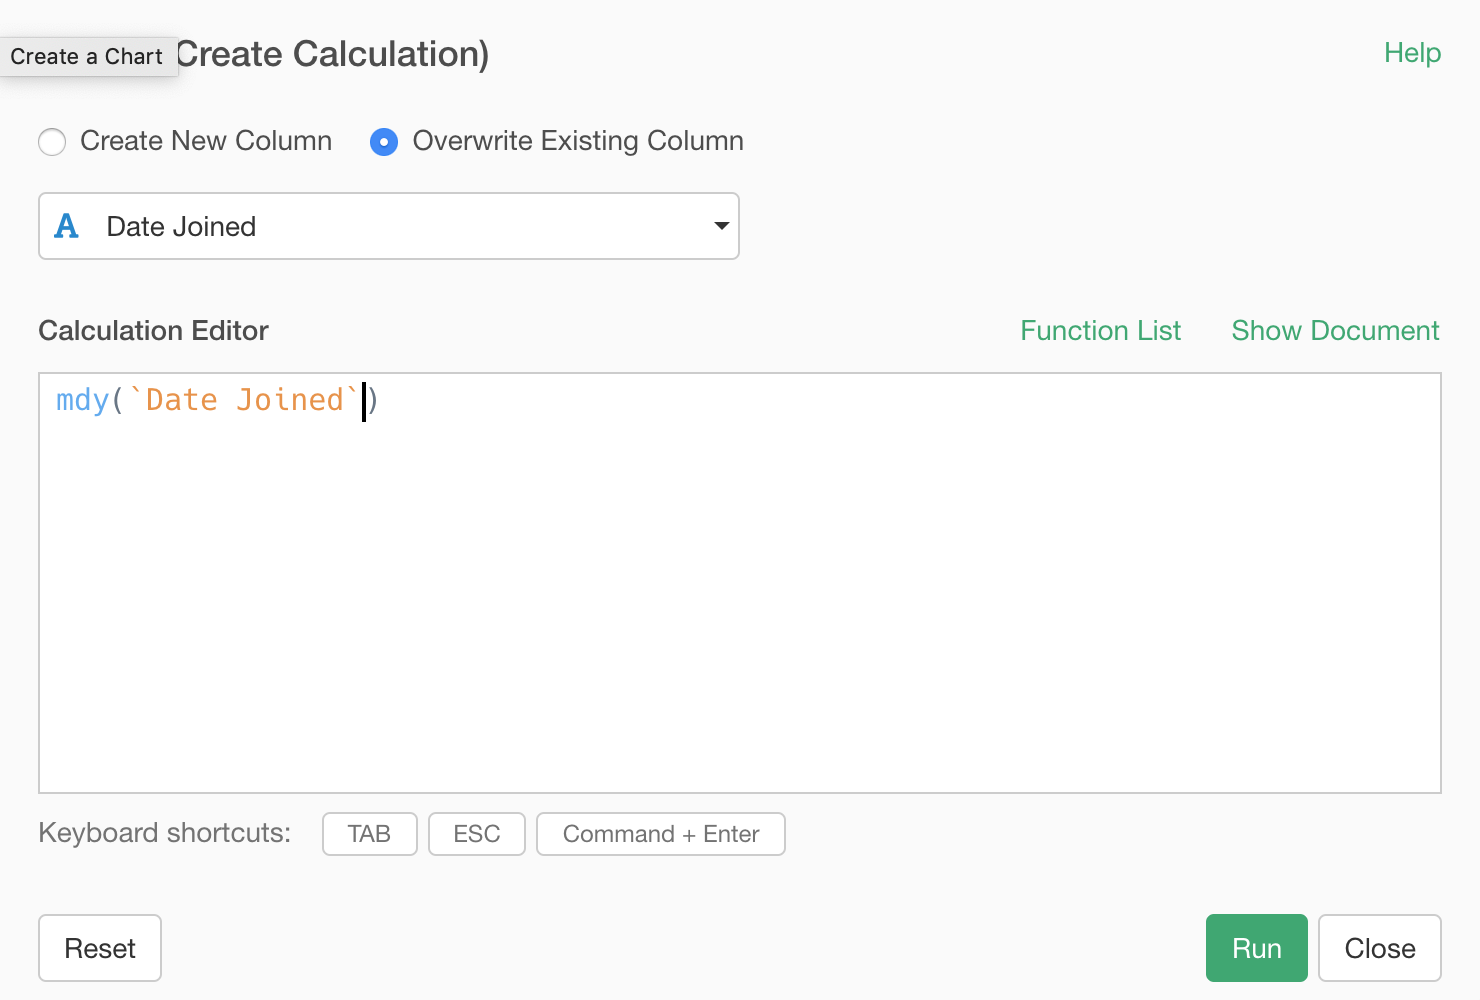
This function name ‘mdy’ stands for the initial letters of ‘Month, Day, Year’. And yes, there is a function called ‘ymd’ for ‘Year, Month, Day’. There are as many functions as the variations of the combinations.
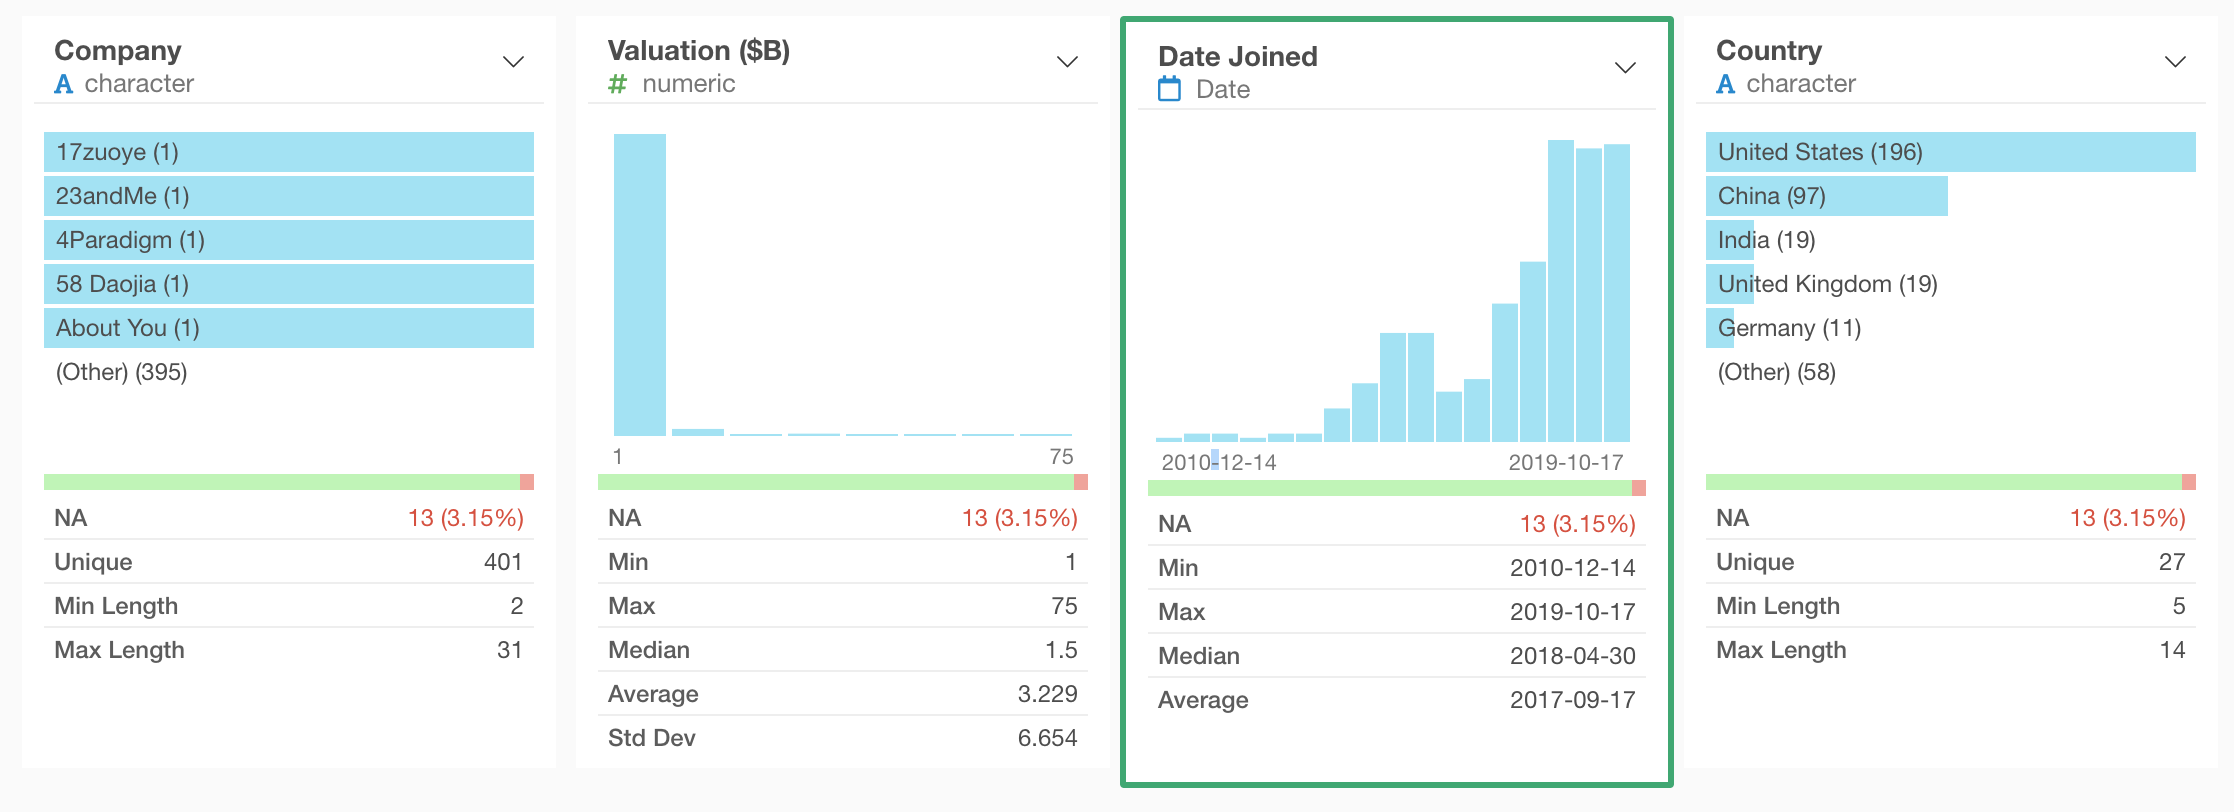
Anyway, you can run this and see the ‘Joined Date’ column being converted to ‘Date’ data type, and you will see a histogram visualizing the data distribution along the time line.
How to Use Exploratory
There are many other ‘How-to’ notes, check them out from this list page.
Also, we have put together ‘How to start Exploratory’ note where you can find a series of our hand picked ‘how-to’ to get you started quickly.