How to Filter Only Ones that has Data in All Groups like Years?
Sometimes when you have countries (or customers) that don’t make purchases from your store for all the years. That’s not a bad thing, just part of the business. ;)
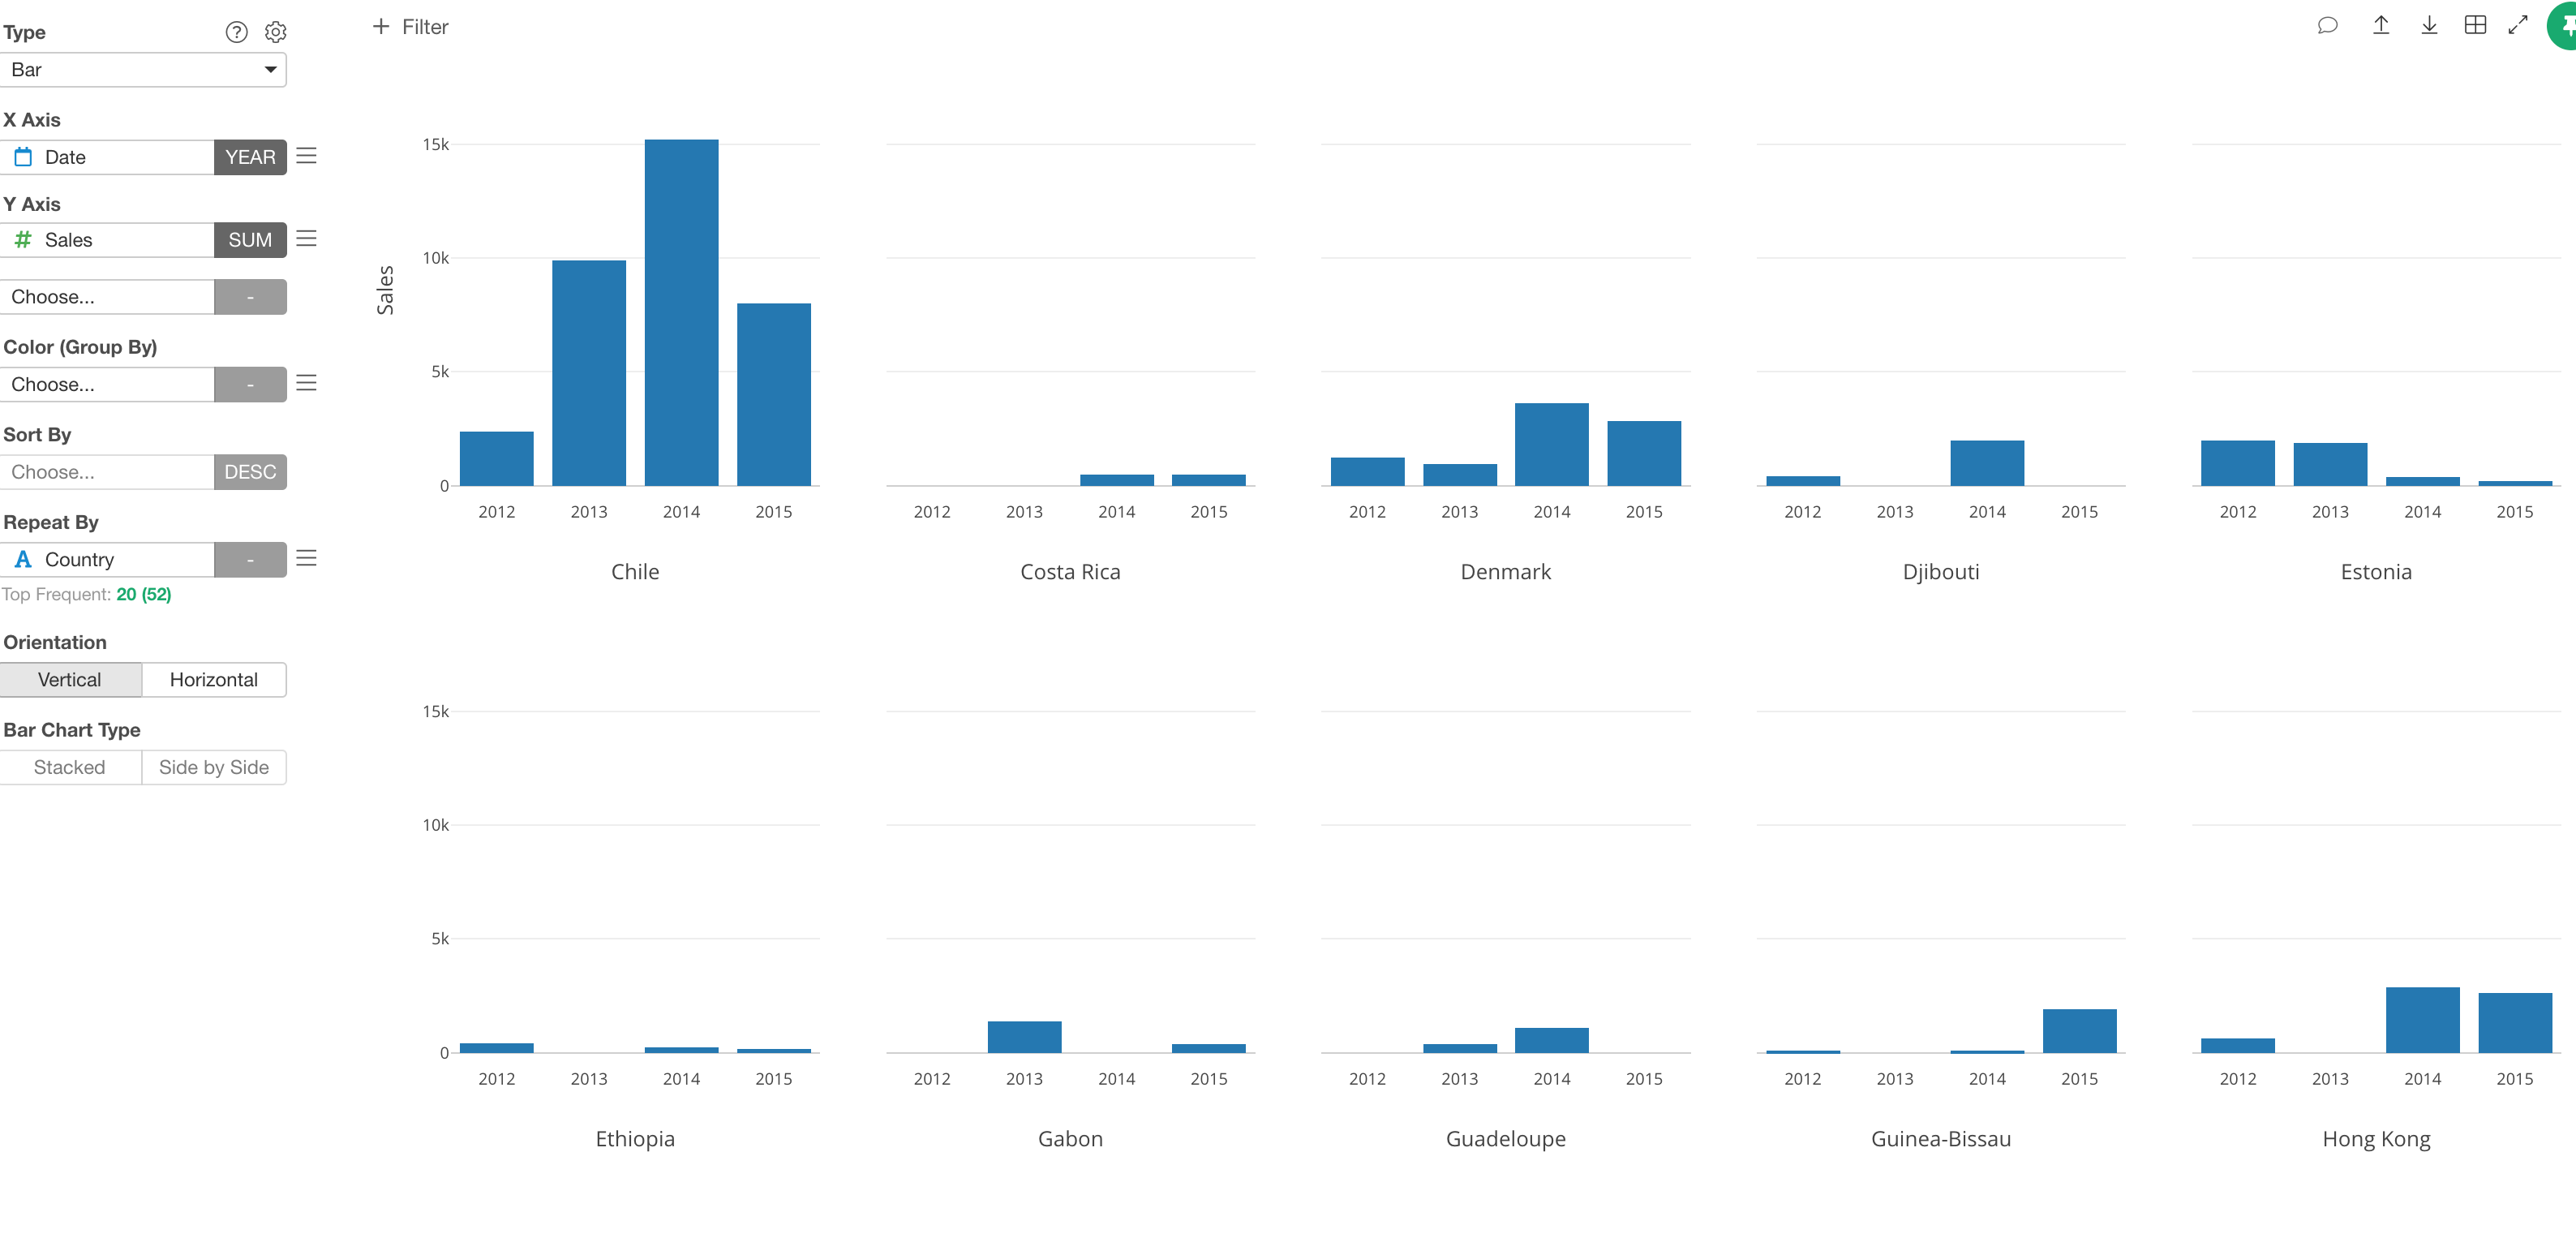
As you can see the above, some countries have 4 bars, which means they have made at least some kind of purchases in all the 4 years of 2012, 2013, 2014, 2015.
However, you can also see that some countries don’t have any data in some years.
Now if we want to show only the countries with 4 years of data (or bars), what can we do?
We can take the following 4 steps of the data wrangling to get the job done.
- Extract Year information from Date column.
- Group By the data frame by Country column.
- Create a calculation with Mutate step to count the number of years.
- Filter the data.
Let’s take a look.
Extract Year from Date
First, you want to extract Year part of the information (or text) from the date column.
Select ‘Extract’ -> ‘Year’ from the column header menu.
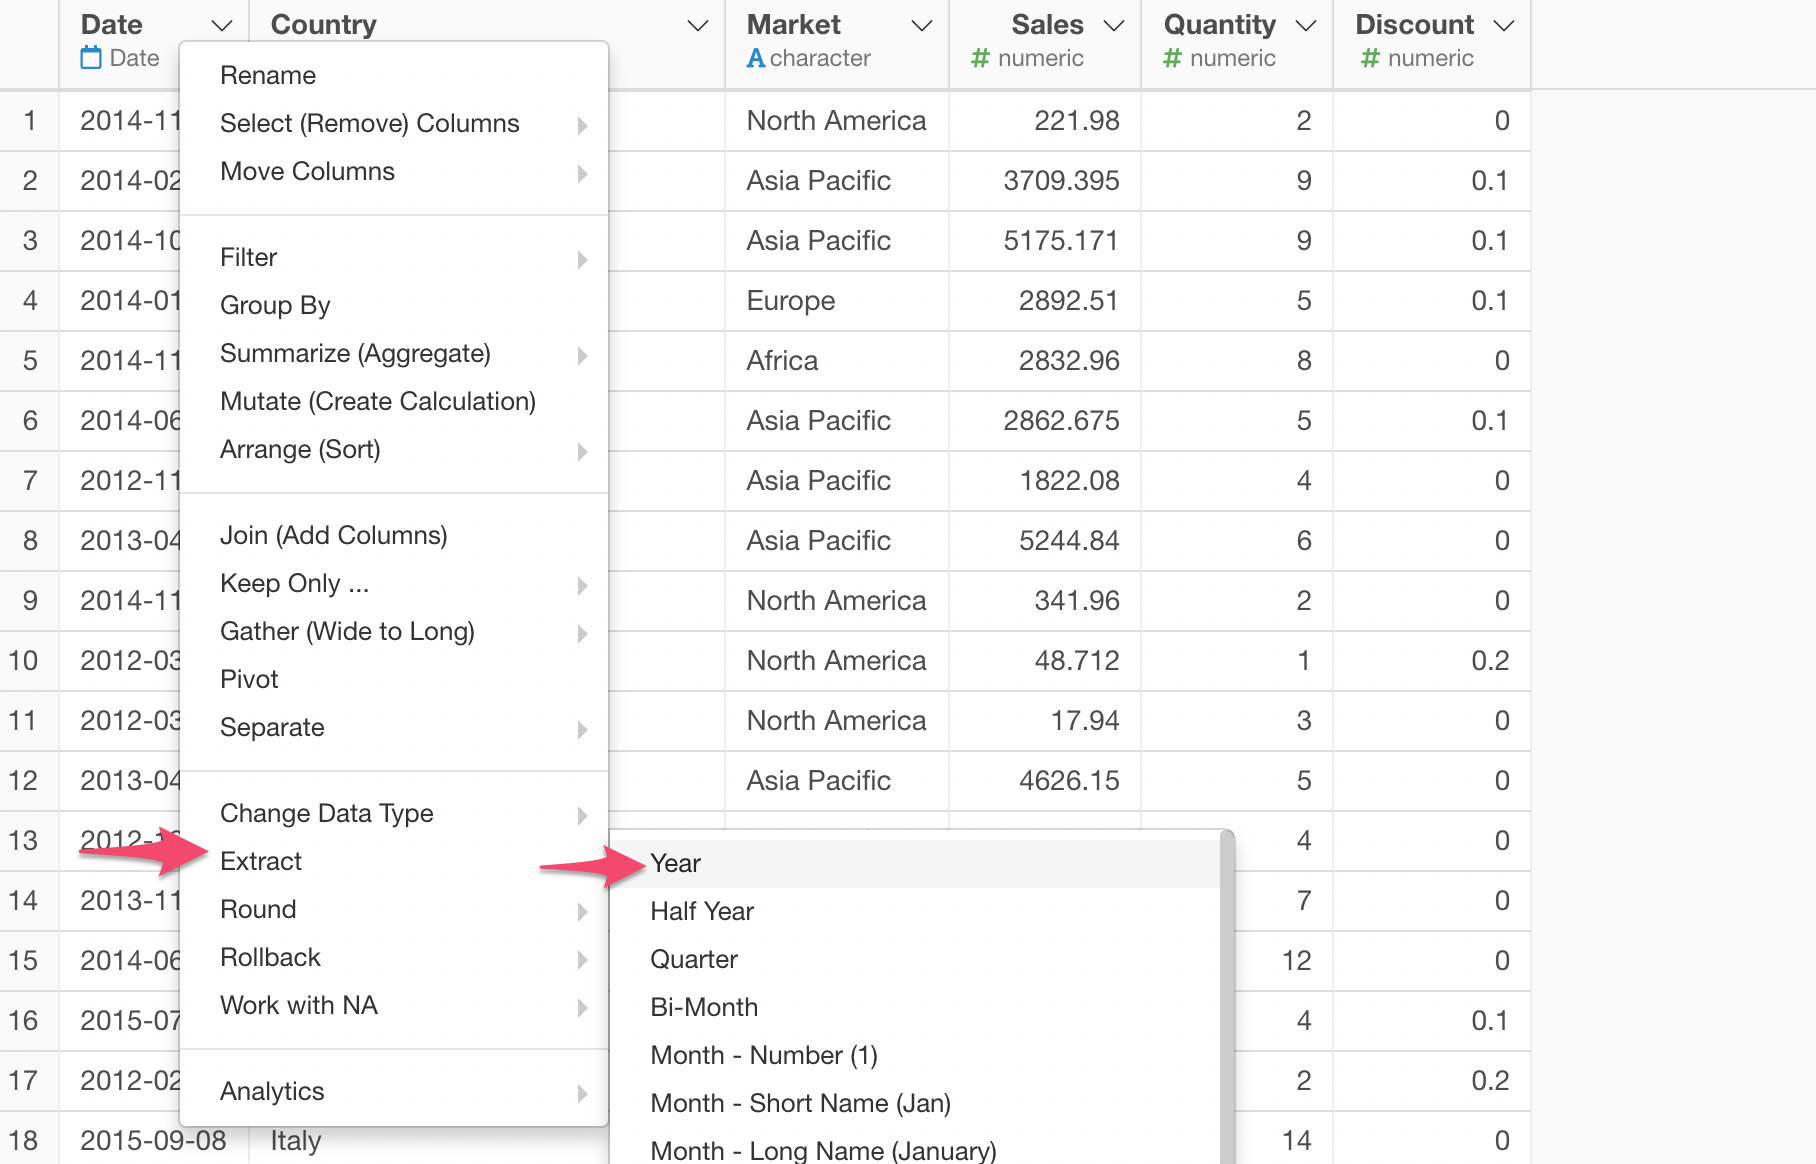
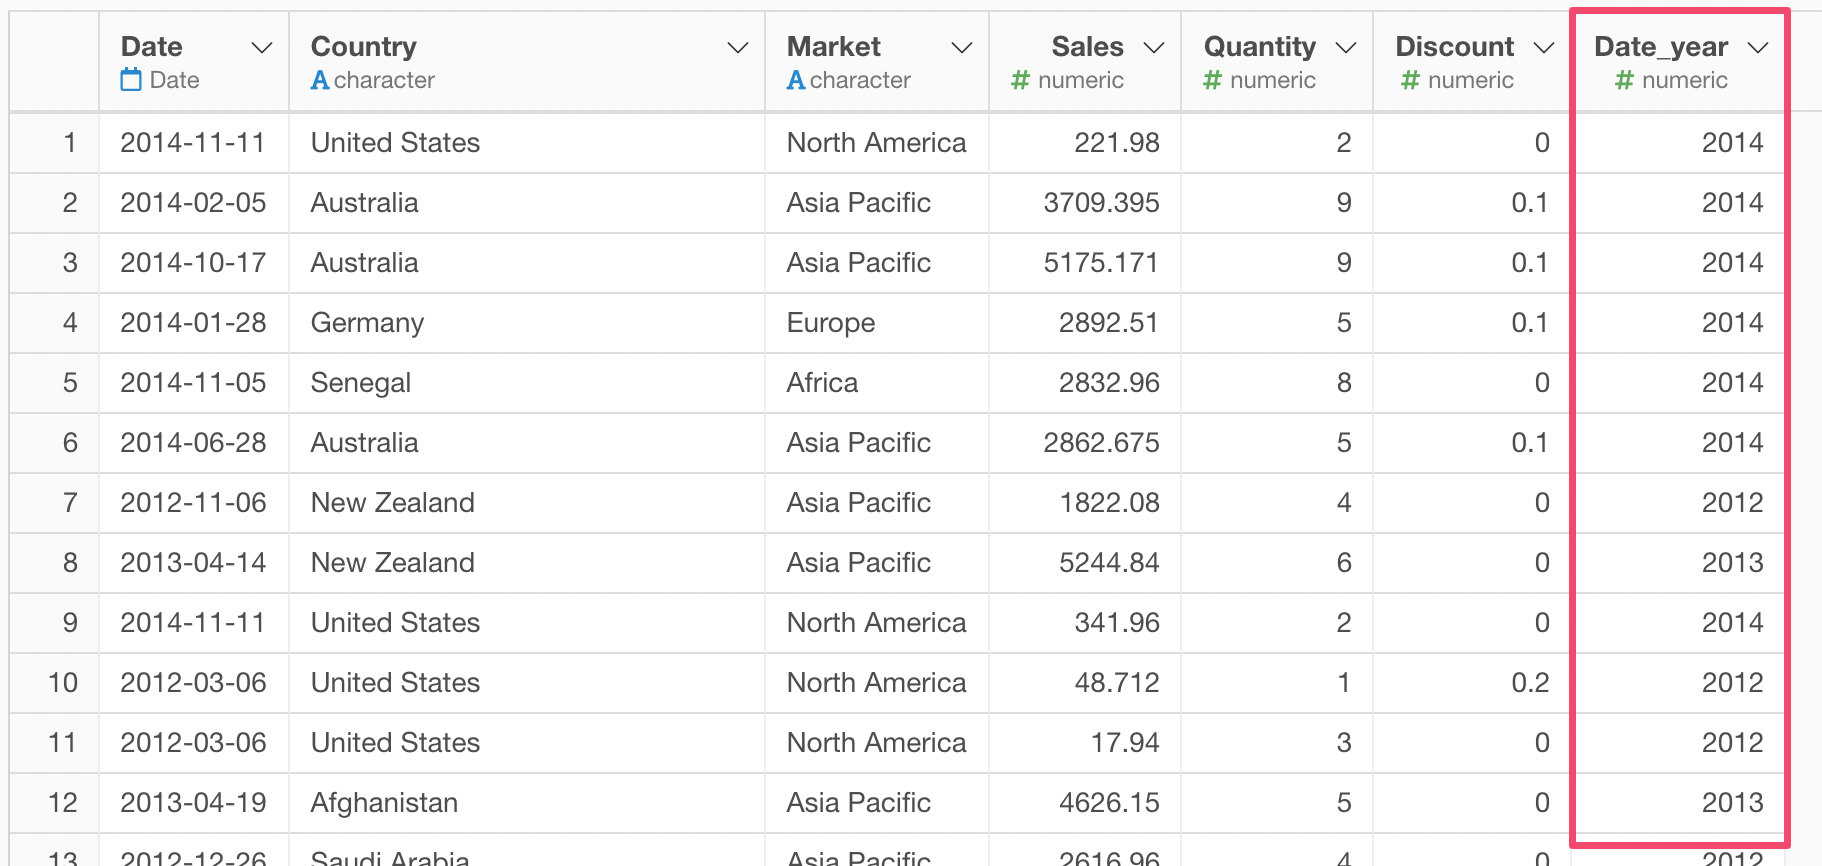
You will get a column with ‘Year’ information.
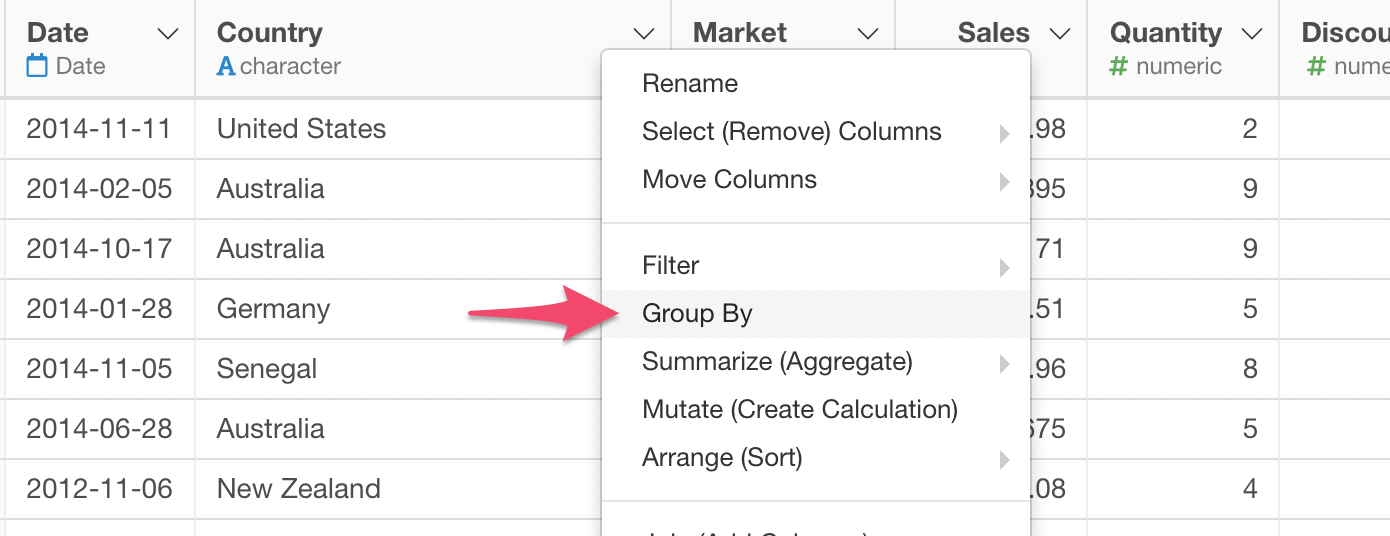
Group Data Frame by Country
The Group By command is pretty powerful.
Usually, you would use it as part of Summarize (or aggregate) operation. But you can run other commands such as Mutate (Create Calculation), Filter, etc. against a data frame that is grouped by, say, country by using Group By command.
Here, we want to calculate ‘how many years of purchases’ for each country, but we don’t want to summarize the data because we don’t want to lose all the rows and columns.
So this is what we want to end up with.
So the countries with 2 years of purchases have 2 in each row of the country.
To do this, we can group the data frame by ‘Country’ with Group By command, then use Mutate step to count the unique number of Year values.
Select the country column and ‘Group by’ from the column header menu.
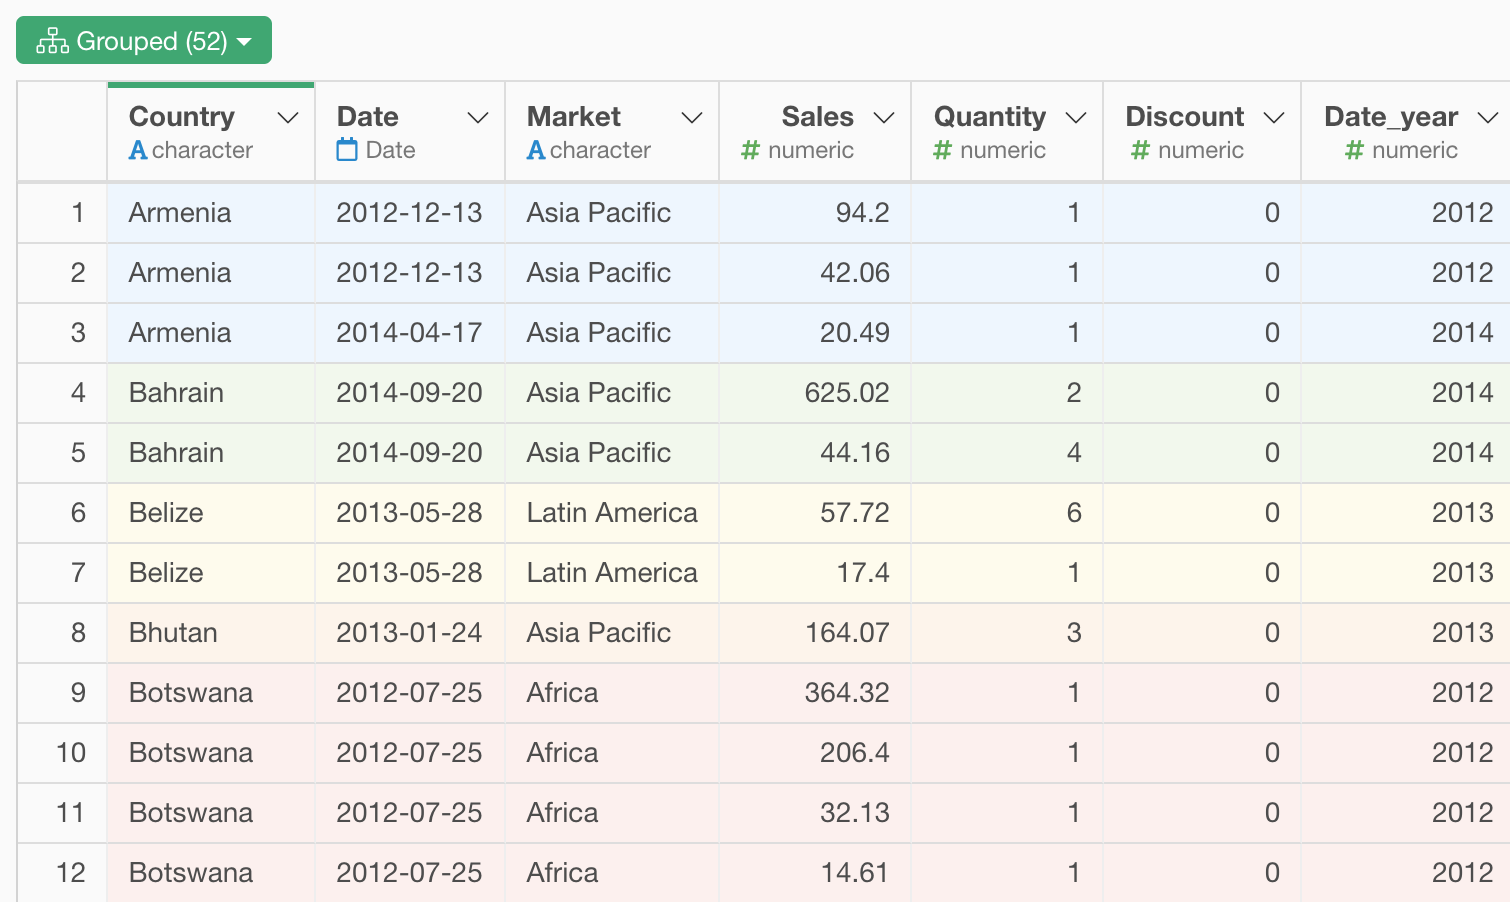
Now, each country is colored by a different color.
Count Number of Years for each Country with Mutate, not Summarize
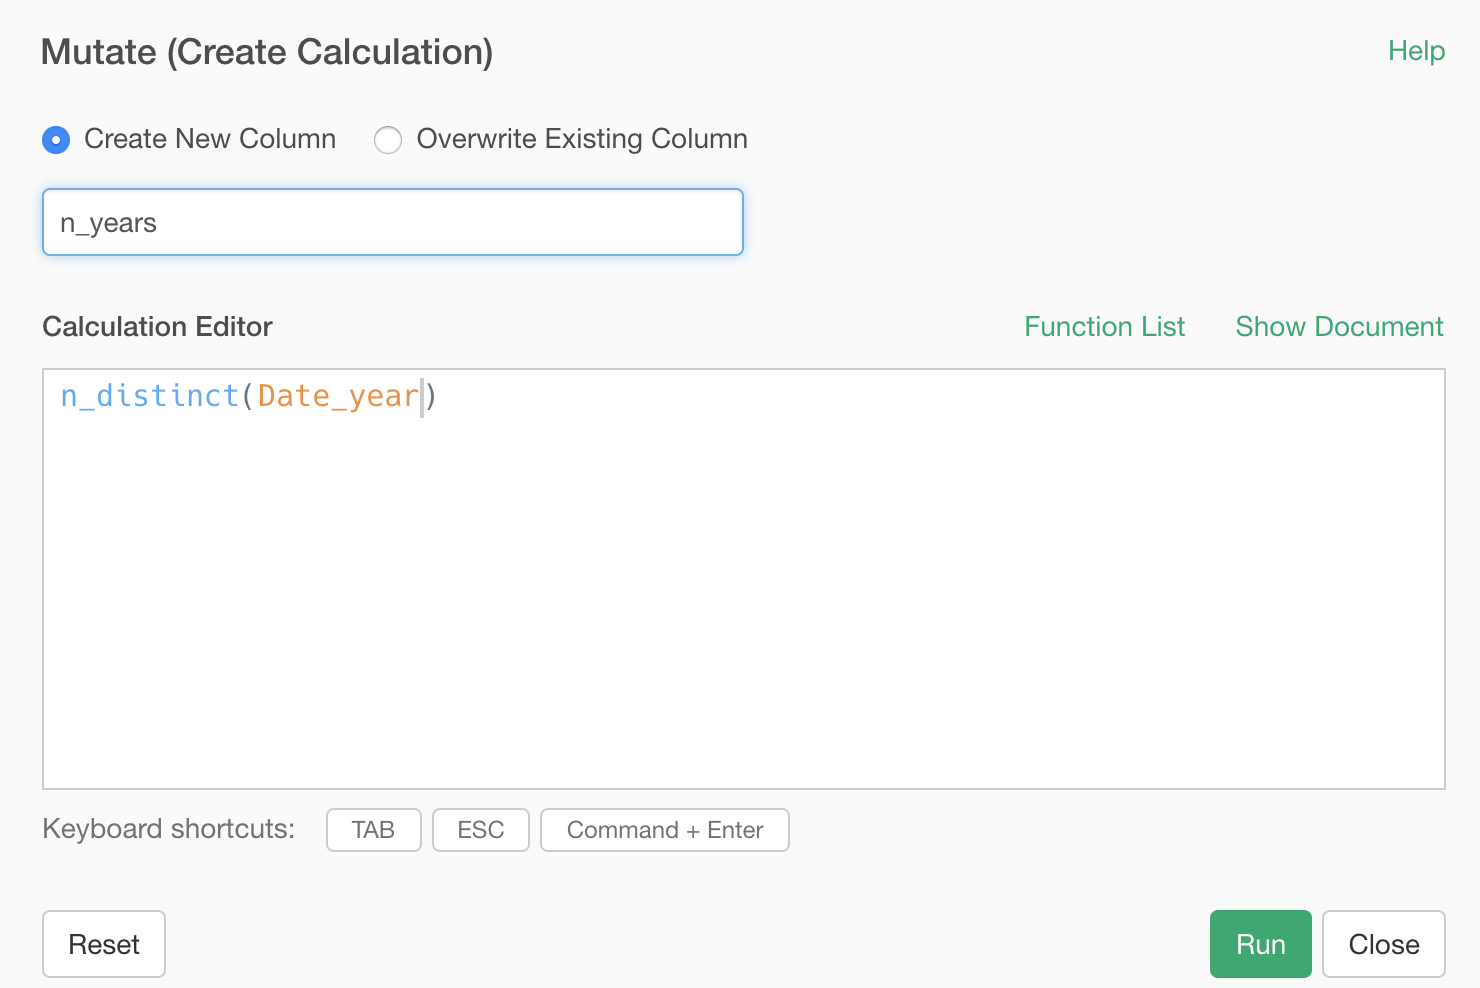
Now, we can count the number of years for each country by using the “n_distinct” function.
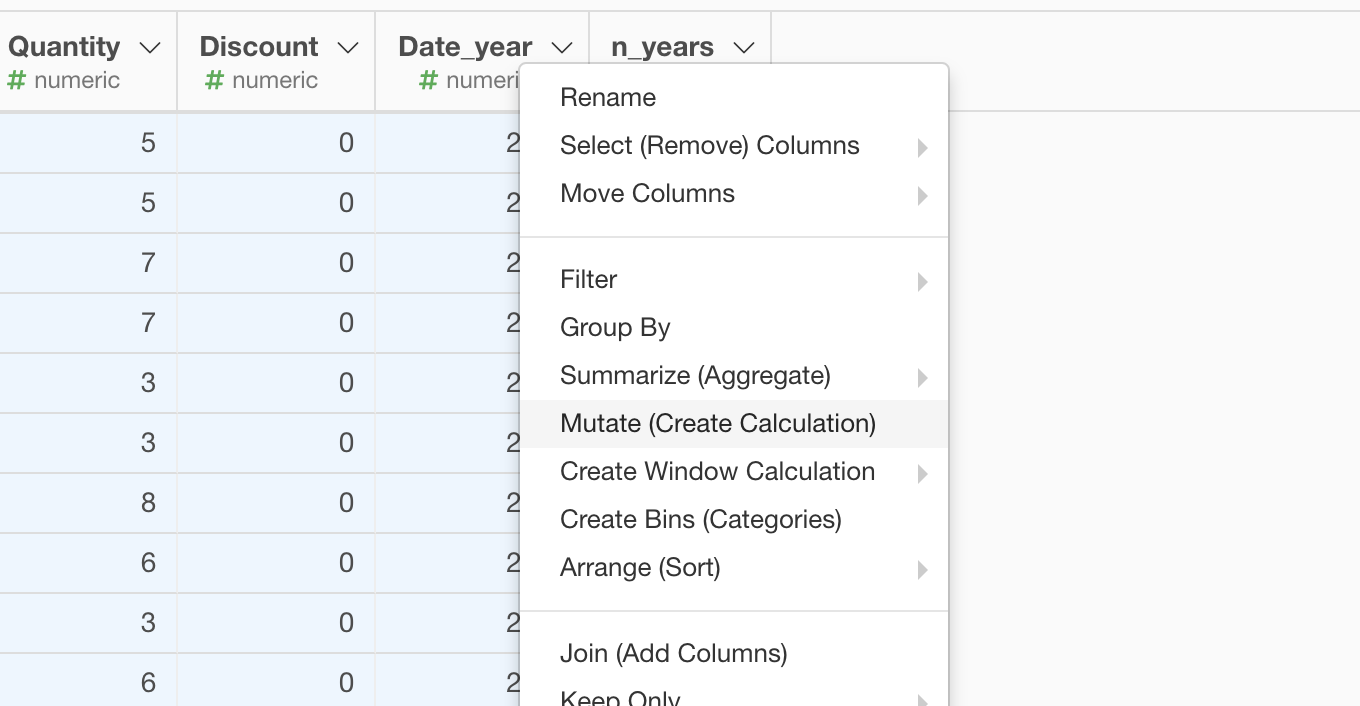
Select the ‘Year’ column and ‘Mutate (Create Calculation)’ from the column header menu.
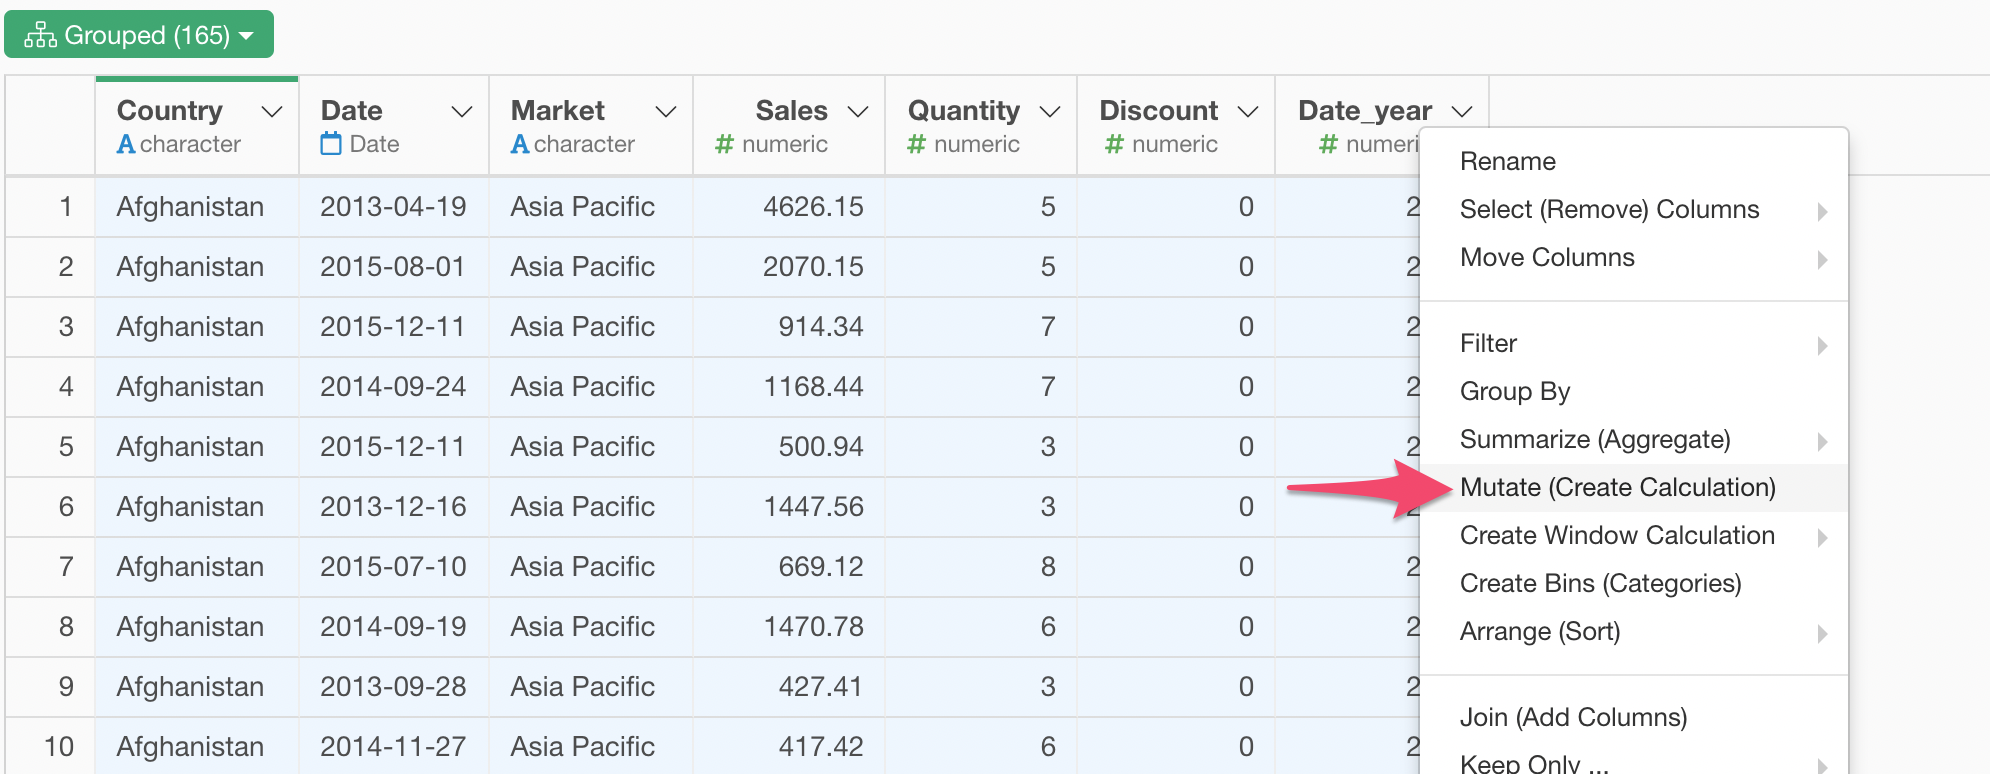
In the dialog, you want to type something like the below.
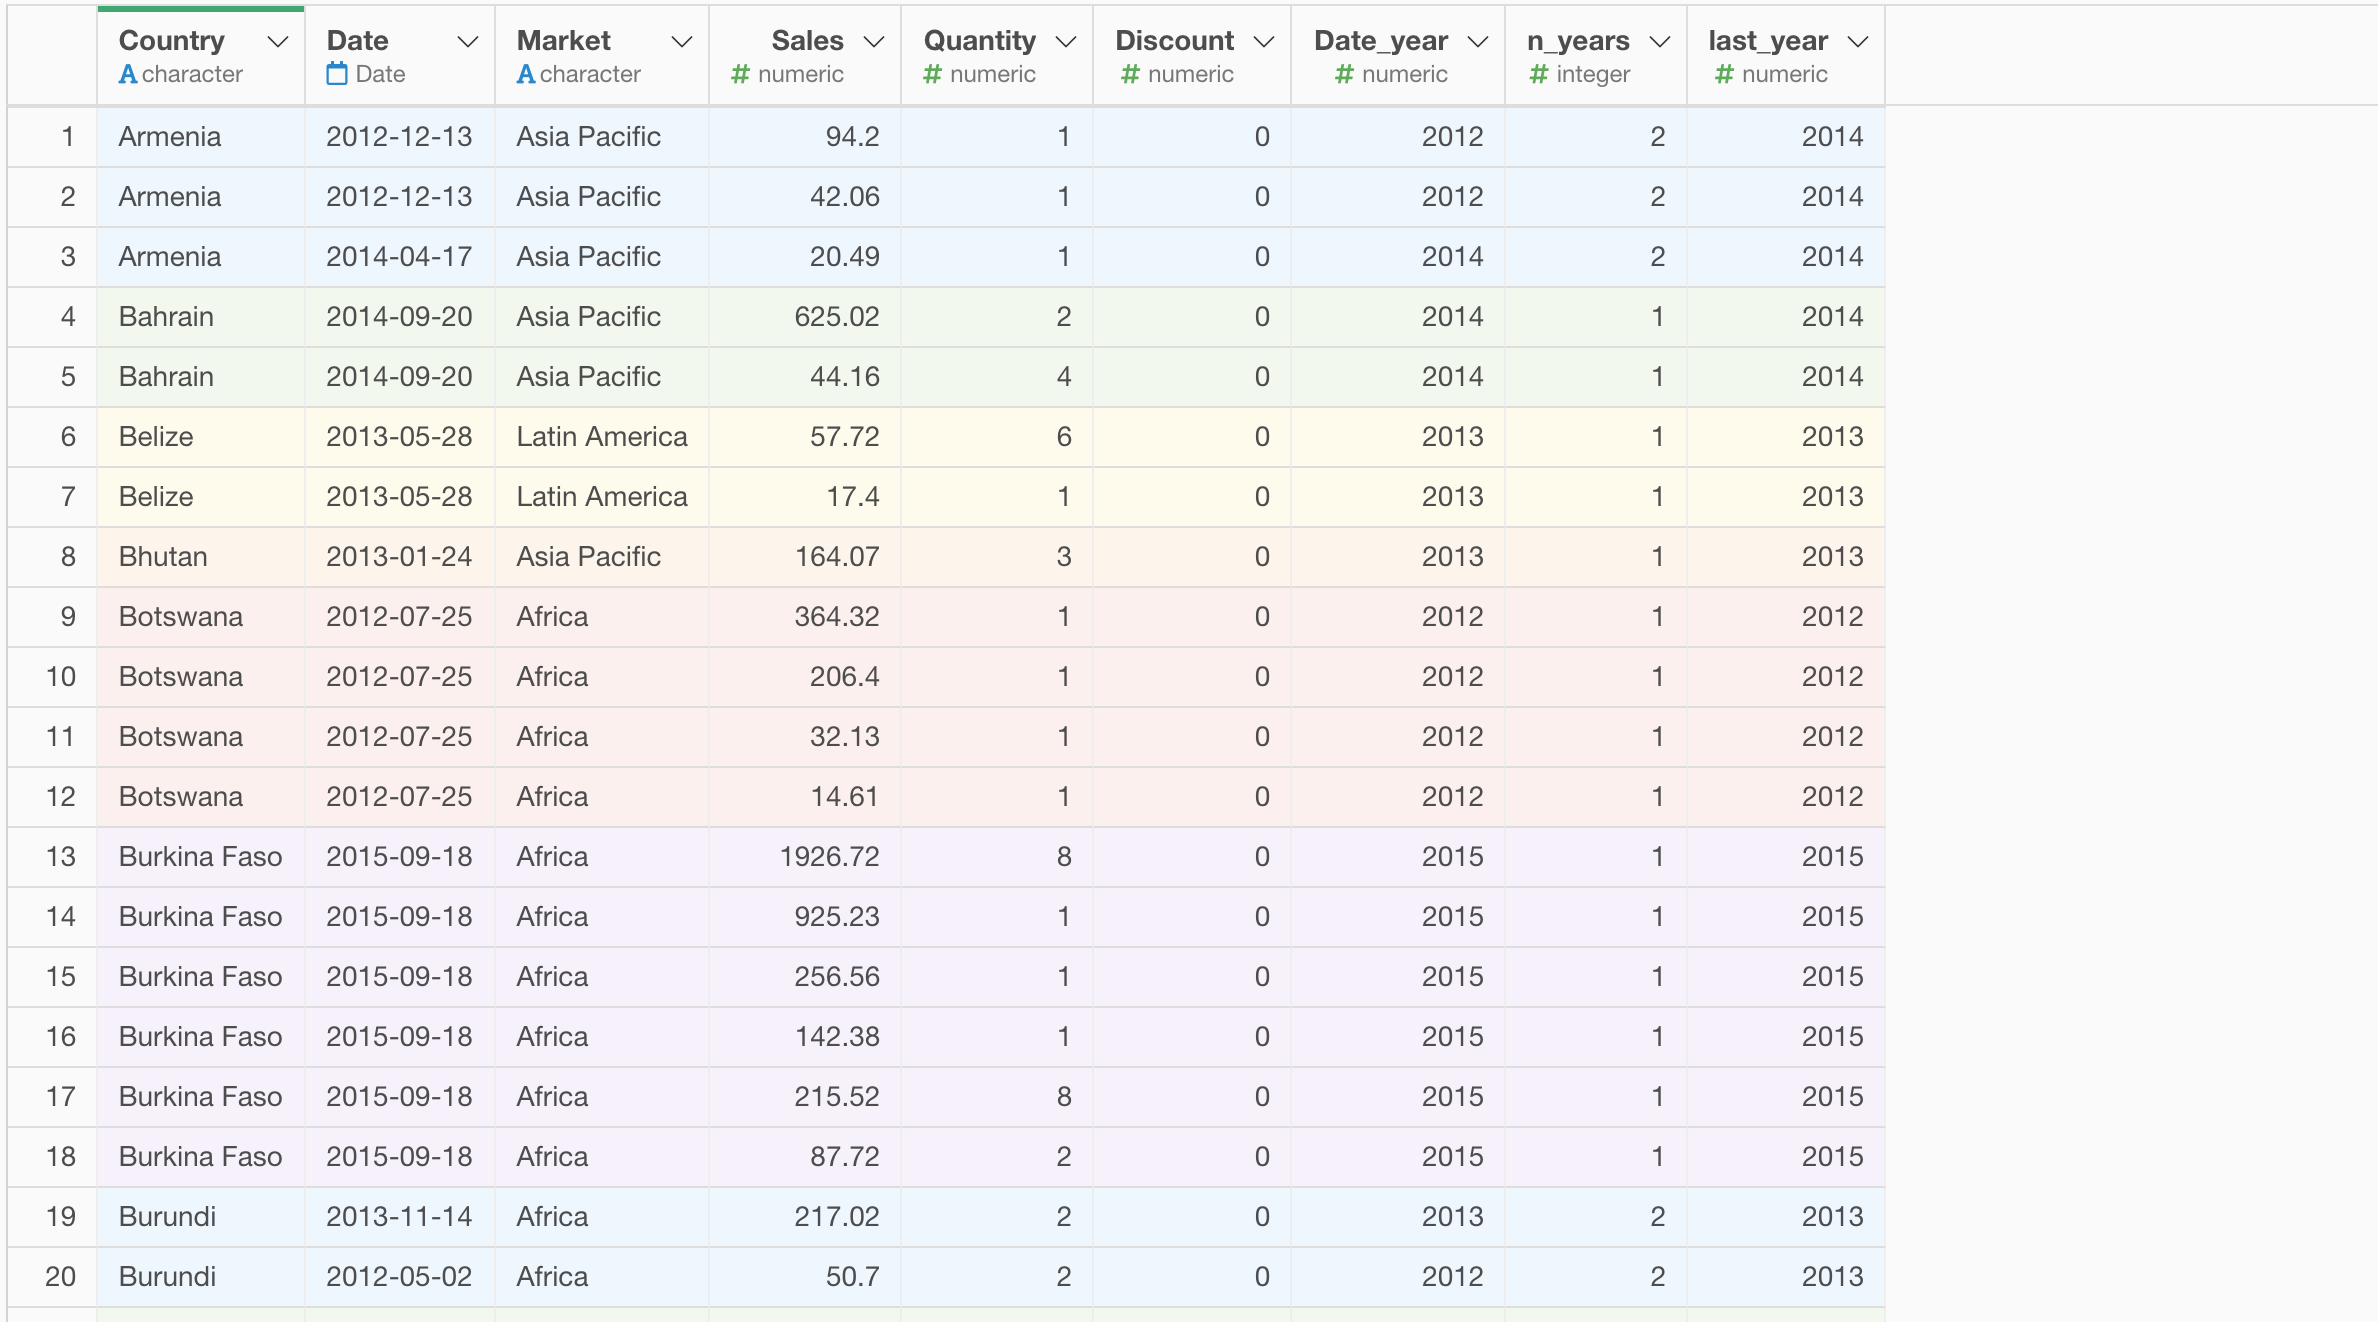
n_distinct(Date_year)This n_distinct function is to count the unique values from a given column.
This will count a unique number of years in each group and populate the value for each row, which means it will return a same value for each country.
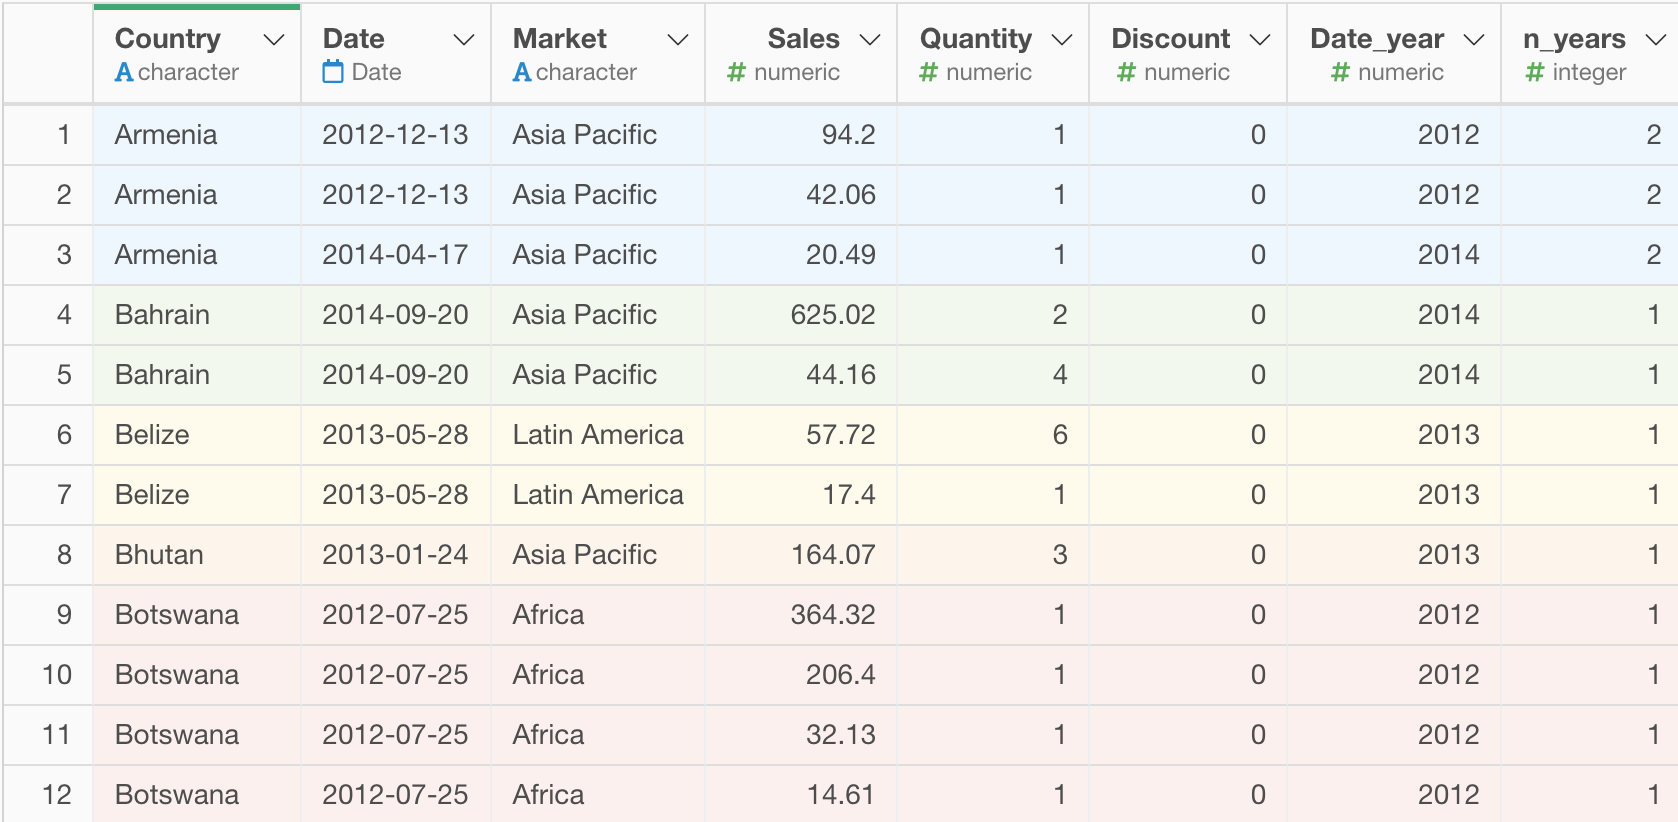
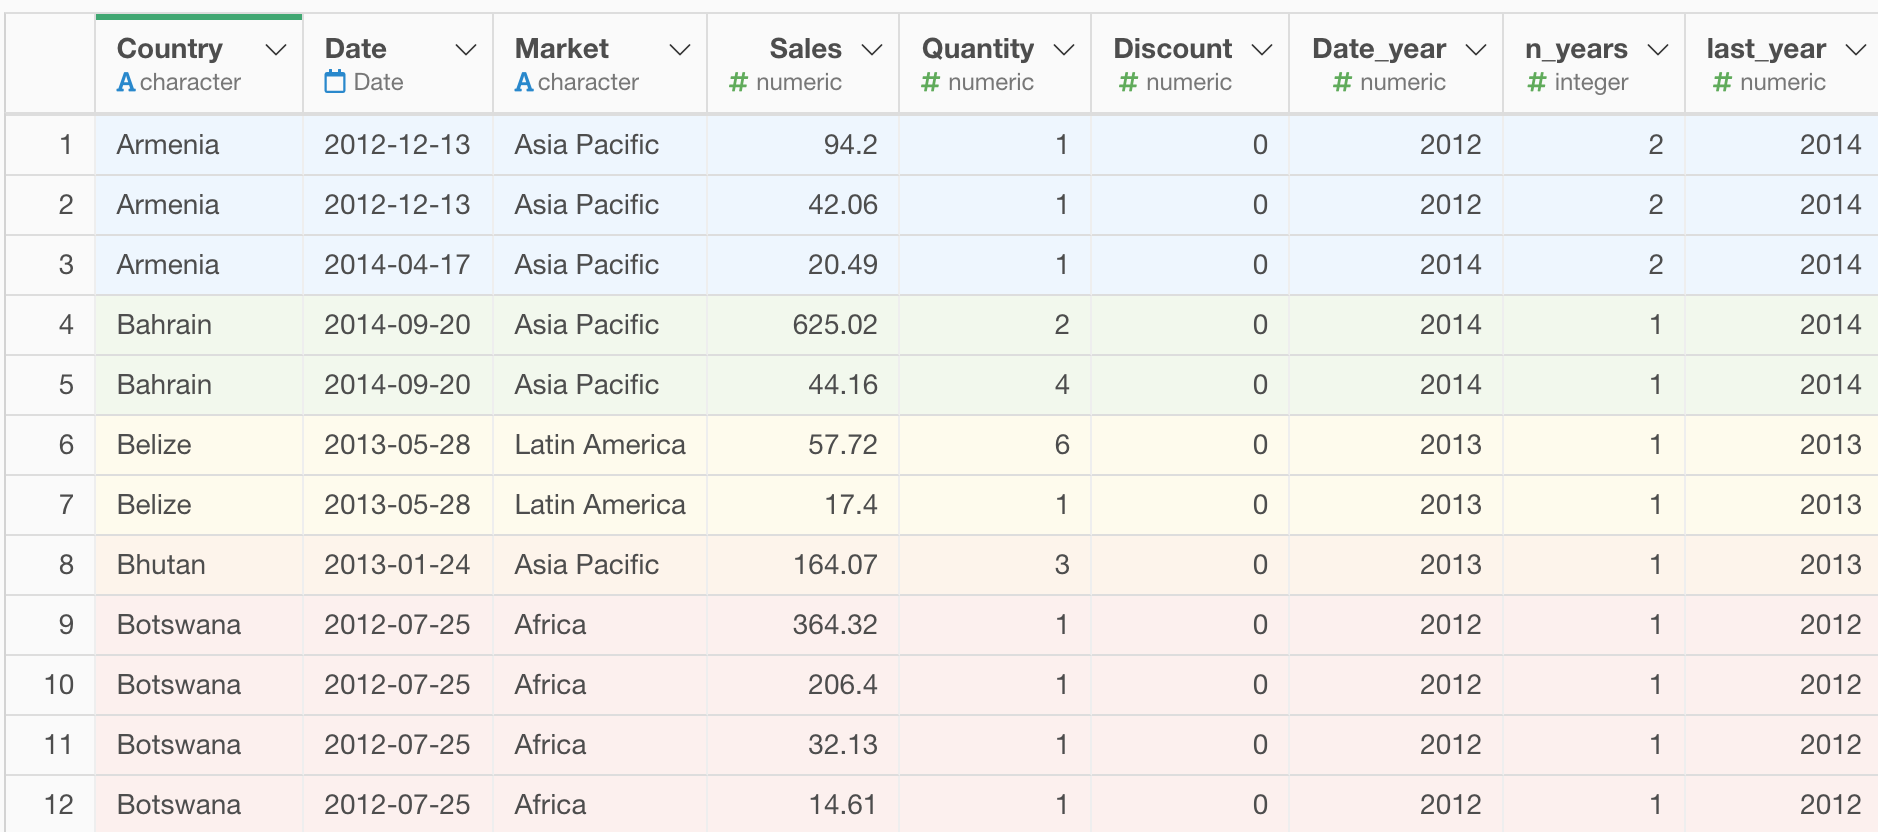
You can see ‘2’ being repeated for Armenia, this is because it has 2 years of data and every single row of Armenia have this same value.
Once you get these numbers, then the rest is easy, just a matter of filtering to keep the countries with ‘4’.
Show only Countries with 4 Years of Purchases
You can filter the data as Filter command step or use the Chart level filter inside the chart.
I’m going to use the Chart level filter here.
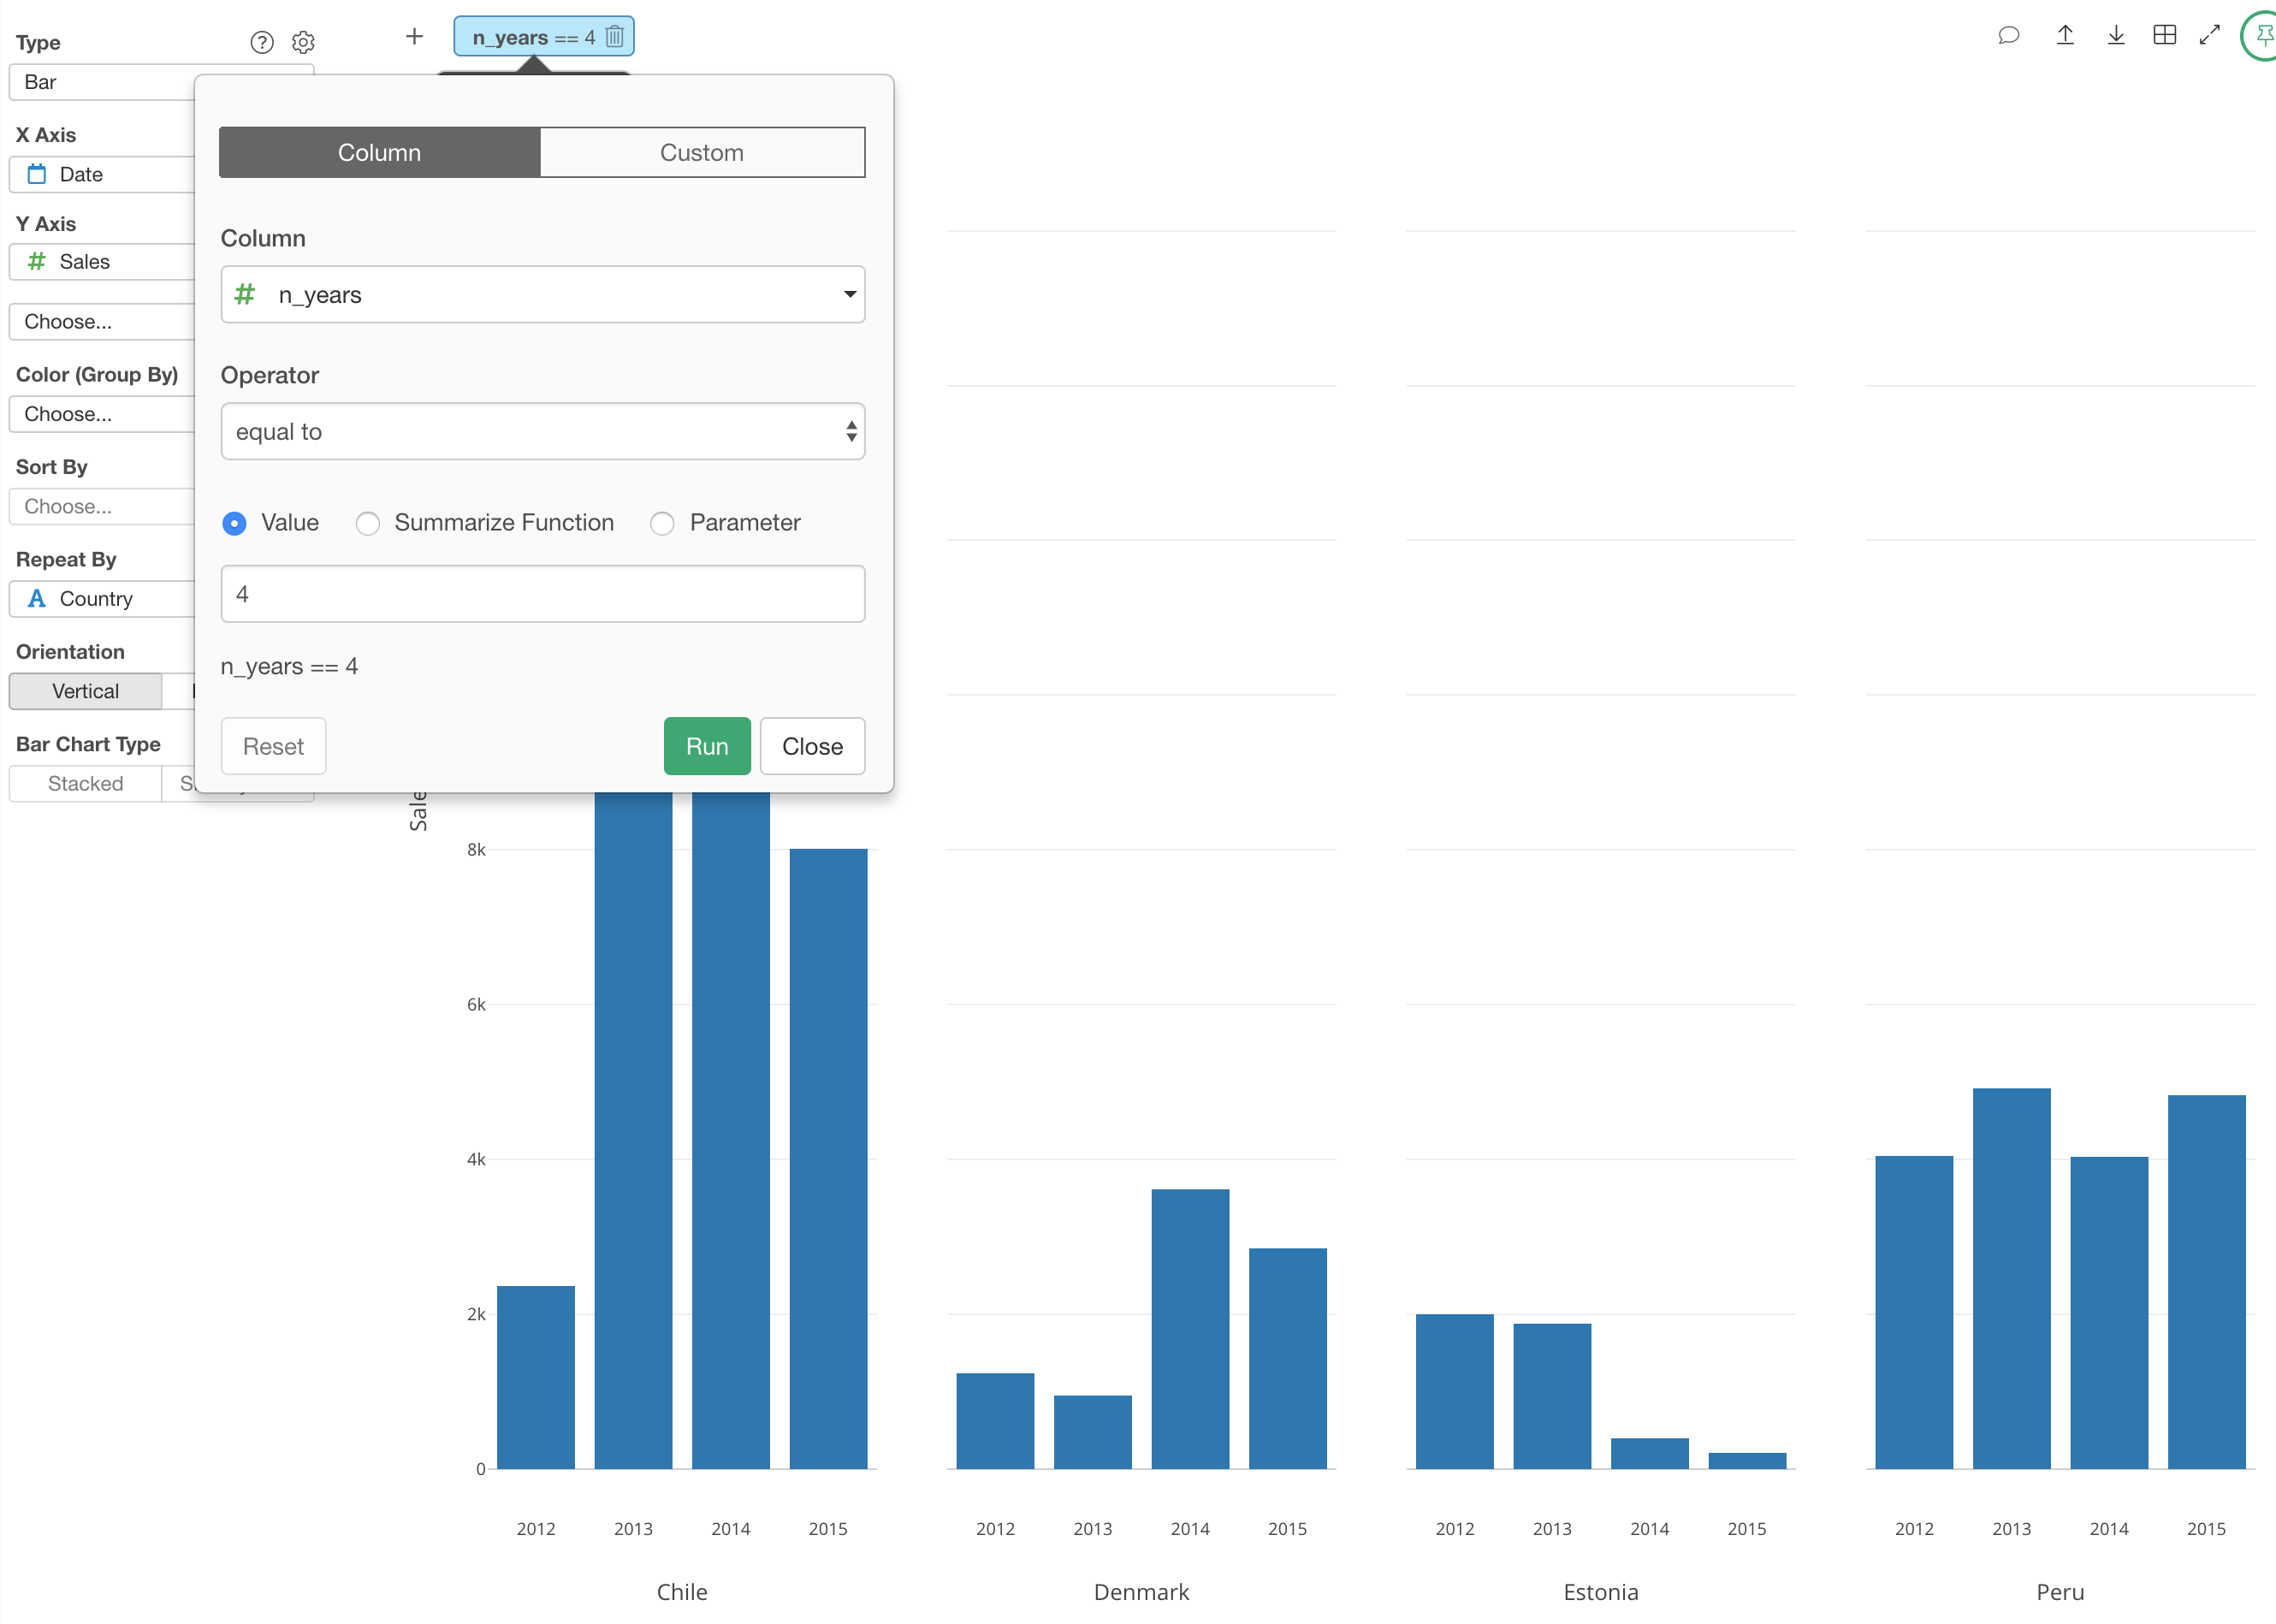
Now we can see only the countries that have purchased for all 4 years!
Wait!
You have a slightly different requirement?
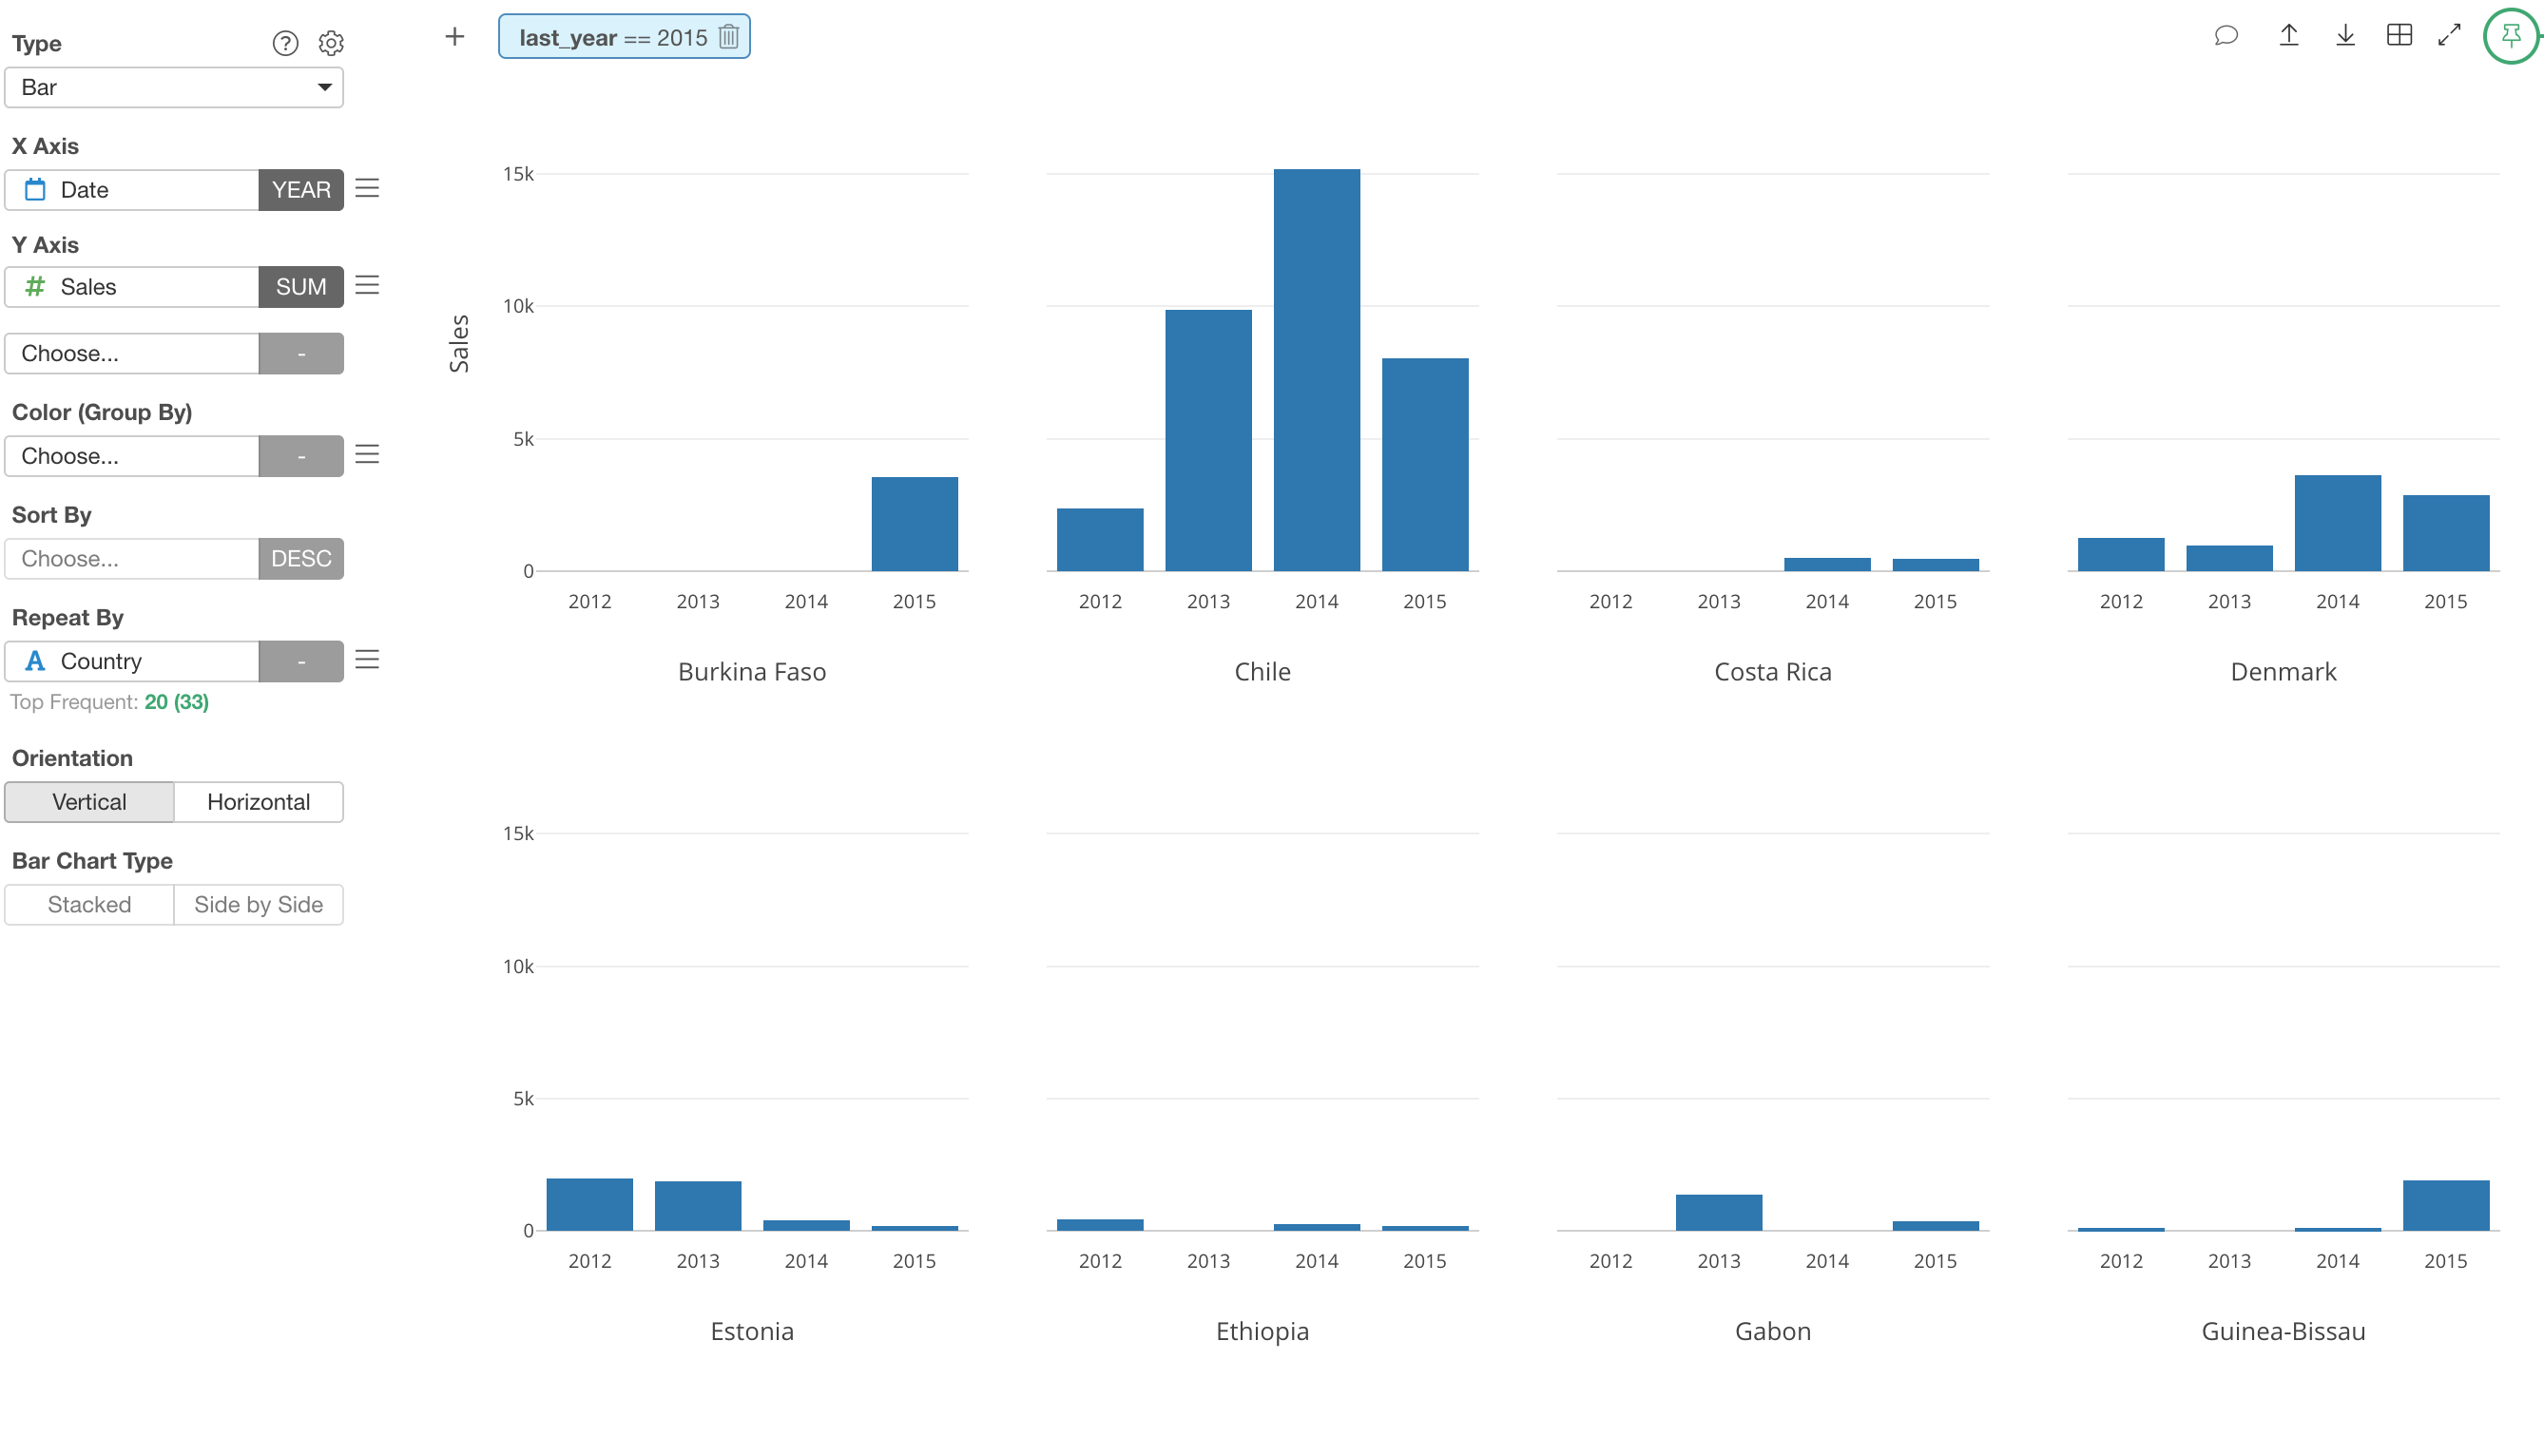
Instead of showing only the countries with 4 years of purchases, you want to show the countries as long as they made purchases in 2015?
Ok!
You can do this in the very similar way, except this time you want to use the max function instead of n_distinct.
Show only the countries that purchased in 2015
Select ‘Mutate (Create Calculation)’ from the column header menu of the ‘Year’ column.
Then, type the below.
max(Date_year)max function will return the biggest number of ‘Date_year’ column for each group, in this case that is the country.
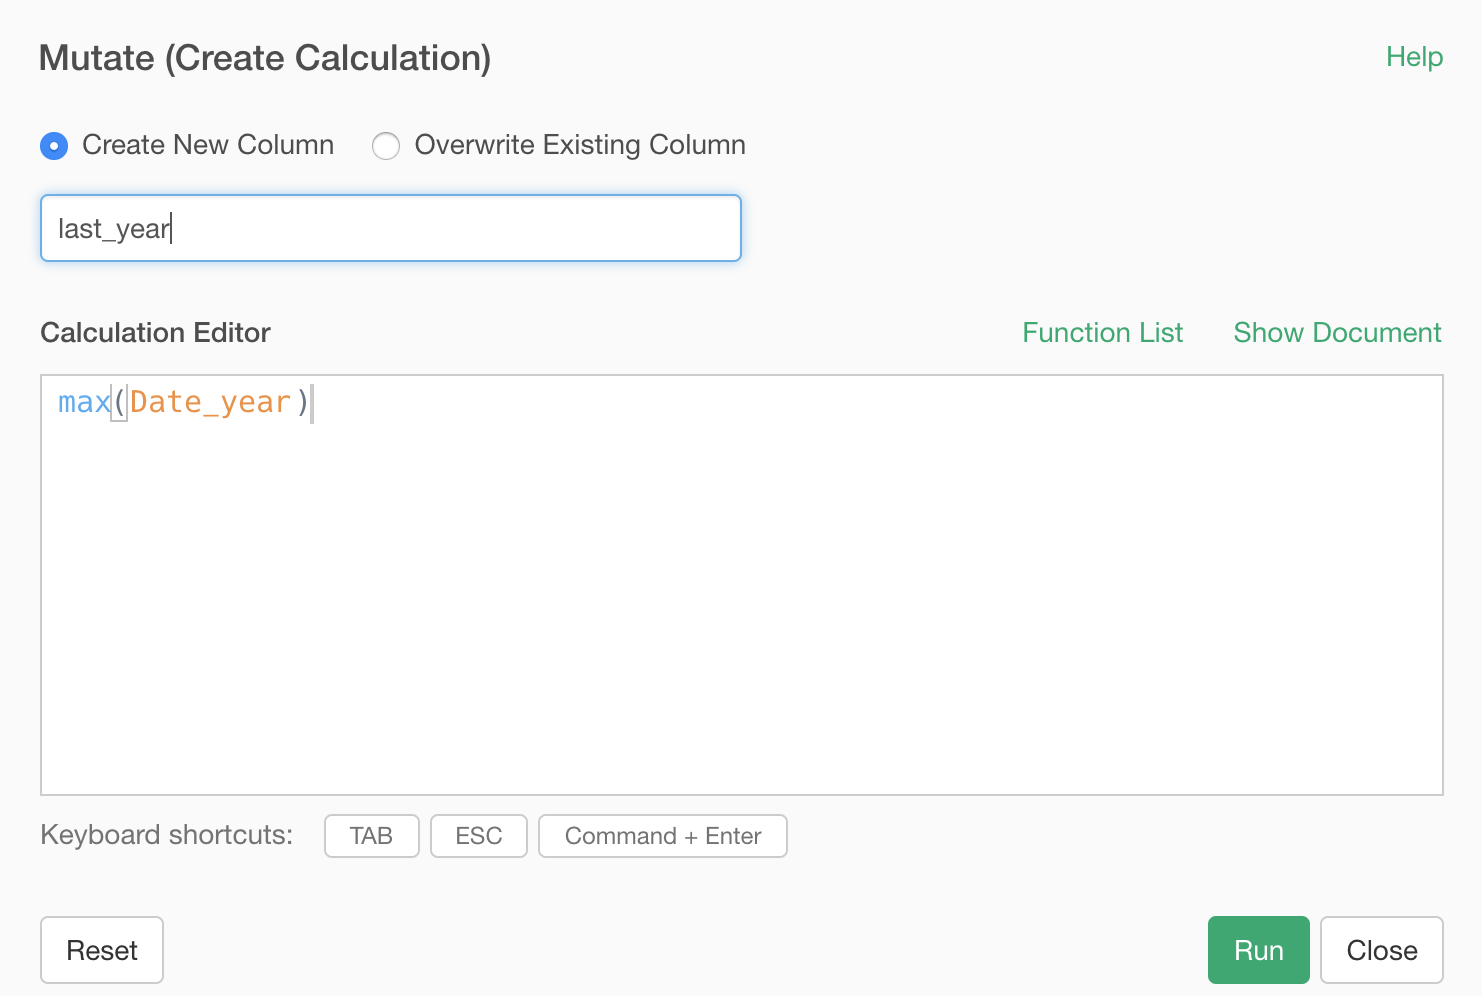
This will return the max value of the year column for each country, which is basically the last year in which a given country made the purchase.
Once you get this then you can filter the data to keep the countries with ‘2015’.
I’m typing ‘2015’ to filter inside the Chart Level Filter.
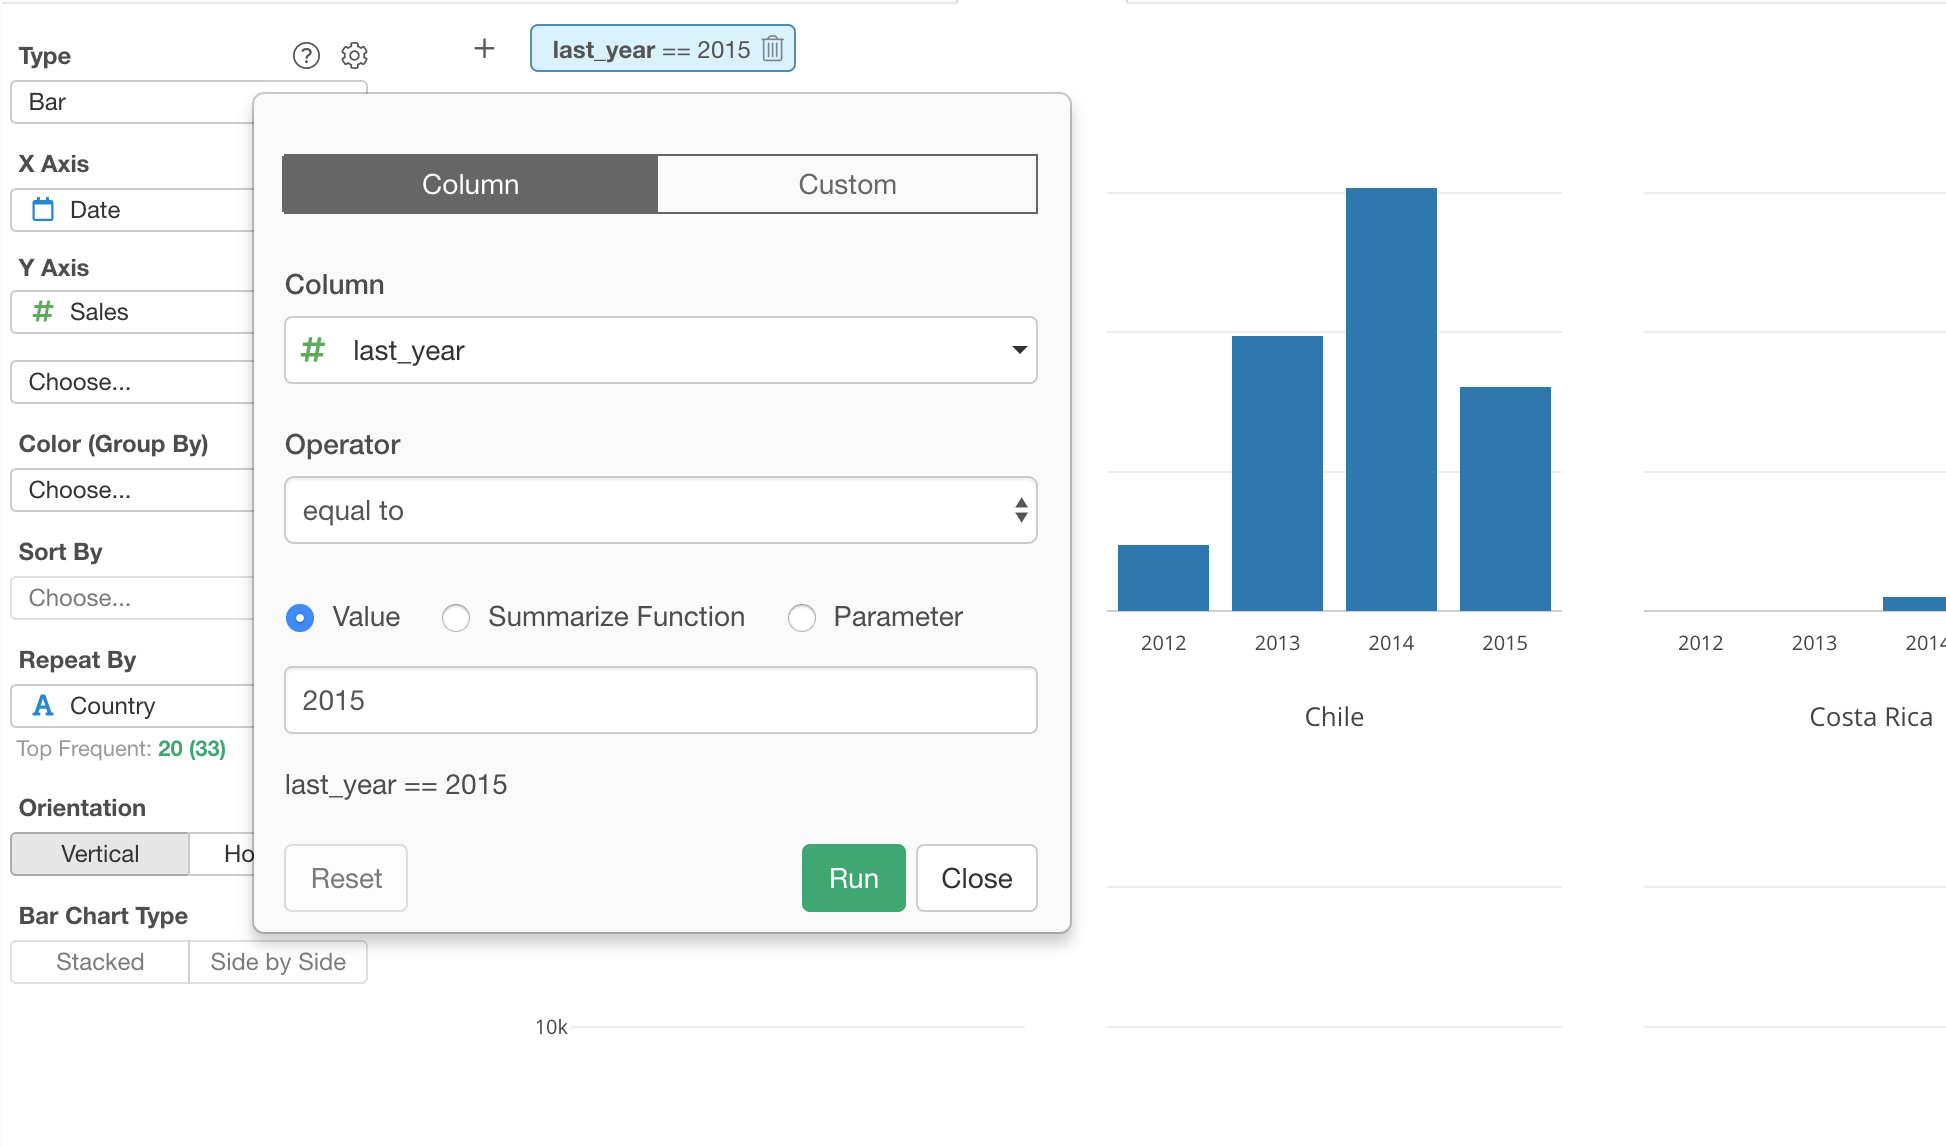
You can see only the countries with all 4 years!