Various types of number formatting are supported by Chart, Map, Pivot Table, Table, and Number and they can be configured in Property dialog.
What can I do?
- Set Number of Decimal Digits
- Show Thousand Separator
- Show Currency Symbol
- Show in Percentage Unit with ‘%’ Symbol
Chart
Y-Axis
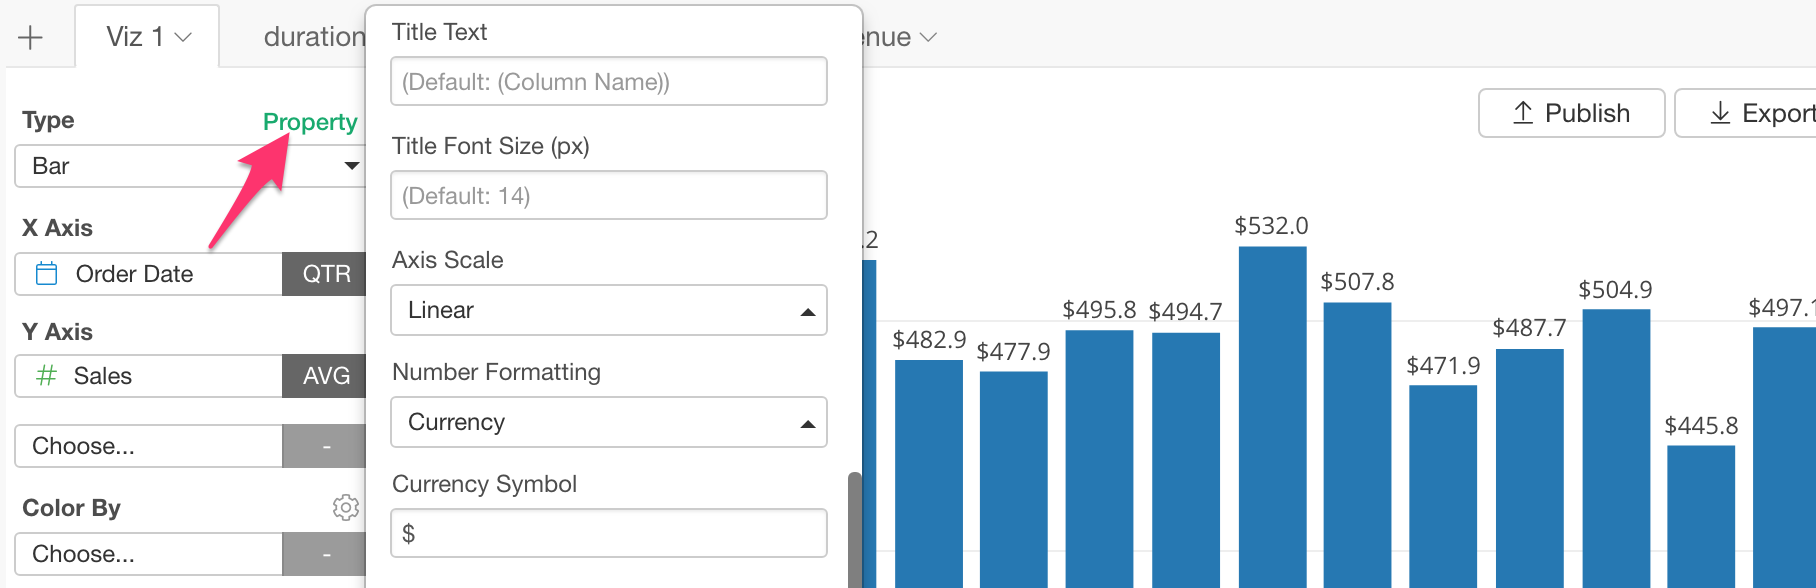
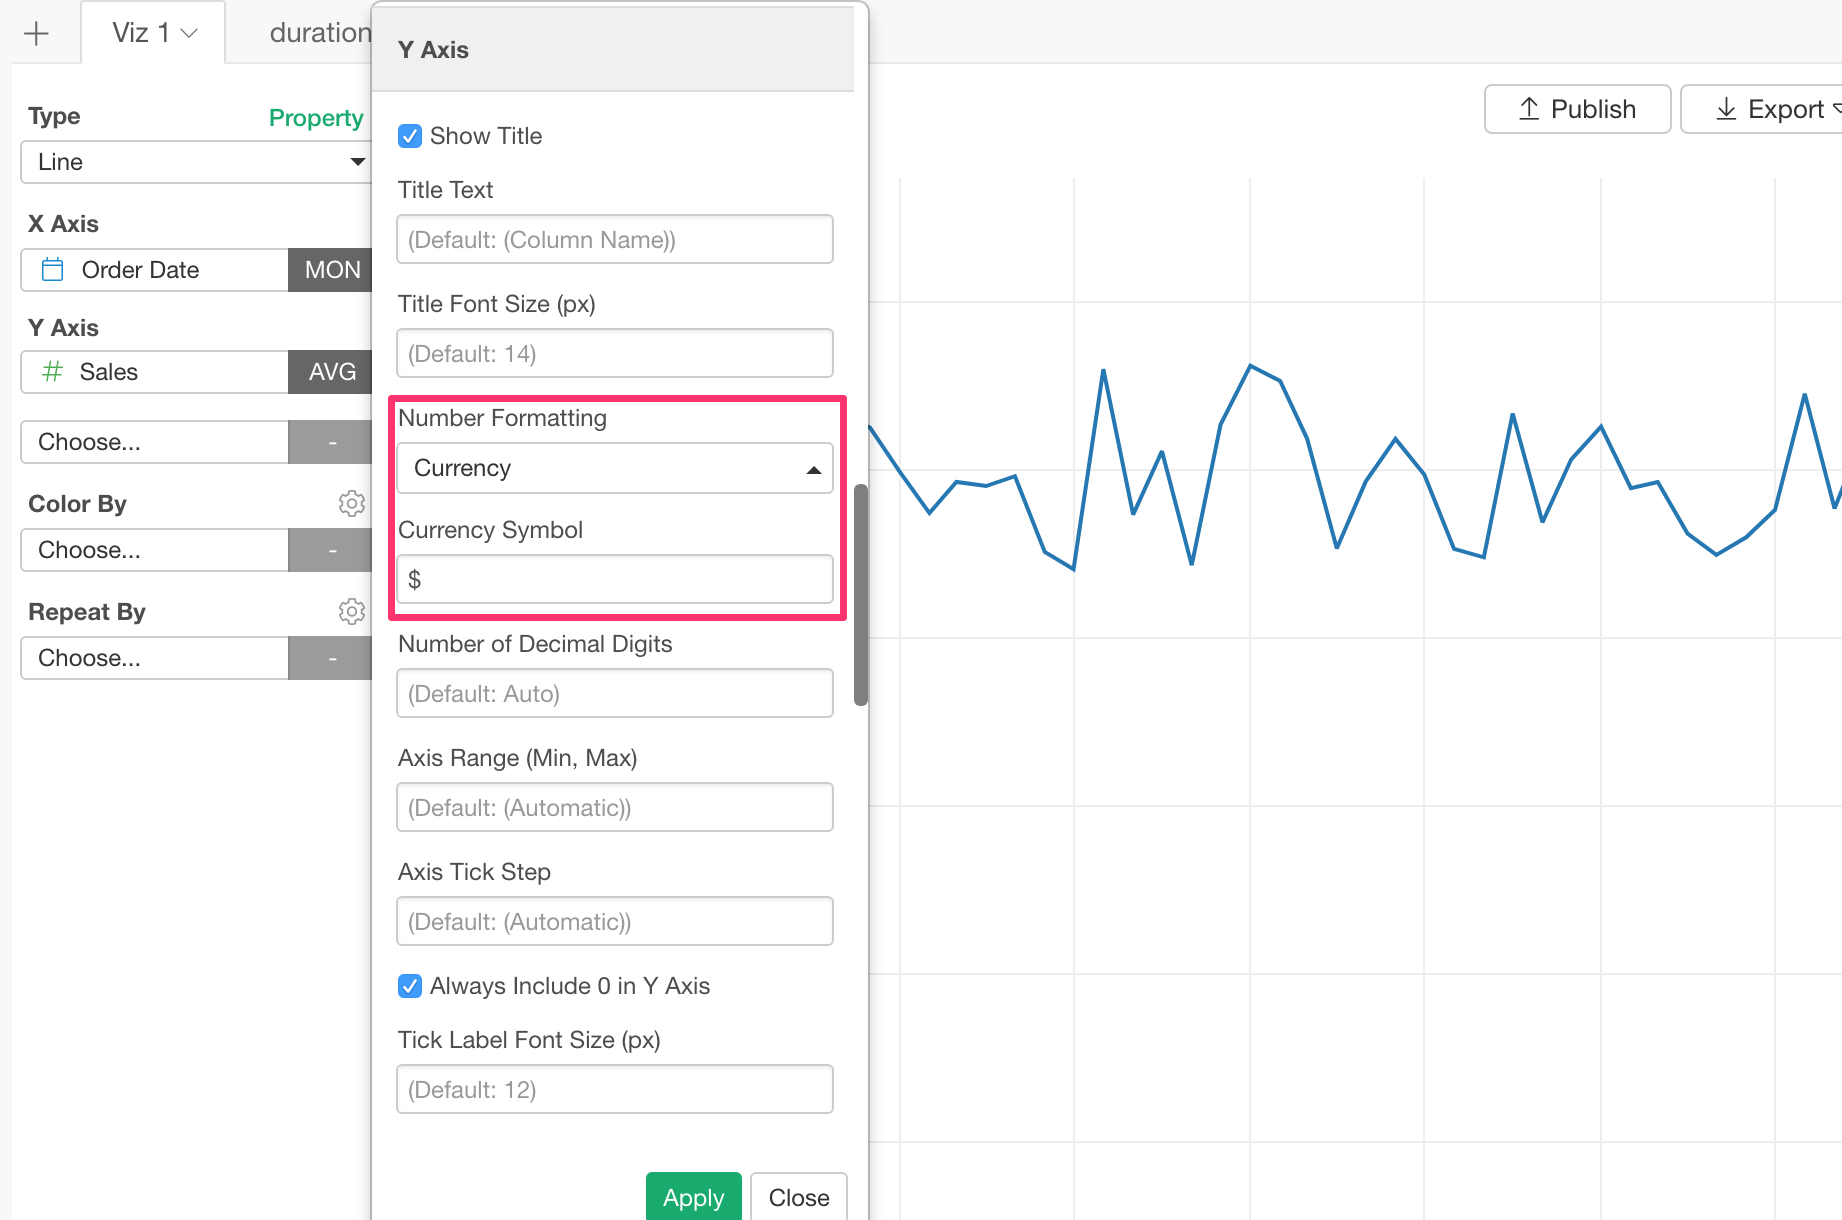
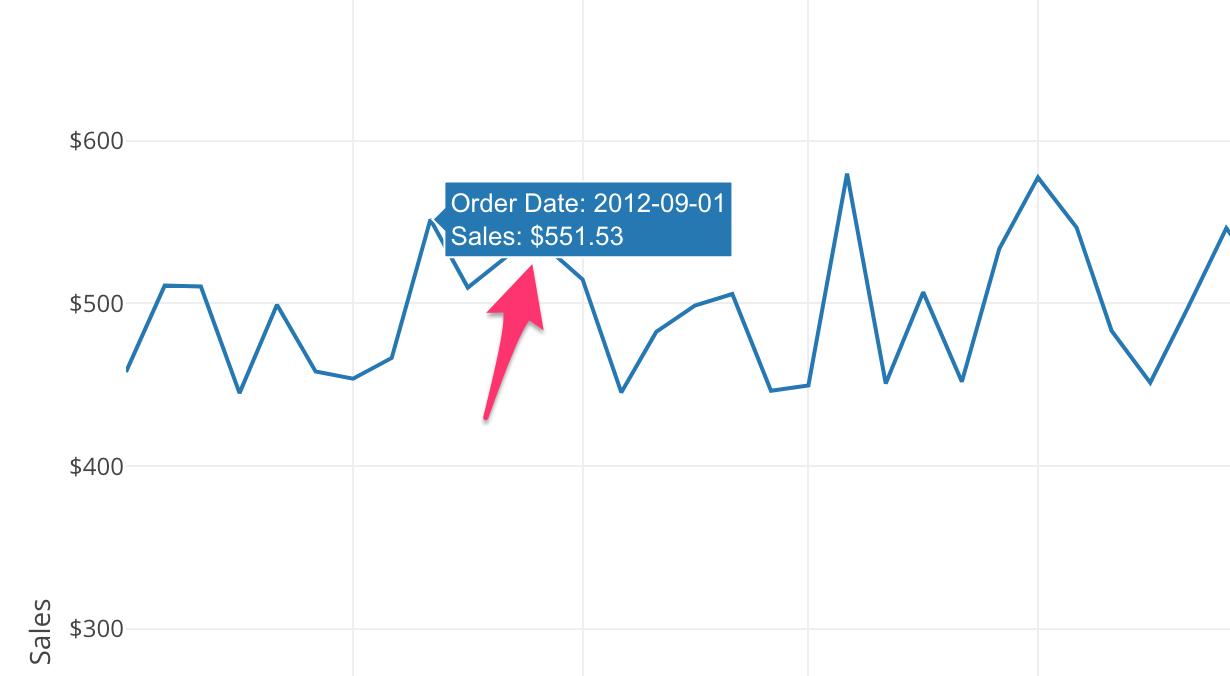
Currency Format
Select ‘Currency’ under Number Formatting in Property dialog and type the currency symbol.
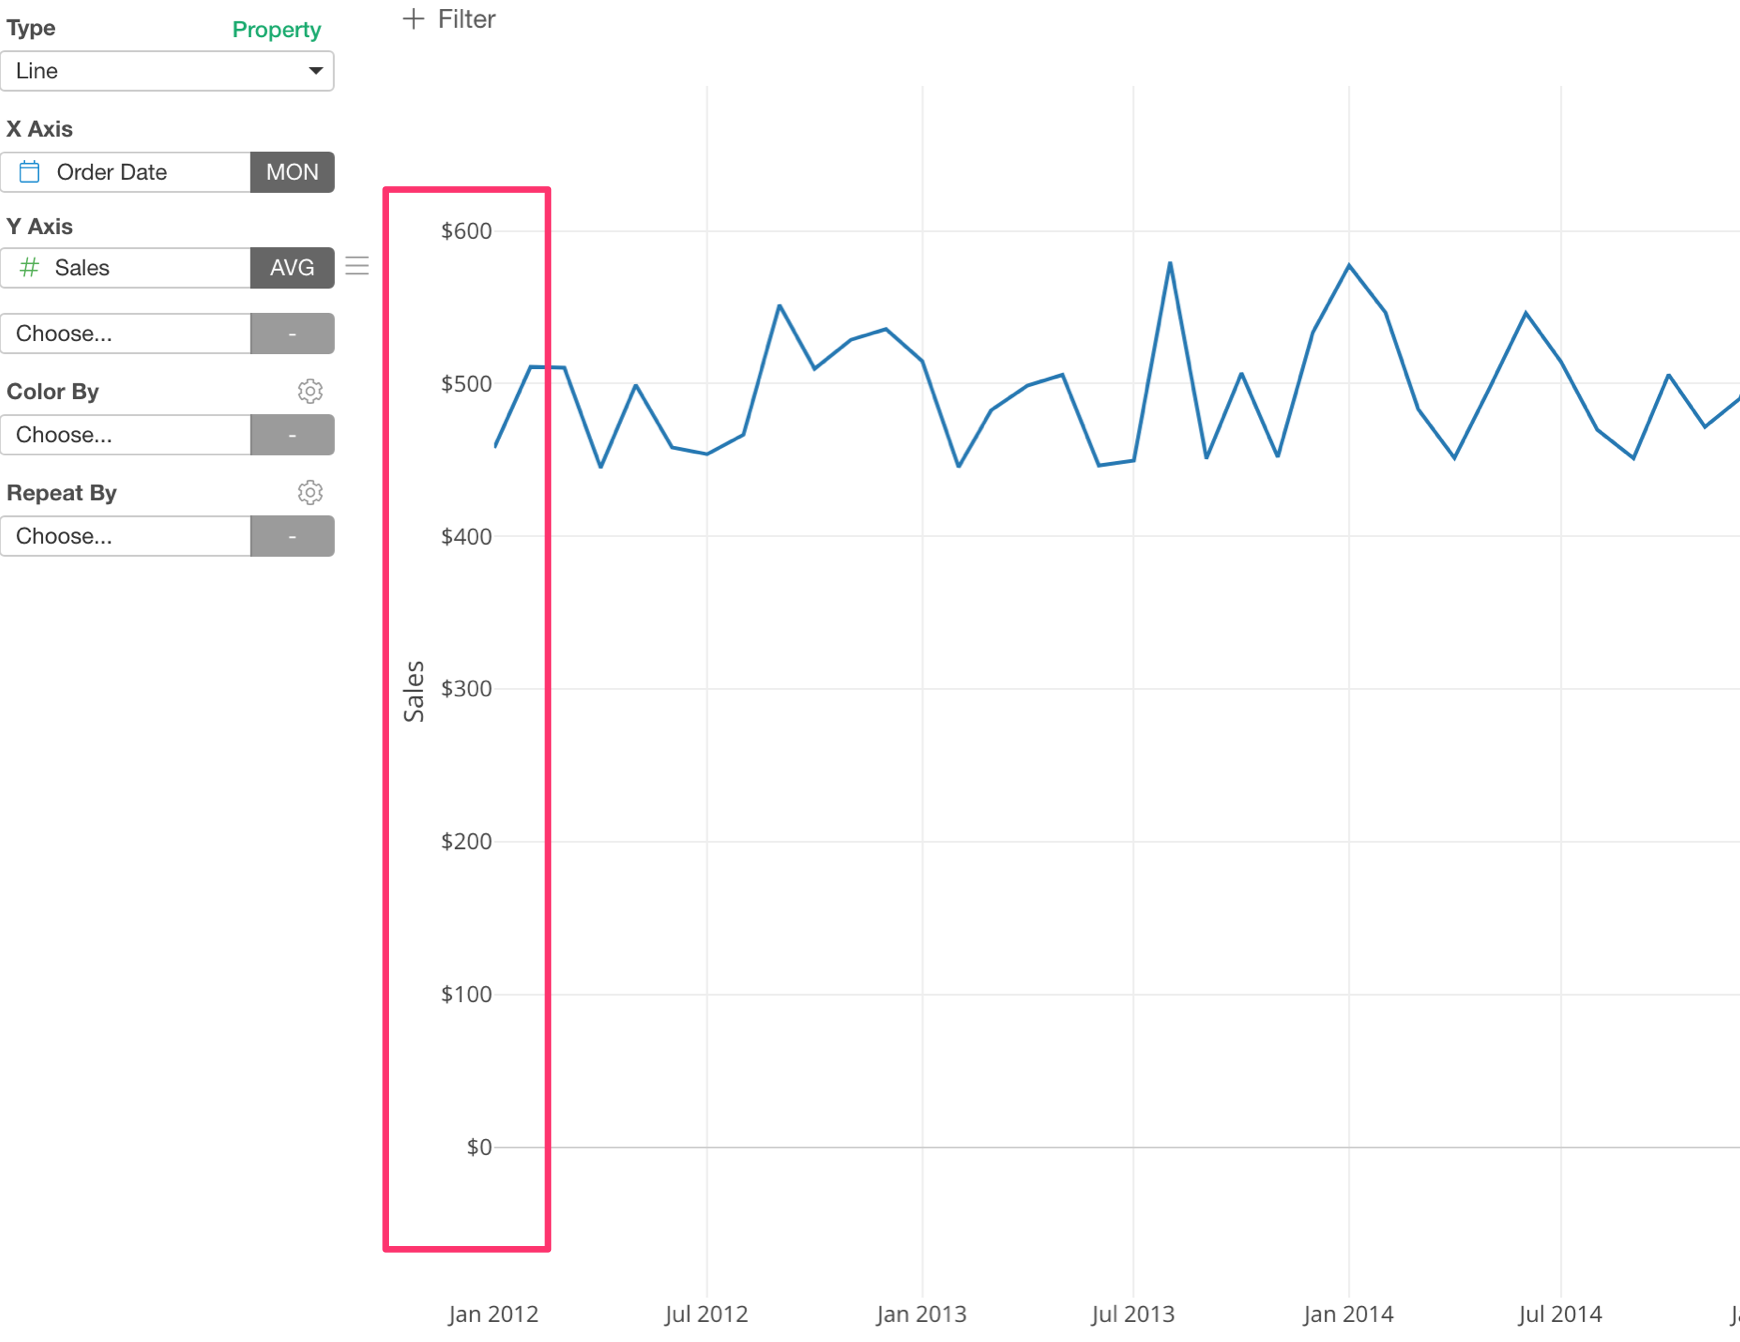
This formatting will be applied to the numbers in the tooltip on the chart as well.
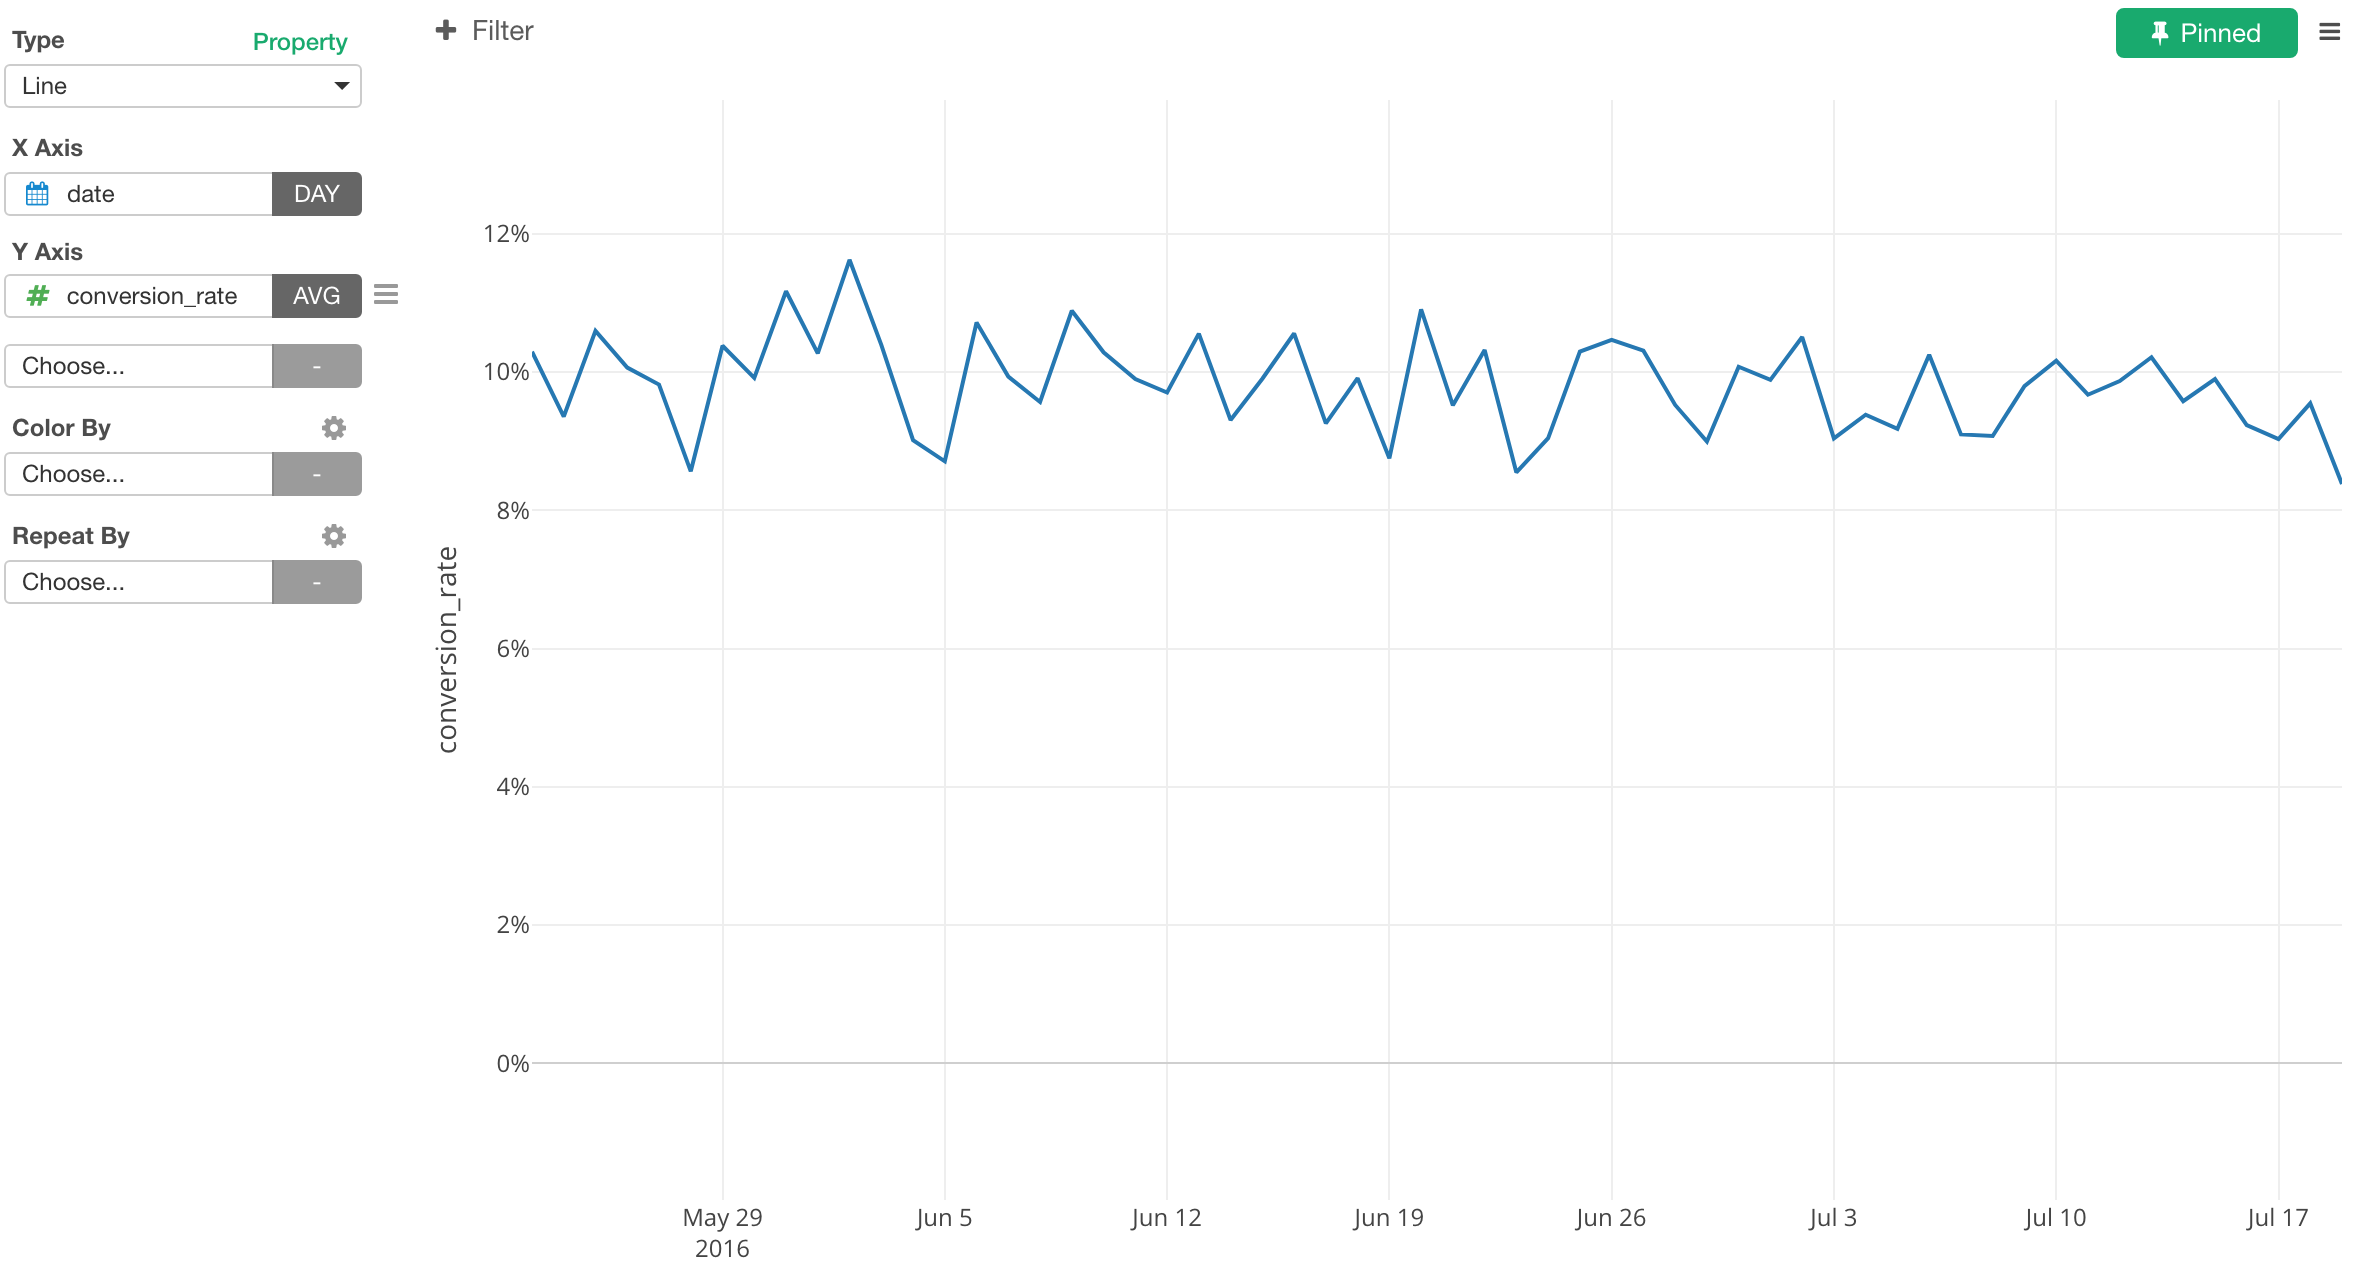
Percentage (%) Format
Select ‘Percentage (%)’ under Number Formatting in Property.
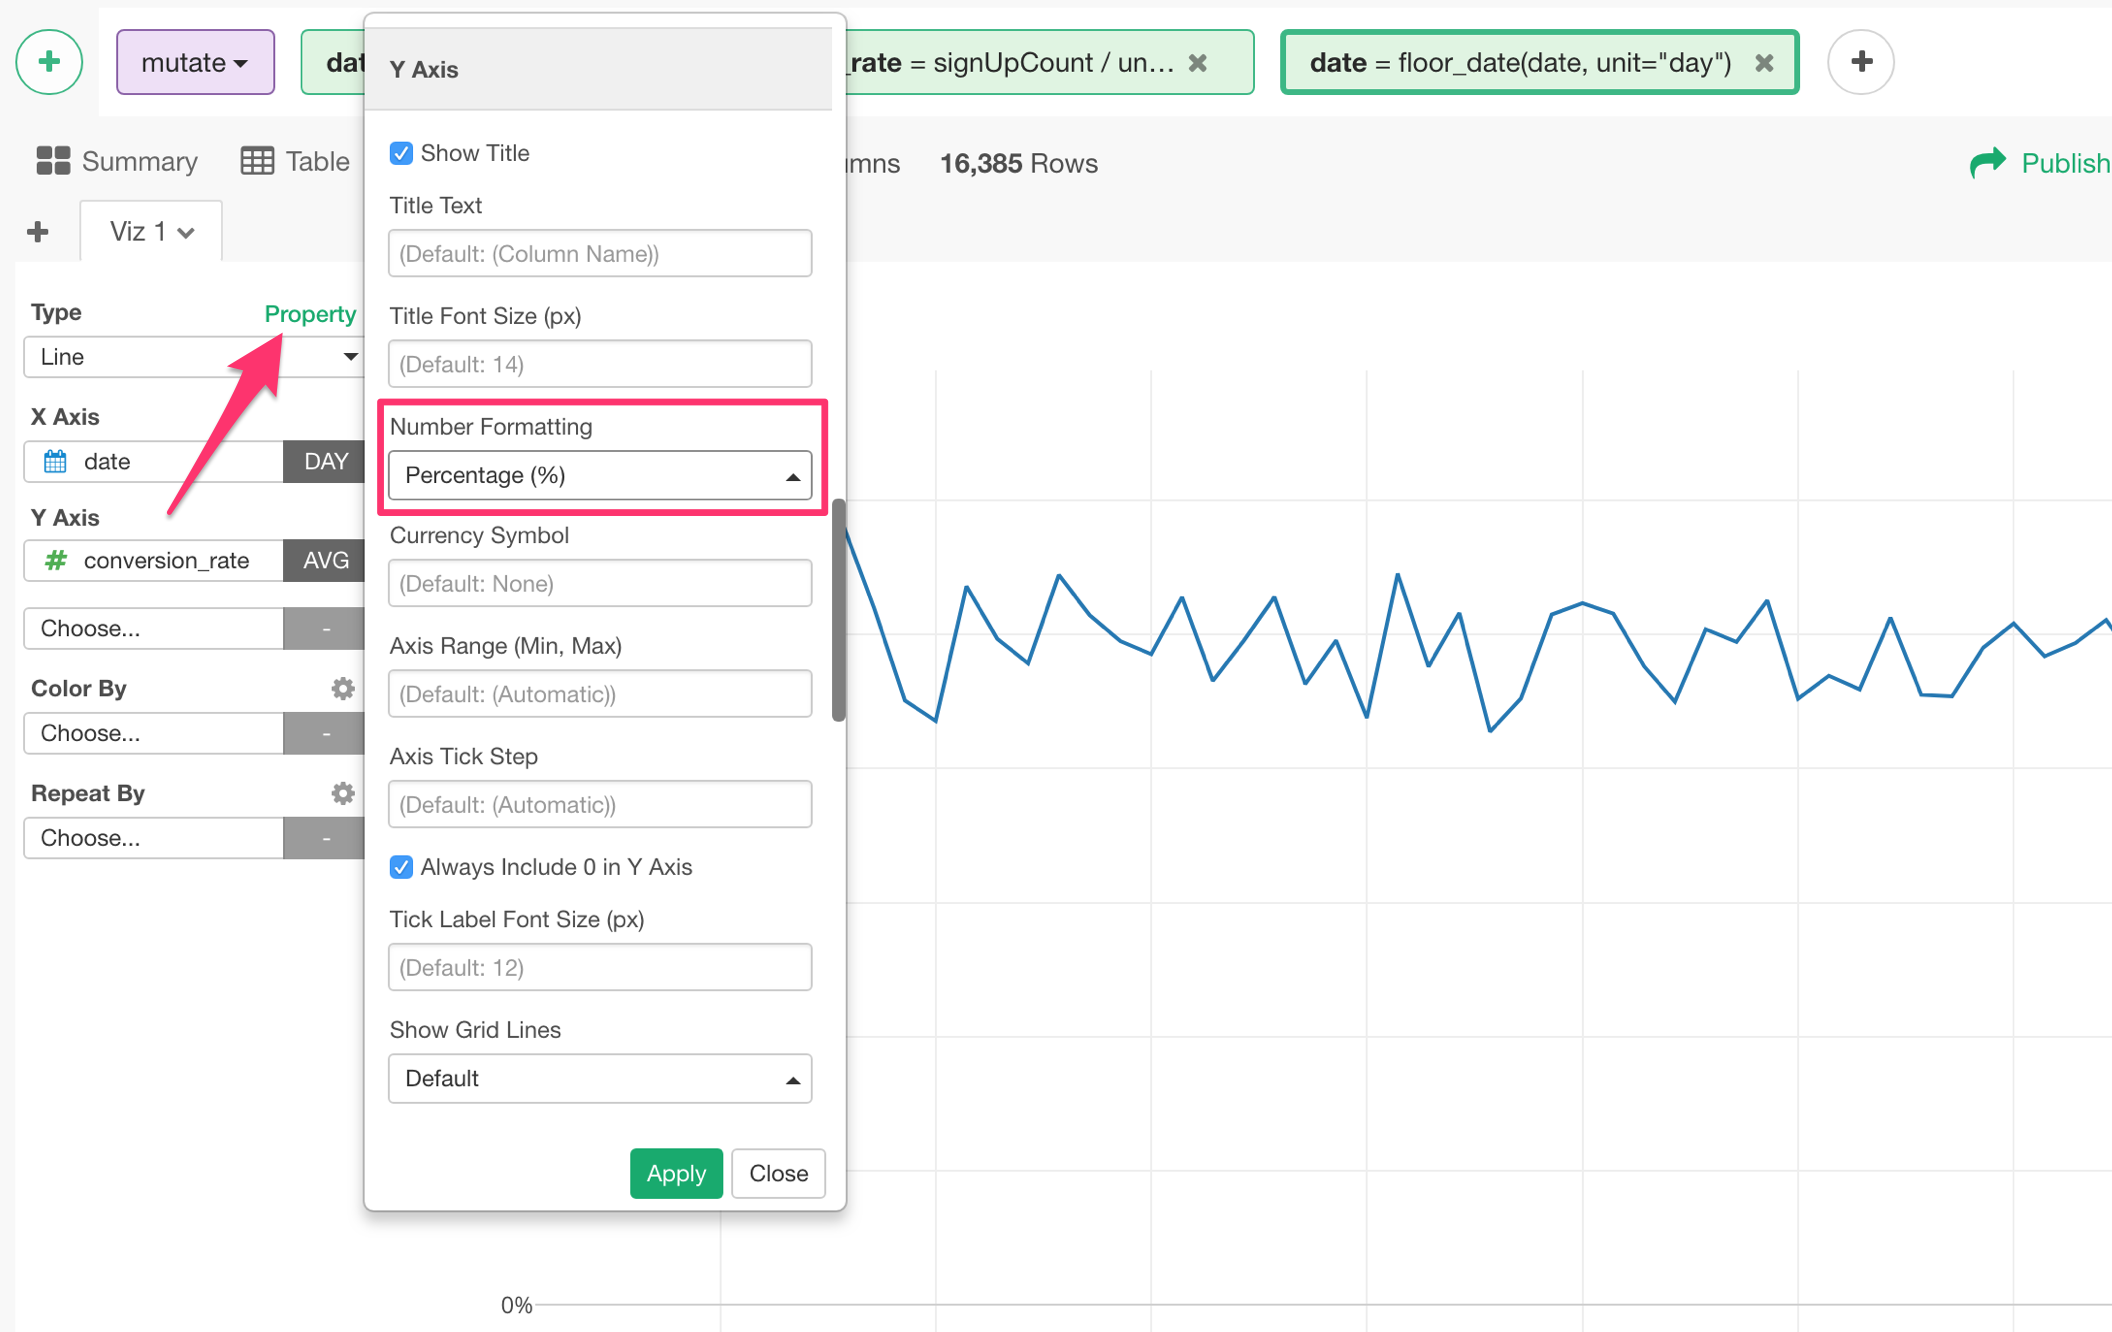
This will show the numbers at Y-Axis label in the percentage unit with ‘%’ symbol.
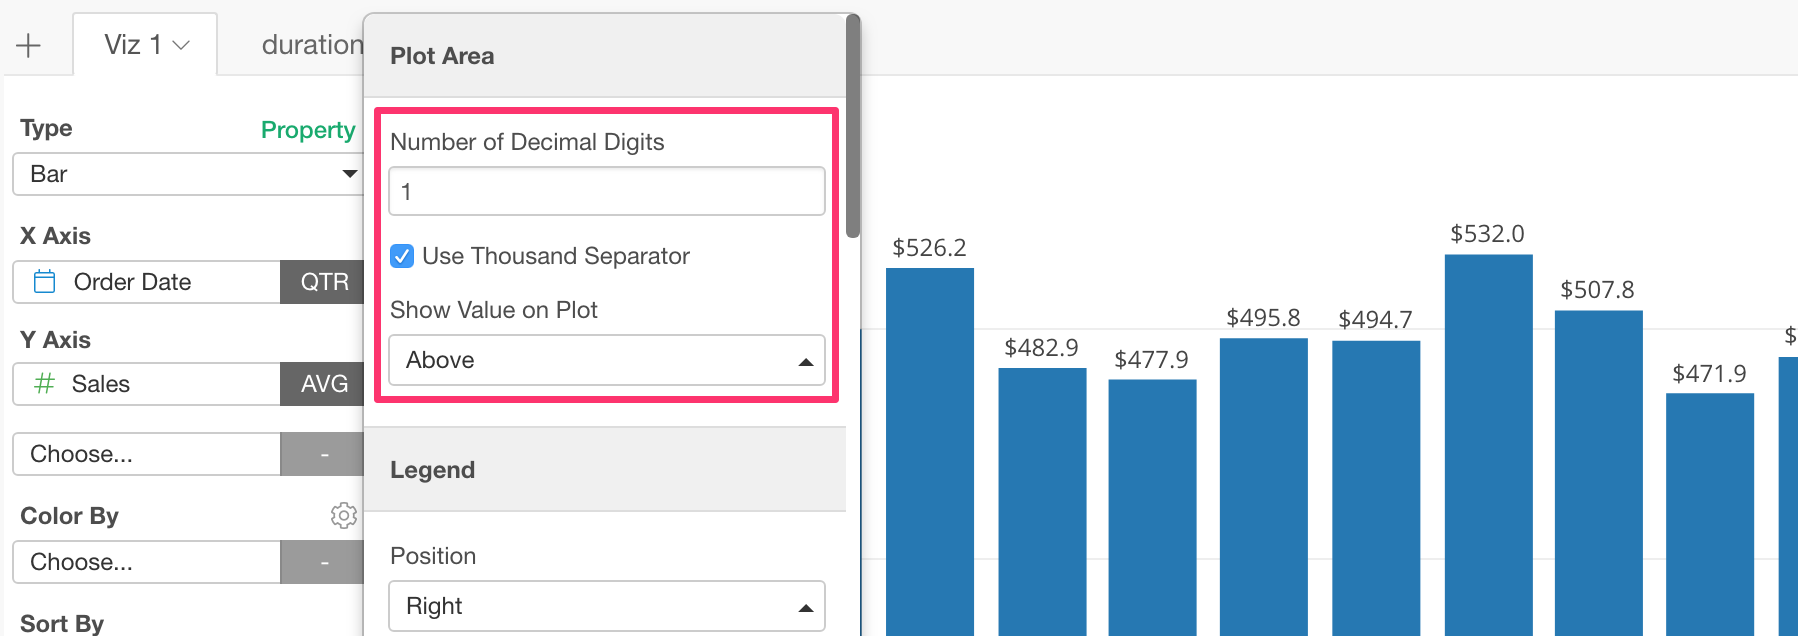
Plot Area
You can show the number values on the chart for the following charts.
- Line
- Bar
- Scatter
- Bubble
- Histogram
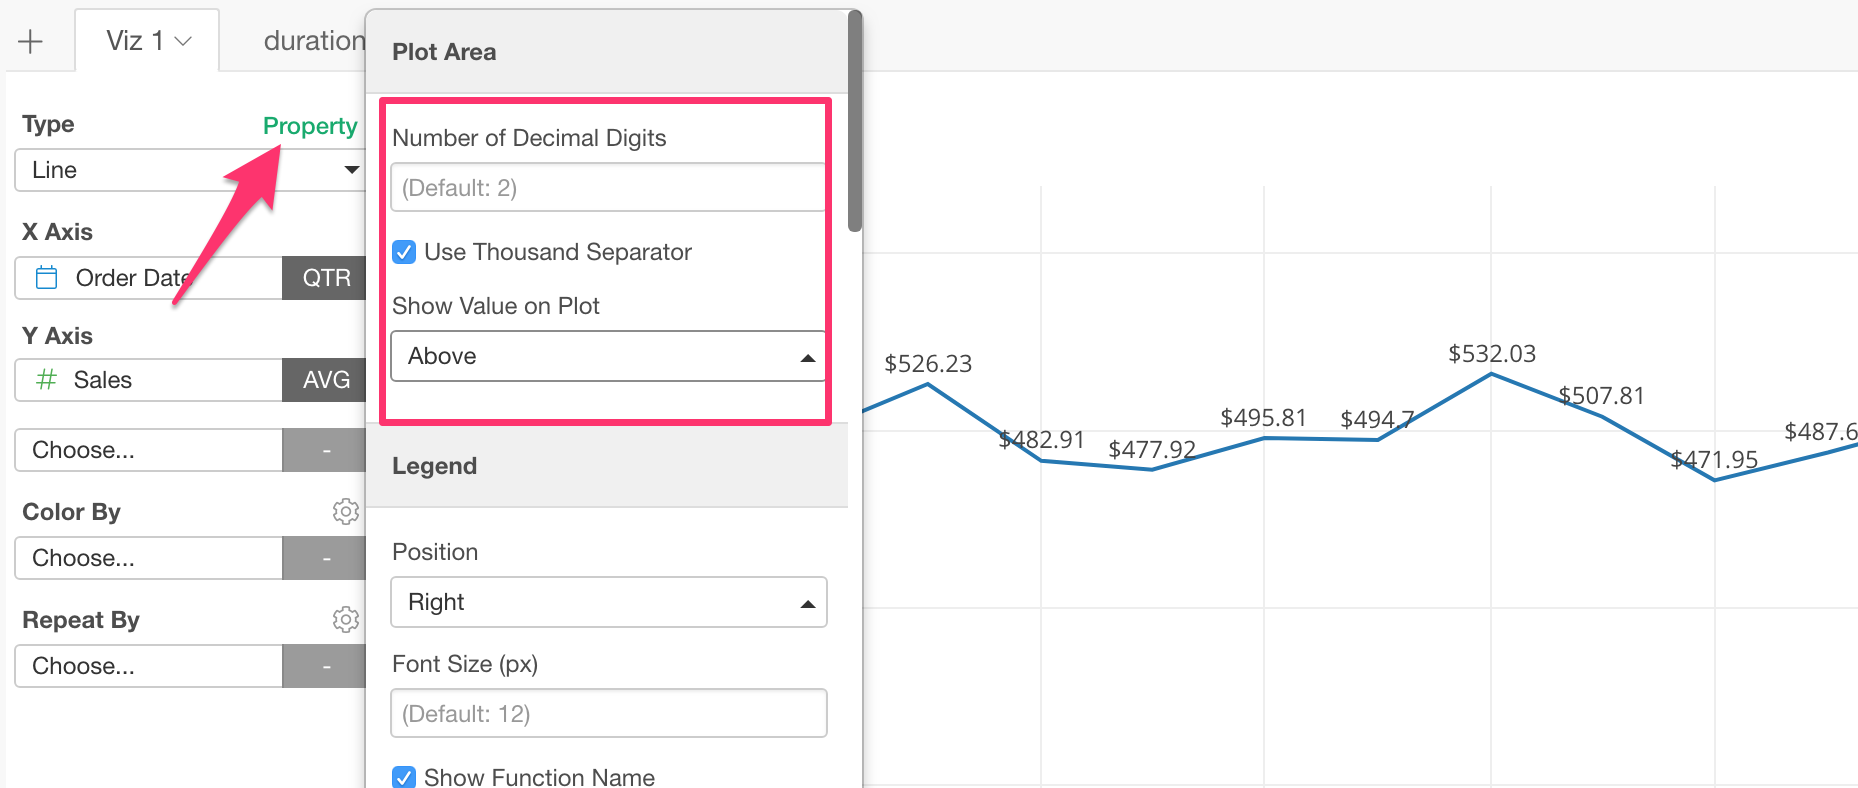
You can adjust the number of dicimal digits to show.
Map
Number of Dicimal Digits
Set the number of the decimal digits. This will format the number that is showing in the value box at the right hand side top of the map.
Here, I’m setting 2 to show two dicimal digits.
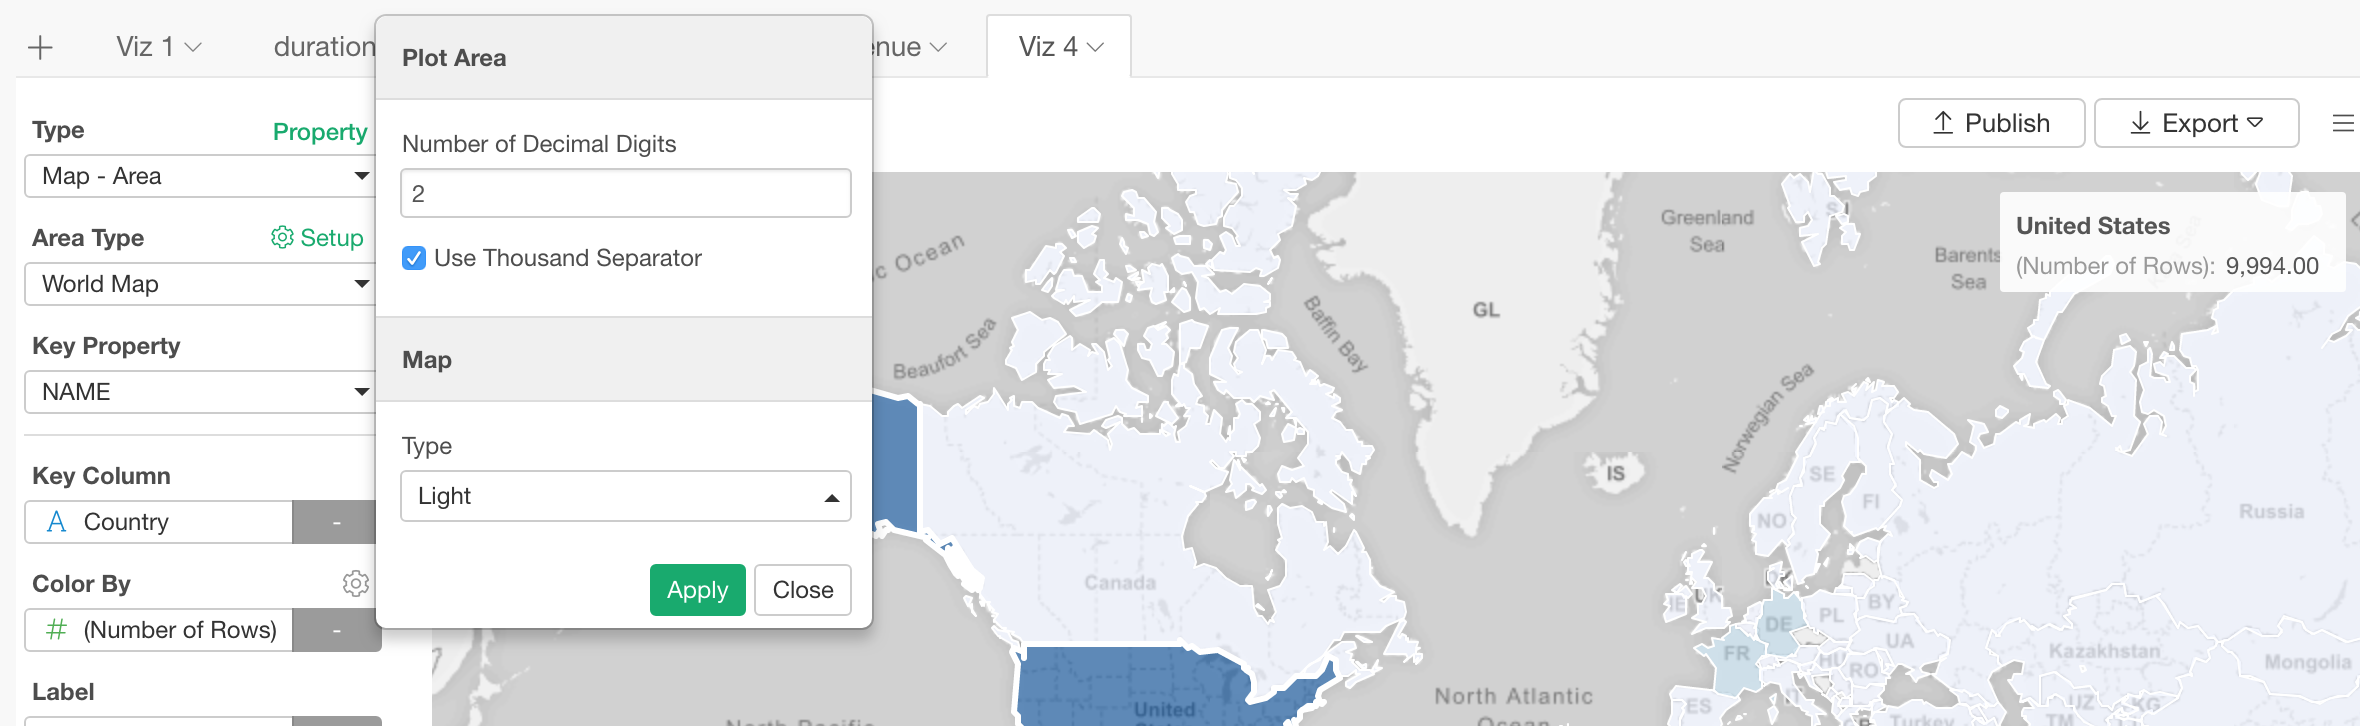
Thousand Separator
The default is on, but you can uncheck to not have the thousand separator as well.
Pivot Table
Number of Dicimal Digits
Set the number of the decimal digits. Here, I’m setting 1 to show a single dicimal digit.
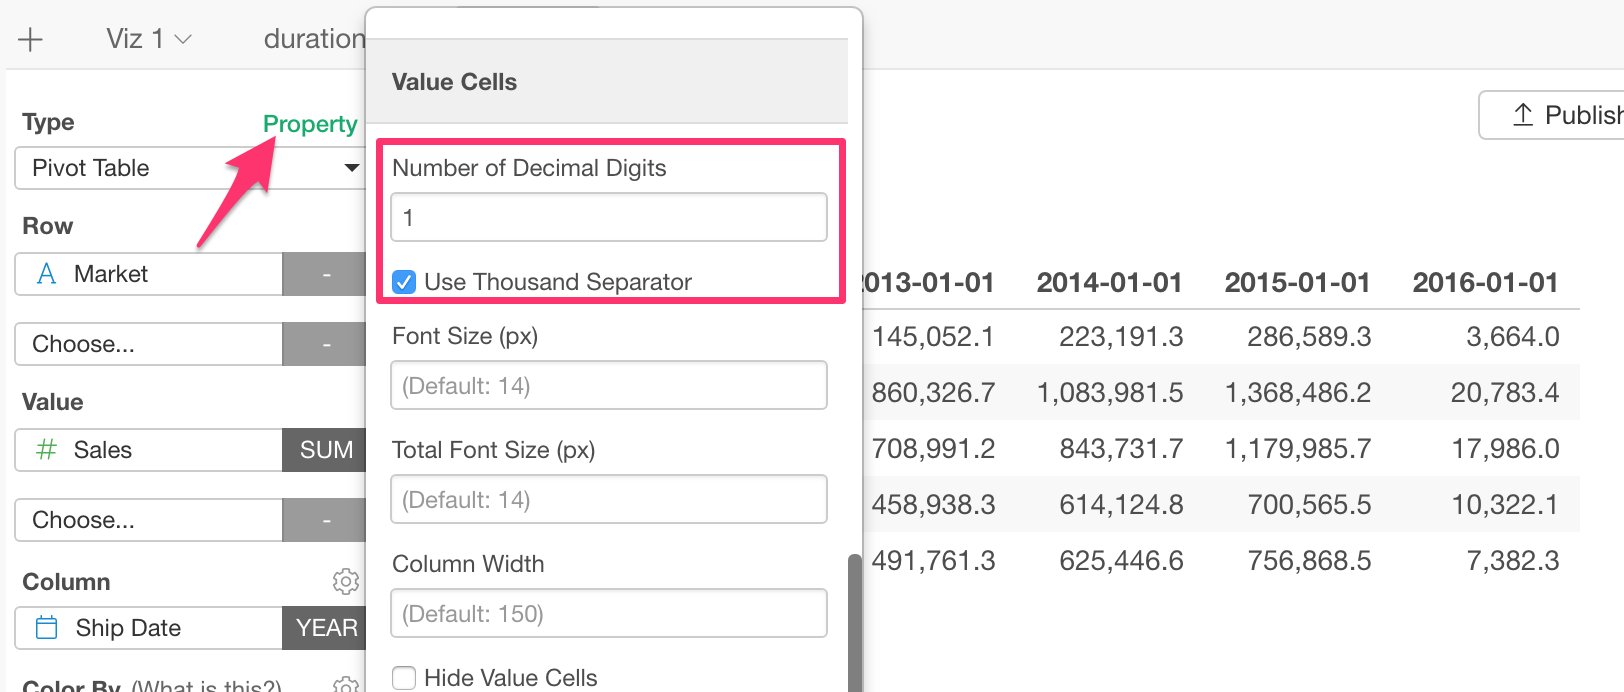
Thousand Separator
The default is on, but you can uncheck to not have the thousand separator as well.
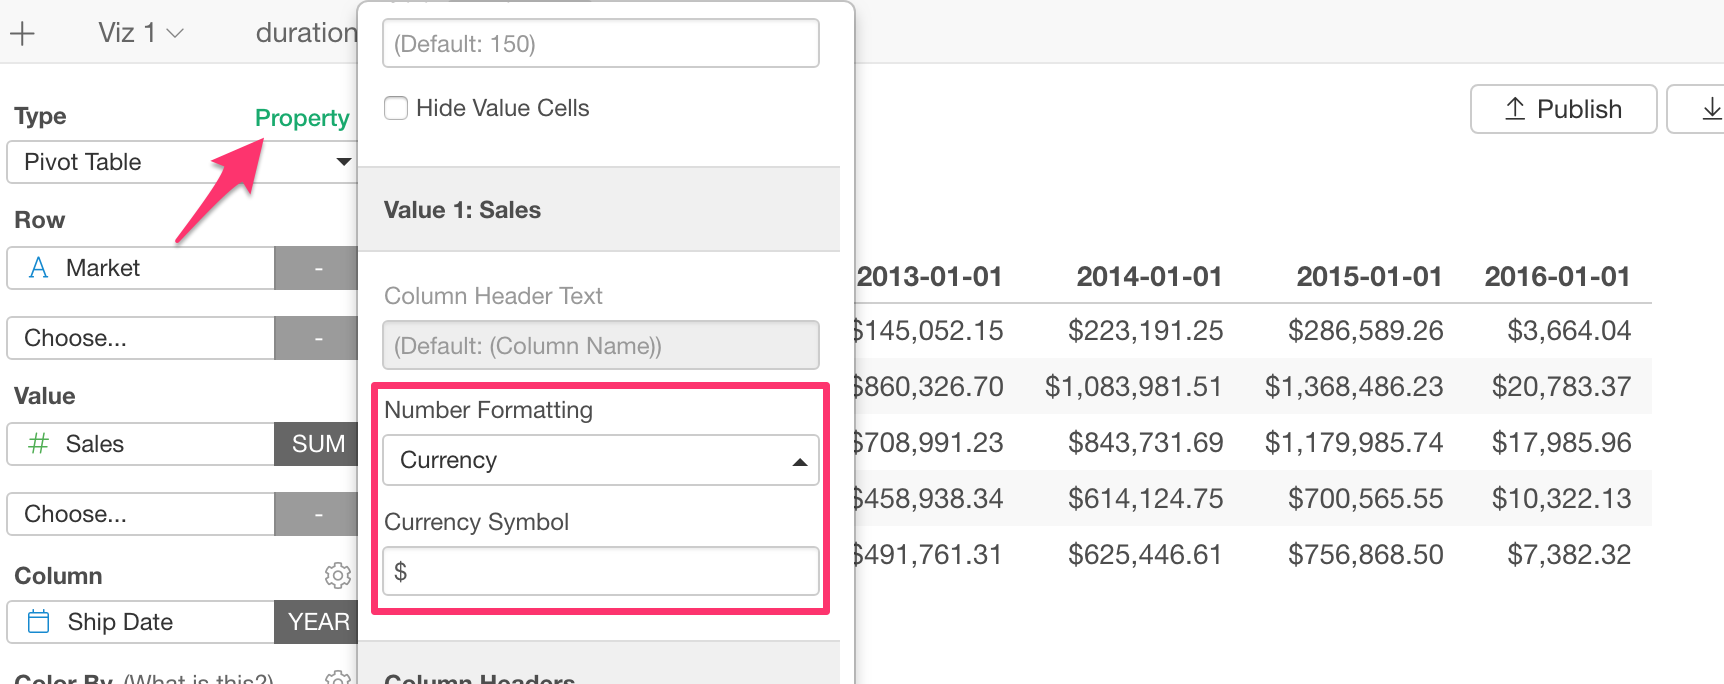
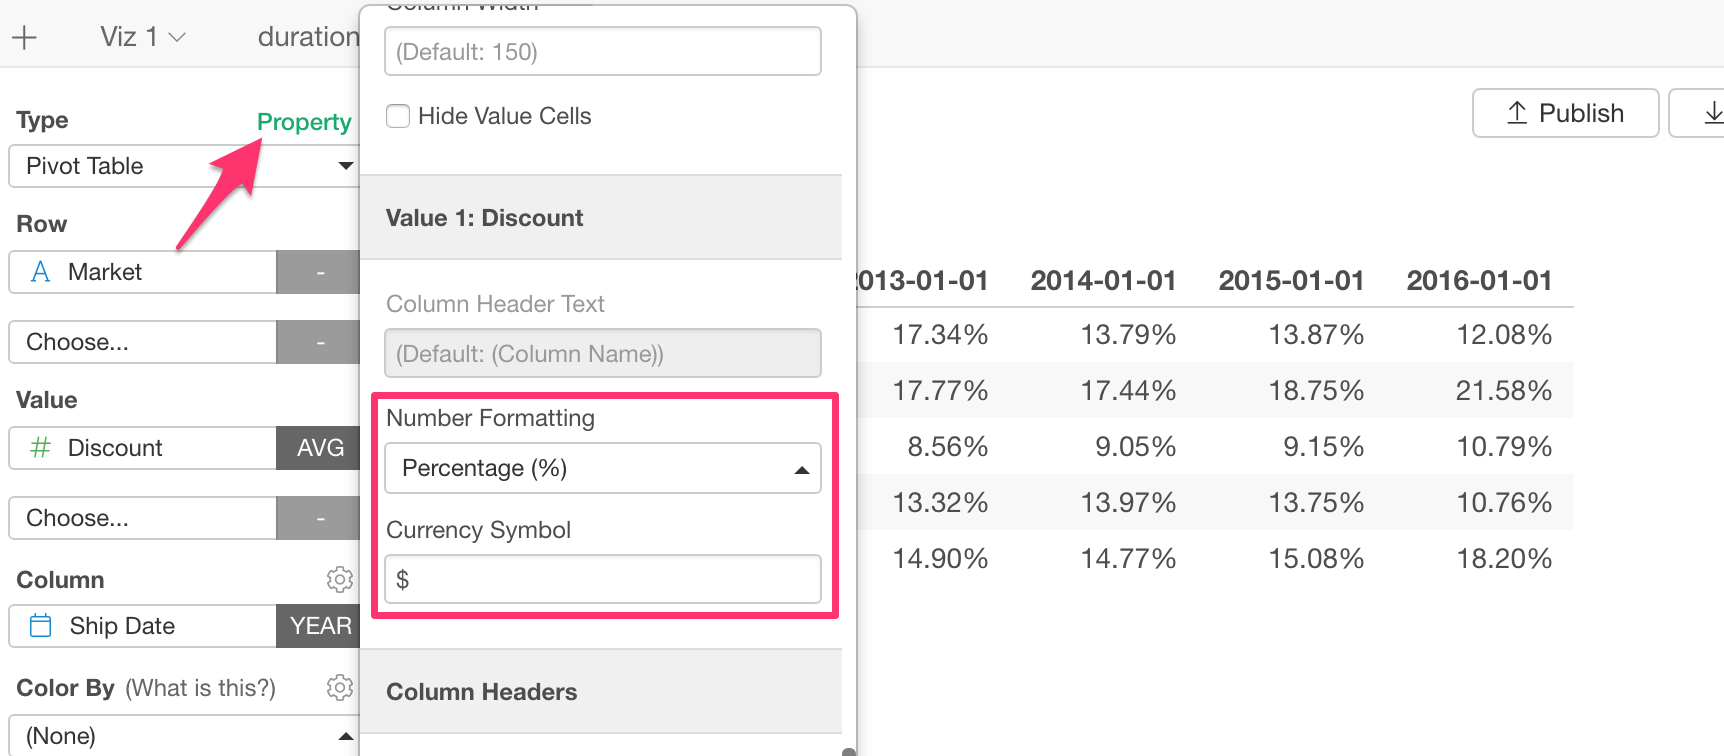
Currency Format
Select ‘Currency’ under Number Formatting in Property dialog and type the currency symbol.
Percentage Format
You can select Percentage (%) for Number Formatting. This will multiply the value by 100 and add ‘%’ at the right hand side of the values. So 0.1 will become 10%.
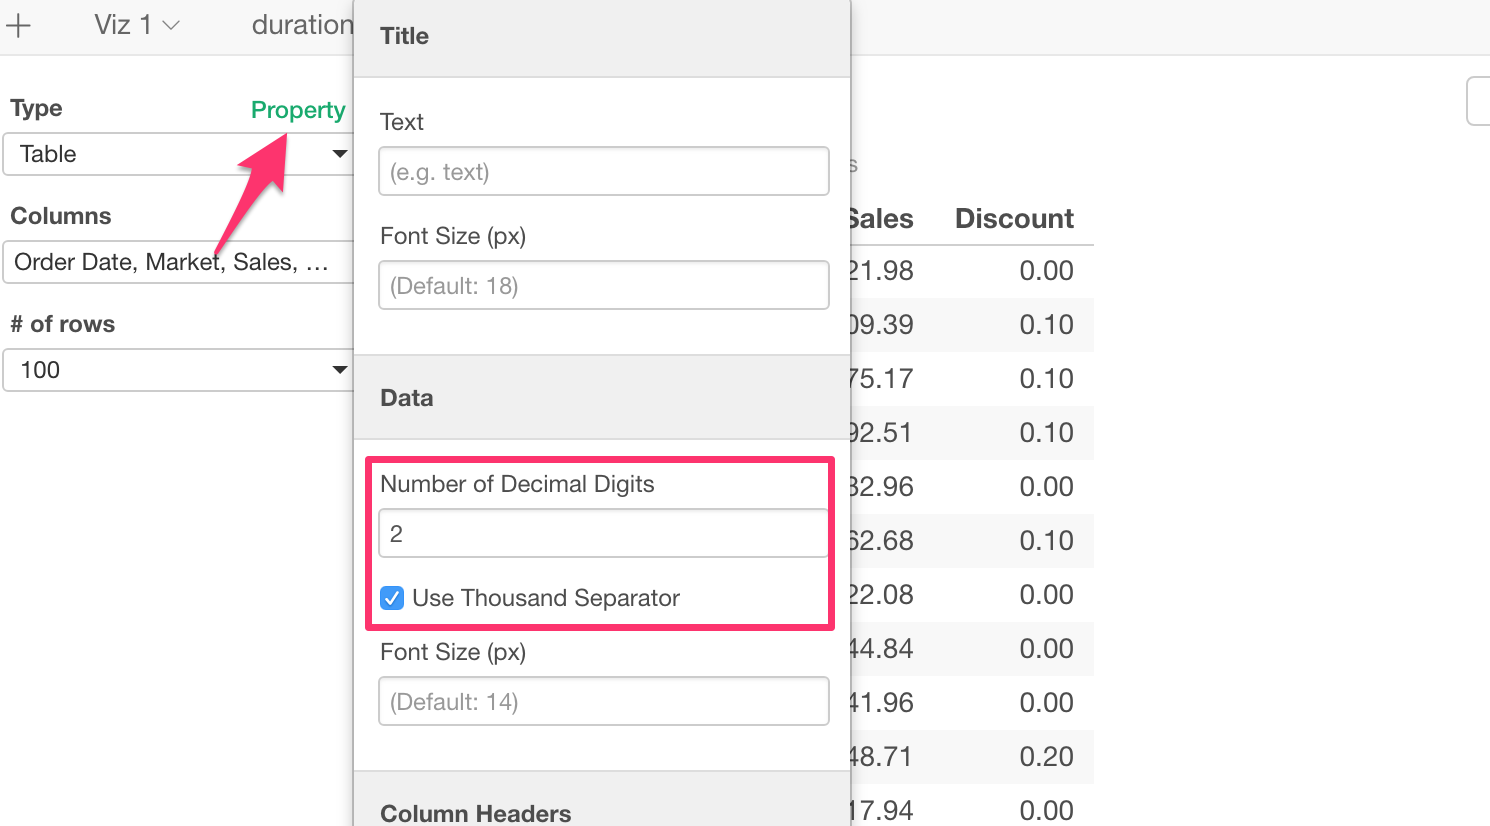
Table
Set the number of the decimal digits. Here, I’m setting 2 to show two dicimal digits.
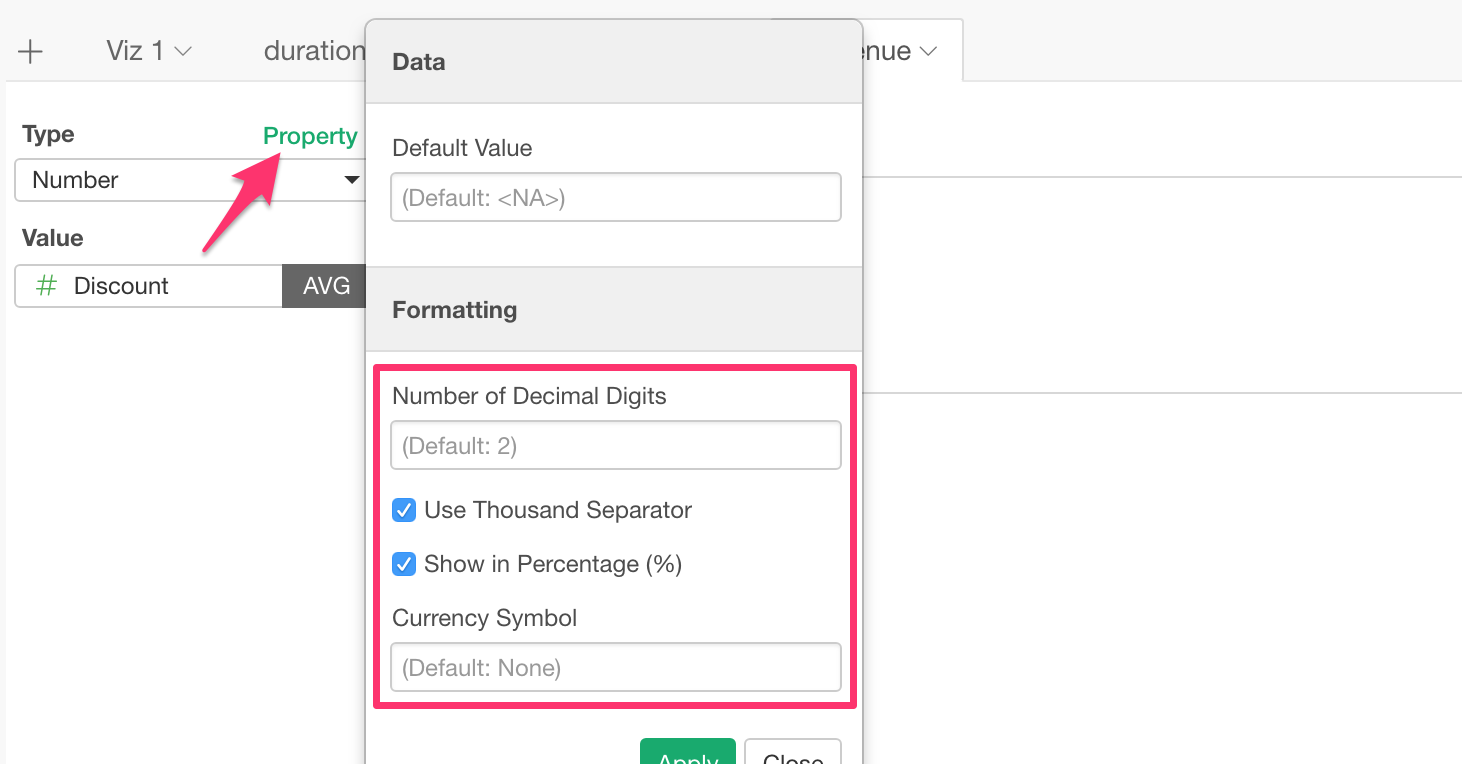
Number
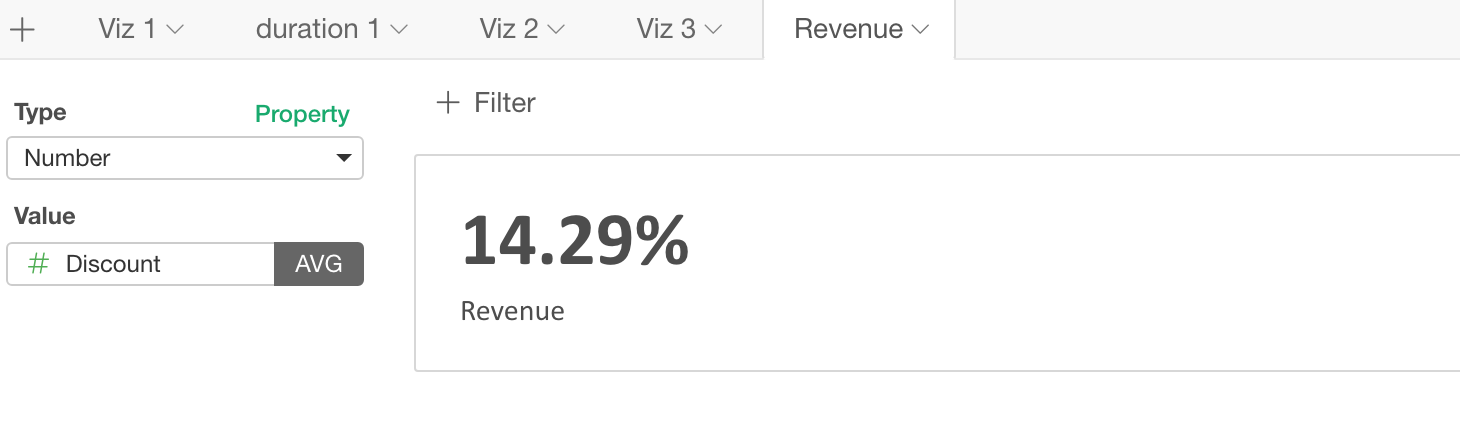
You can do the following number formatting for Number.
- Currency Formatting
- Percentage (%) Formatting
- Thousand Separator