Exploratory Getting Started Guide
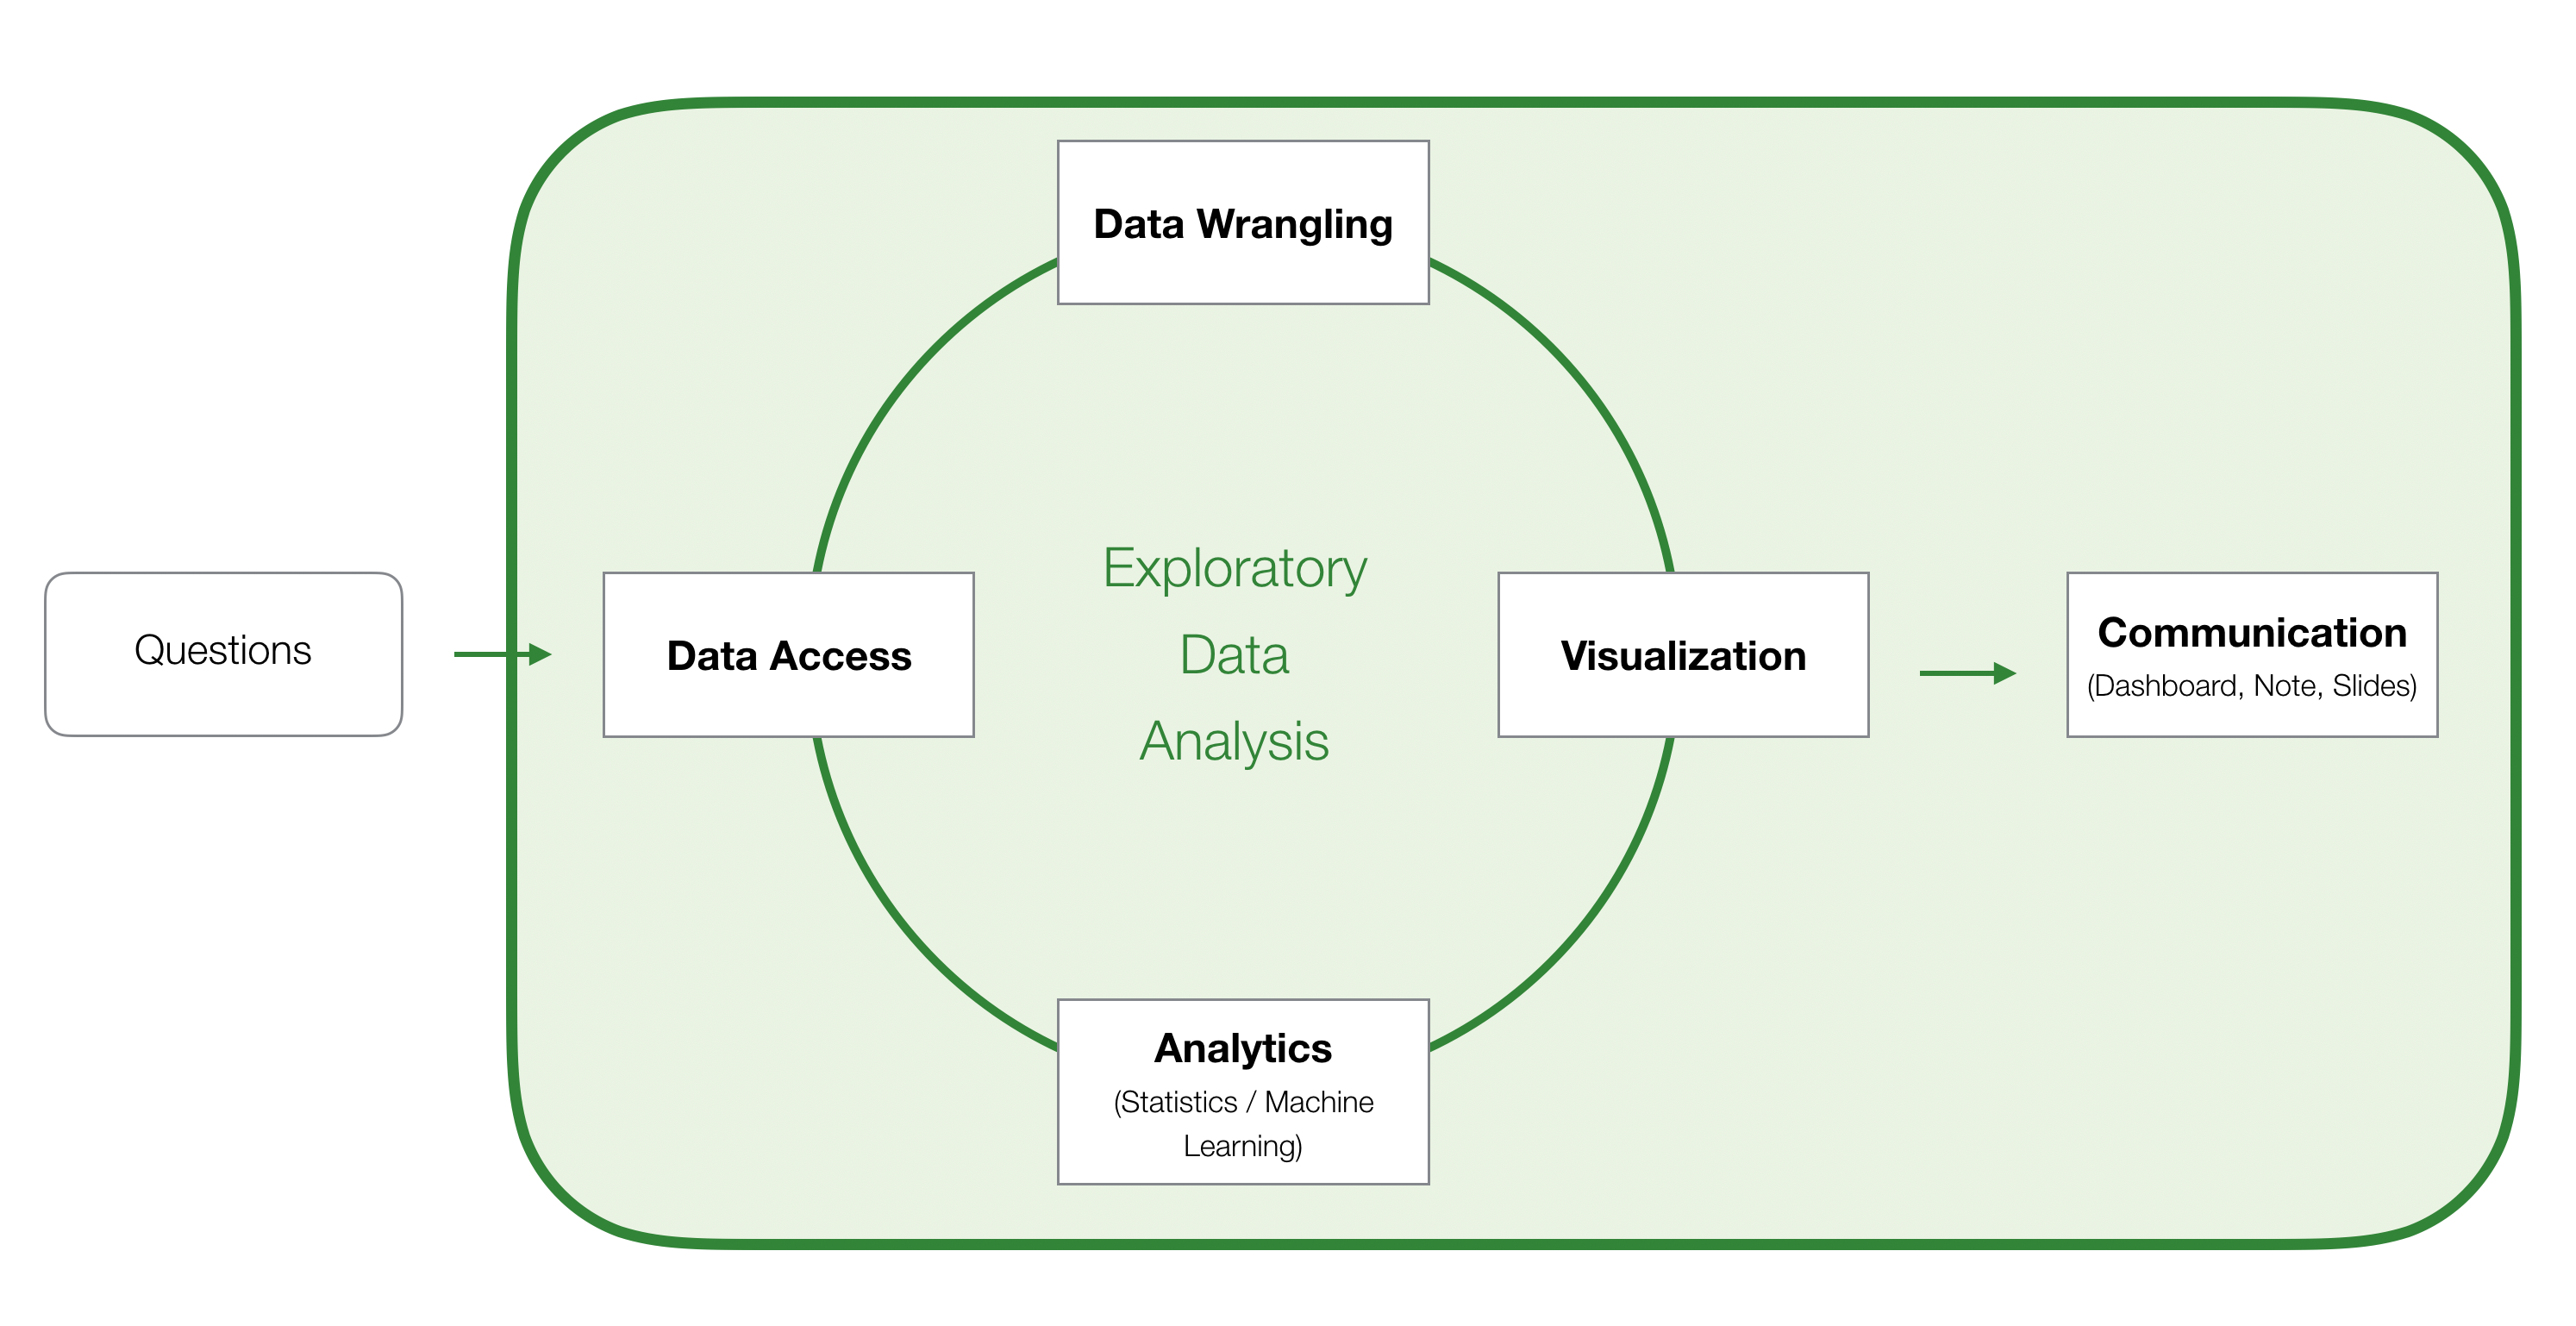
With Exploratory, you can quickly perform various Data Science tasks in the following 5 functional areas.
- Data Access
- Visualization
- Data Wrangling
- Analytics (Statistics / Machine Learning)
- Communication (Dashboard, Note, Slides)
We have put together a list of useful tutorials grouped by the 5 areas.
Each tutorial shows you how to download data and perform the listed tasks and it should take about 5 to 10 minutes to complete.
You don’t need to follow the order, so you can start from anywhere as long as you are interested!
Data Access
1. CSV / Excel Files
- Under development…
2. Google Sheet Data
- Under development…
3. JSON Data
4. Web Scraping
You can scrape the table data inside web pages by simply typing the URL.
Note that this option works with a simple html table data, but not with the table data that are dynamically generated by JavaScript.
4. Extension Data
In Exploratory, there is a data type called ‘Extension Data’ that can be added by Exploratory users, though they need to be submitted to the team Exploratory for approvals.
Anyway, we have been adding the Extension Data periodically.
There are two useful and simple to use ‘Extension Data’.
- Getting Stock Price Data
- Getting Weather Data
Summary View
The first thing you would see after importing data in Exploratory is the Summary view, which helps you quickly understand the brief overview of the data.
- Under development…
Data Visualization
Basics
1. Creating the 1st Chart
It will show you the basic concept of Exploratory’s Chart by creating the 1st chart.
2. Create Multiple Charts with Repeat By - Small Multiples
You can assign a column to ‘Repeat By’ to separate a single chart to multiple charts. For example, you might want to create a chart per country or month and line them up to compare among them.
- Under development…
3. Introduction to ‘Pin’ Feature
‘Pin’ is one of the unique and useful features of Exploratory and makes a chart to ‘pinned’ to one of the data wrangling steps (at the right-hand side).
This might confuse you at first, but once you get used to it you’ll realize how useful this feature is. We’ll put together a following note to introduce the concept and how to use it.
4. Filtering Data inside Chart
In Exploratory, you can filter the data by using Data Wrangling Step (at the right-hand side), but you can also filter the data in each chart tab. We call it ‘Chart Filter’, and this can be very useful when you want to create multiple charts with different slice of data quickly.
- Under development…
5. Adding Comments to Chart
In Exploratory, you can add comments to each chart and analytics. This is useful especially when you are creating many charts to answer questions while exploring data.
Next Step
Using Window Calculations
You can use the below listed Window Calculations directly inside the Chart to transform the values that are assigned to Y-Axis and visualize the data from various perspectives.
| Type | Example |
|---|---|
| % of (Total) | Ratio of Total Sum |
| Difference | Difference from Average, Difference from First value, etc. |
| % Difference | % difference from Average, % difference from First value, etc. |
| Moving | Moving Average, Moving Sum, etc. |
Categorize Numerical Values - Binning
You can categorize the numeric values inside the charts.
Limiting Categories at X-Axis
You can limit the X-Axis values by using a condition or by Top / Bottom N.
Highlighting a Part of Chart
Sometimes, you want to highlight a part of the chart to emphasize your point or understand your subject like above.
Data Wrangling
1. Converting Data Types
You might see different data types assigned to some of the columns of data you have imported. You can quickly change them by using the column header menu.
2. Creating Calculations
You can create your custom calculations and create new columns or override existing columns.
- Under development…
3. Filtering Data
Filtering data in Exploratory is super flexible. There are tons of filtering operators supported inside the UI dialog, and you can extend it by creating custom filters.
- Under development…
4. Summarizing Data
By using the Summarize dialog you can quickly summarize (aggregate) your data.
5. Joining with Another Data Frame
You can use ‘Join’ to join with another data frame to bring the columns or filter the data.
6. Merging with Other Data Frames
You can use ‘Merge’ to bring rows from other data frames.
6. Combining Multiple Columns with Unite
You can combine multiple columns into a single column with concatenated text values with ‘Unite’ step.
7. Separate a Column to Multiple Columns
It’s the opposite of the above. You can separate a text value by a given letter such as ‘comma’, ‘space’, etc. and create multiple columns to hold the separated values.
8. Transform Wide Data to Long Data (Unpivot) with Gather
Sometimes, you might have data where the years or the country names are presented as columns. This often makes it harder to visualize or analyze.
This type of data is called ‘Wide’ data, but you can use ‘Gather’ step to transform it to ‘Long’ data, which has a ‘Year’ column and a column for the corresponding value.
- Under development…
9. Transform Long Data to Wide Data (Pivot) with Spread
This is the opposite of the above. You can transform the ‘Long’ data to the ‘Wide’ data with the ‘Spread’ step.
Analytics (Statistics / Machine Learning)
Random Forest
Random Forest is one of the most popular machine learning algorithms and often used in Exploratory Data Analysis to find the relationship among the variables.
Time Series Forecasting with Prophet
Linear Regression
Cohort Analysis with Survival Curve
Reporting
Dashboard
Parameter
By using the Parameter, you can make your Dashboard, Note, Slide, and Chart interactive.
For example, by embedding the parameters as part of SQL queries the audience of the Dashboard can manipulate the queries. Or, by using the parameters as part of the data wrangling steps, the audience of your Note can dynamically transform the data or analytics inside the Note.