How to Visualize Puerto Rico Data with Map
Visualizing data with Map is one great way to understand the geographical pattern.
The challenge is, there are a lot of maps in the world. Just to take the United States as an example, there is a State level map, County level, Zipcode, etc. If you want to visualize the election data for Congress you would want a Congressional district level map.
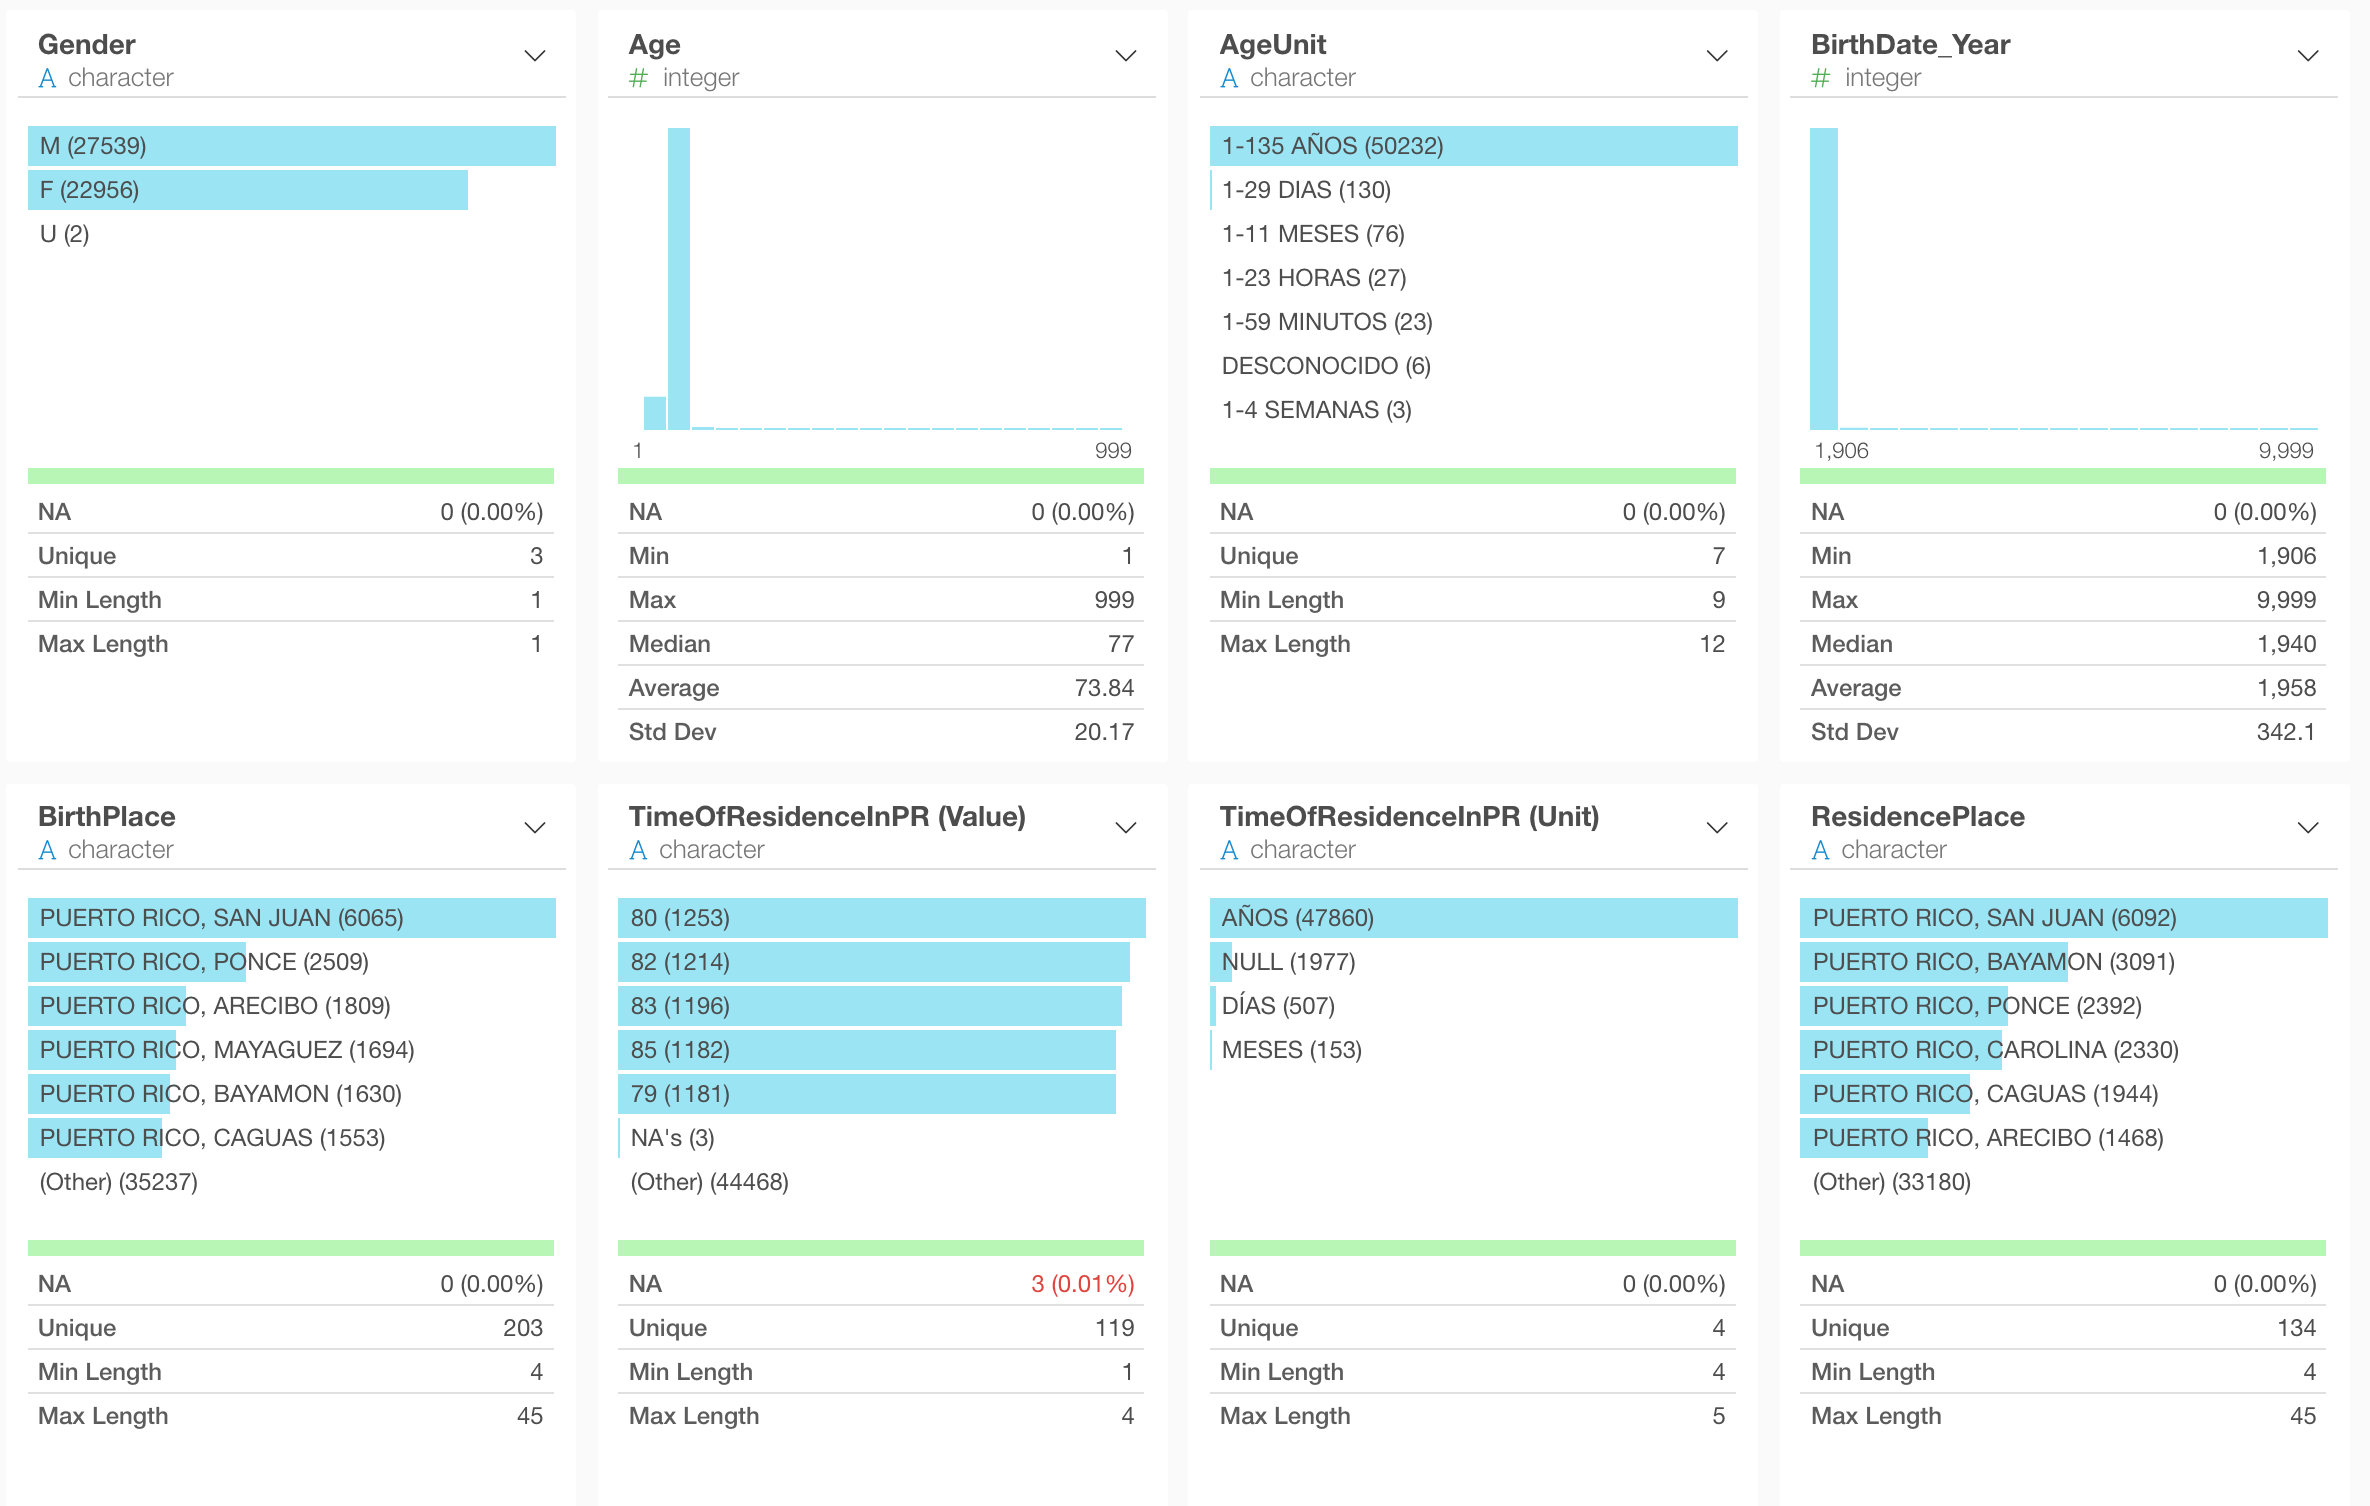
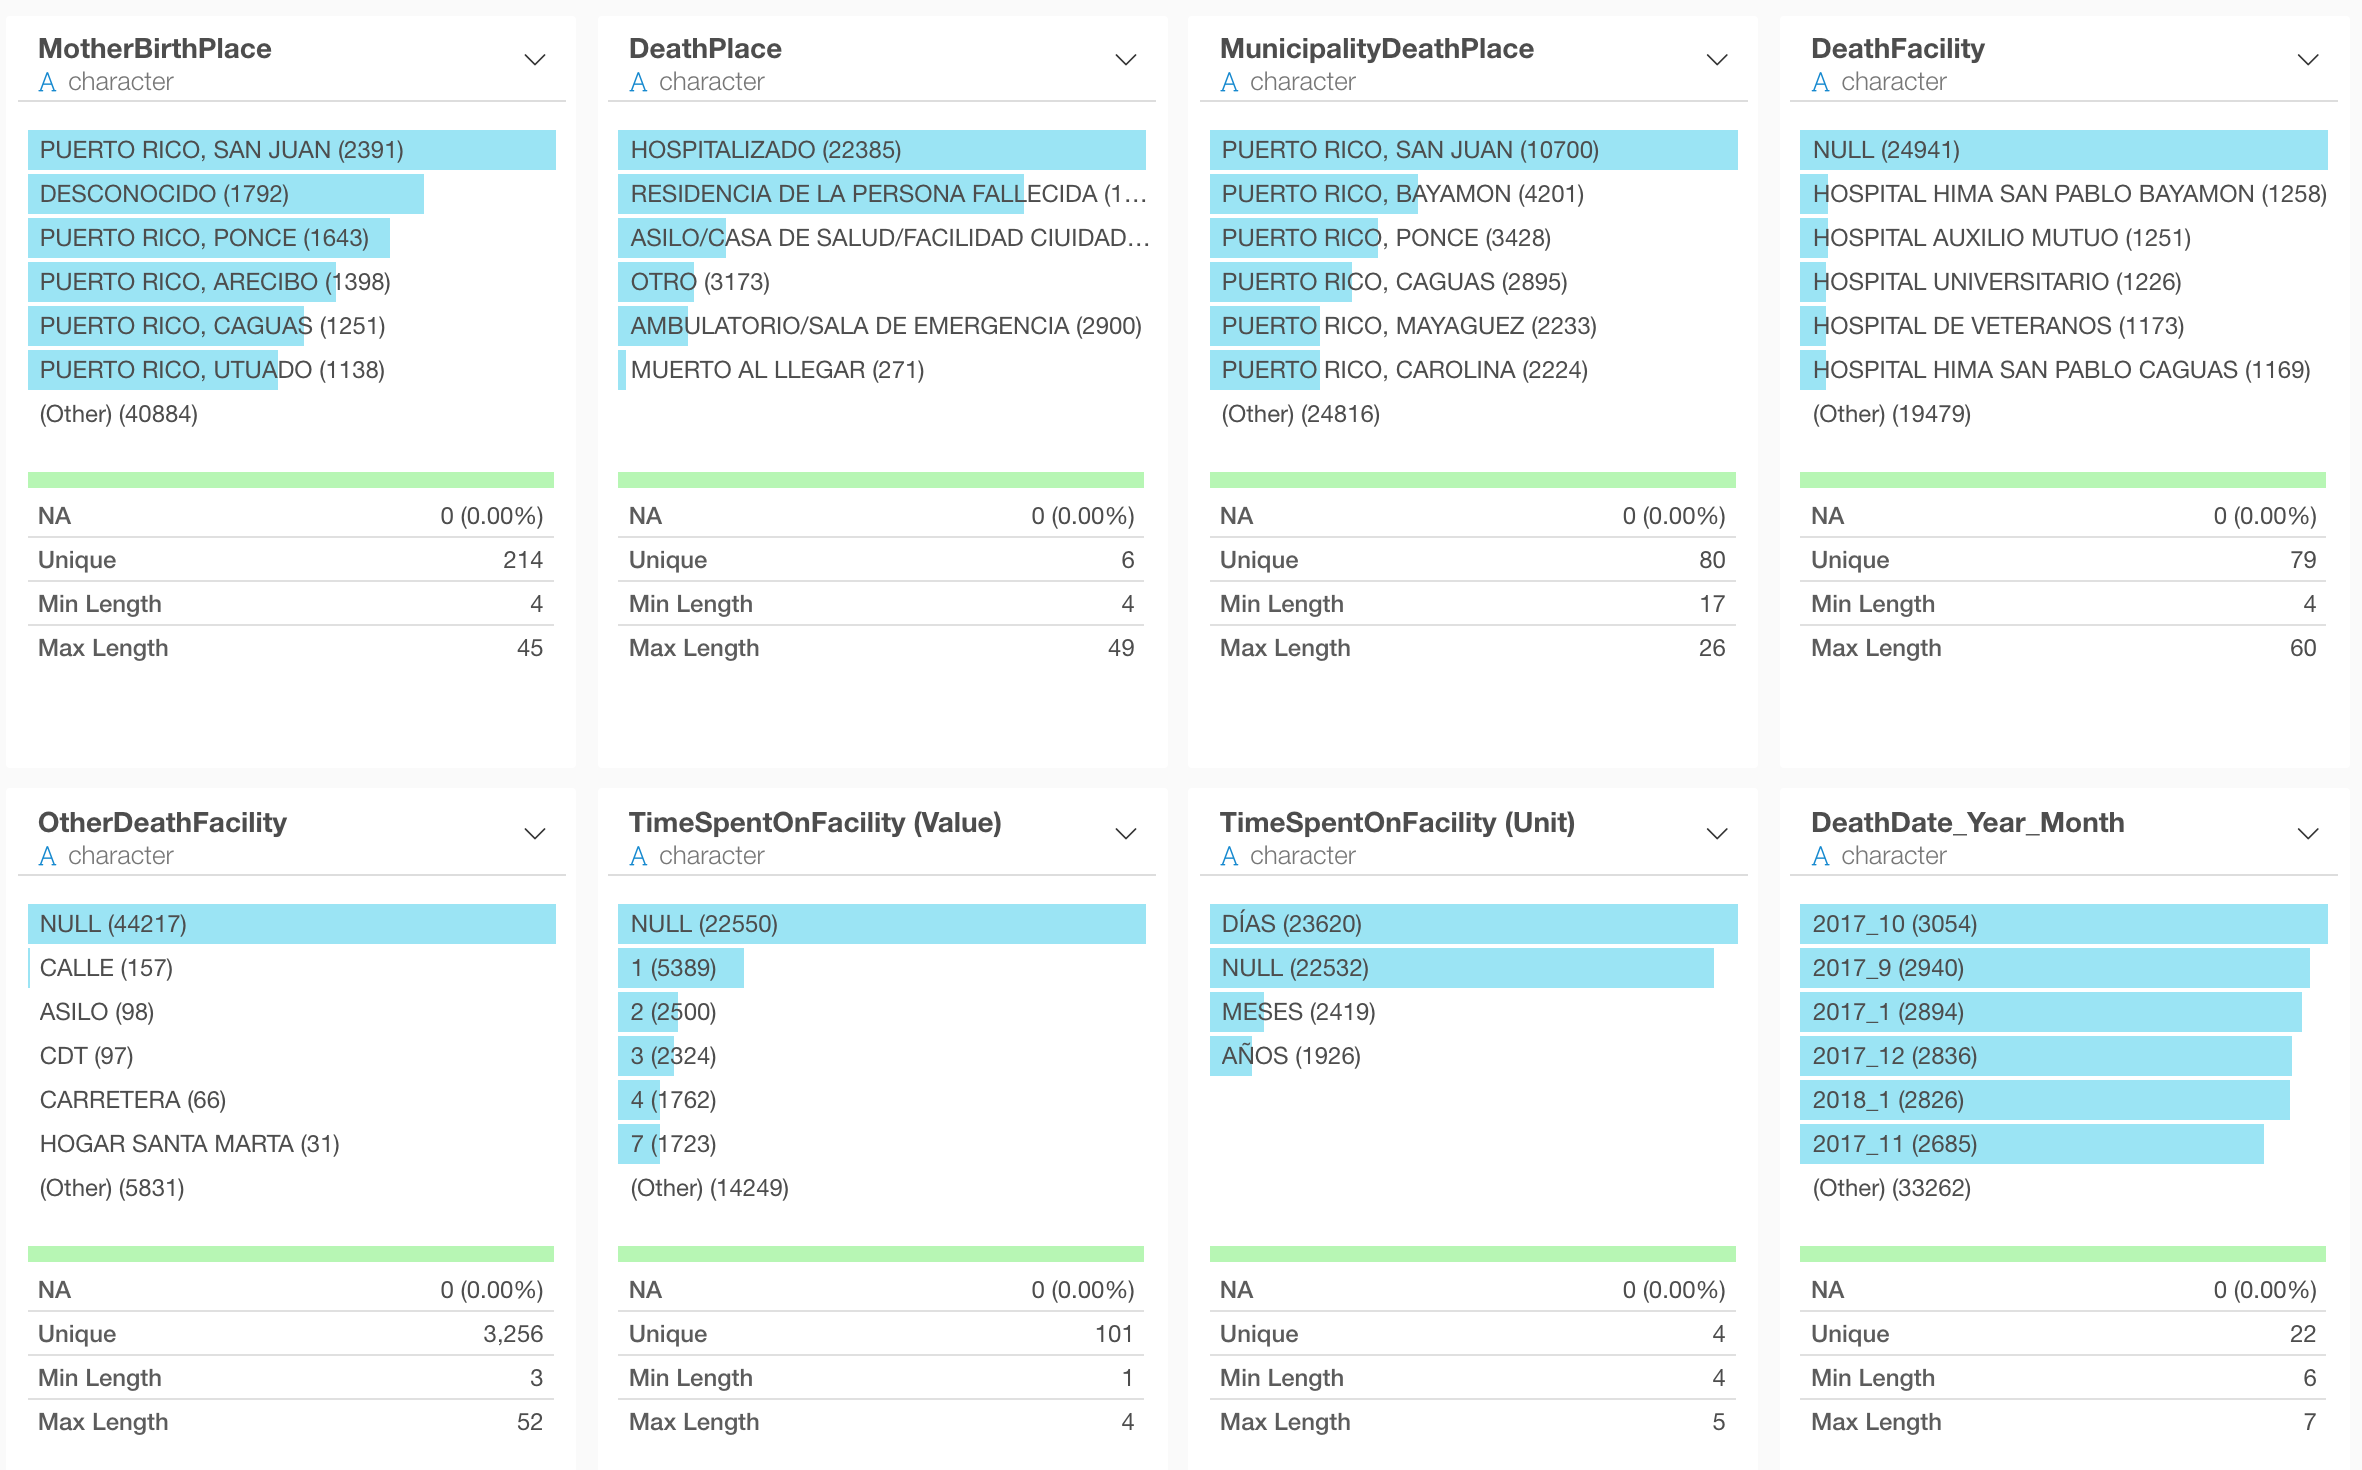
Now, here is a data about the people who died in Puerto Rico between January 2017 and September 2018. (Thanks to Jeremy Singer-Vine. If you haven’t subscribe his news letter “Data is Plural”, you should.)
The government published this data to increase the awareness of the damange done by the disastrous hurricane Maria that hit Puerto Rico in September 2017.
Among many information comes with the data, it includes the data about where each individual died at the municipality level.
To visualize it on Map, we need Puerto Rico municipality level map.
Exploratory doesn’t have it by default. But, it supports ‘bring your own GeoJSON’, which means that you can find or create one and install it, then use it to visualize the data on the map.
Let’s see how we can go about it.
Find Puerto Rico Municipality Map
Usually, you can find GeoJSON files for the maps you want just by googling. If you can’t, you might have a better chance of finding the maps in Shapefile format, then you can convert it to GeoJSON. You can take a look at here on how to do such.
Anyway, just google something like the below.
“GeoJSON for Puerto Rico Municipality”
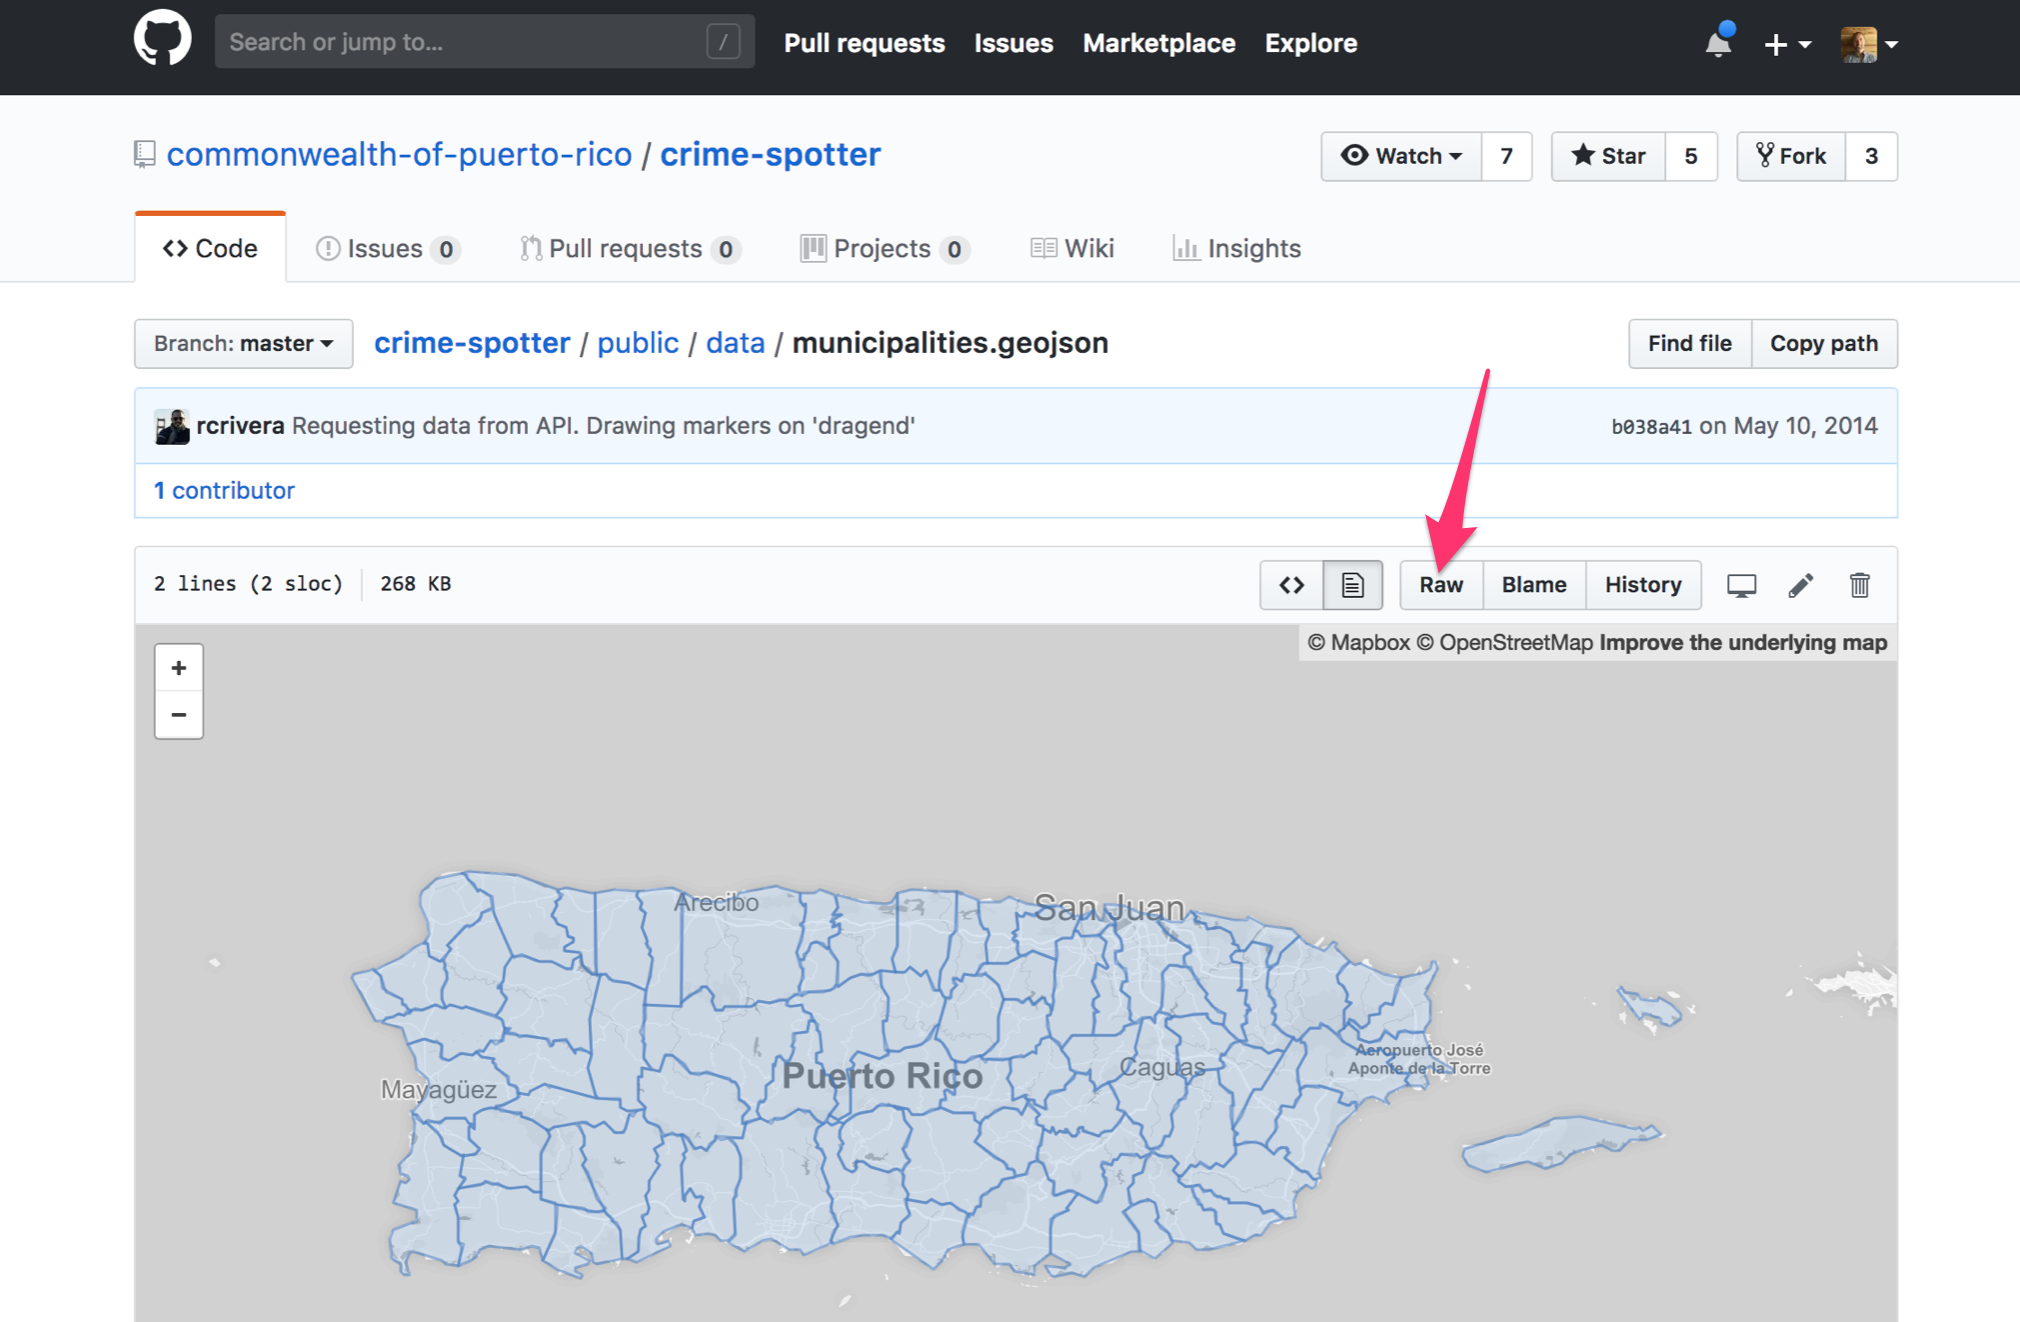
I found this Github page.
And I downloaded the GeoJSON.
Then, I can import it into Exploratory.
Import GeoJSON
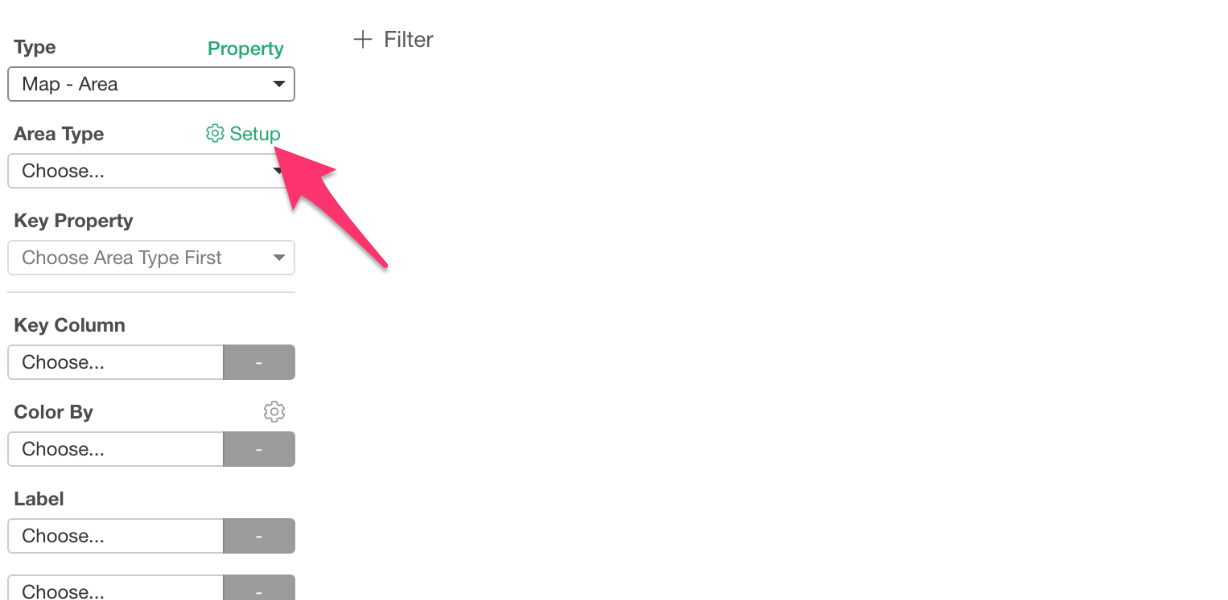
Go to Chart view and select Map - Area type.
Then, click on ‘Setup’ button.
This will open Map Extension dialog.
Go to ‘Add New’ section and click ‘Add from Local’ button at the right hand side top.
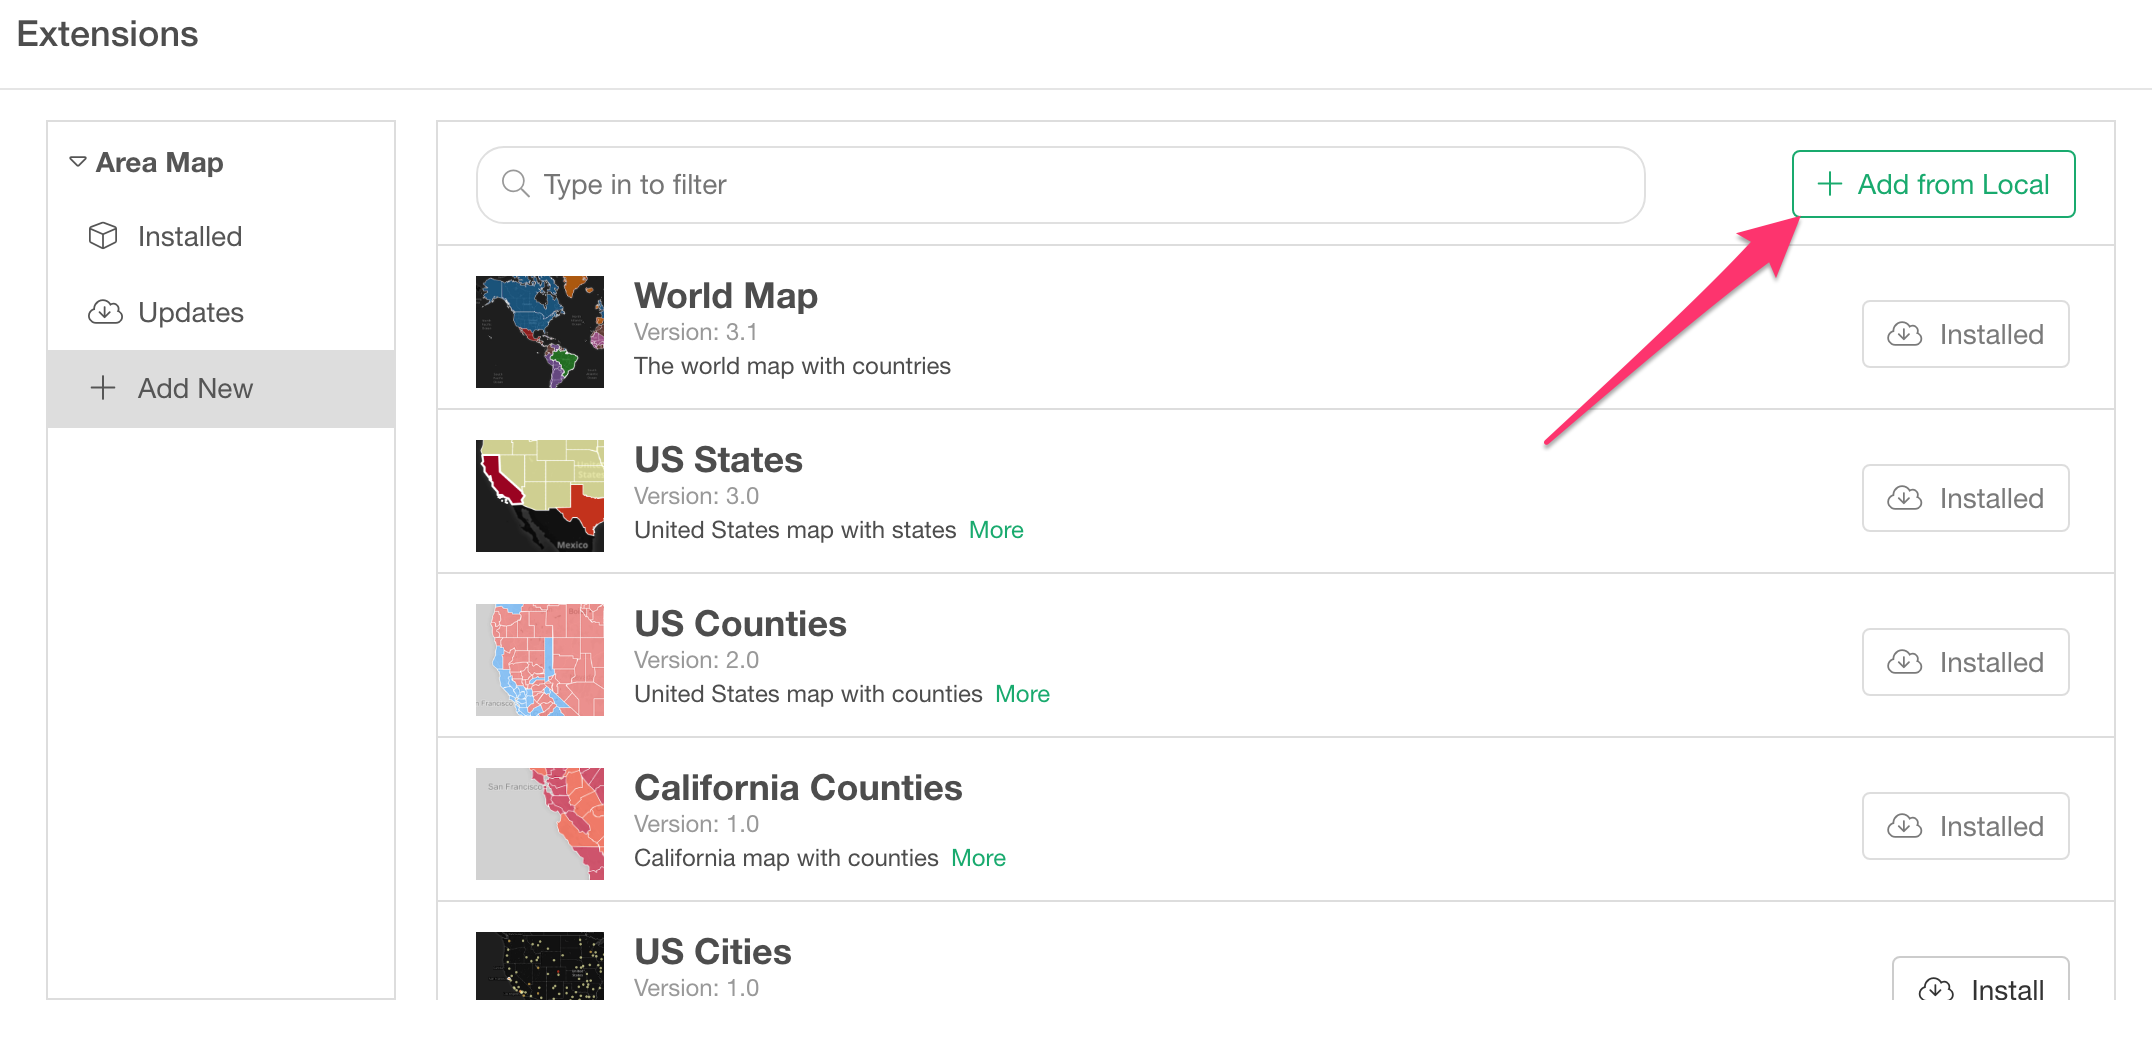
Select the downloaded GeoJSON file to install.
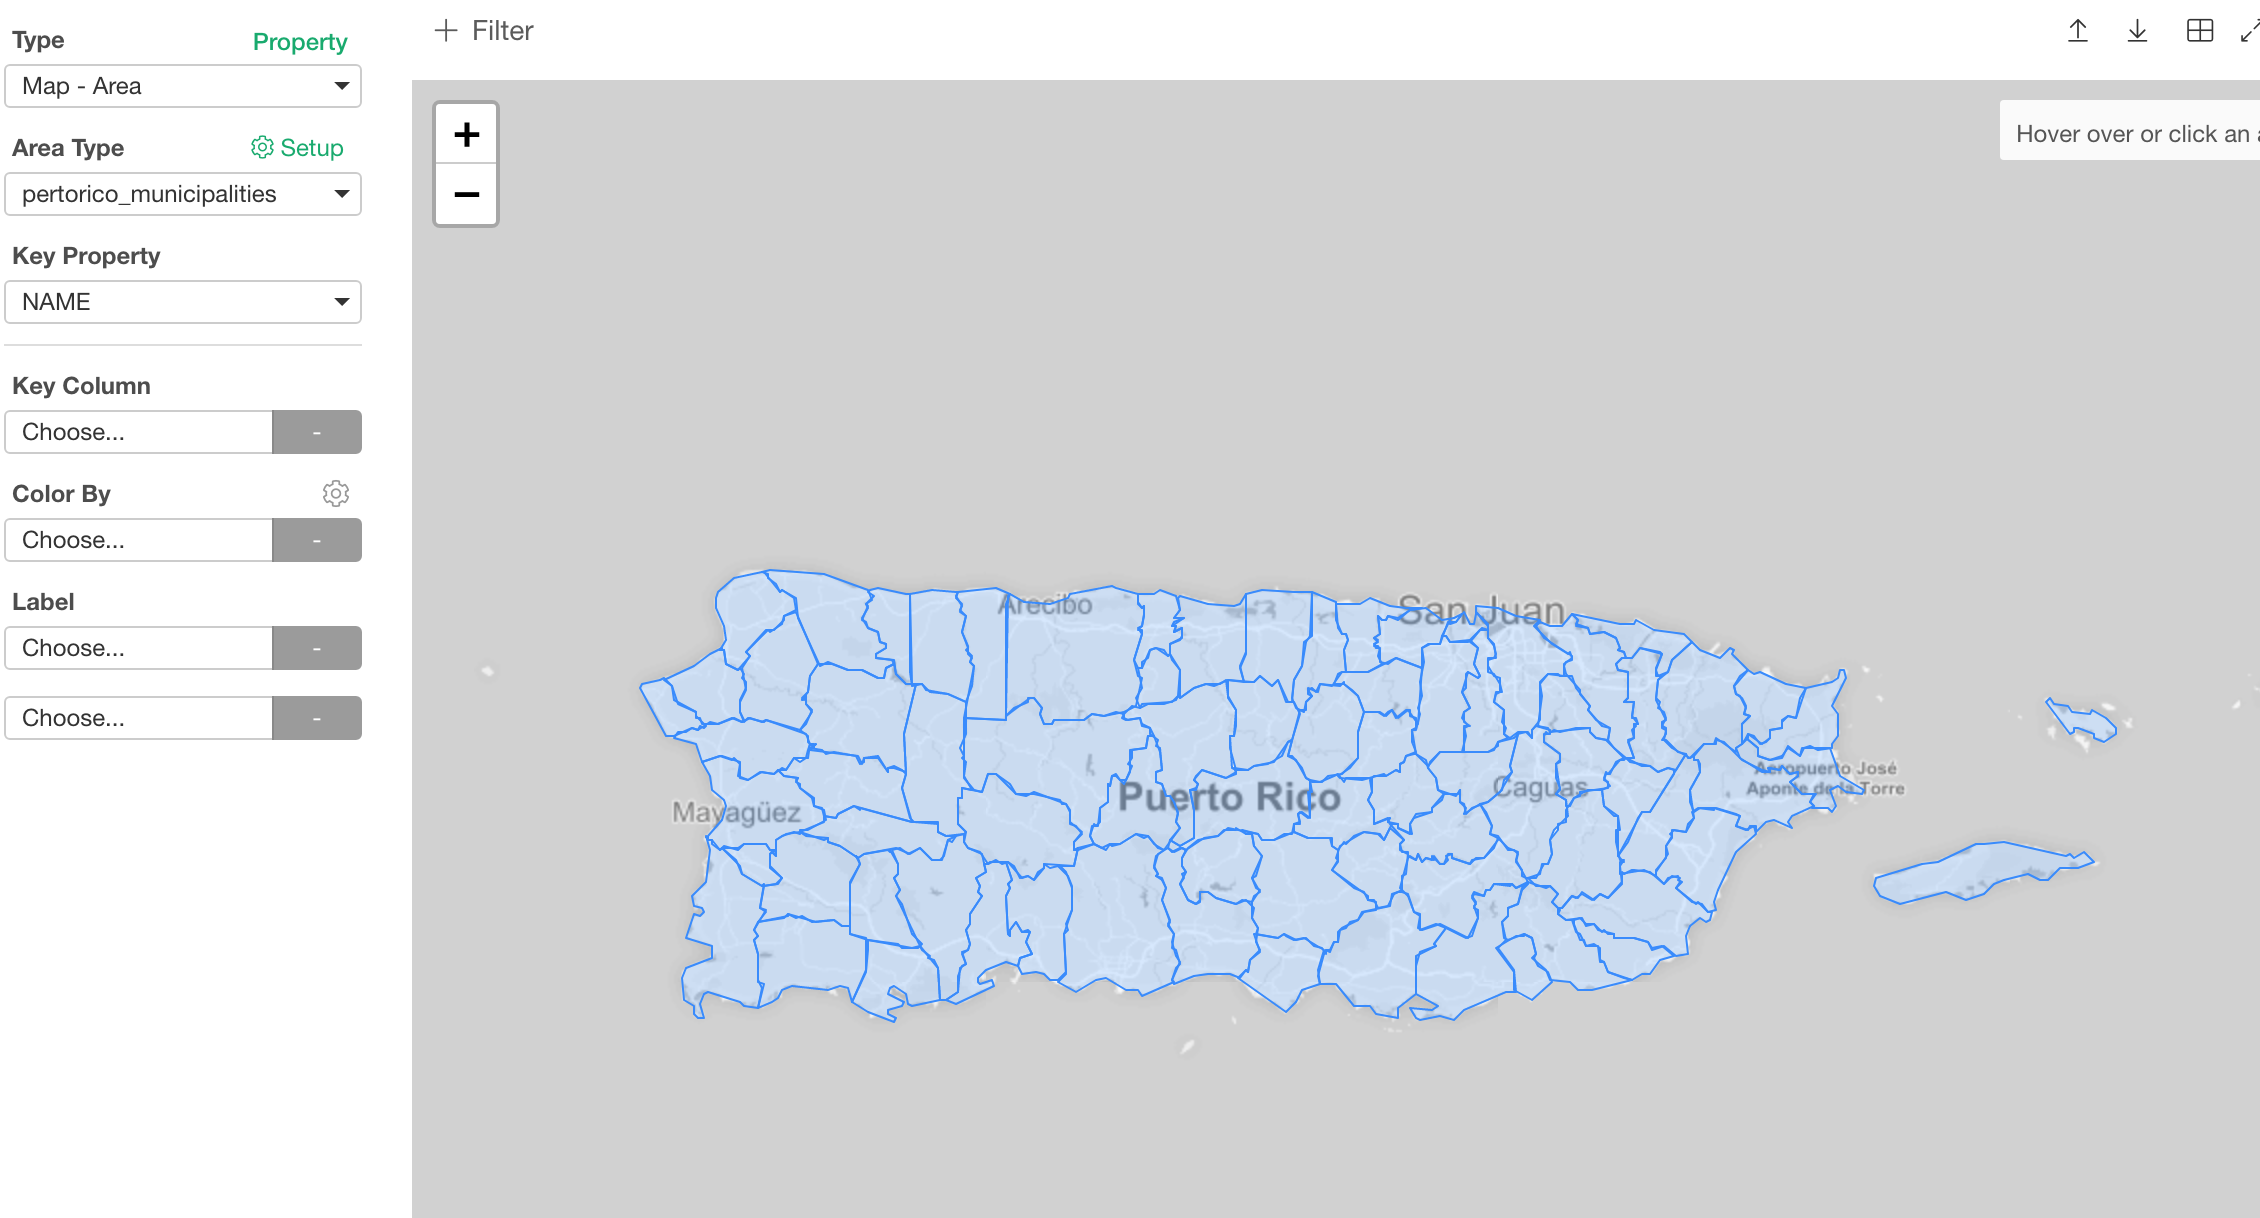
Once it’s installed, select the installed GeoJSON under Area Type.
How to use GeoJSON map
You can select which property of the GeoJSON to associate with the data.
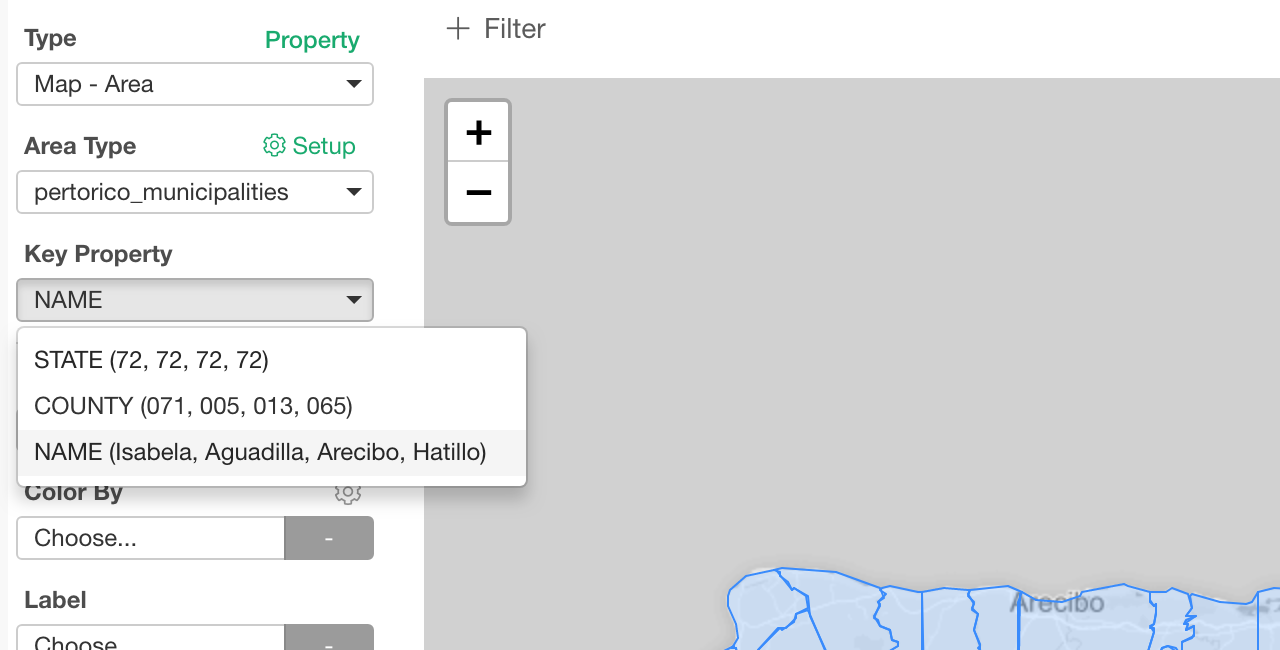
This GeoJSON has three properties.
- STATE
- COUNTY
- NAME
And NAME is the one we want to use to map with the data.
Now, here is the thing.
This NAME property has the name of the municipality. But those contain Spanish alphabets.
But the data that is provided by the Puerto Rico government has all English alphabetes for some reason.
Here is the difference between English and Spanish alphabets.
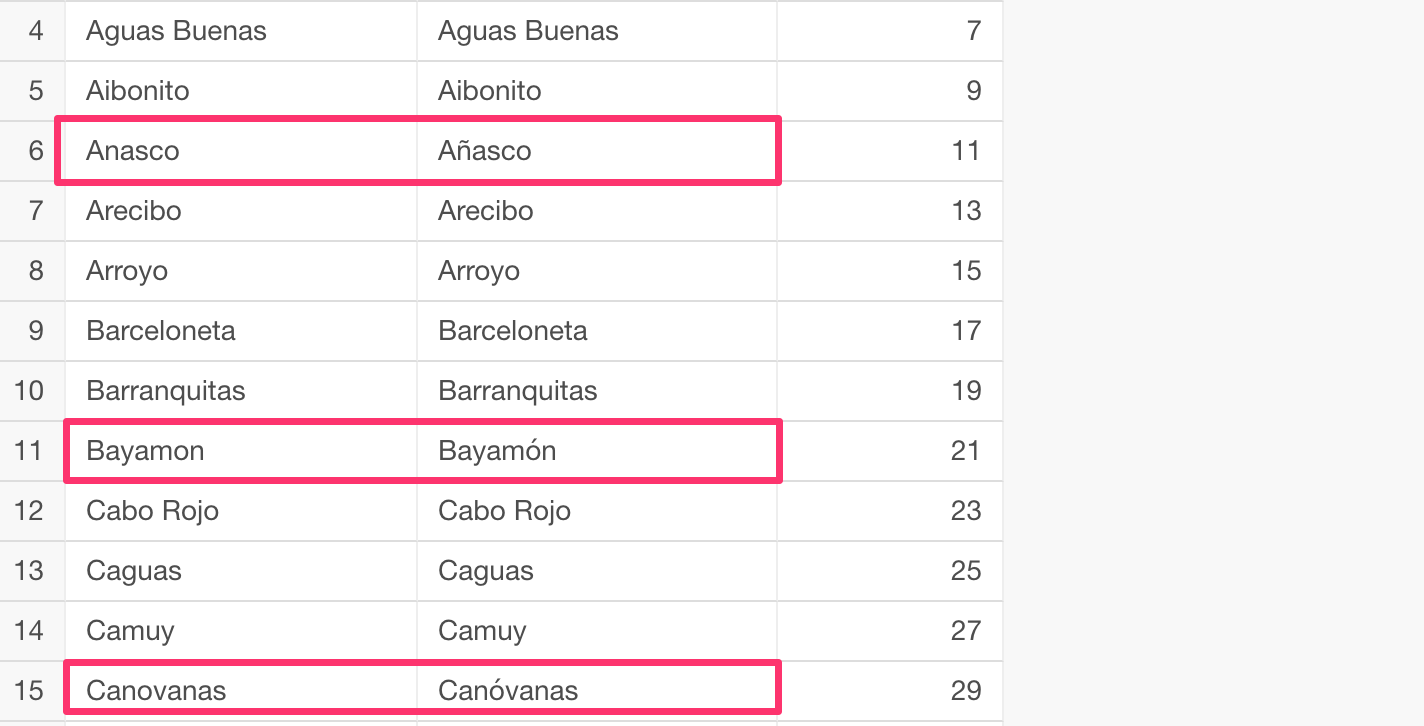
So we need to make sure that the data we have has the corresponding Spanish alphabet names so that we can map the data with the GeoJSON map.
Map with Spanish Municipality Names
Here is a list I have created in case you need it, you don’t have to do this from scratch!
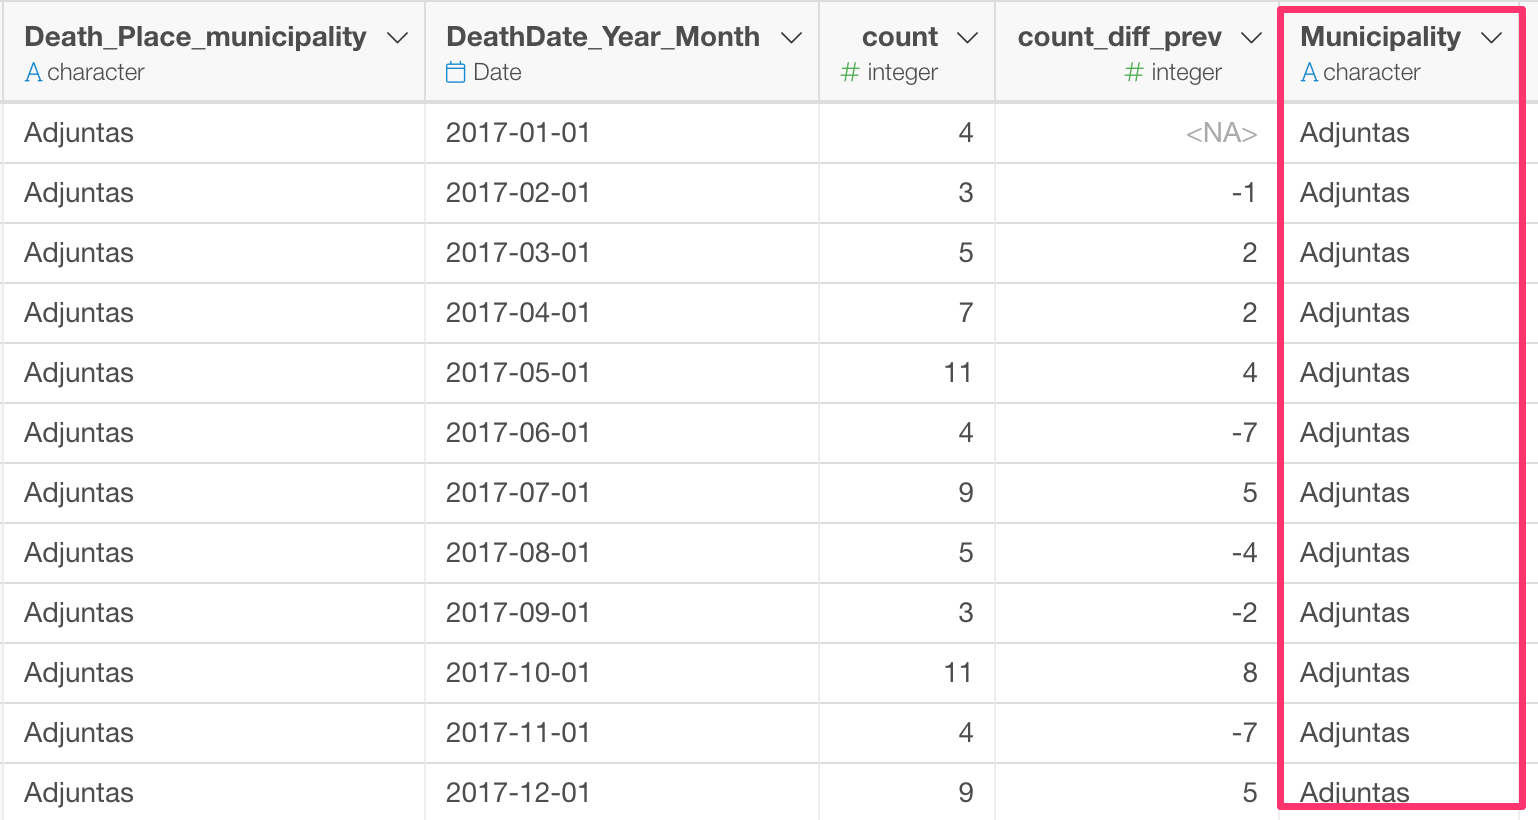
I can join this to the data.
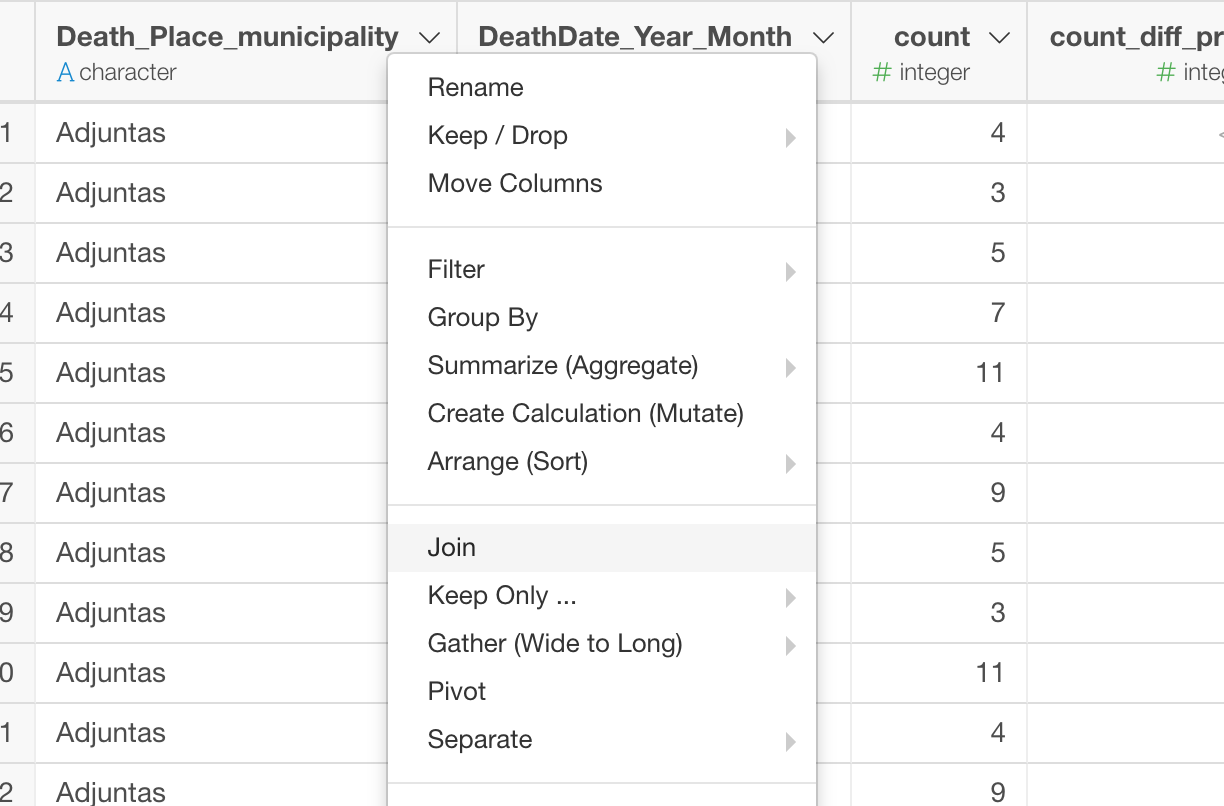
You can take a look at the details on how to join two data sets here.
Visualize it
Now that we have the spanish names we can use it.
We can select ‘NAME’ for Key Property, this is the property from the GeoJSON file. And select the spanish name column, in this case, that is ’Municipality, this is from the data and we want to use it to map with the GeoJSON map.
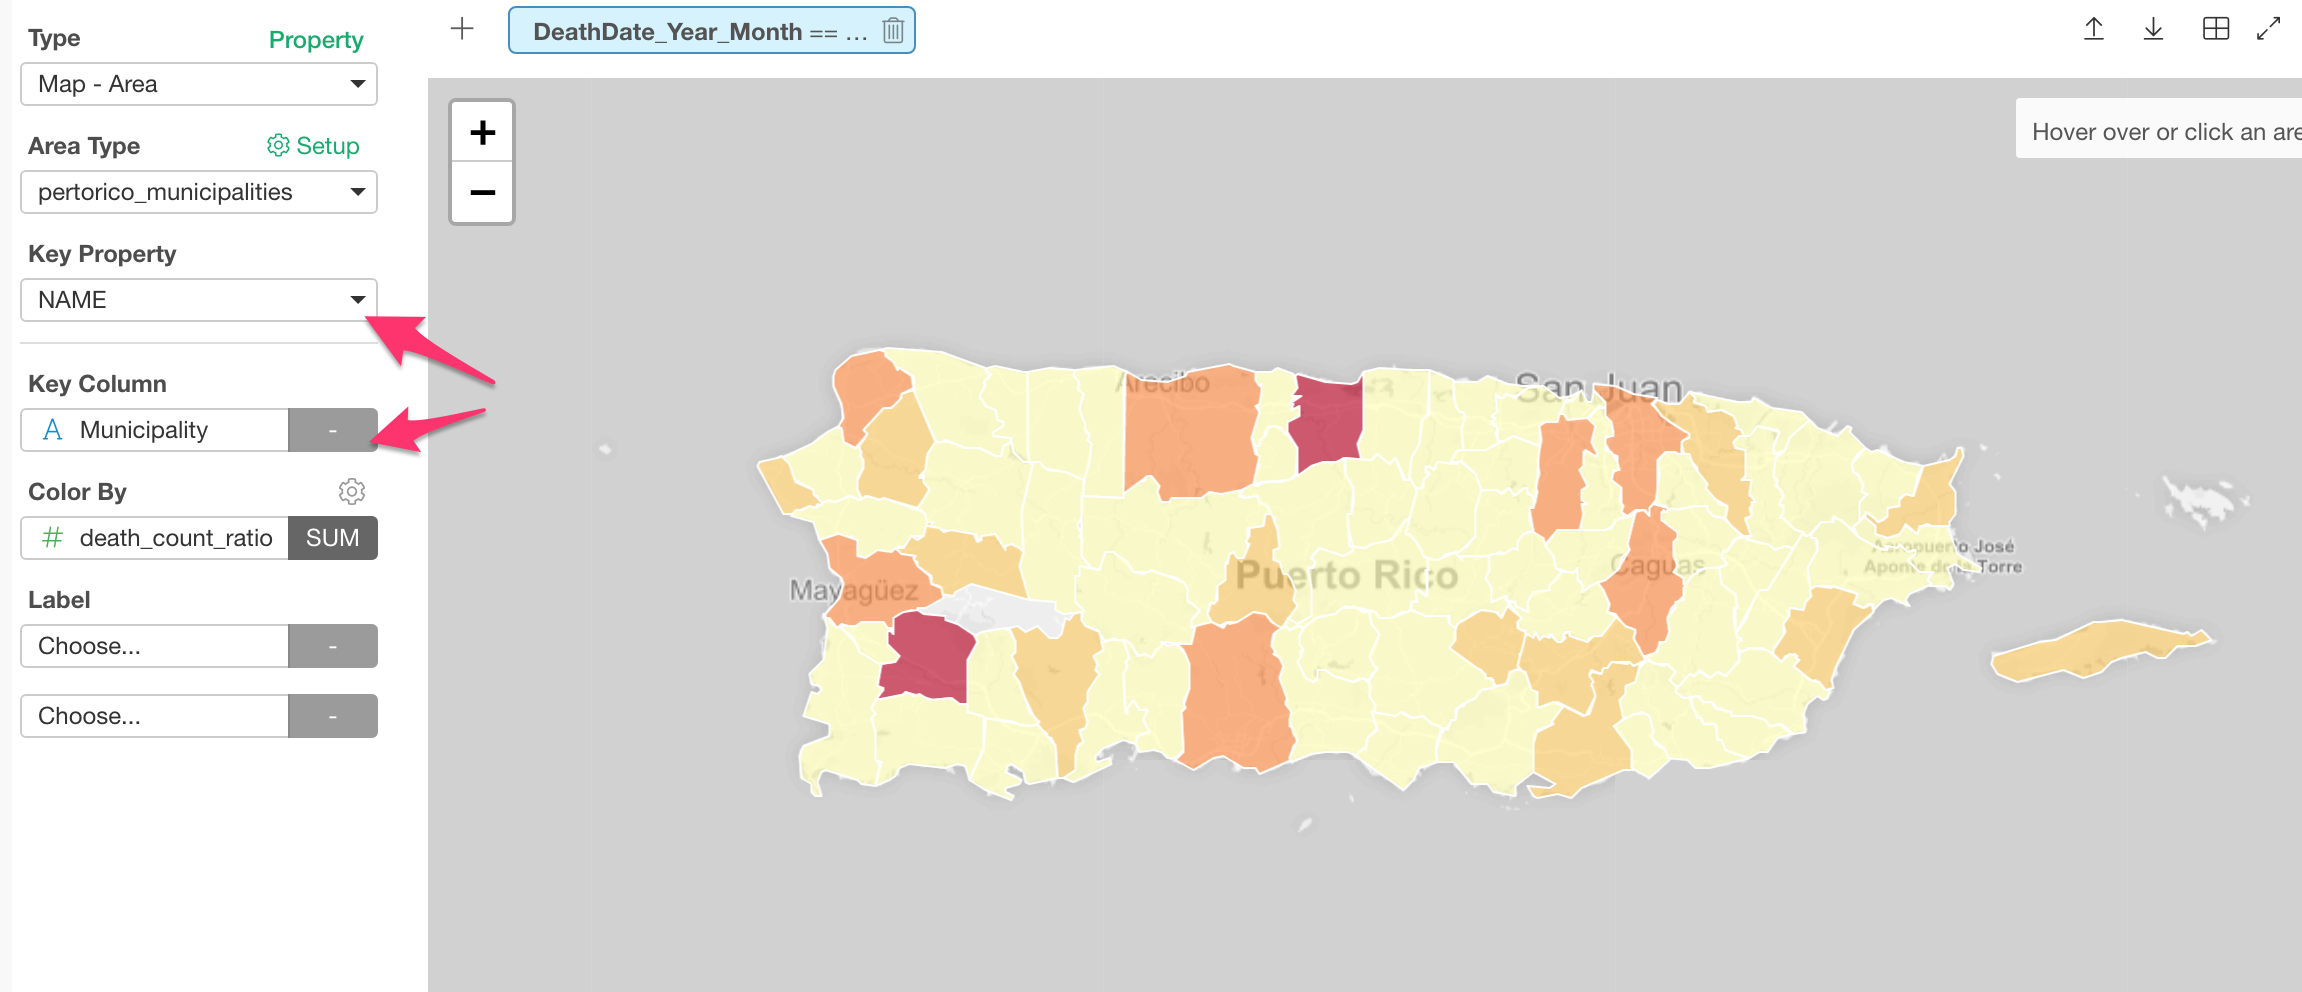
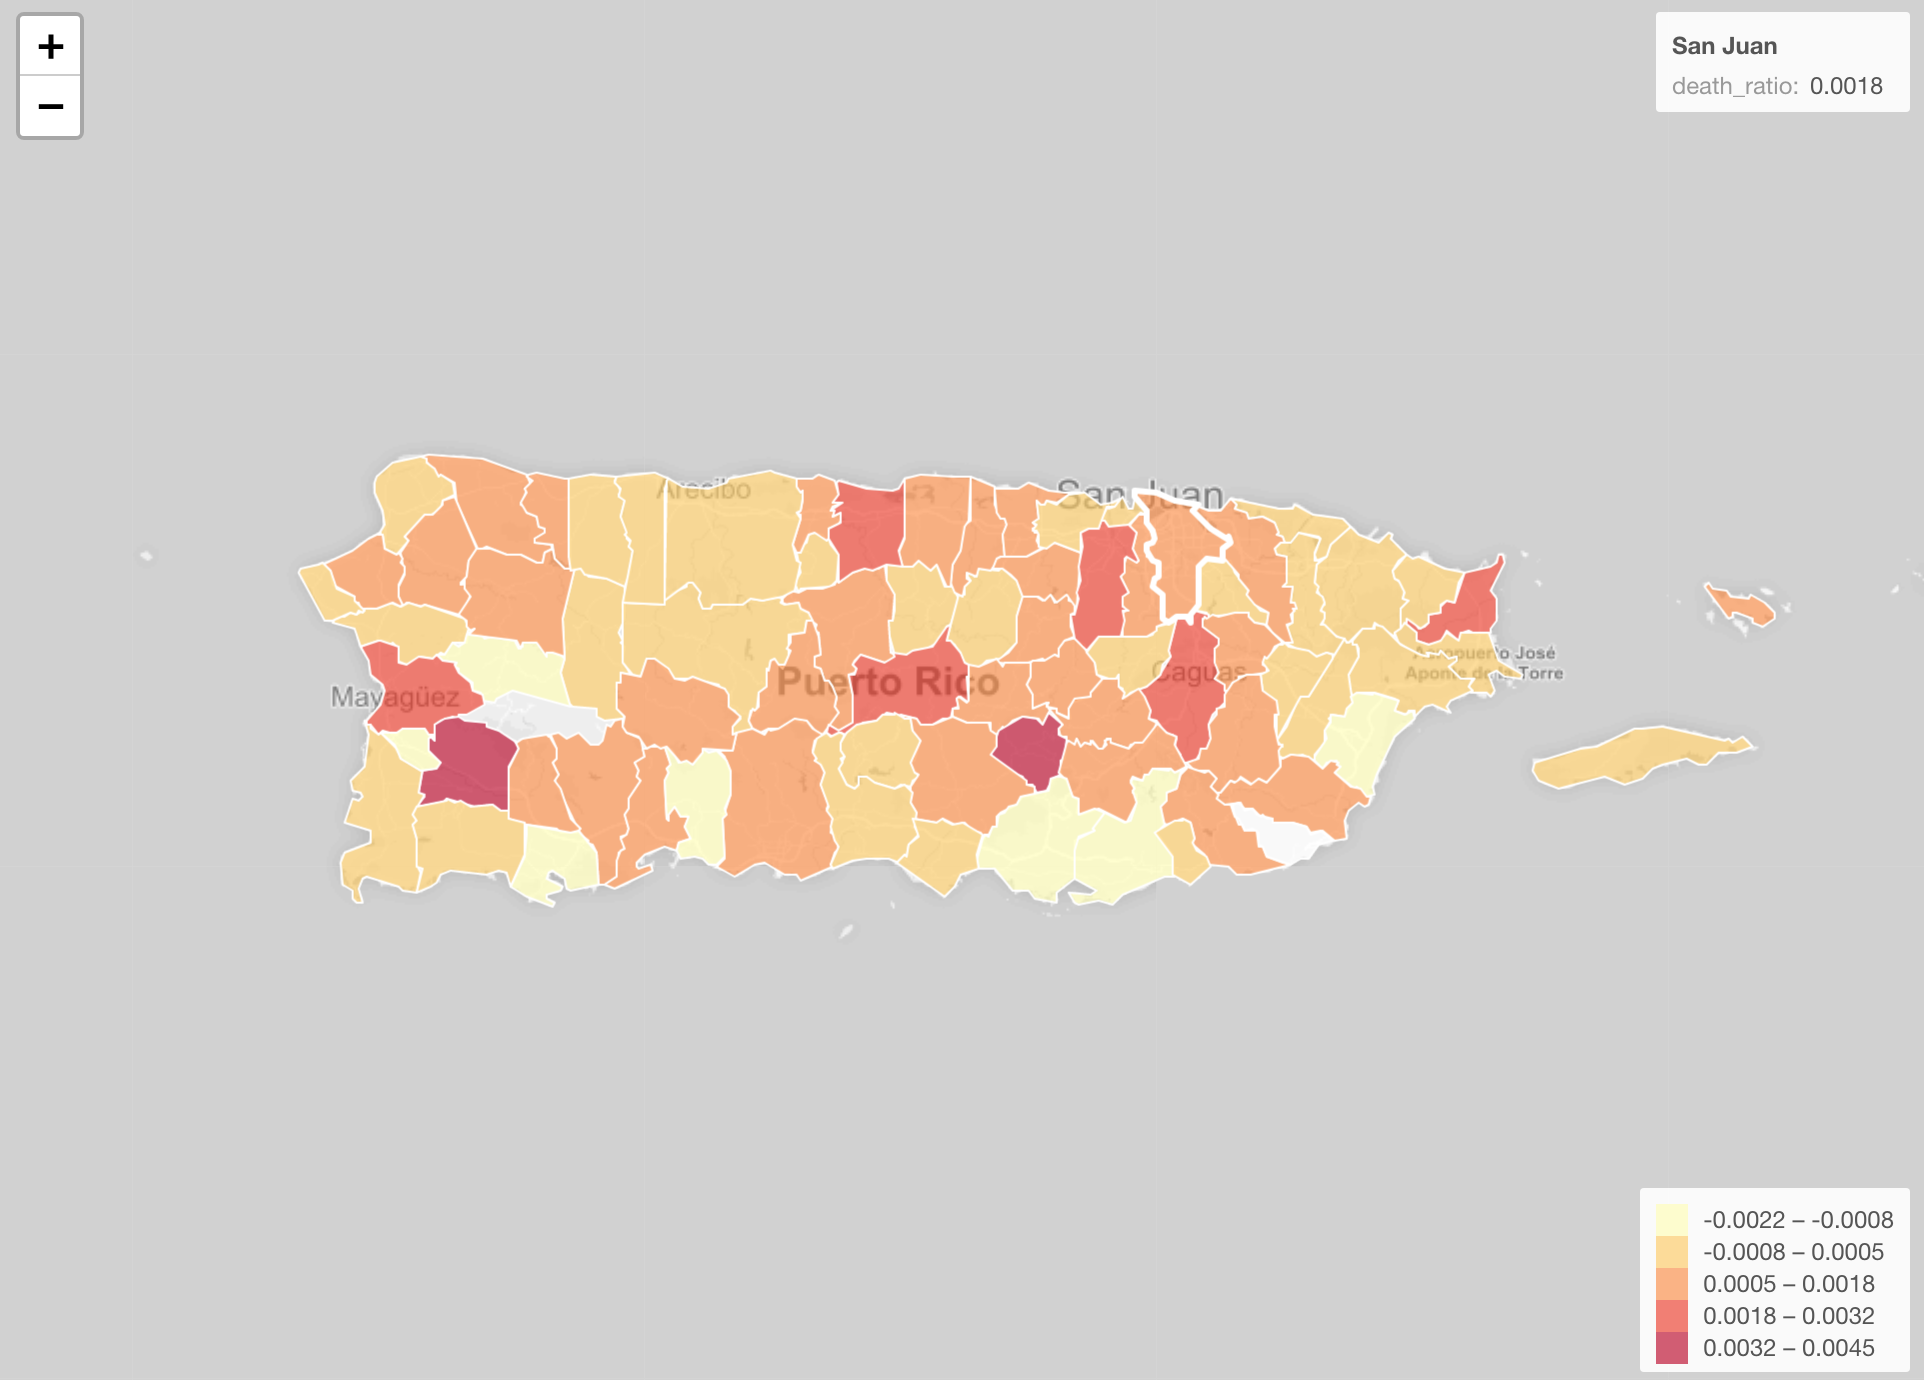
I’m showing the death ratio (number of the deaths / population) in September 2017.
Here is the interactive version that I’m embedding into this note.
Your turn!
You can download this note as an EDF so that you can import to your Exploratory Desktop and reproduce all the data wrangling, visualization, and this note!