Winsorization is one of the technique you can use to ‘normalize’ the raw numeric values by converting the extreme values (outliers) to the lower and the upper bounds of the normal values.
Here is how you can do in Exploratory by writing a custom R function.
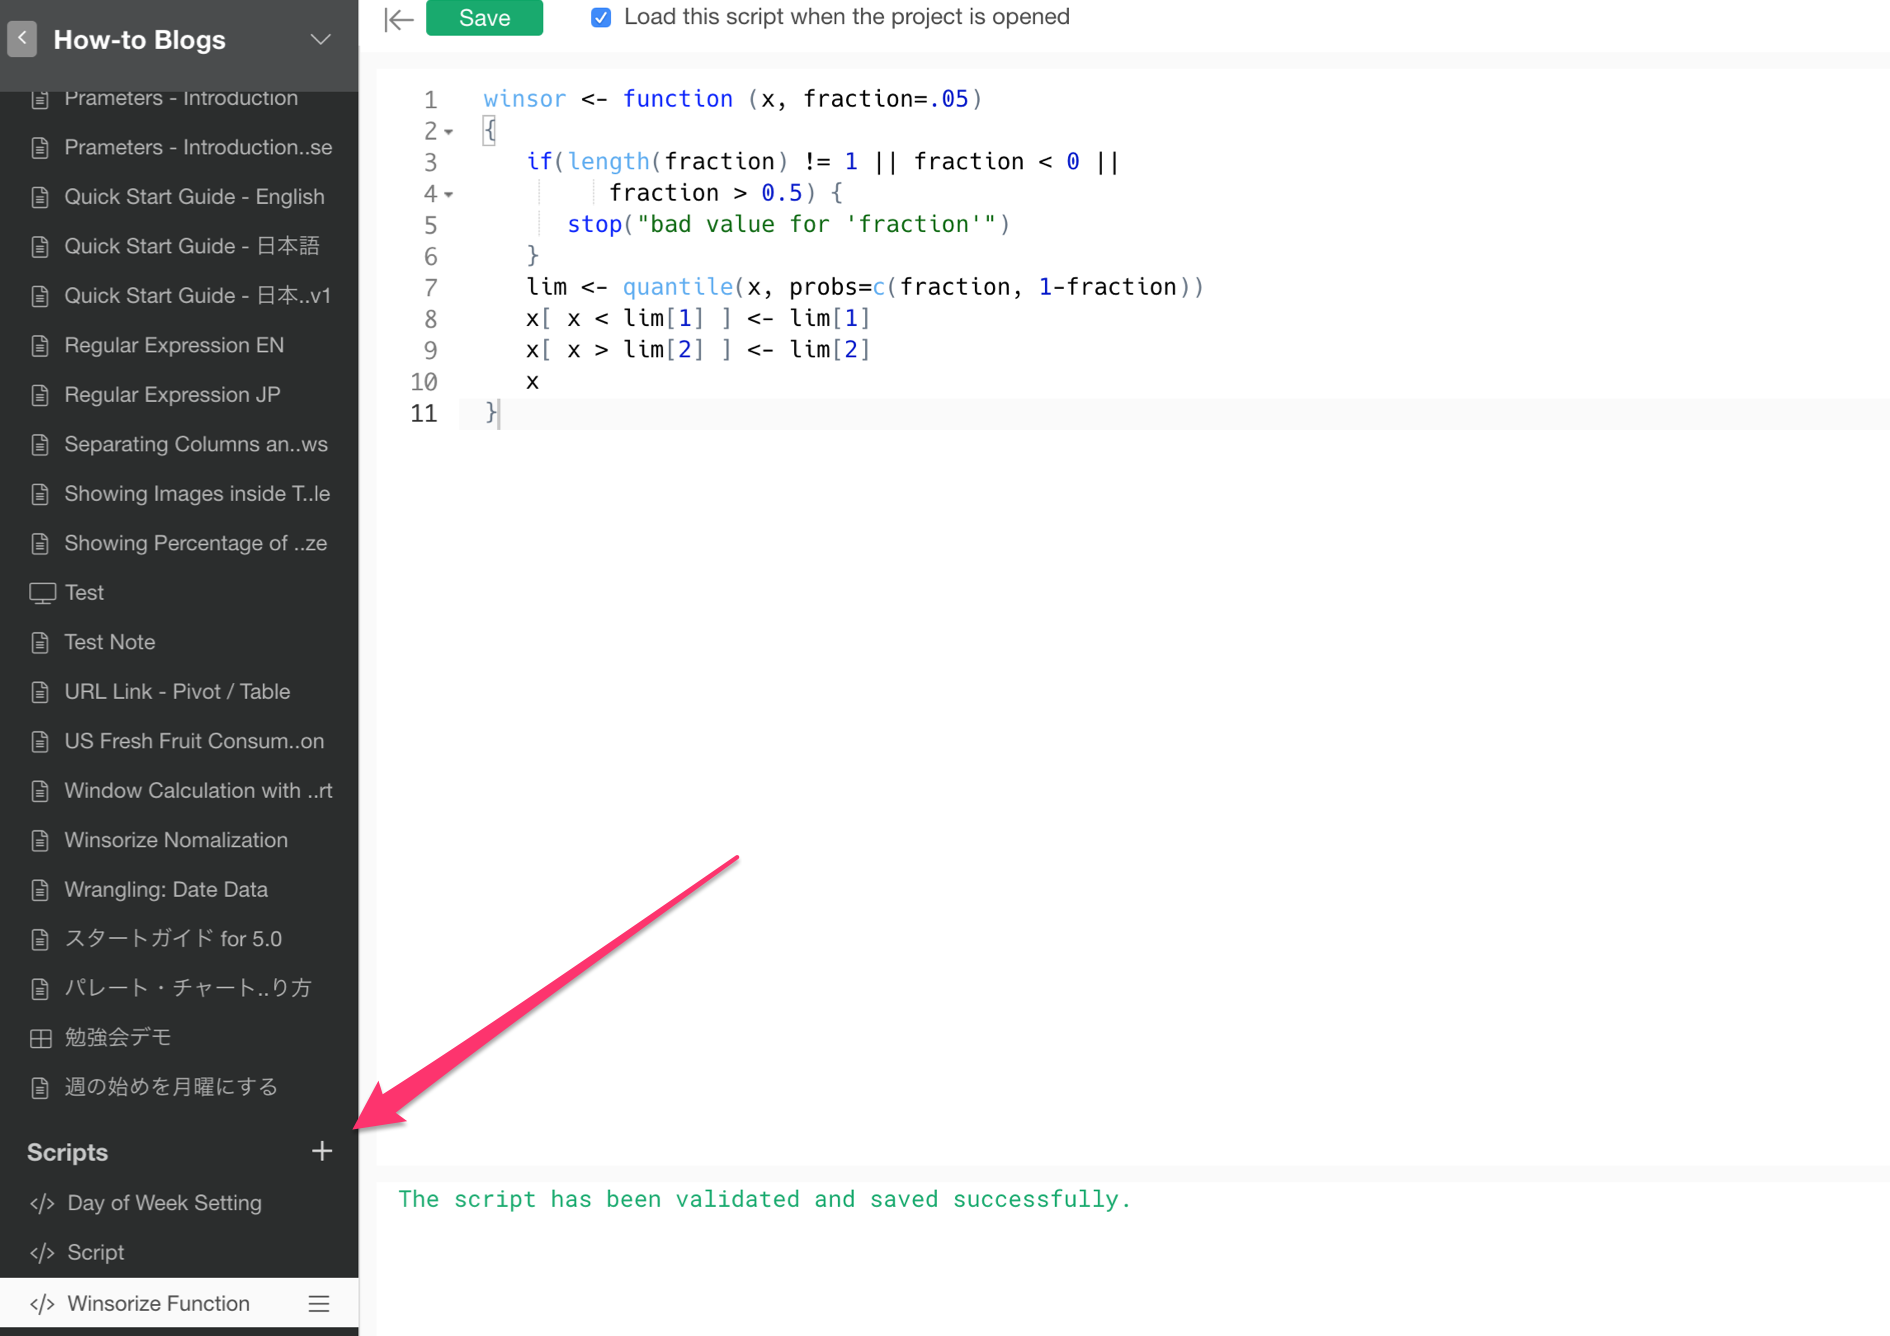
1. Write a custom R function in R Script.
You can write an R function like the below in the Script Editor inside Exploratory.
winsor <- function (x, fraction=.05)
{
   if(length(fraction) != 1 || fraction < 0 ||
         fraction > 0.5) {
      stop("bad value for 'fraction'")
   }
   lim <- quantile(x, probs=c(fraction, 1-fraction))
   x[ x < lim[1] ] <- lim[1]
   x[ x > lim[2] ] <- lim[2]
   x
}
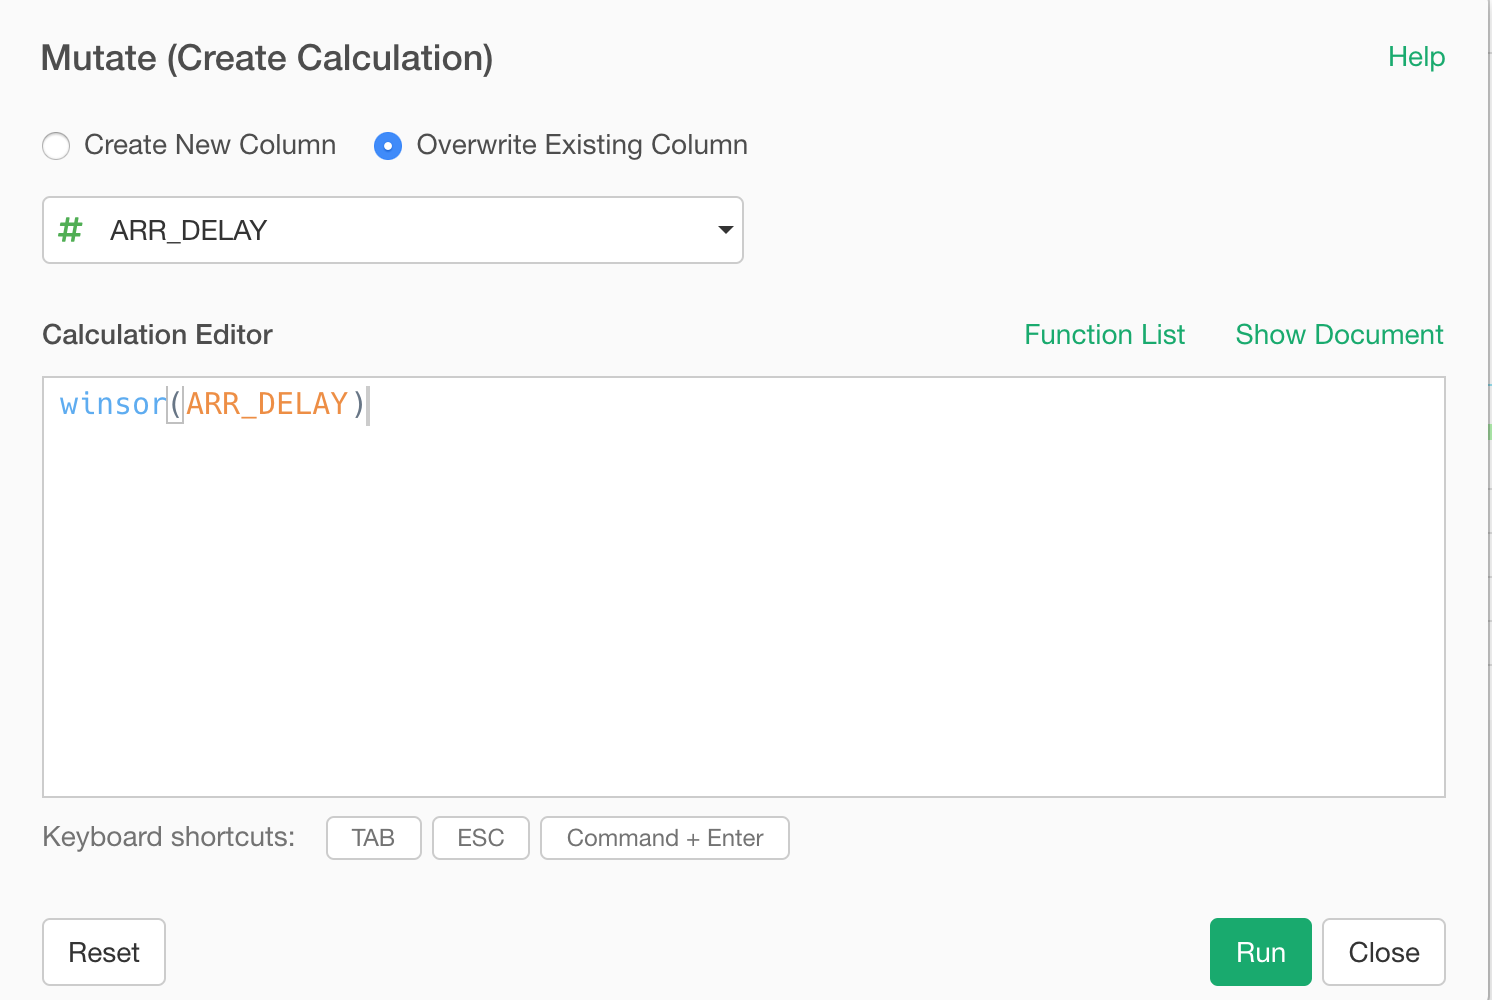
2. Use it in Mutate (Create Calculation) step
Then use it inside ‘mutate’.
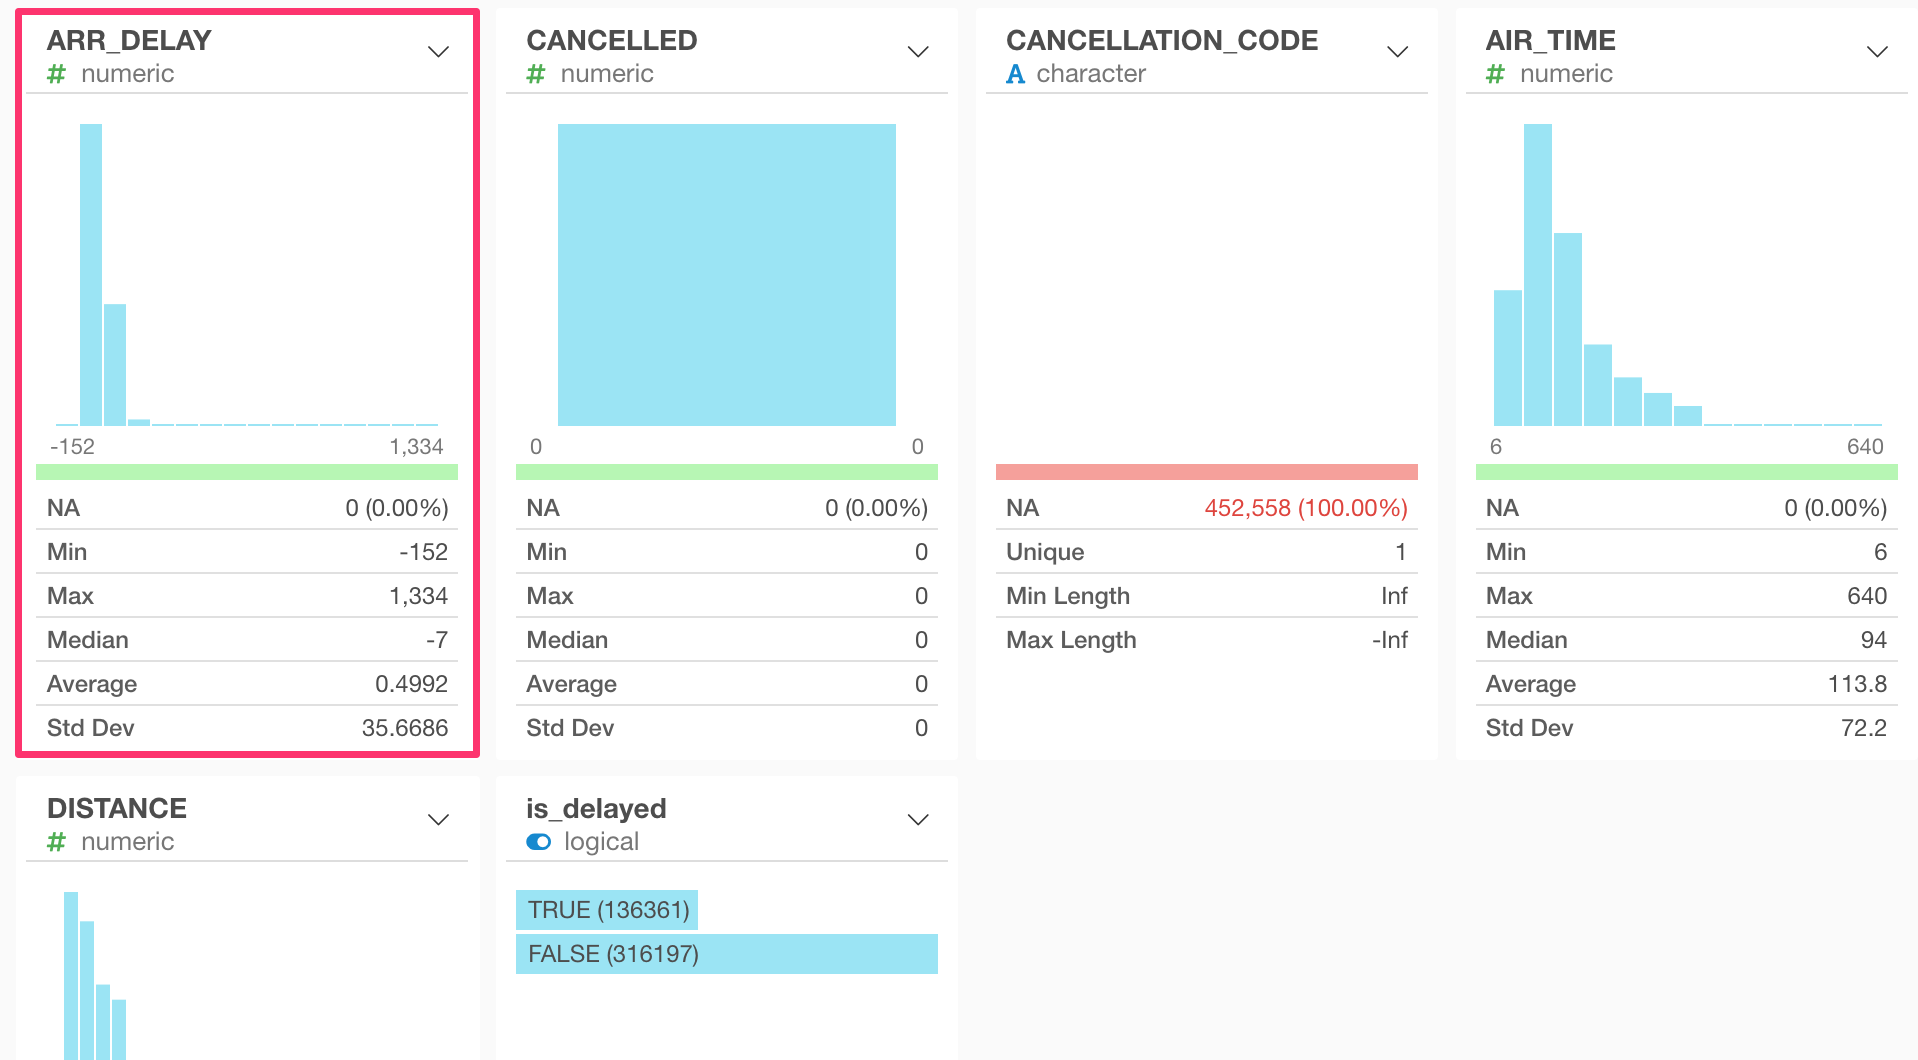
Before:
After:
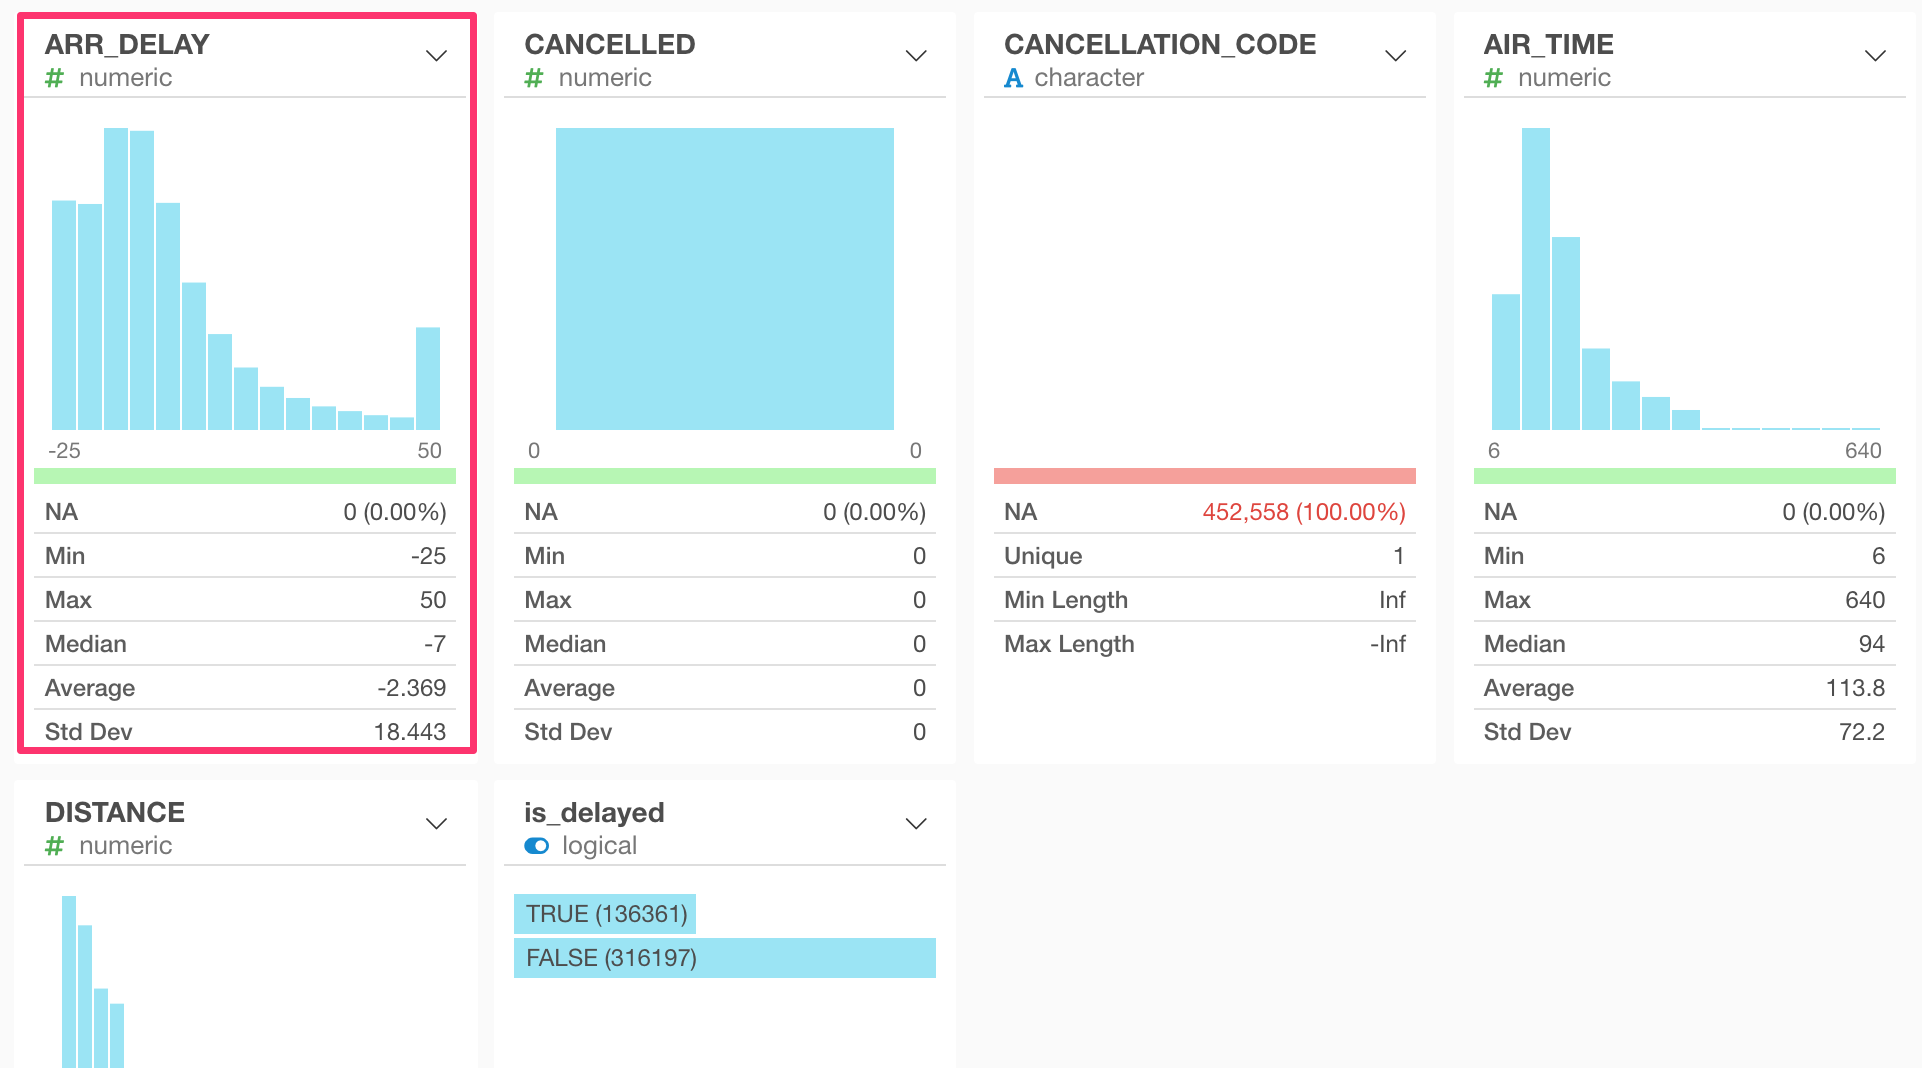
You can see that the range of ARR_DELAY column is now between -25 and 50 where it use to be between -152 and 1,334.
The function above is using 95% as the threshold by default, which means that all the values in the lower 2.5% are converted to the 2.5 percentile value and all the values in the upper 2.5% are converted to the 97.5 percentile vaule.
It could be easier to see the effect of the winsorization with Scatter chart.
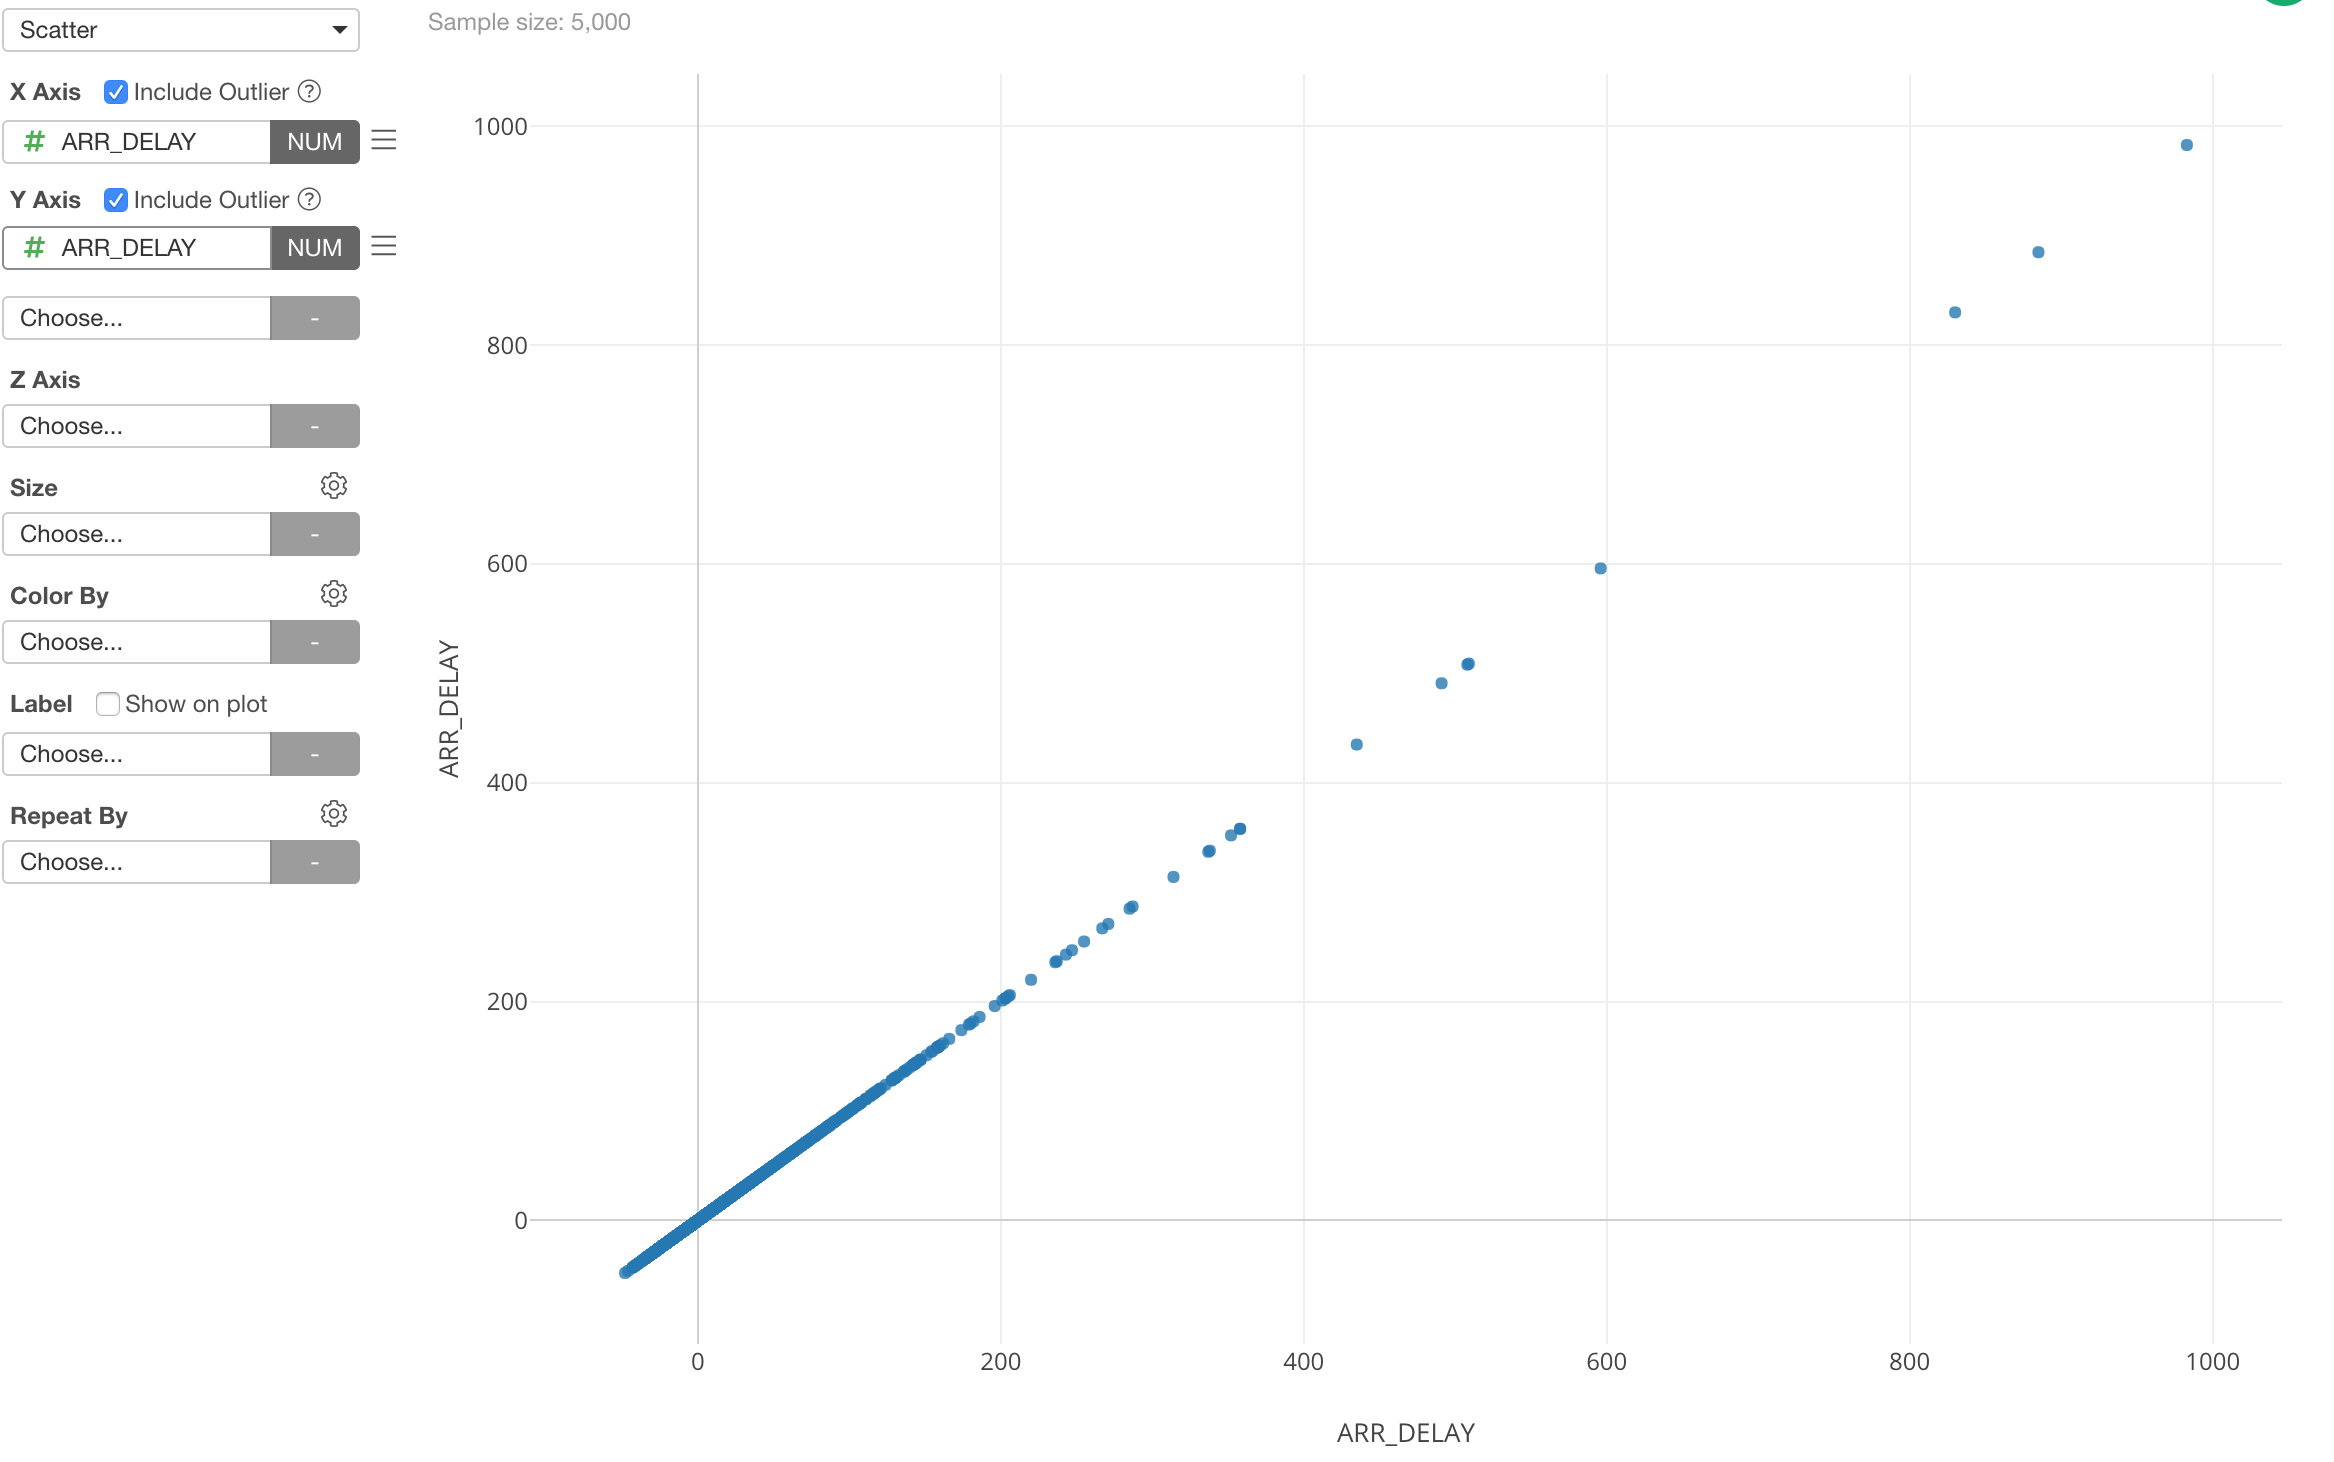
Before:
This is having ARR_DELAY column on X and Y-Axis.
After:
This one is having ARR_DELAY column at X-Axis and the winsorized ARR_DELAY column at Y-Axis.
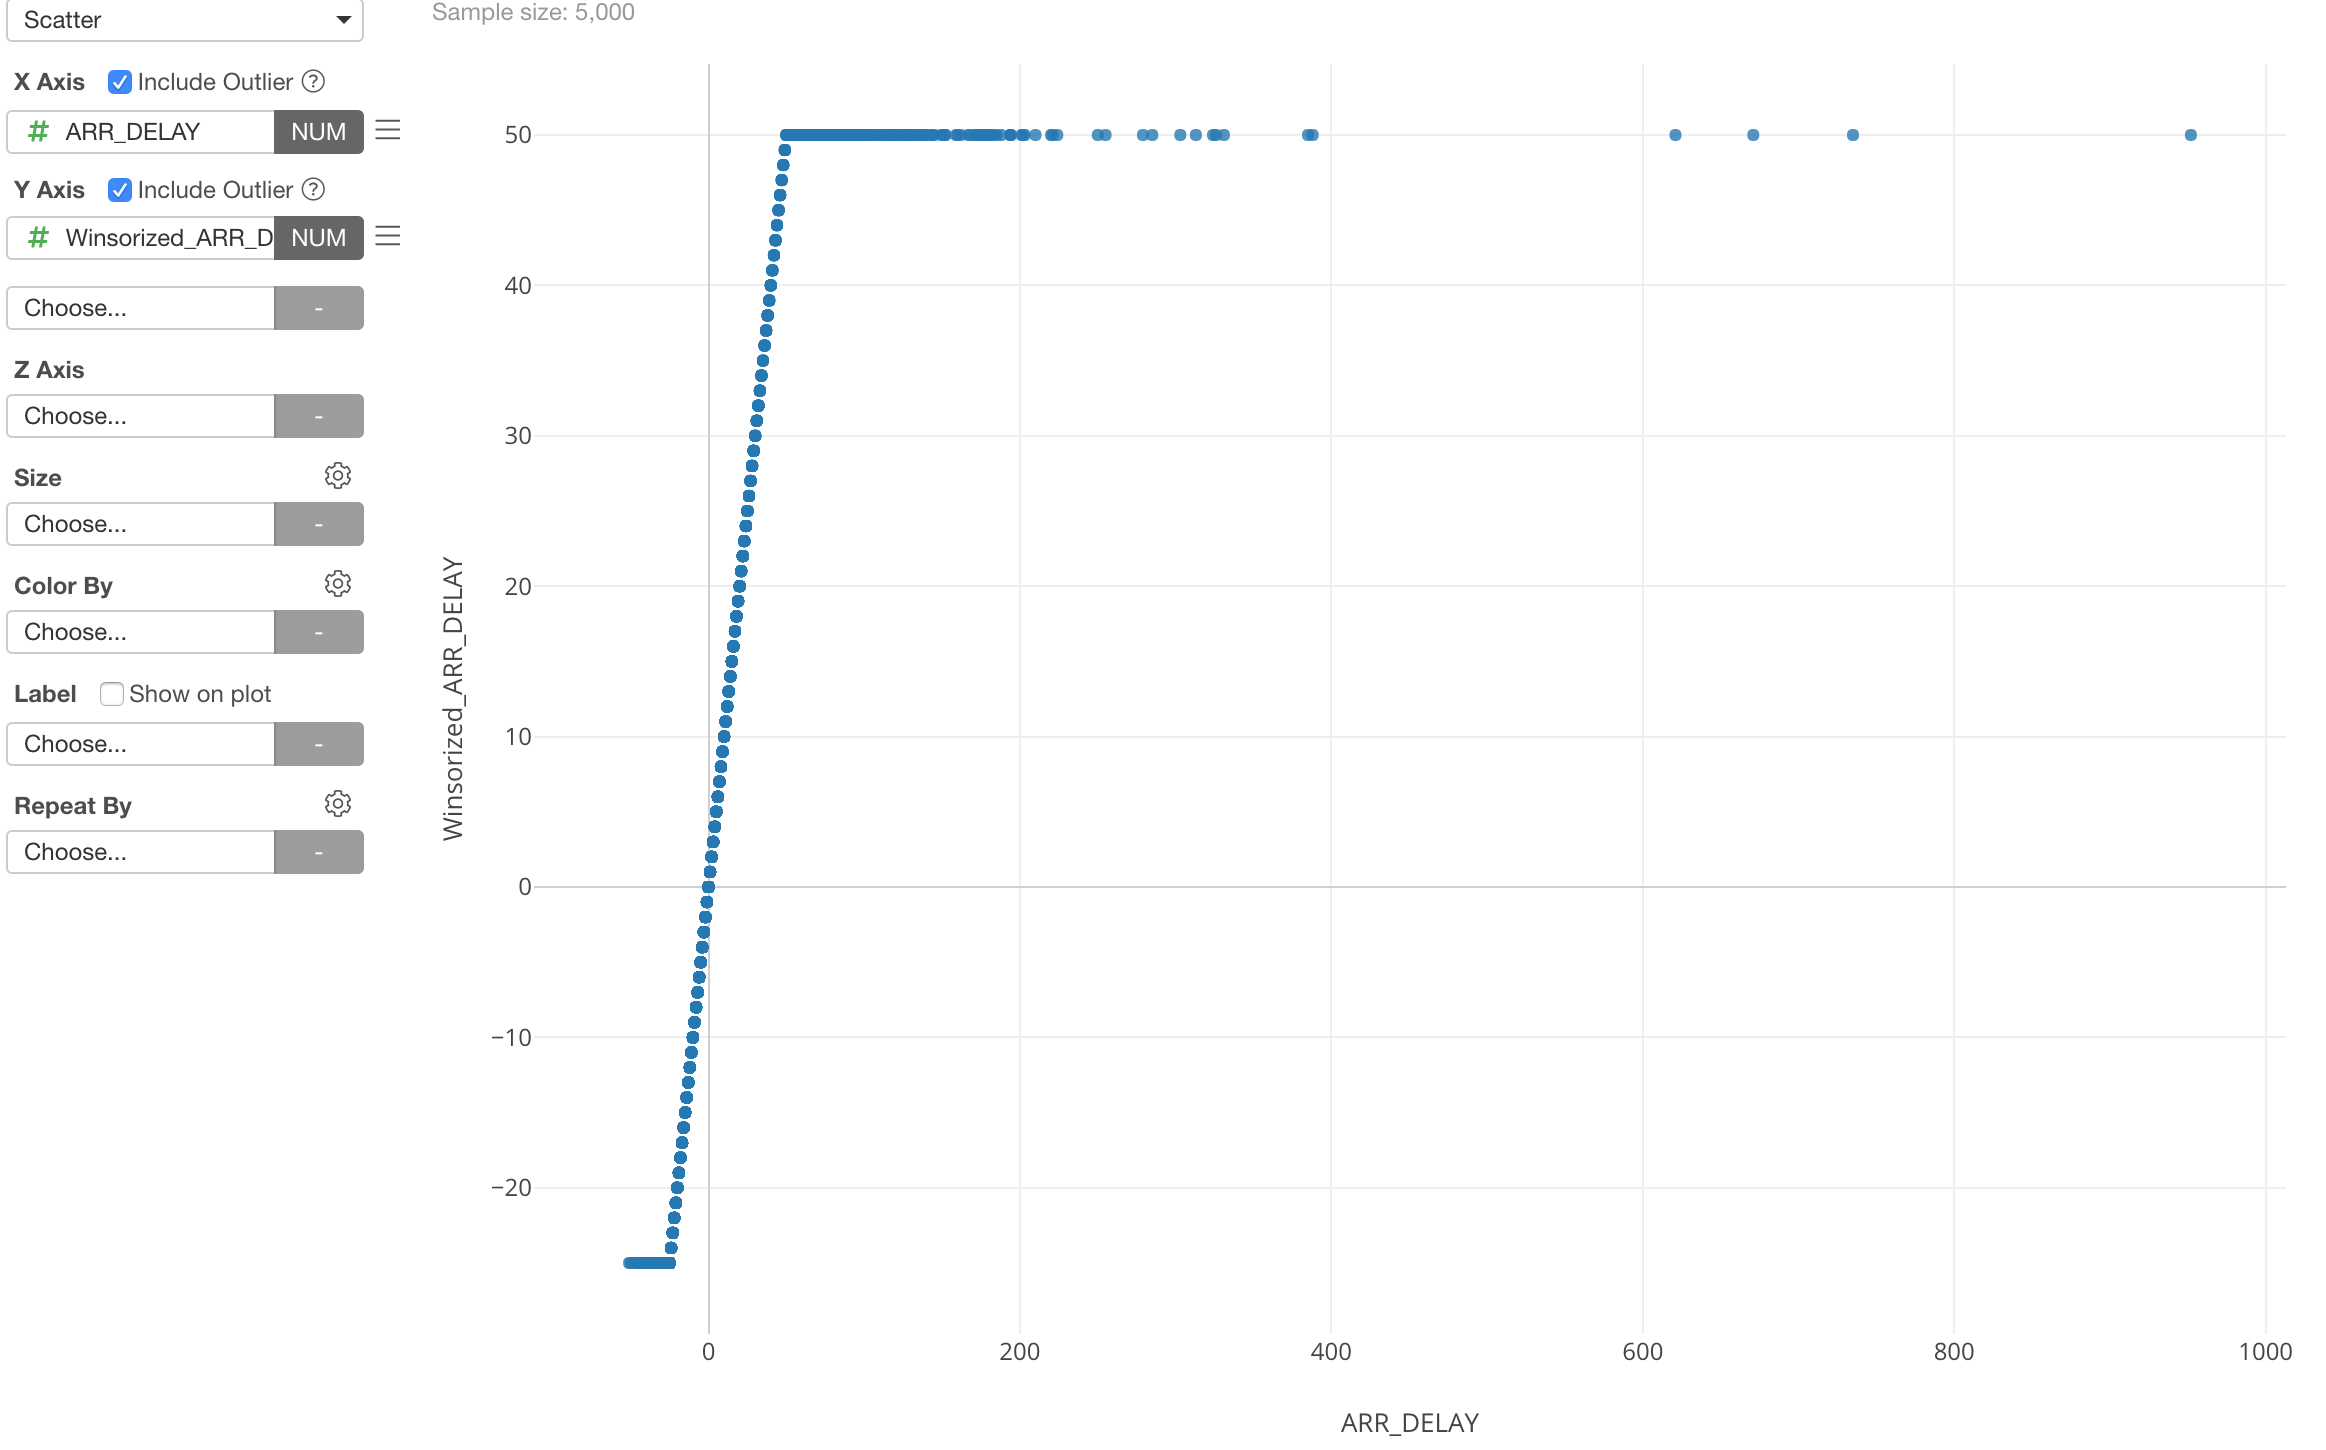
You can see all the ‘extreme’ values are convrerted to the upper and the lower bounds of the normal range of ARR_DELAY values.