Introduction to Boxplot Chart
Boxplot chart is very helpful when it comes to understanding the distribution of your data or even better, compare how the distribution differs among various groups.
Basics of Boxplot
To read Boxplot, first there is a line at the center, this indicates the median of all the data points. Median is the value at the center when you sort the data from the smallest to the largest.
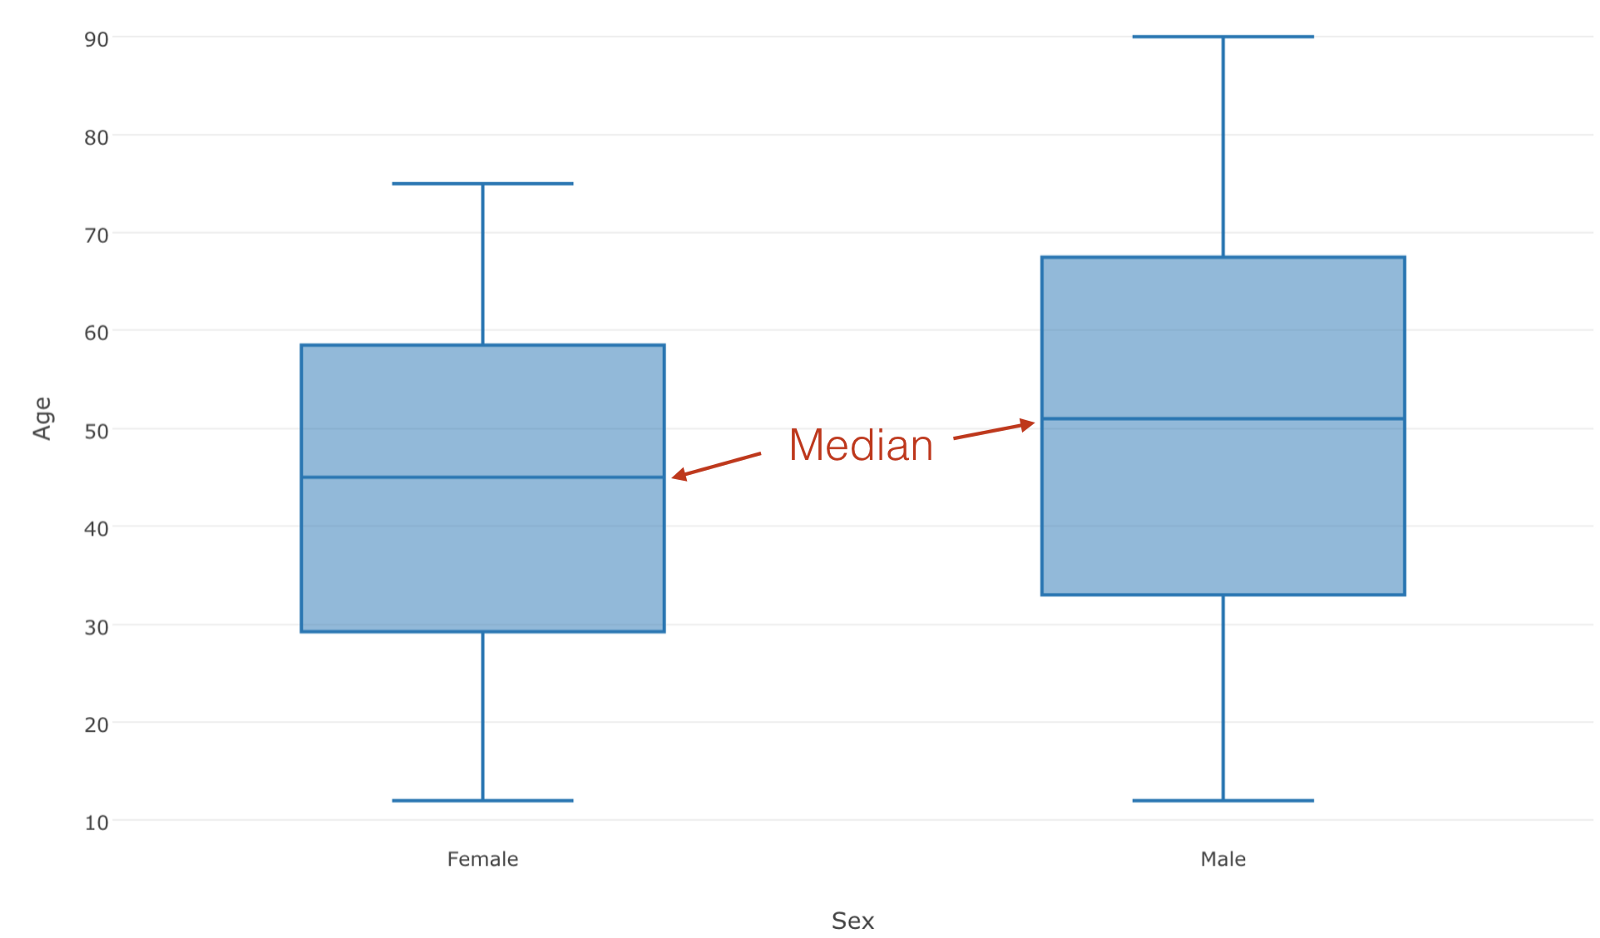
With this Boxplot showing the distribution of Age by Gender. We can see the median age of Male is about 51 and Female is 45.
Now, the bottom of each box indicates 1st quartile or 25th percentile. The top of each box indicates 3rd quartile or 75th percentile.
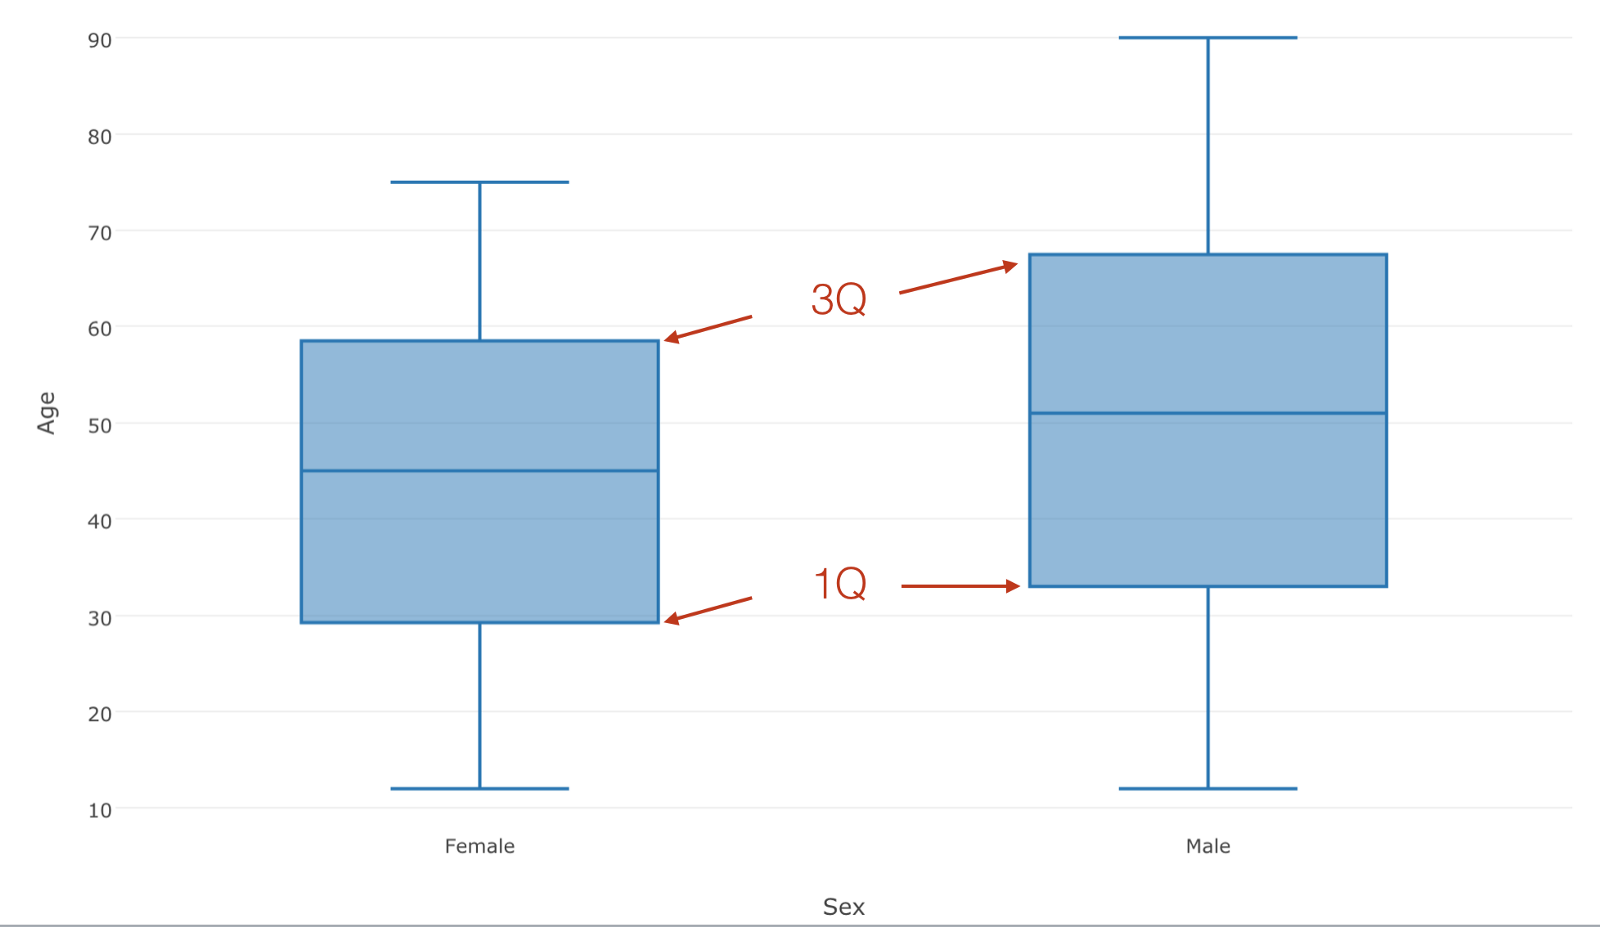
So the box itself shows the range of 50% of the data at the center.
With this example, we can see the central 50% age range of female is between 29 and 59.
Lastly, a top end of the line indicates the max value and a bottom end of line indicates the max value.

With this example, we can see that the youngest female is 12 and the oldest is 75 in this data set.
How can we use Boxplot in Exploratory
Now, let’s take a look at how we can use Boxplot in Exploratory.
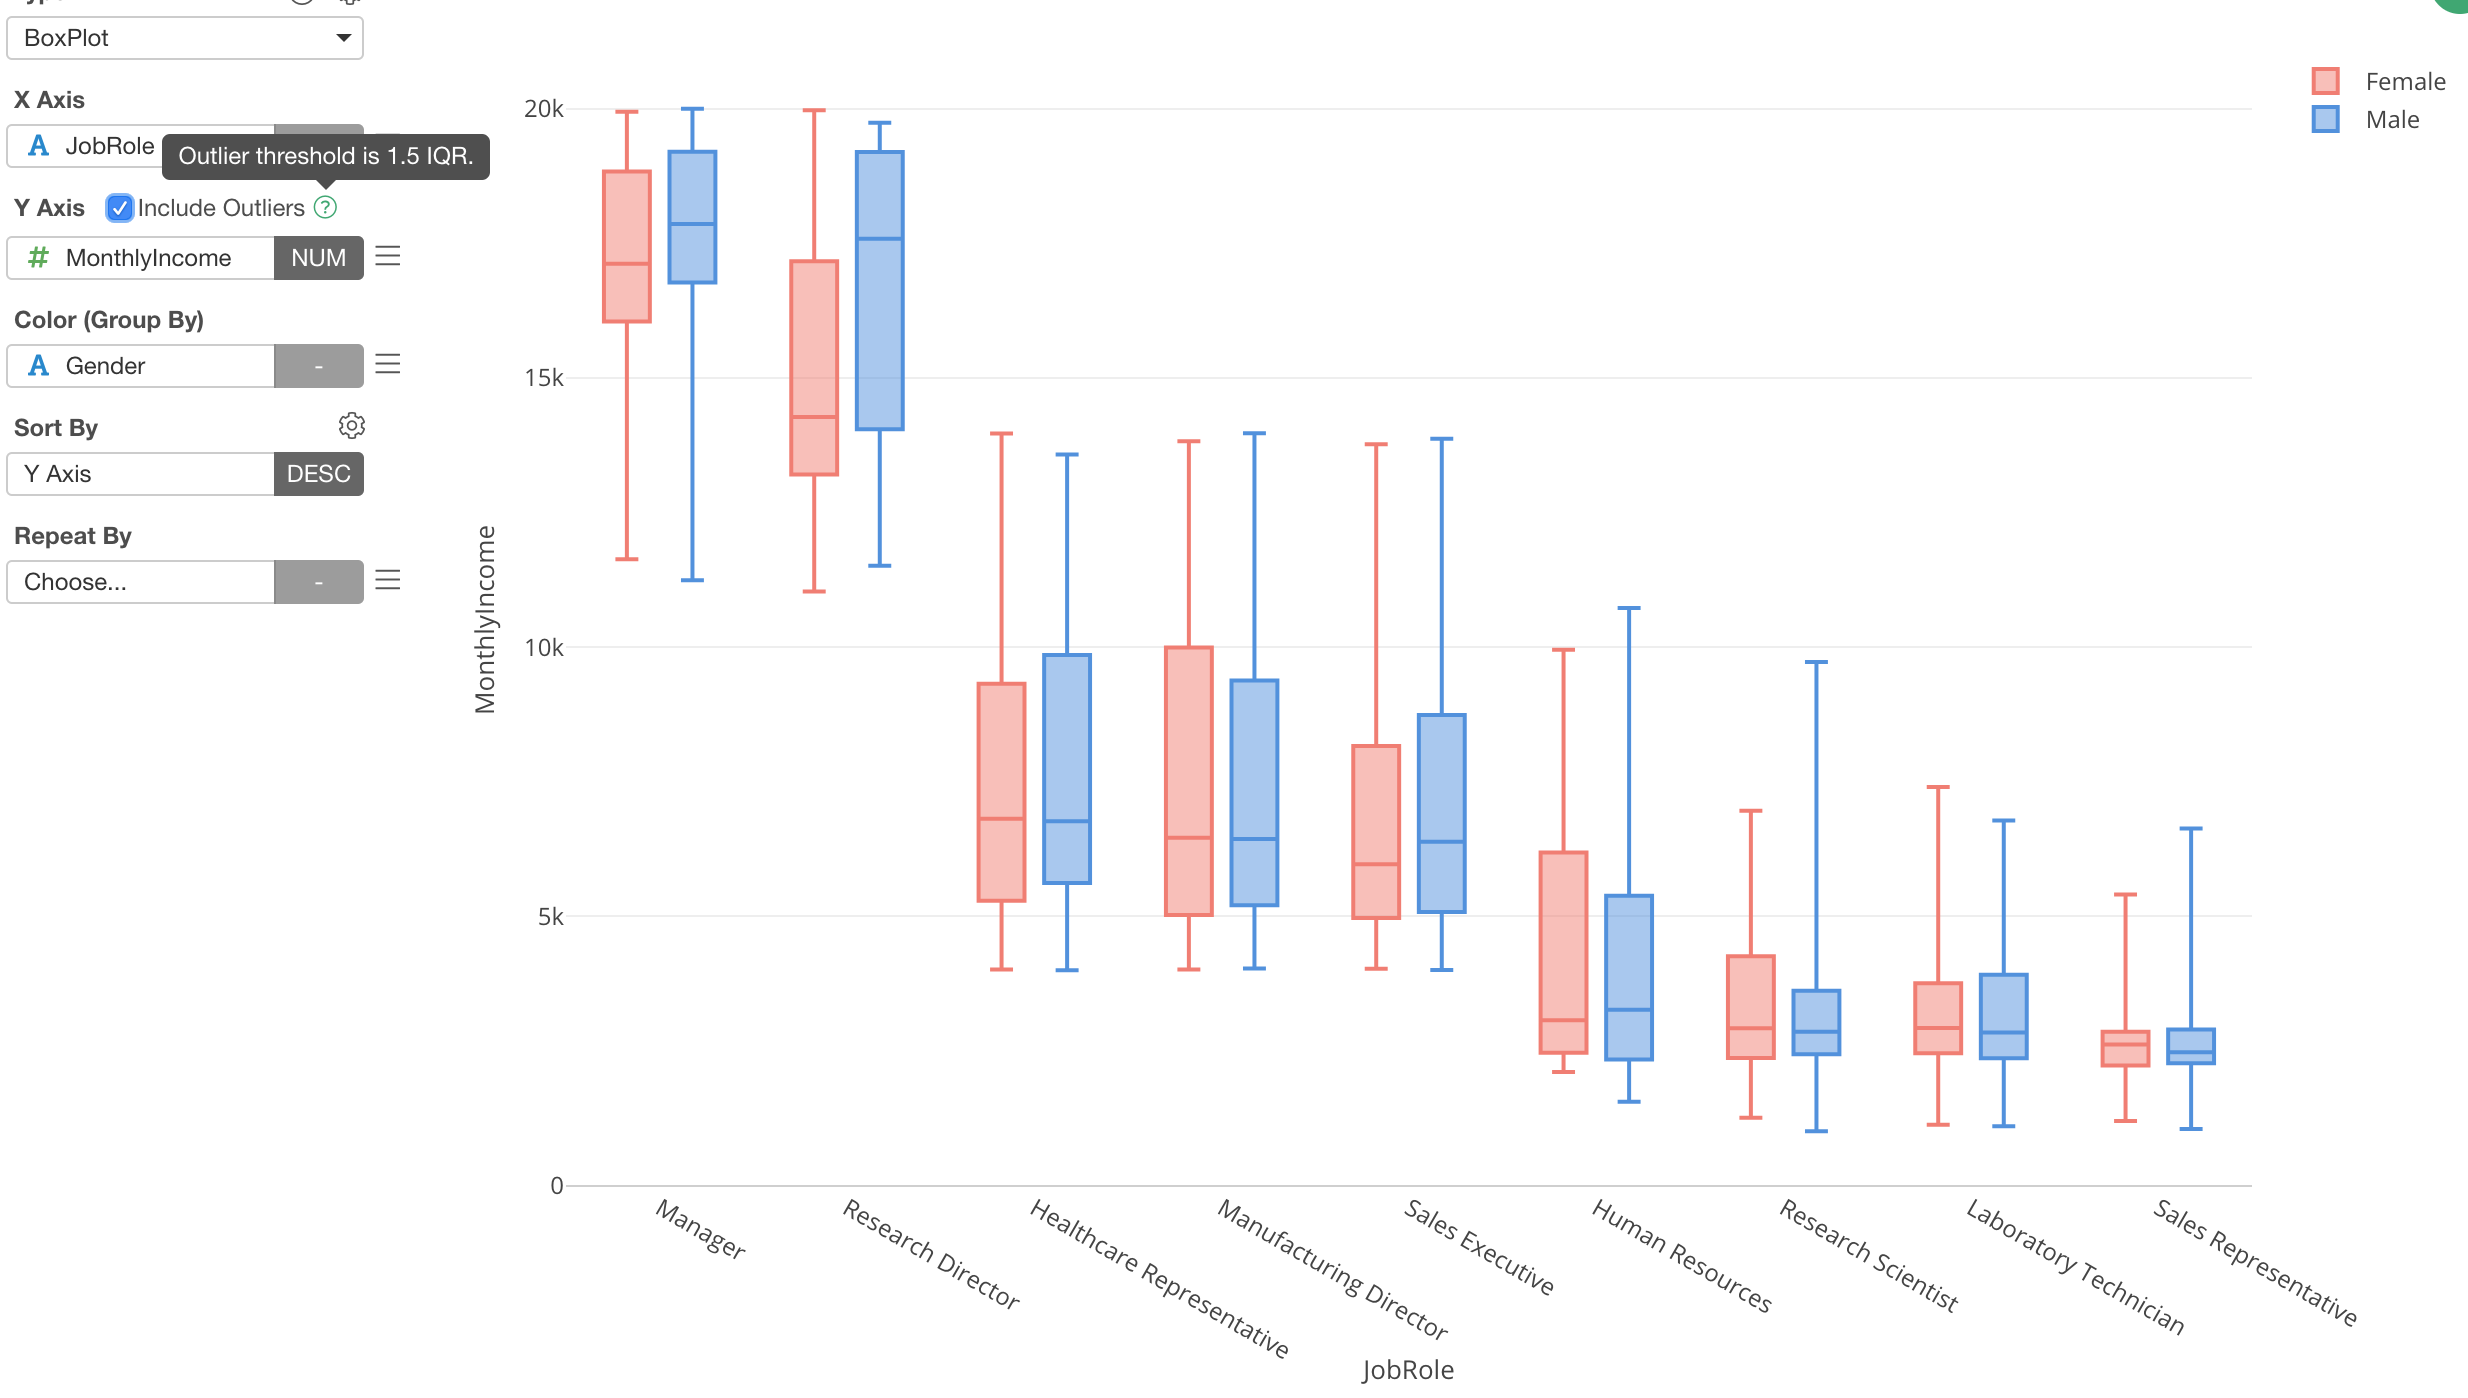
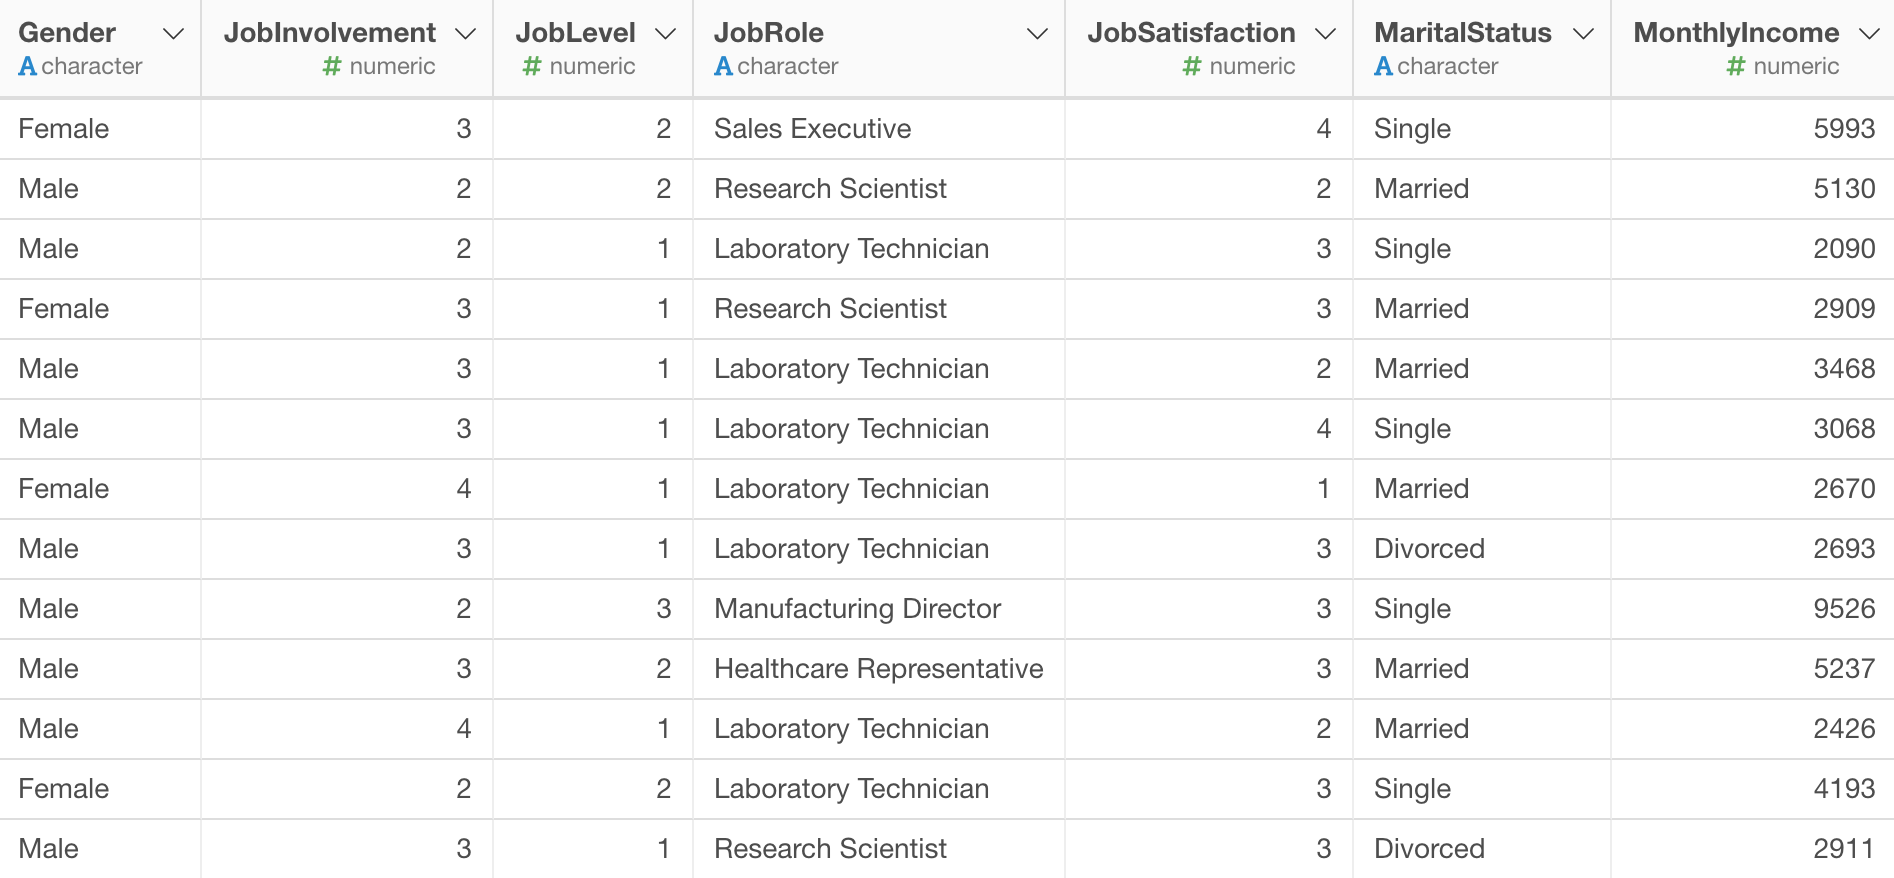
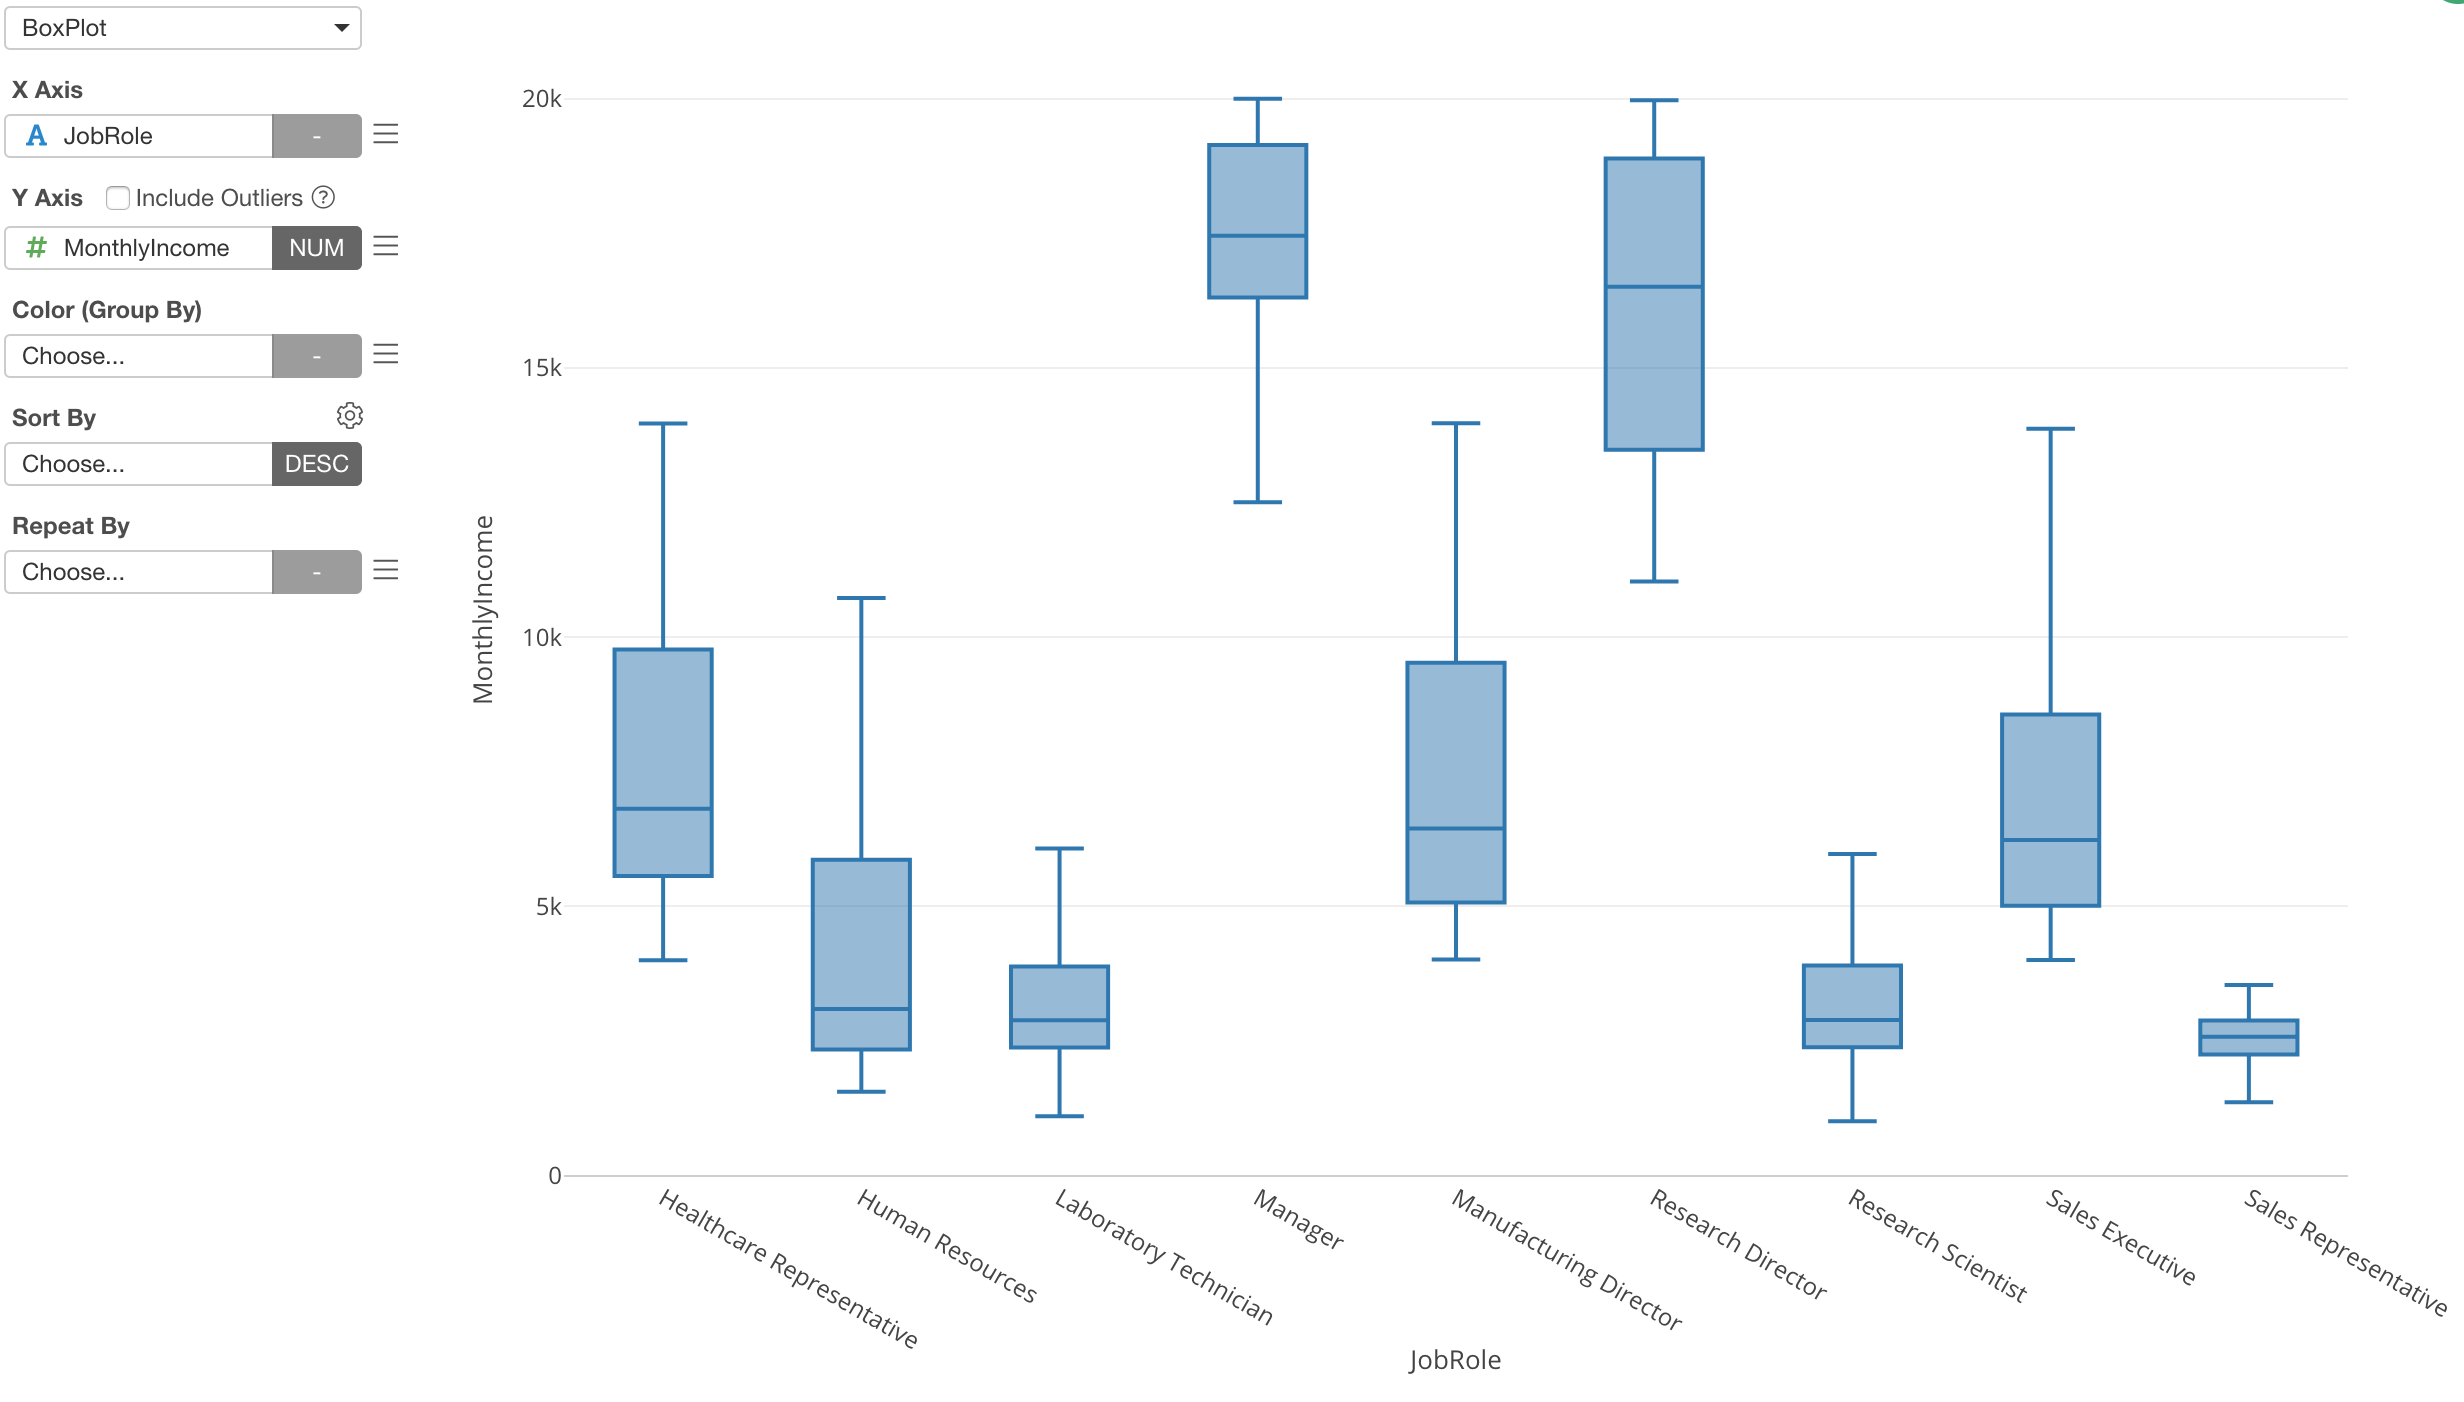
Here is the Employee data and we want to visualize the distribution of Monthly Income (the last column in the picture) by Job Role.
We can select Boxplot chart and assign Job Role to X-Axis and Monthly Income to Y-Axis.
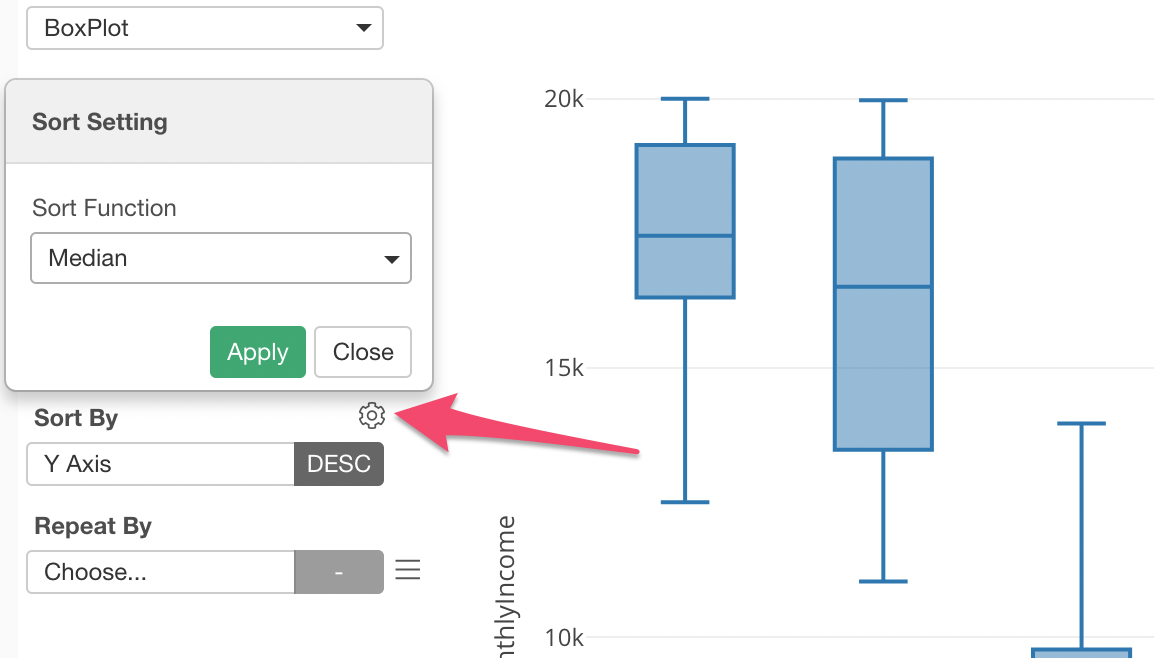
Sorting with Boxplot
We can quickly sort the boxplot bars.

Since the boxplot shows the distribution of data so we need to pick one summarized measure to sort the bars. The default is Median, but you can change this from the property.
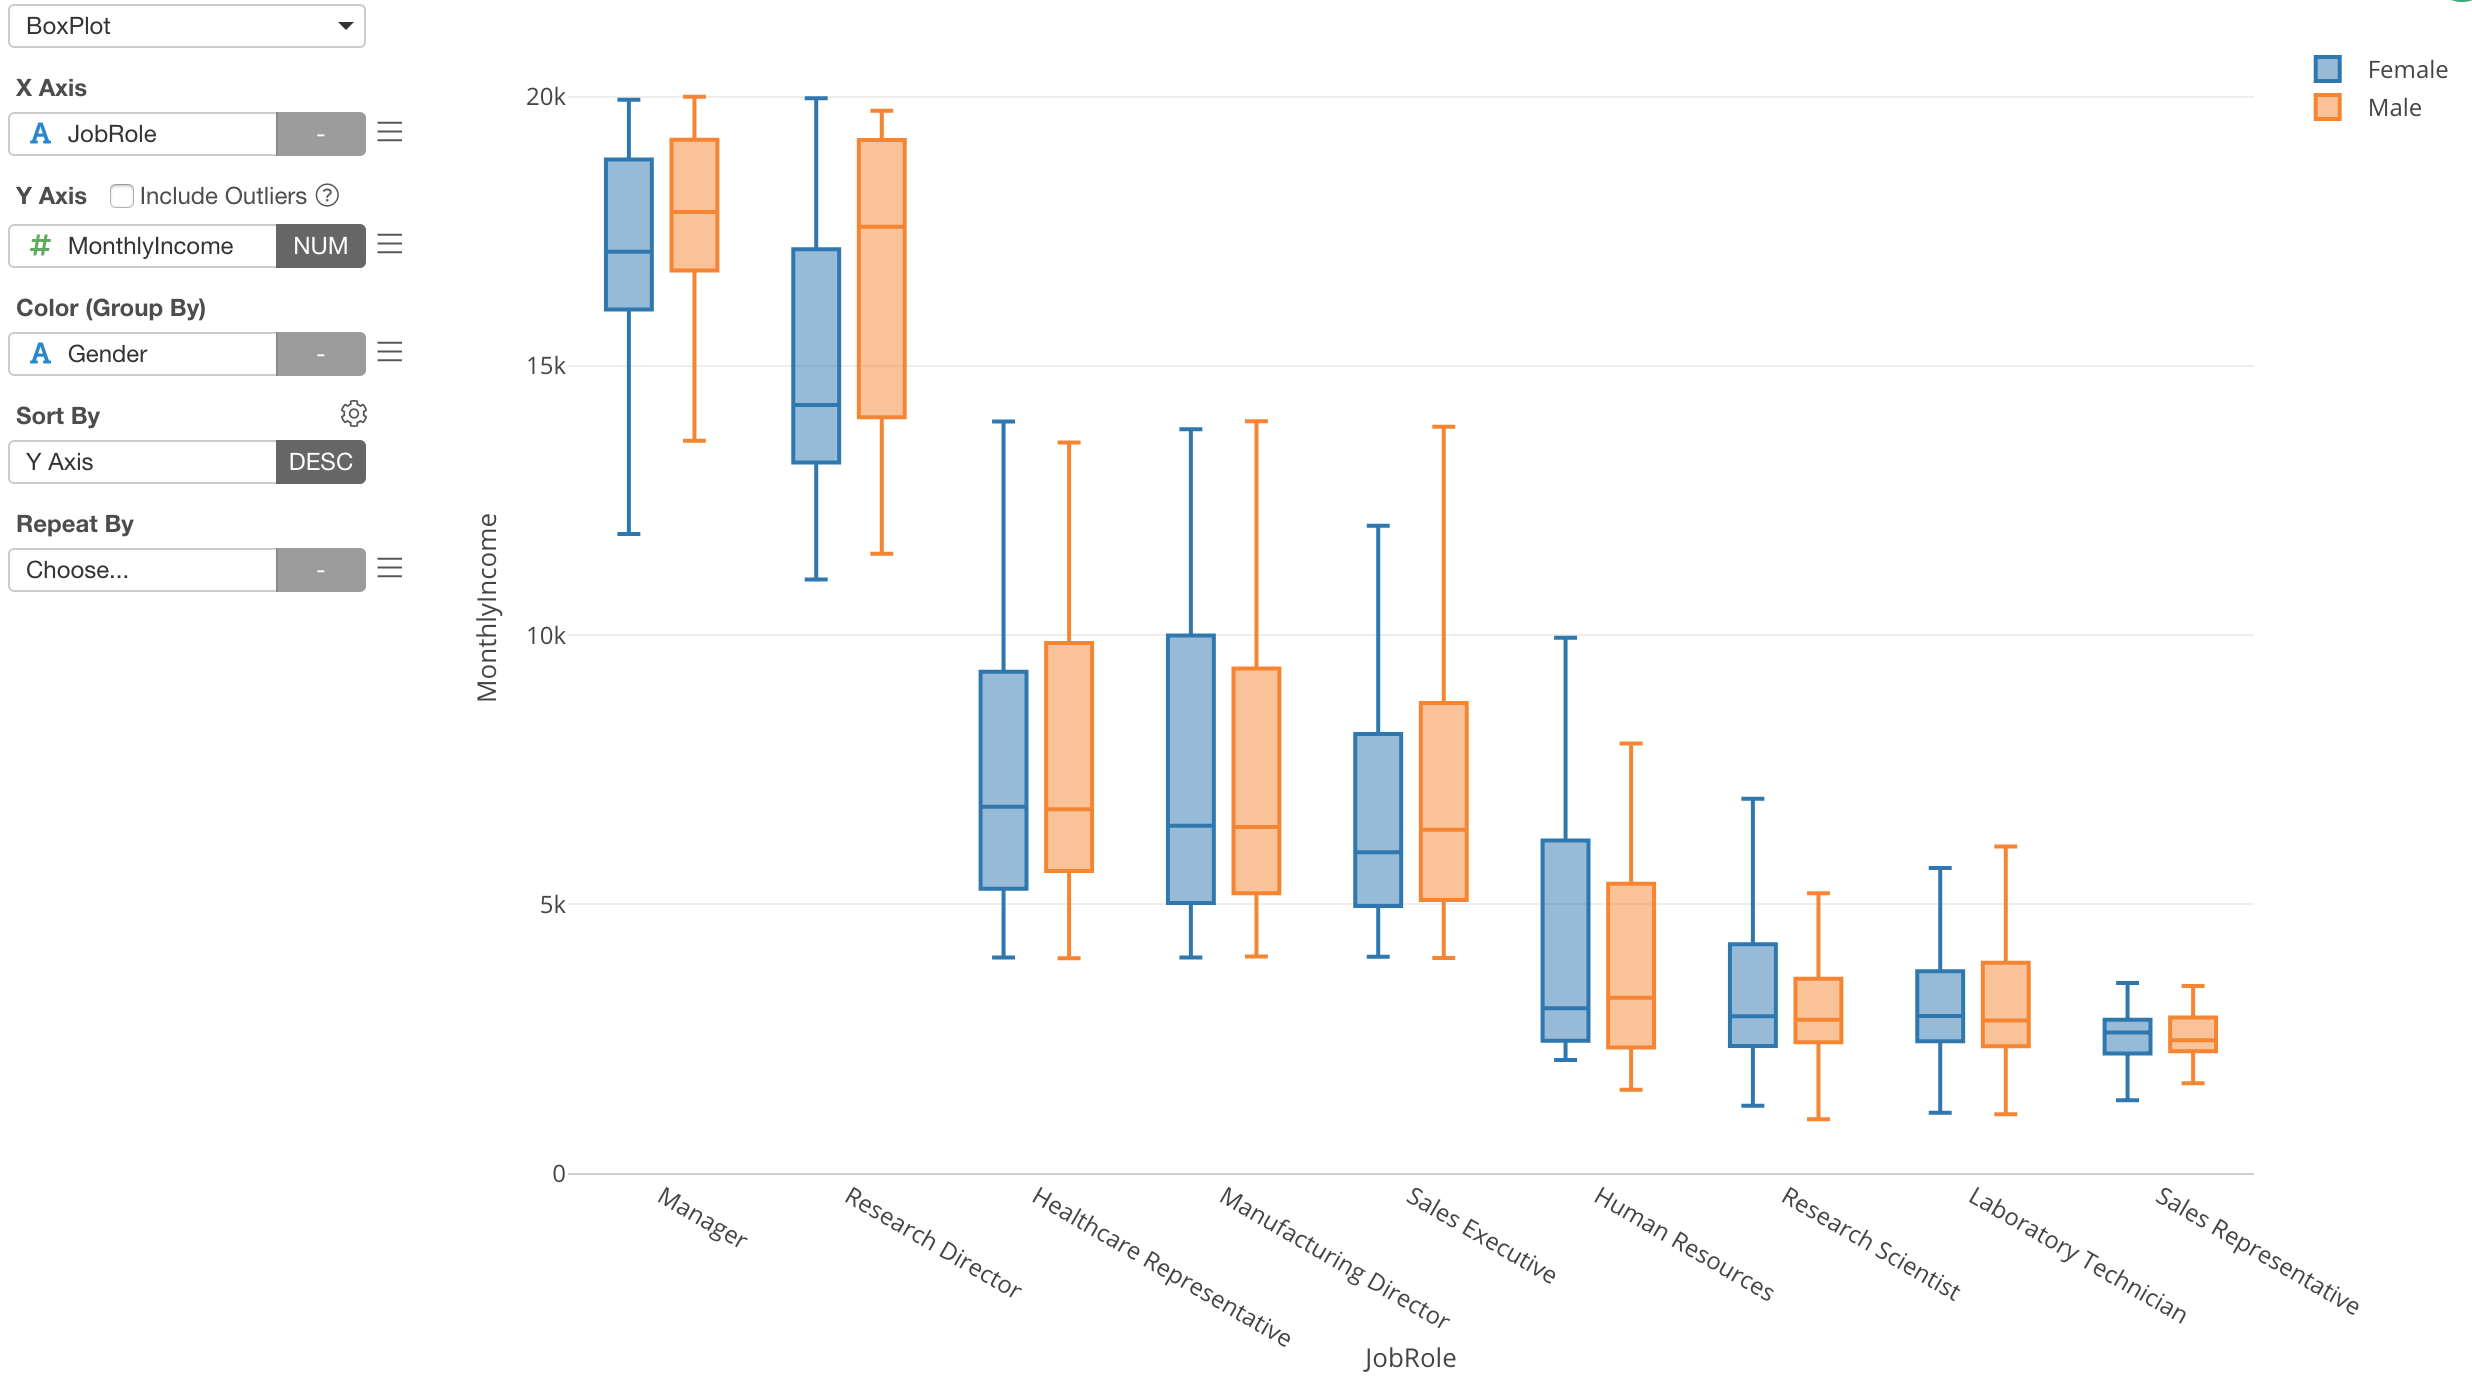
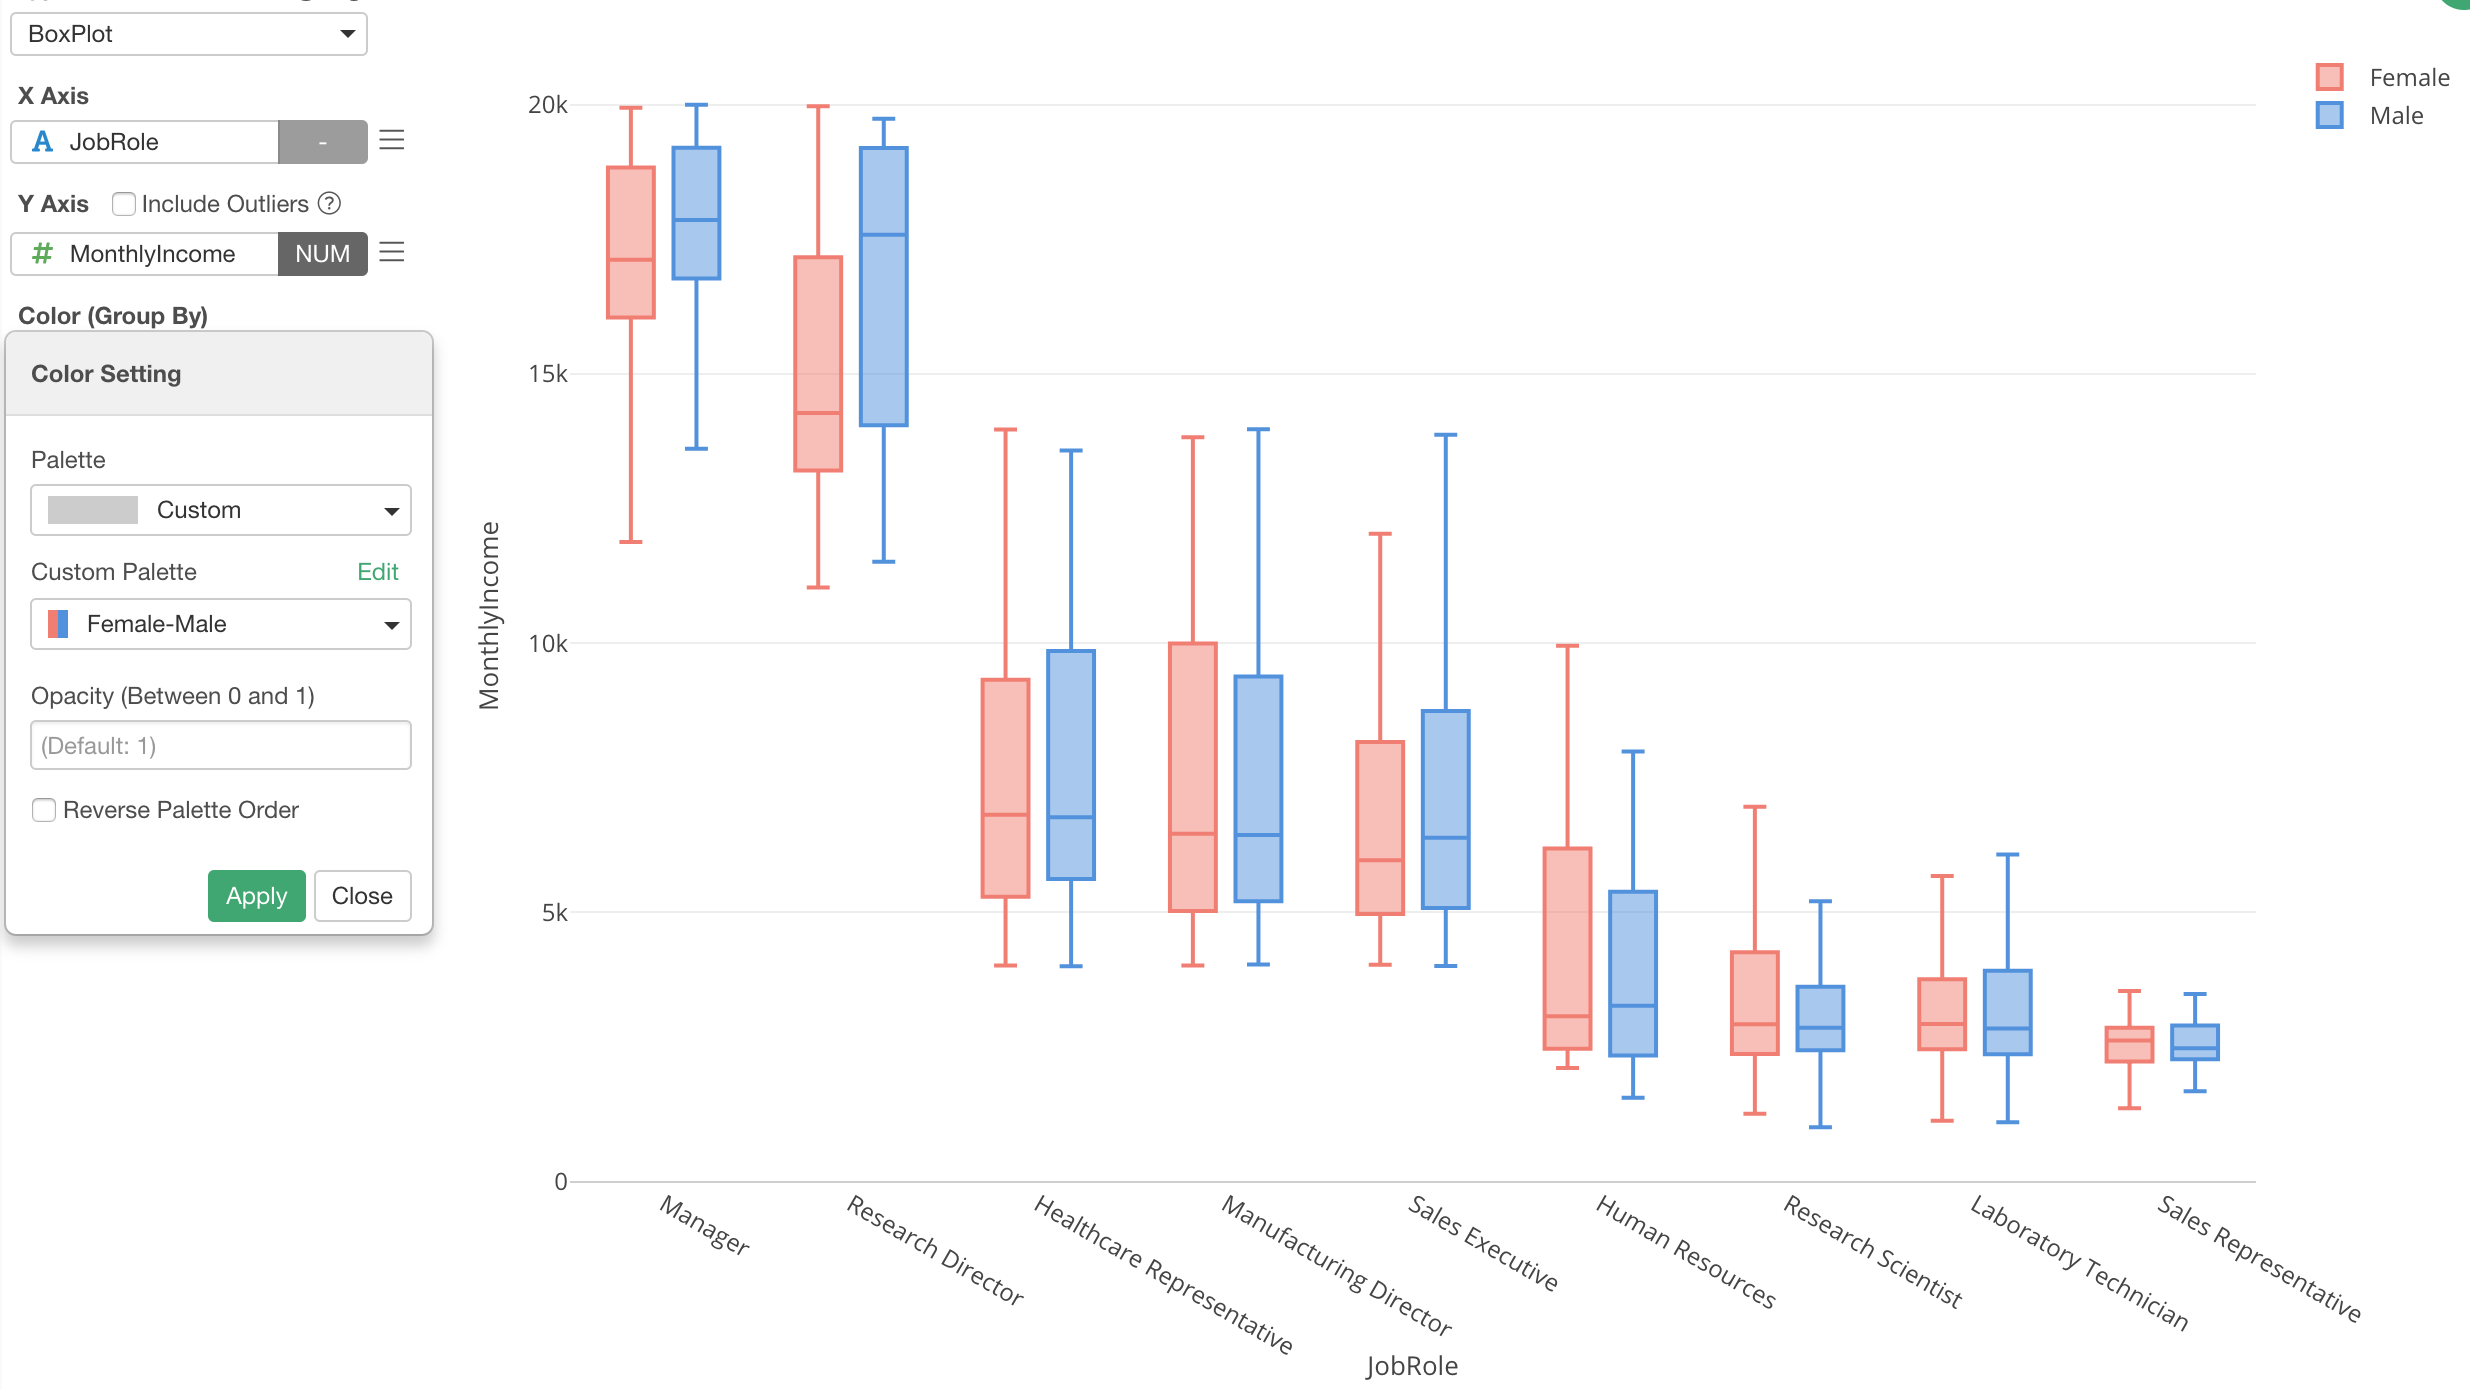
Color with Boxplot
We can assign a column to Color so that we’ll have multiple groups in each category of X-Axis.
Here, I’m assigning Gender column to Color.
If you want to change the color palette, you can select Color Setting from the menu.
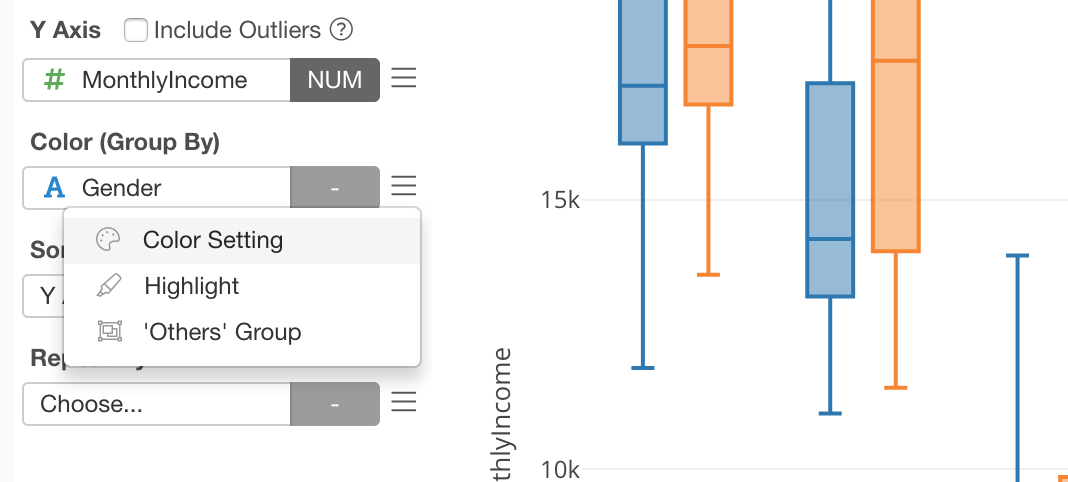
Select one of the pre-defined color palettes or create your own with ‘Custom’ option!
Outlier with Boxplot
When you have outlier (or extreme) data it often makes it harder to understand the distribution.
The boxplot chart excludes the outlier values by default by excluding any values outside of 1.5 IQR (Inter Quantile Range) range.
You can check ‘Include Outlier’ checkbox to show the outlier values if needed.