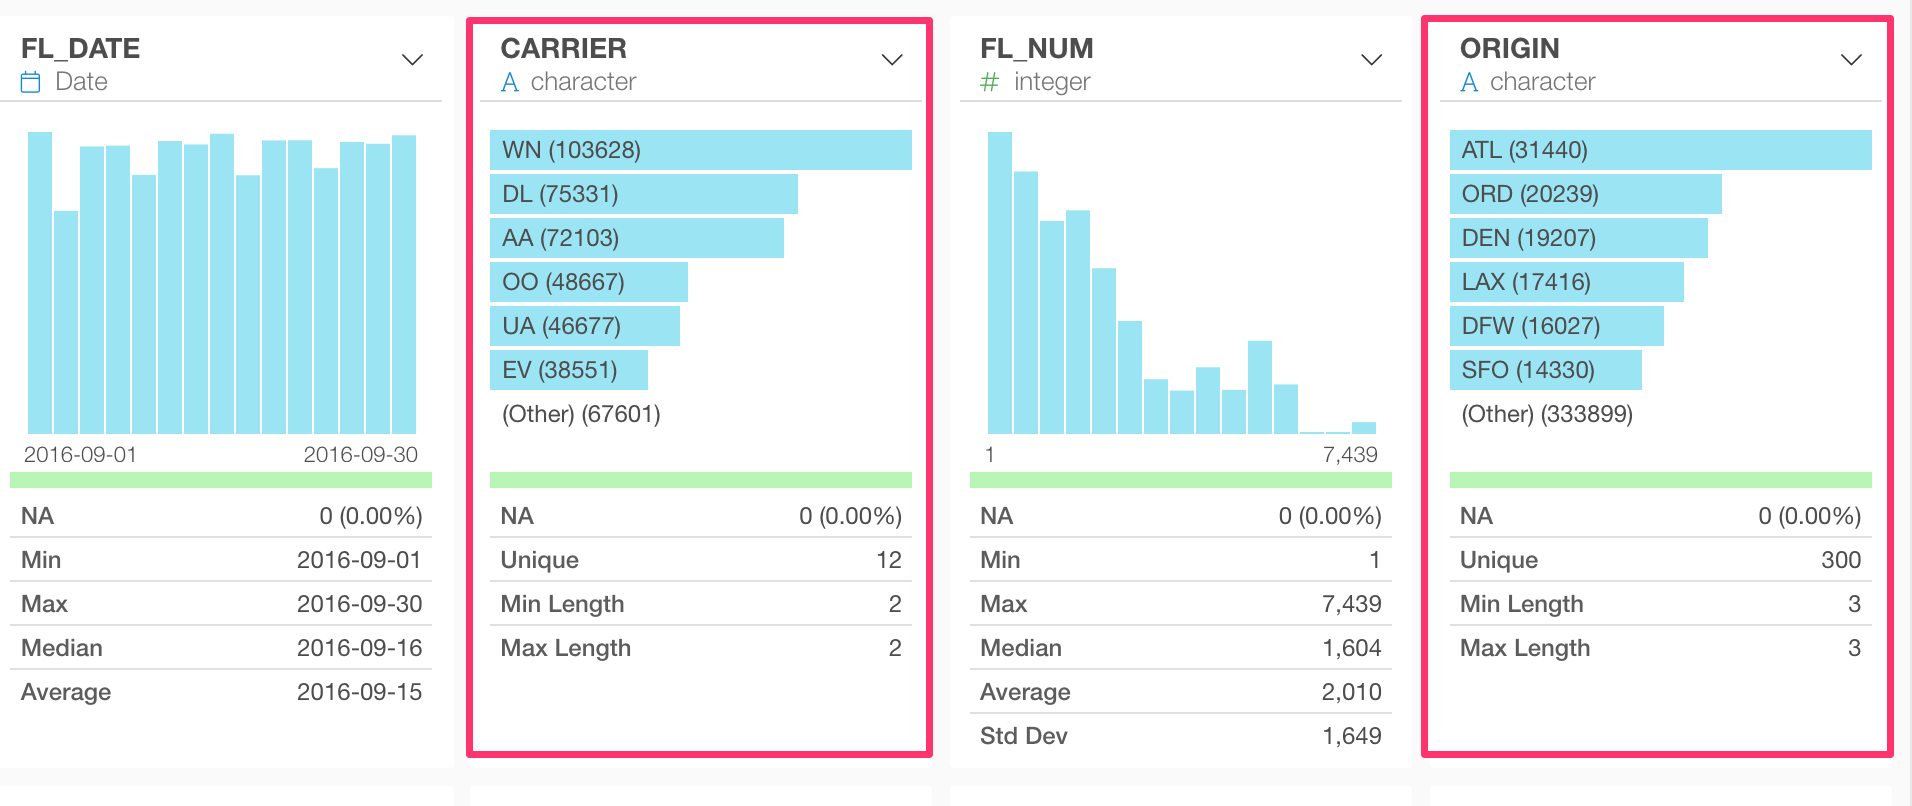
Under Summary view, you can see the frequency (or number of the rows) for each category in the bar chart area for each column quickly.
Now, what if you want to see the percentage (or ratio) rather than the count numbers along with the bars? Currently, you can see only the count numbers under Summary view. But you can create a chart that shows such information along with the bars.
Here is how you can do with 3 simple steps.
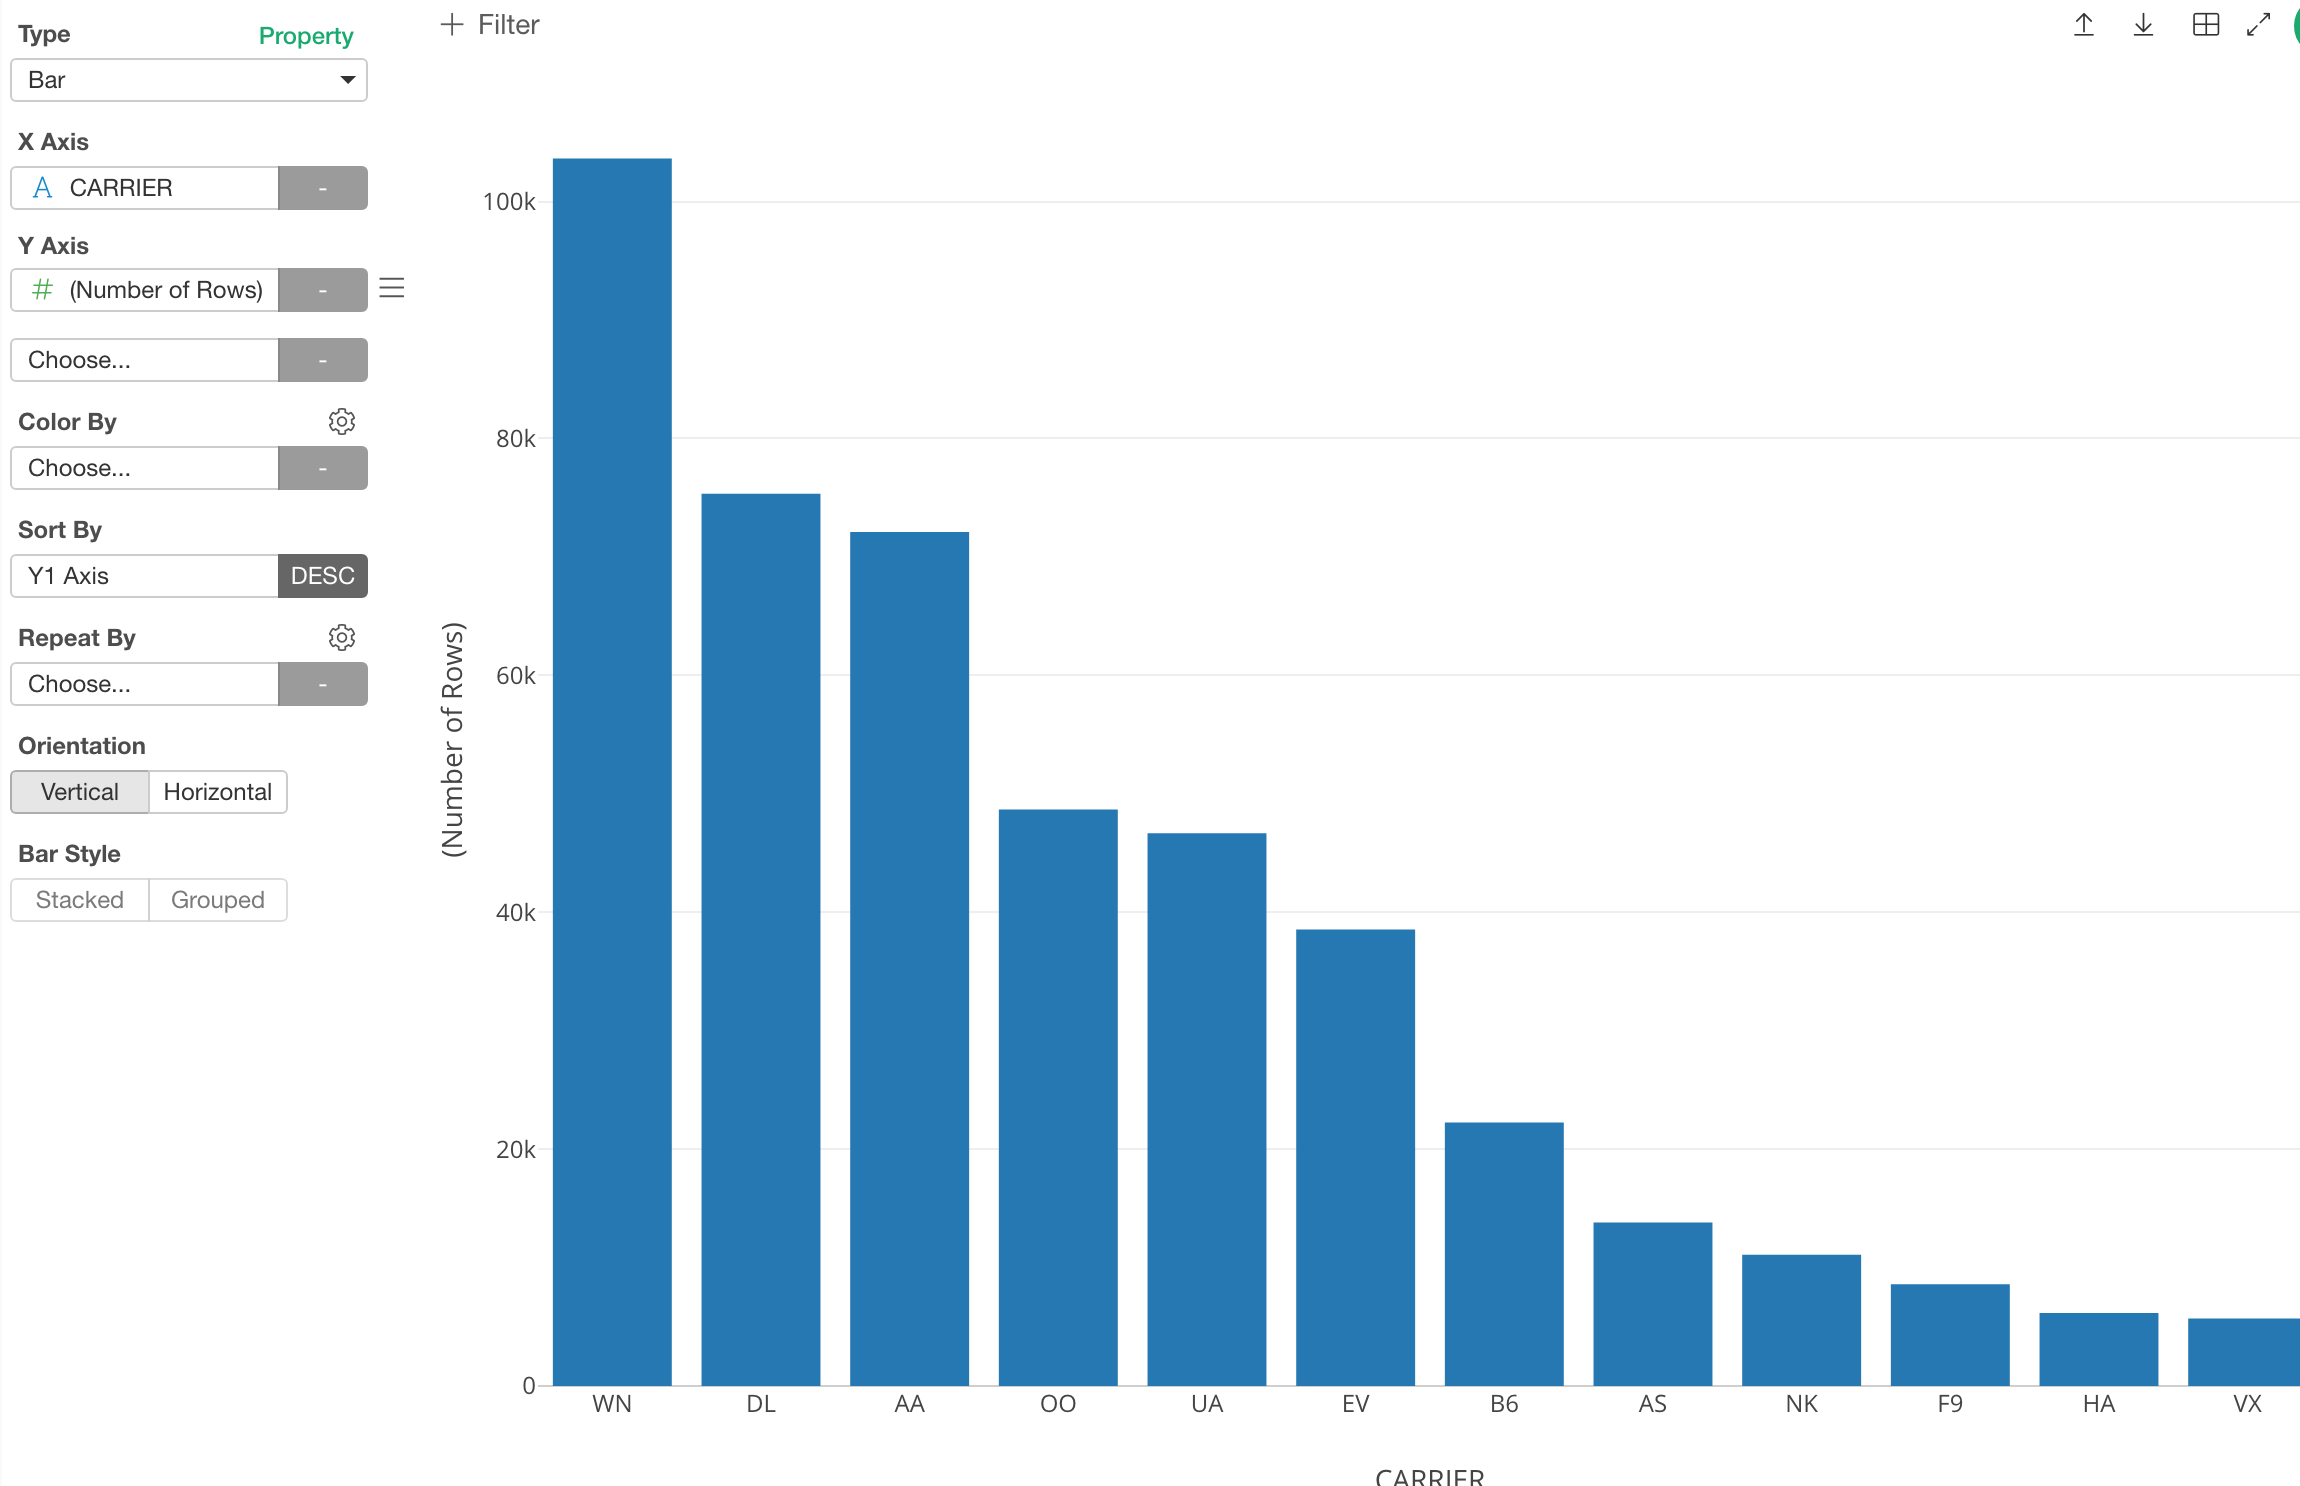
1. Create a Chart
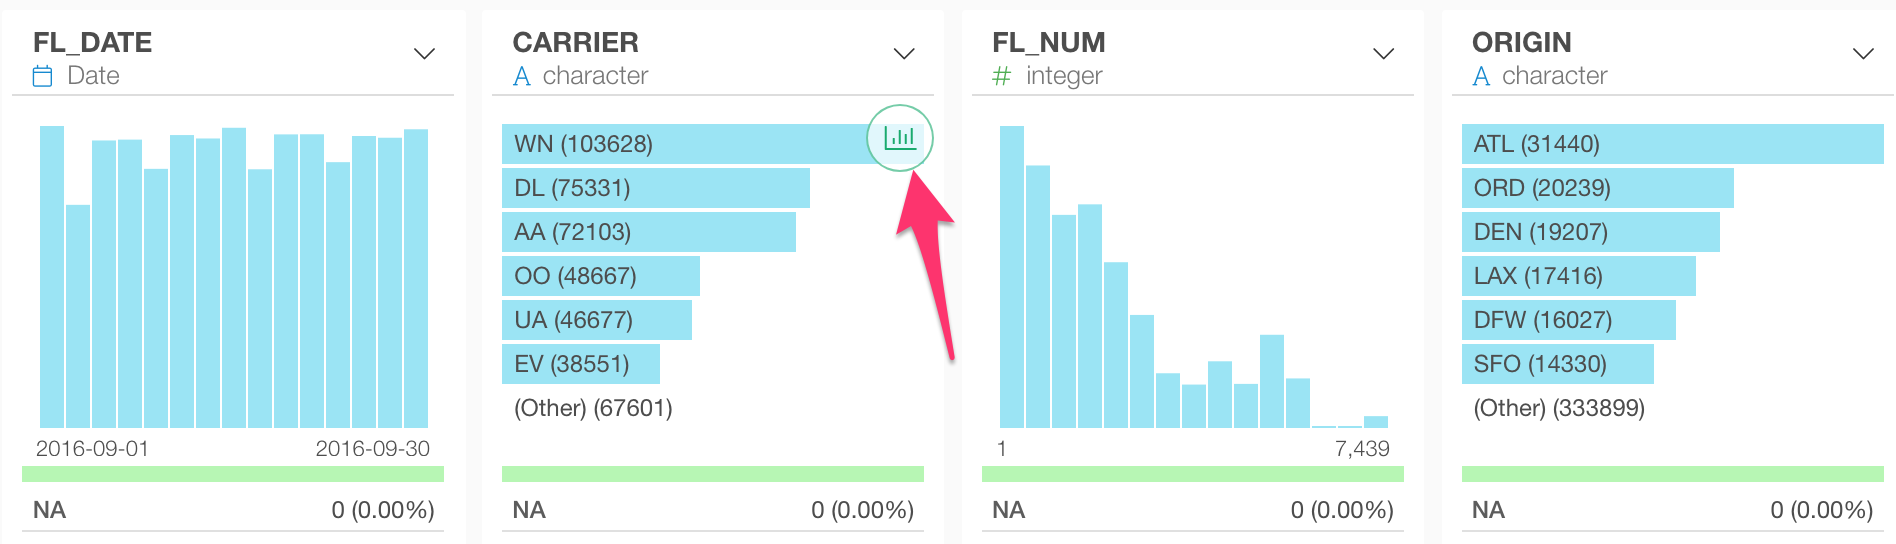
You can click on the chart icon at the right hand side top of each chart to create a chart quickly.
2. Show the bars as the percentage
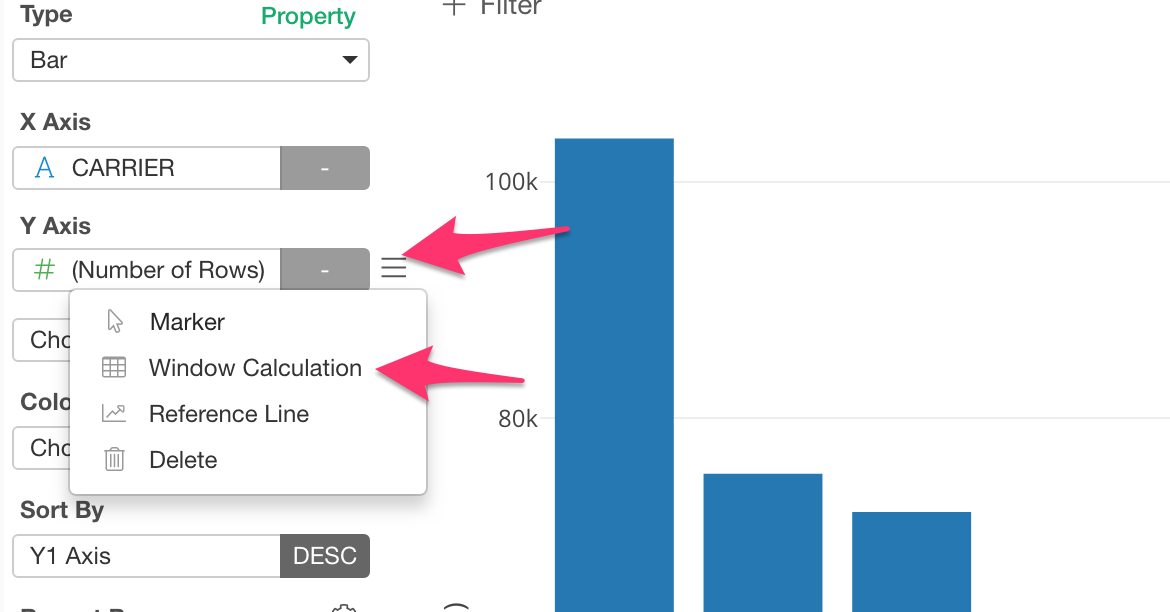
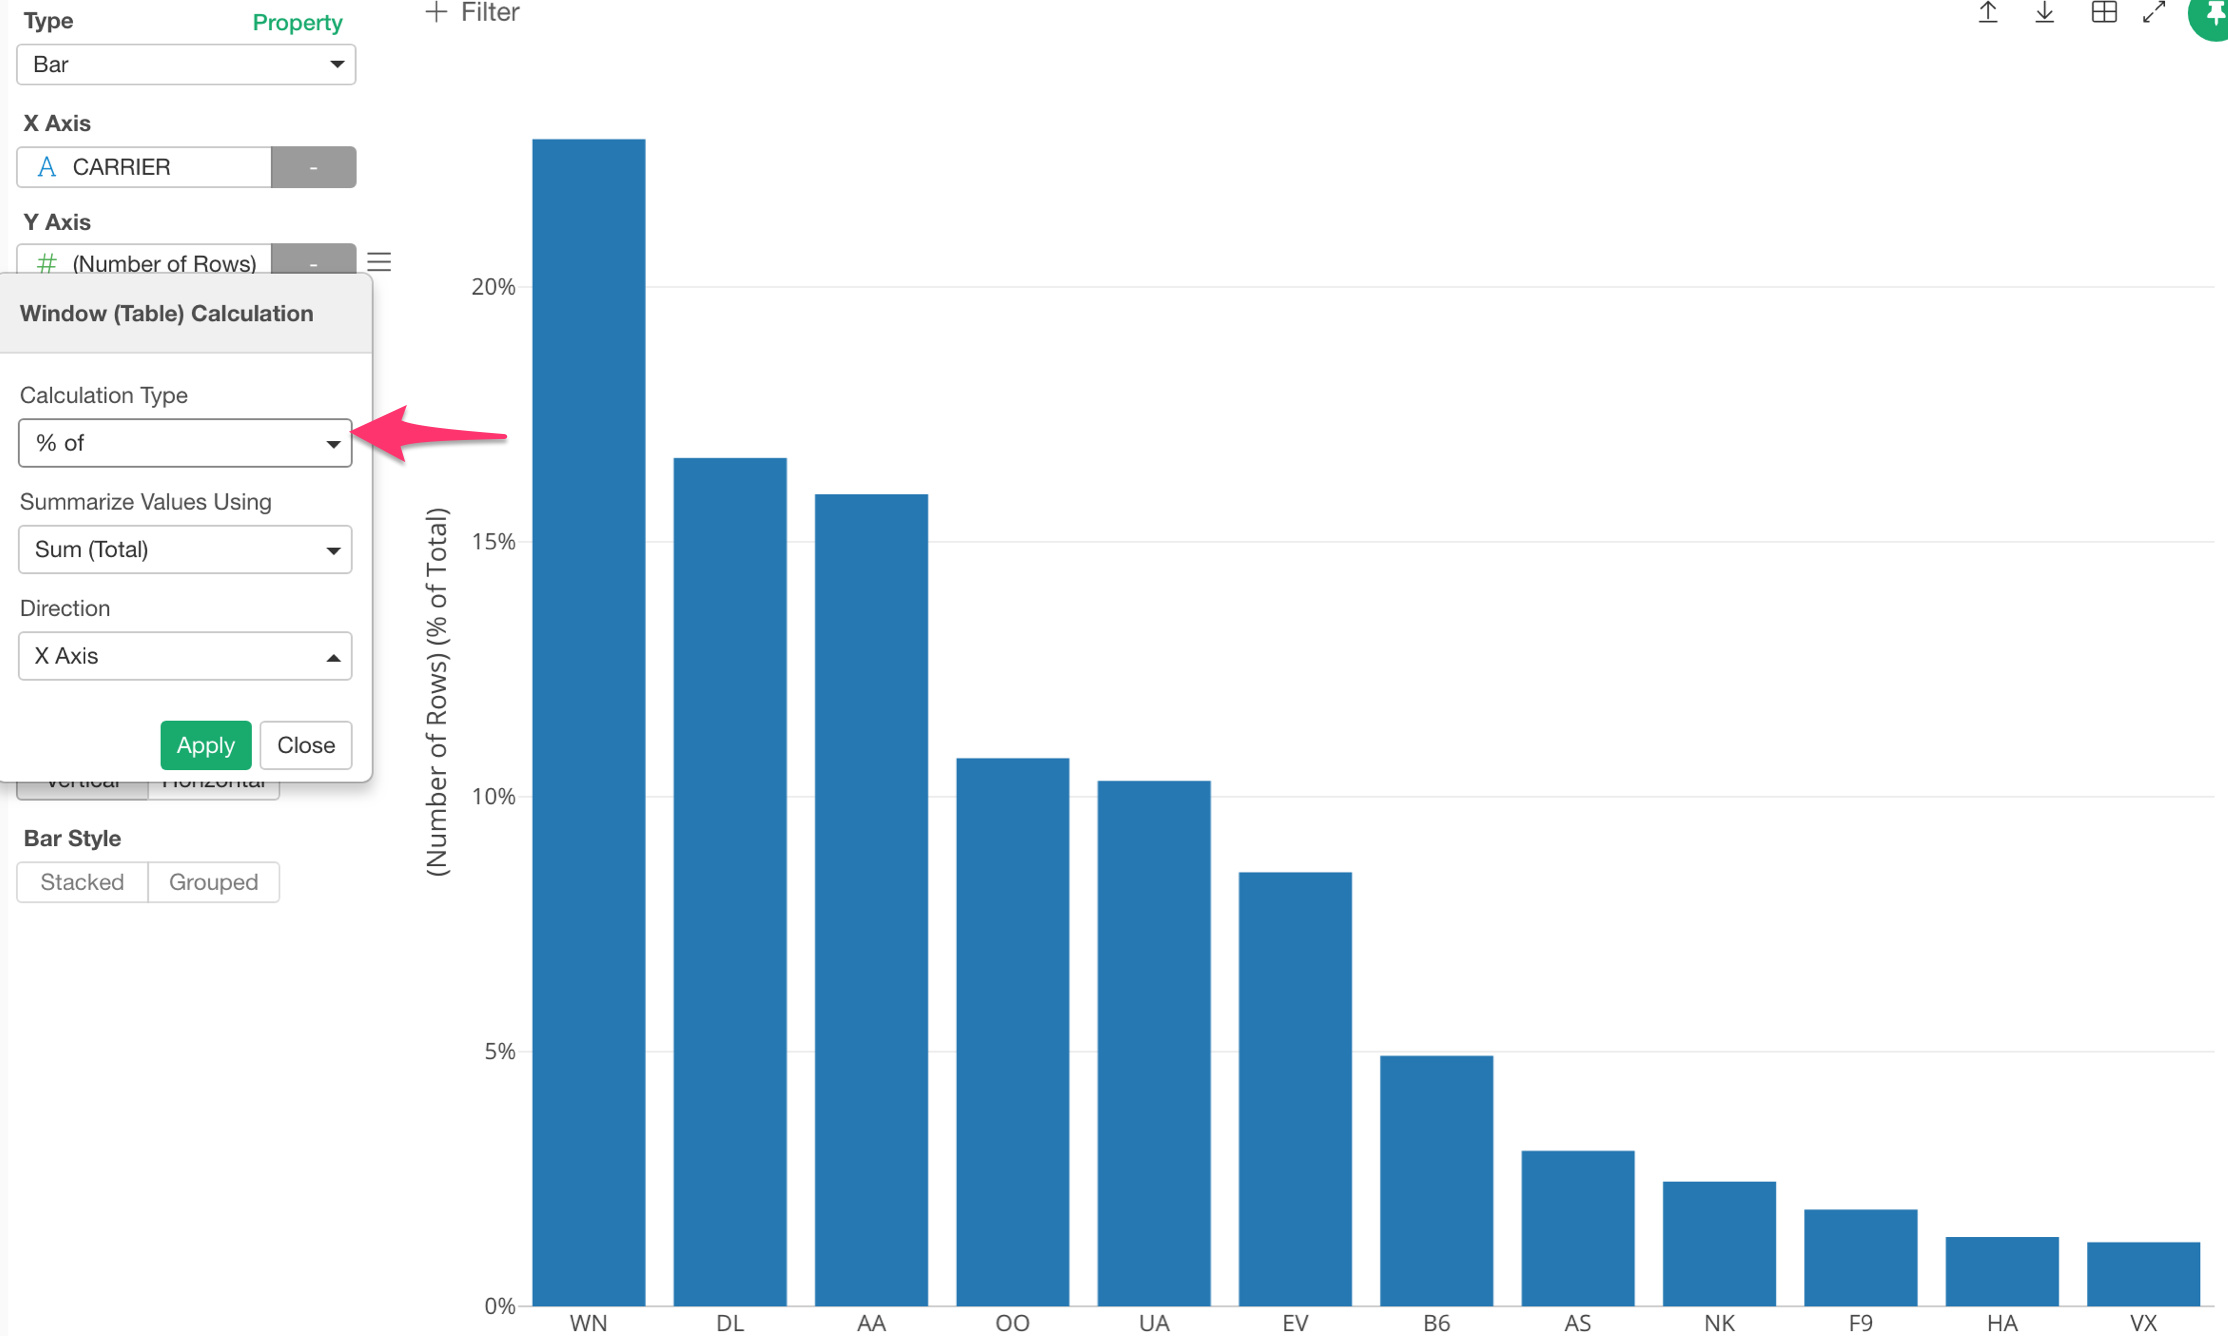
You can apply one of the Window Calculation types called ‘% of Total’ for the Y-Axis.
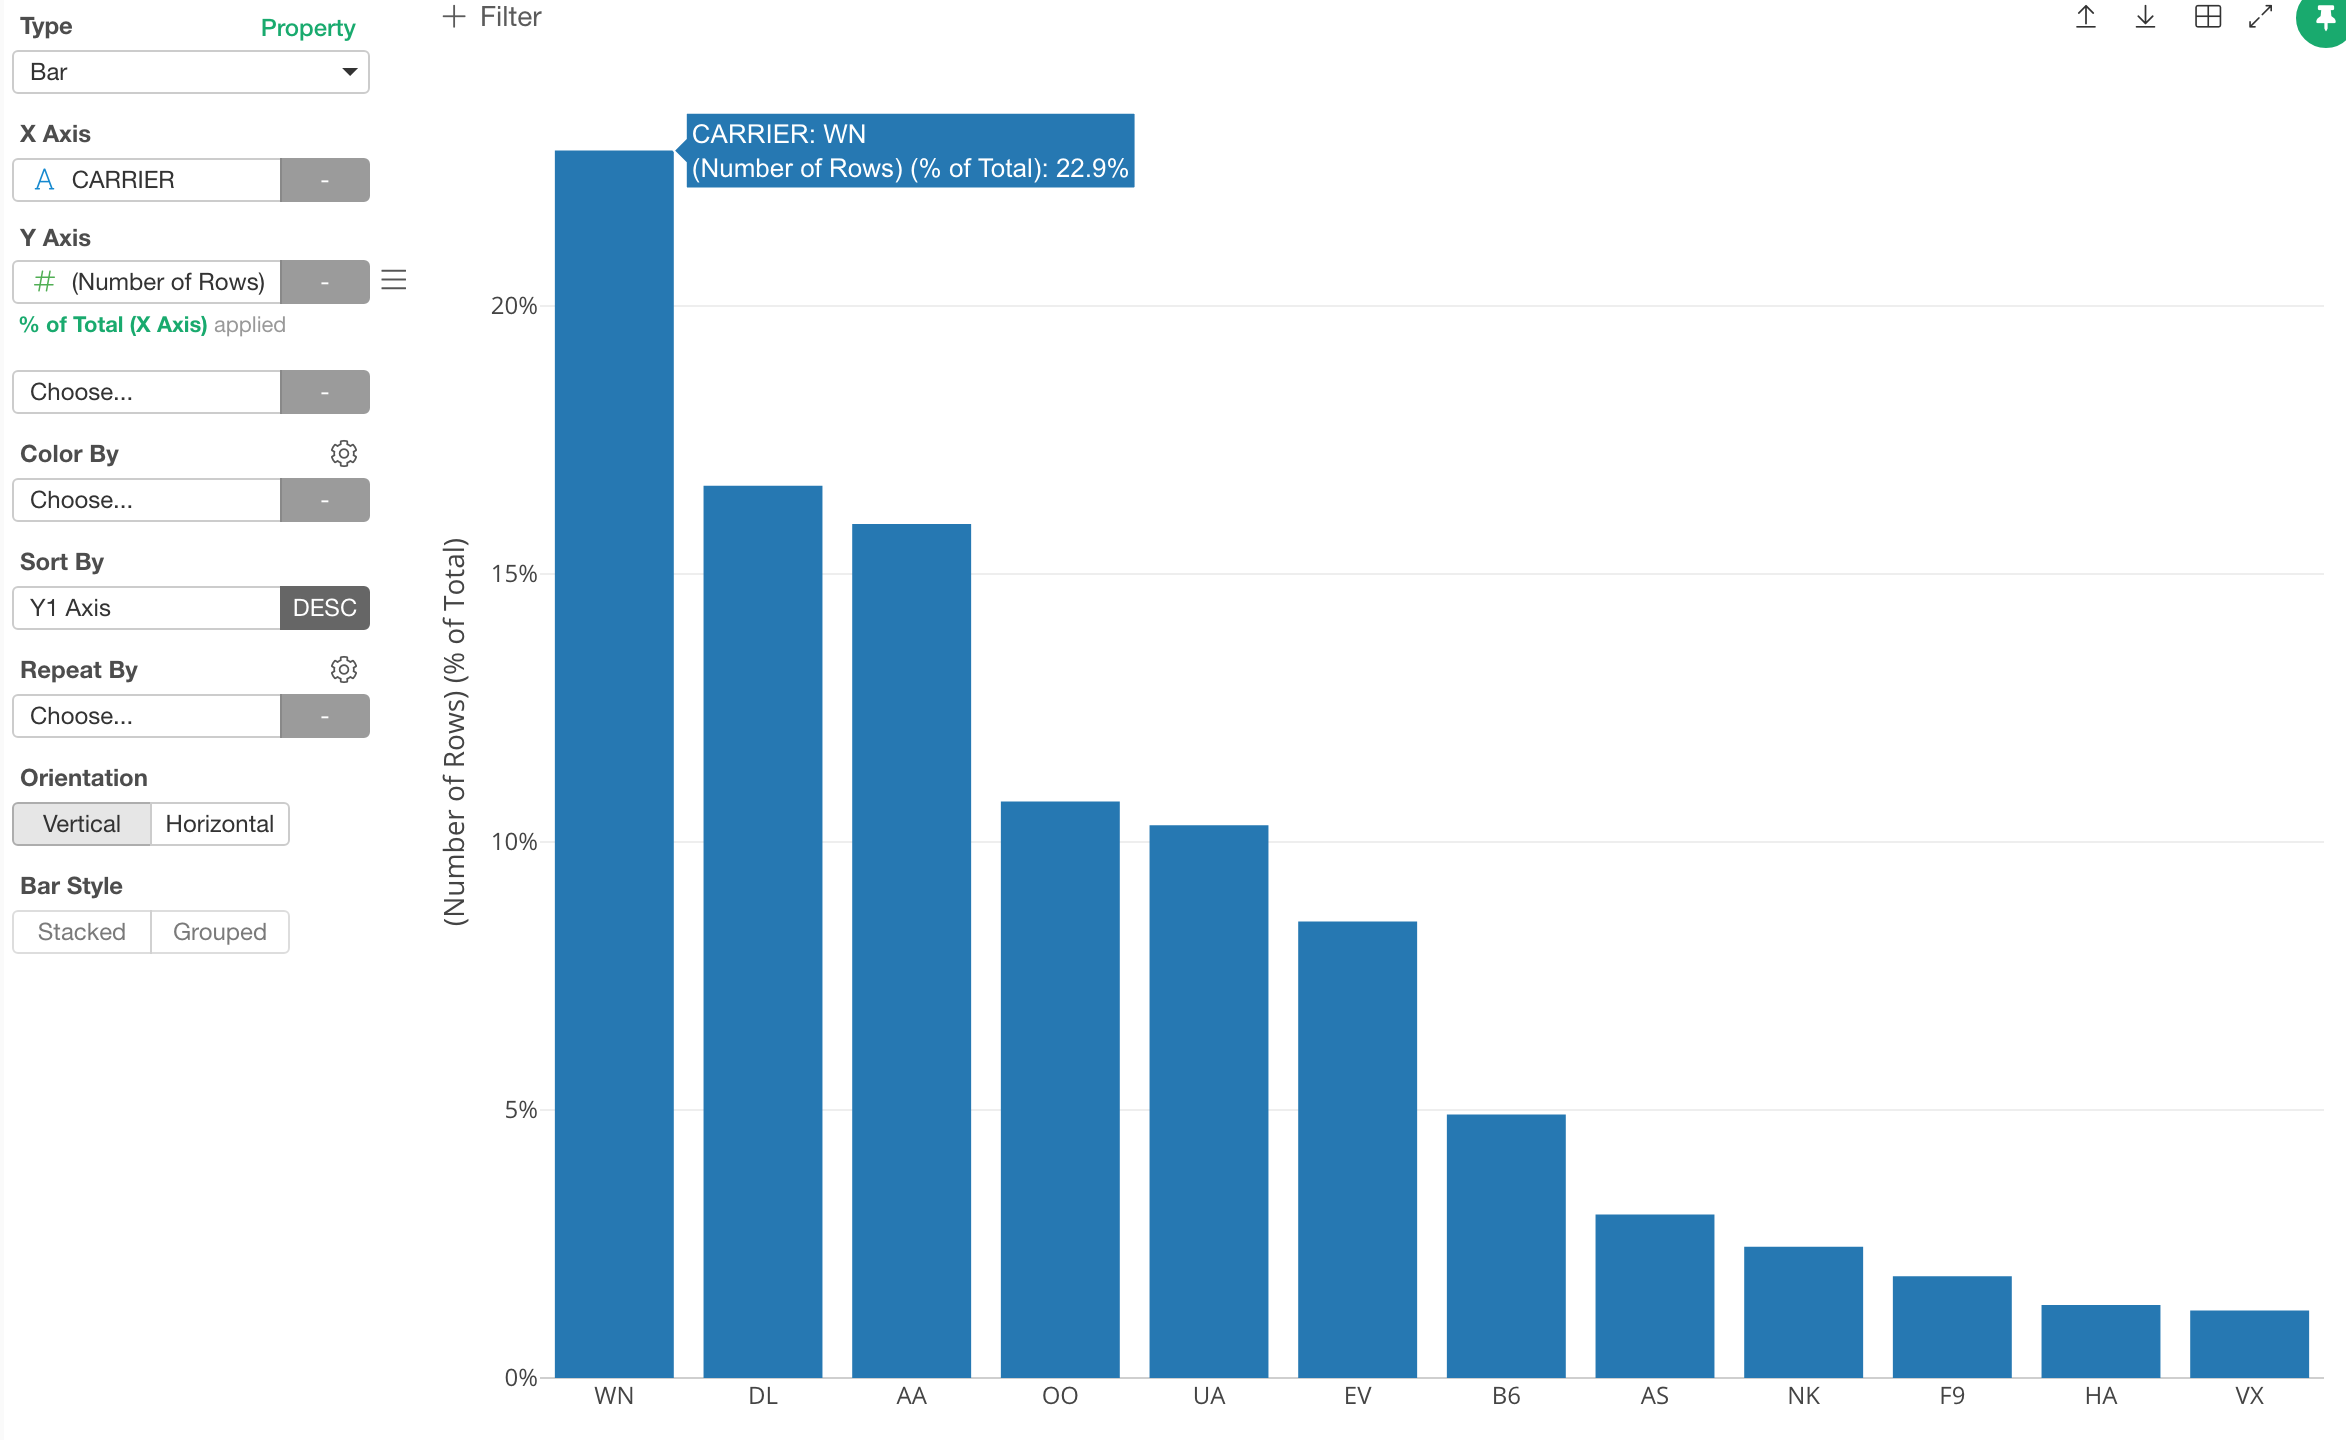
Now each of the bars is showing the percenta of the total.
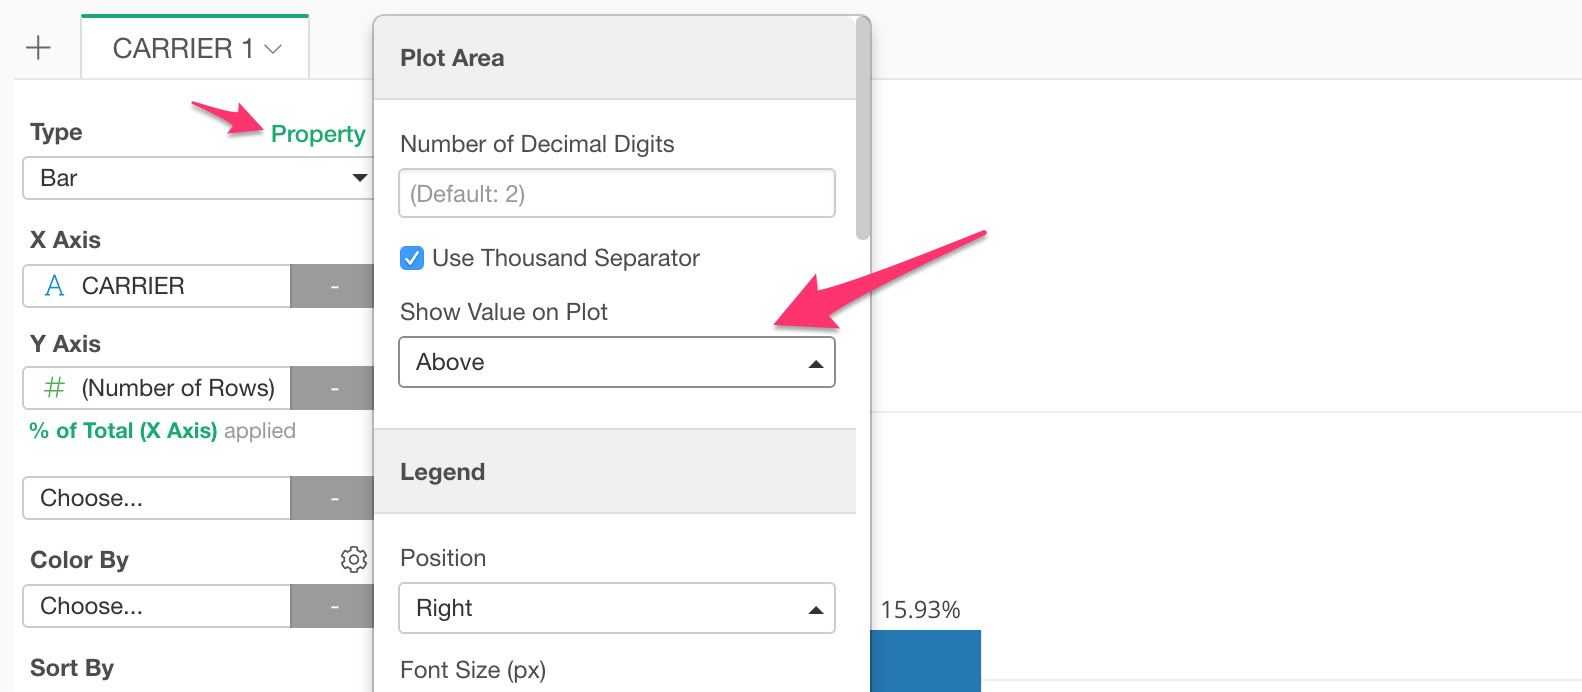
3. Show the Values on Chart
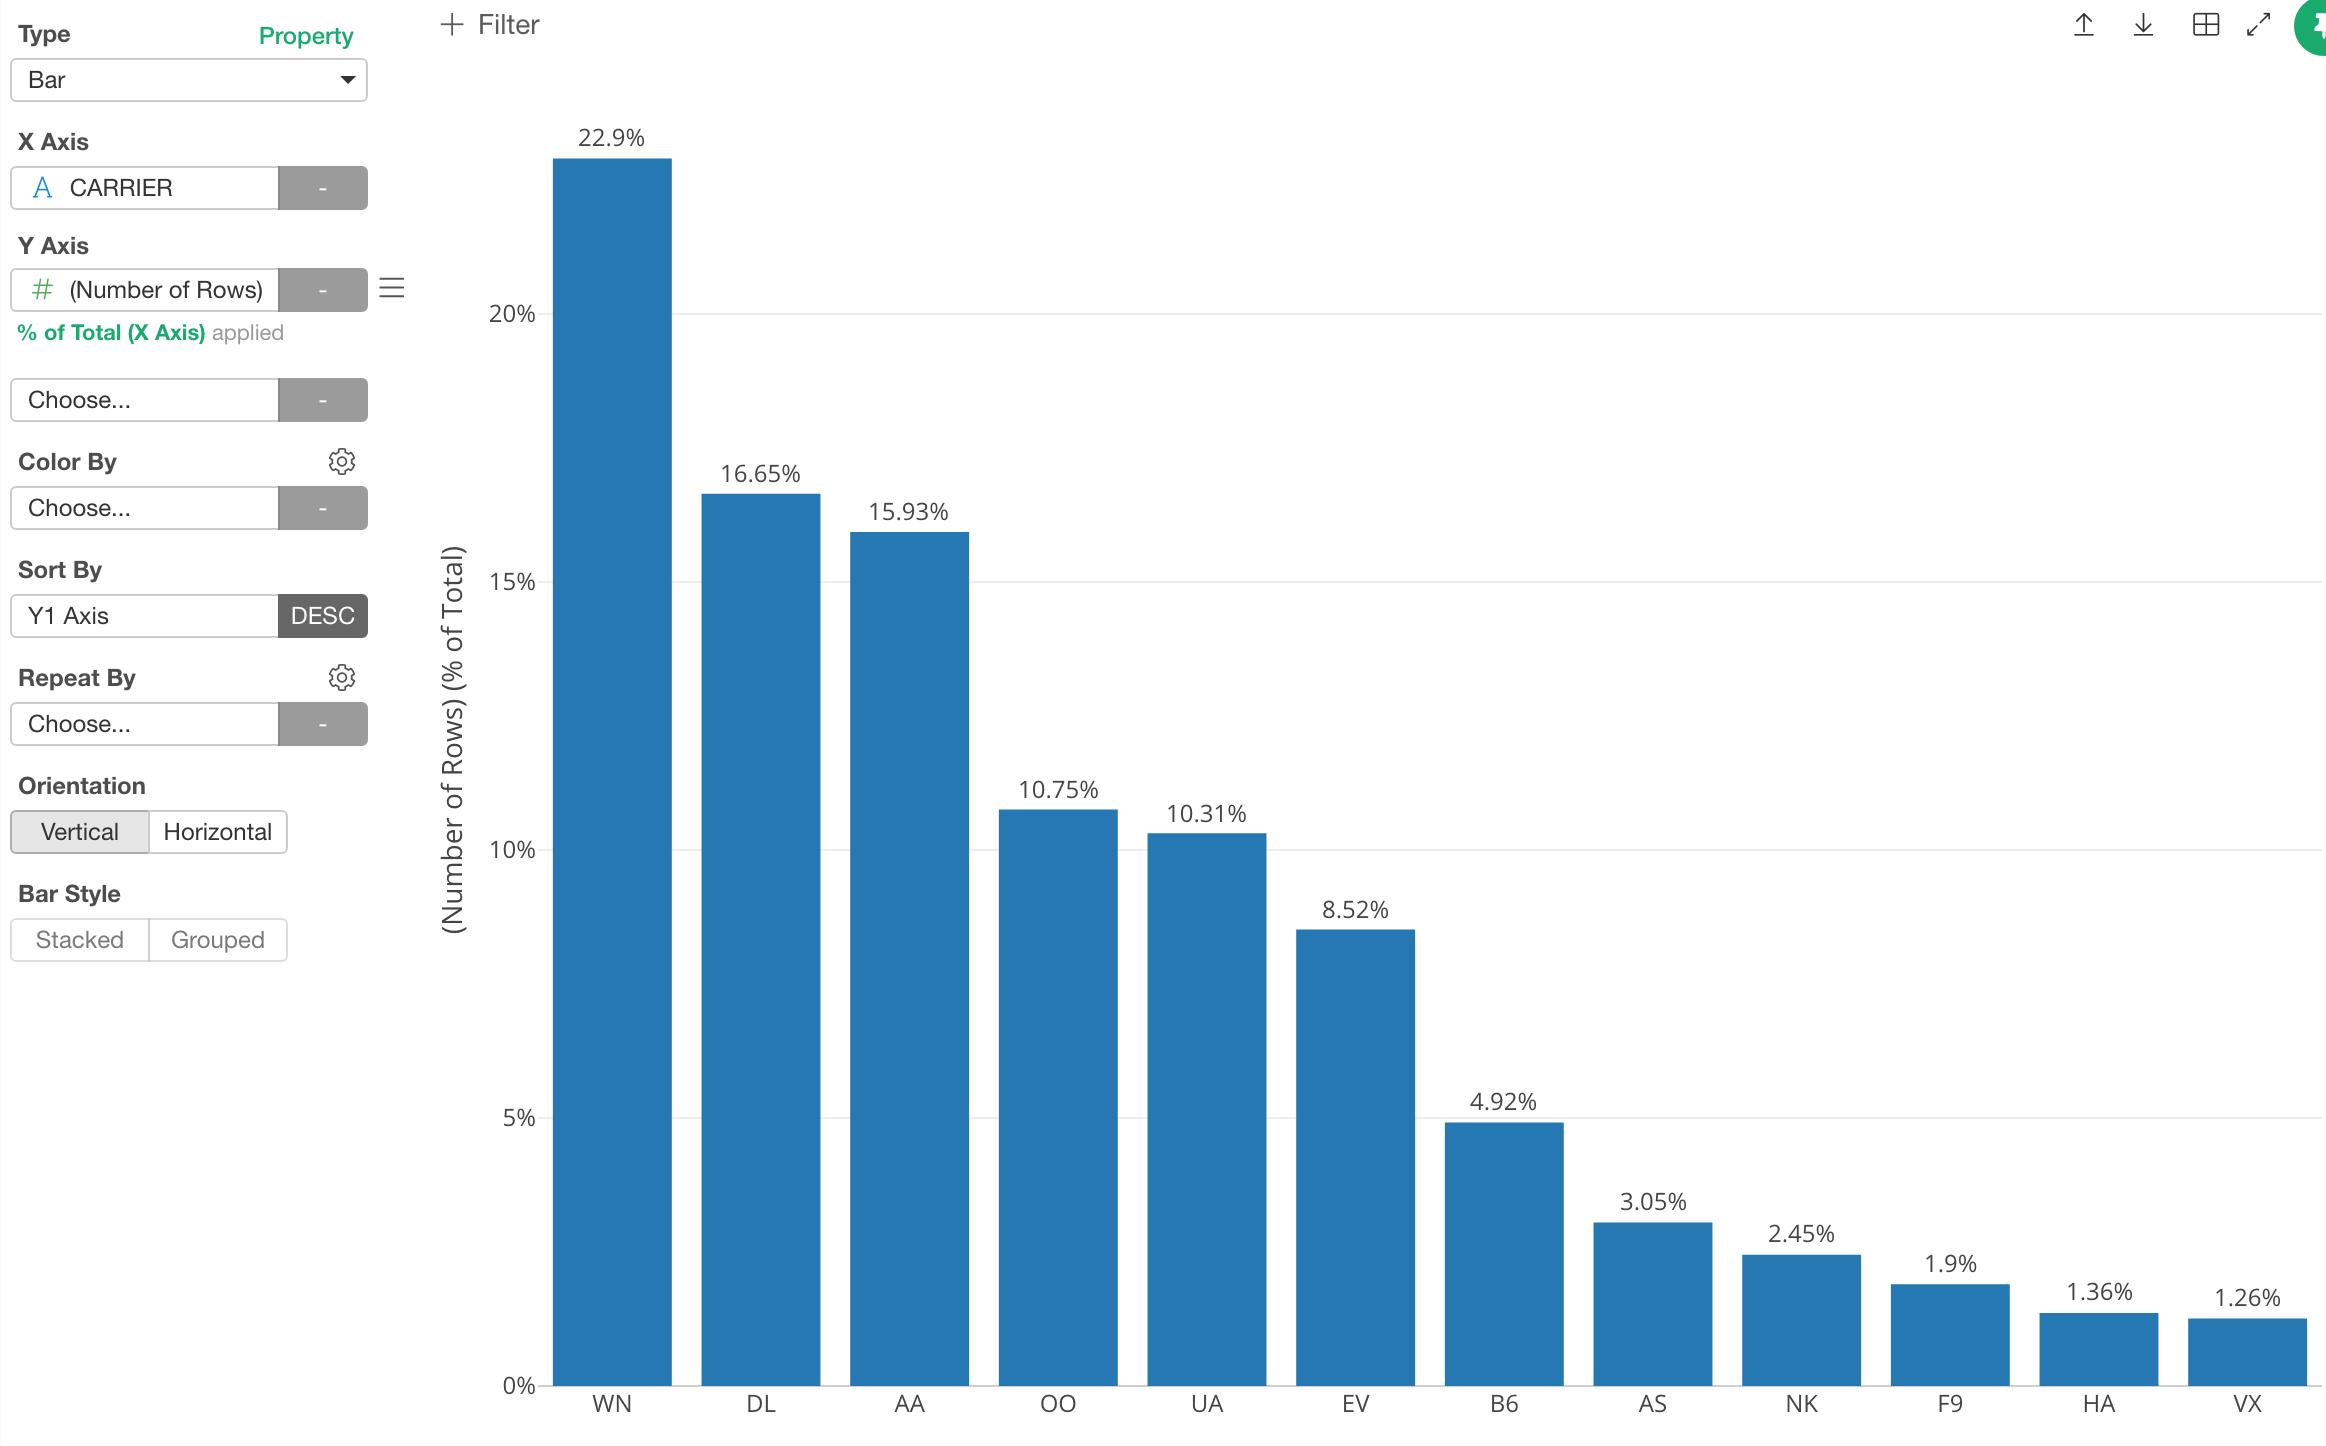
Now, we want to show the percentage value on top of each bar. You can do this from the chart property dialog.
Finally, here is a chart that shows the percentage based on the number of the rows.