The earth is getting warmer. The sea level is getting higher. The ice is melting. The storms are getting bigger. Yes, I’m talking about the Climate Change.
But who are making the things worse? Is that really the United States? Are the developing countries the ones? Or maybe something completely different.
Well, most of us know that China is the number one producer of the CO2 right now. The United States is still the second that leave the next country large behind.
I’ve got this data about the CO2 production by country in 2015 from this wiki page.
And here is the top 30 countries.
This might not be surprising for some, but might be so for some. It’s just incredible how much China is producing CO2 compared to other countries. Even compared to the United States, it’s twice as much.
Now, here it gets more interesting.
I wanted to know if the developed countries are the only ones that need to reduce the CO2 emissions. (Hey, everybody needs to reduce it, that’s no doubt about it though!)
So I’ve labeled each country to be either OECE or not OECD. Being a OECD country means a developed country, if not then it is a developing country.
Here is the same chart with the labels (or colors).
The blue color indicates the non OECD countries and the orange color indicates the OECD countries.
You would notice that there are three countries, China, India, and Russia, being in the top 5. And they produce a lot.
If we combine all the CO2 produced by OECD and non OECD countries and compared the two, here it is.
It turned out the 63% of the CO2 produced by the top 30 countries are coming from non-OECD!
Are the size of economy and the amount of CO2 emissions correlated?
I wanted to compare against GDP. I thought the bigger the GDP is the bigger the CO2 production is.
The blue bars represent the CO2 emissions by country and the values are scaled at Y1 Axis (or left side axis). The orange bars represent the GDP in USD and scaled at Y2 Axis (or right side axis). And, I’ve sorted the countries based on the GDP (Orange).
What we are seeing here is, as a general trend, we can see the orange bar is higher than the blue bar for each country, except for a few countries such as China, India, Russia, Saudi Arabia, Iran, etc.
So it’s not like the size of the GDP is correlated to the amount of the CO2 emissions.
Wait.
Or, actually there is a correlation between GDP and CO2, but the trend is different between the OECD and the non-OECD countries?
Here is a scatter chart for which I’ve assigned GDP to X-Axis and CO2 emissions to Y-Axis. Each circle represents each country.
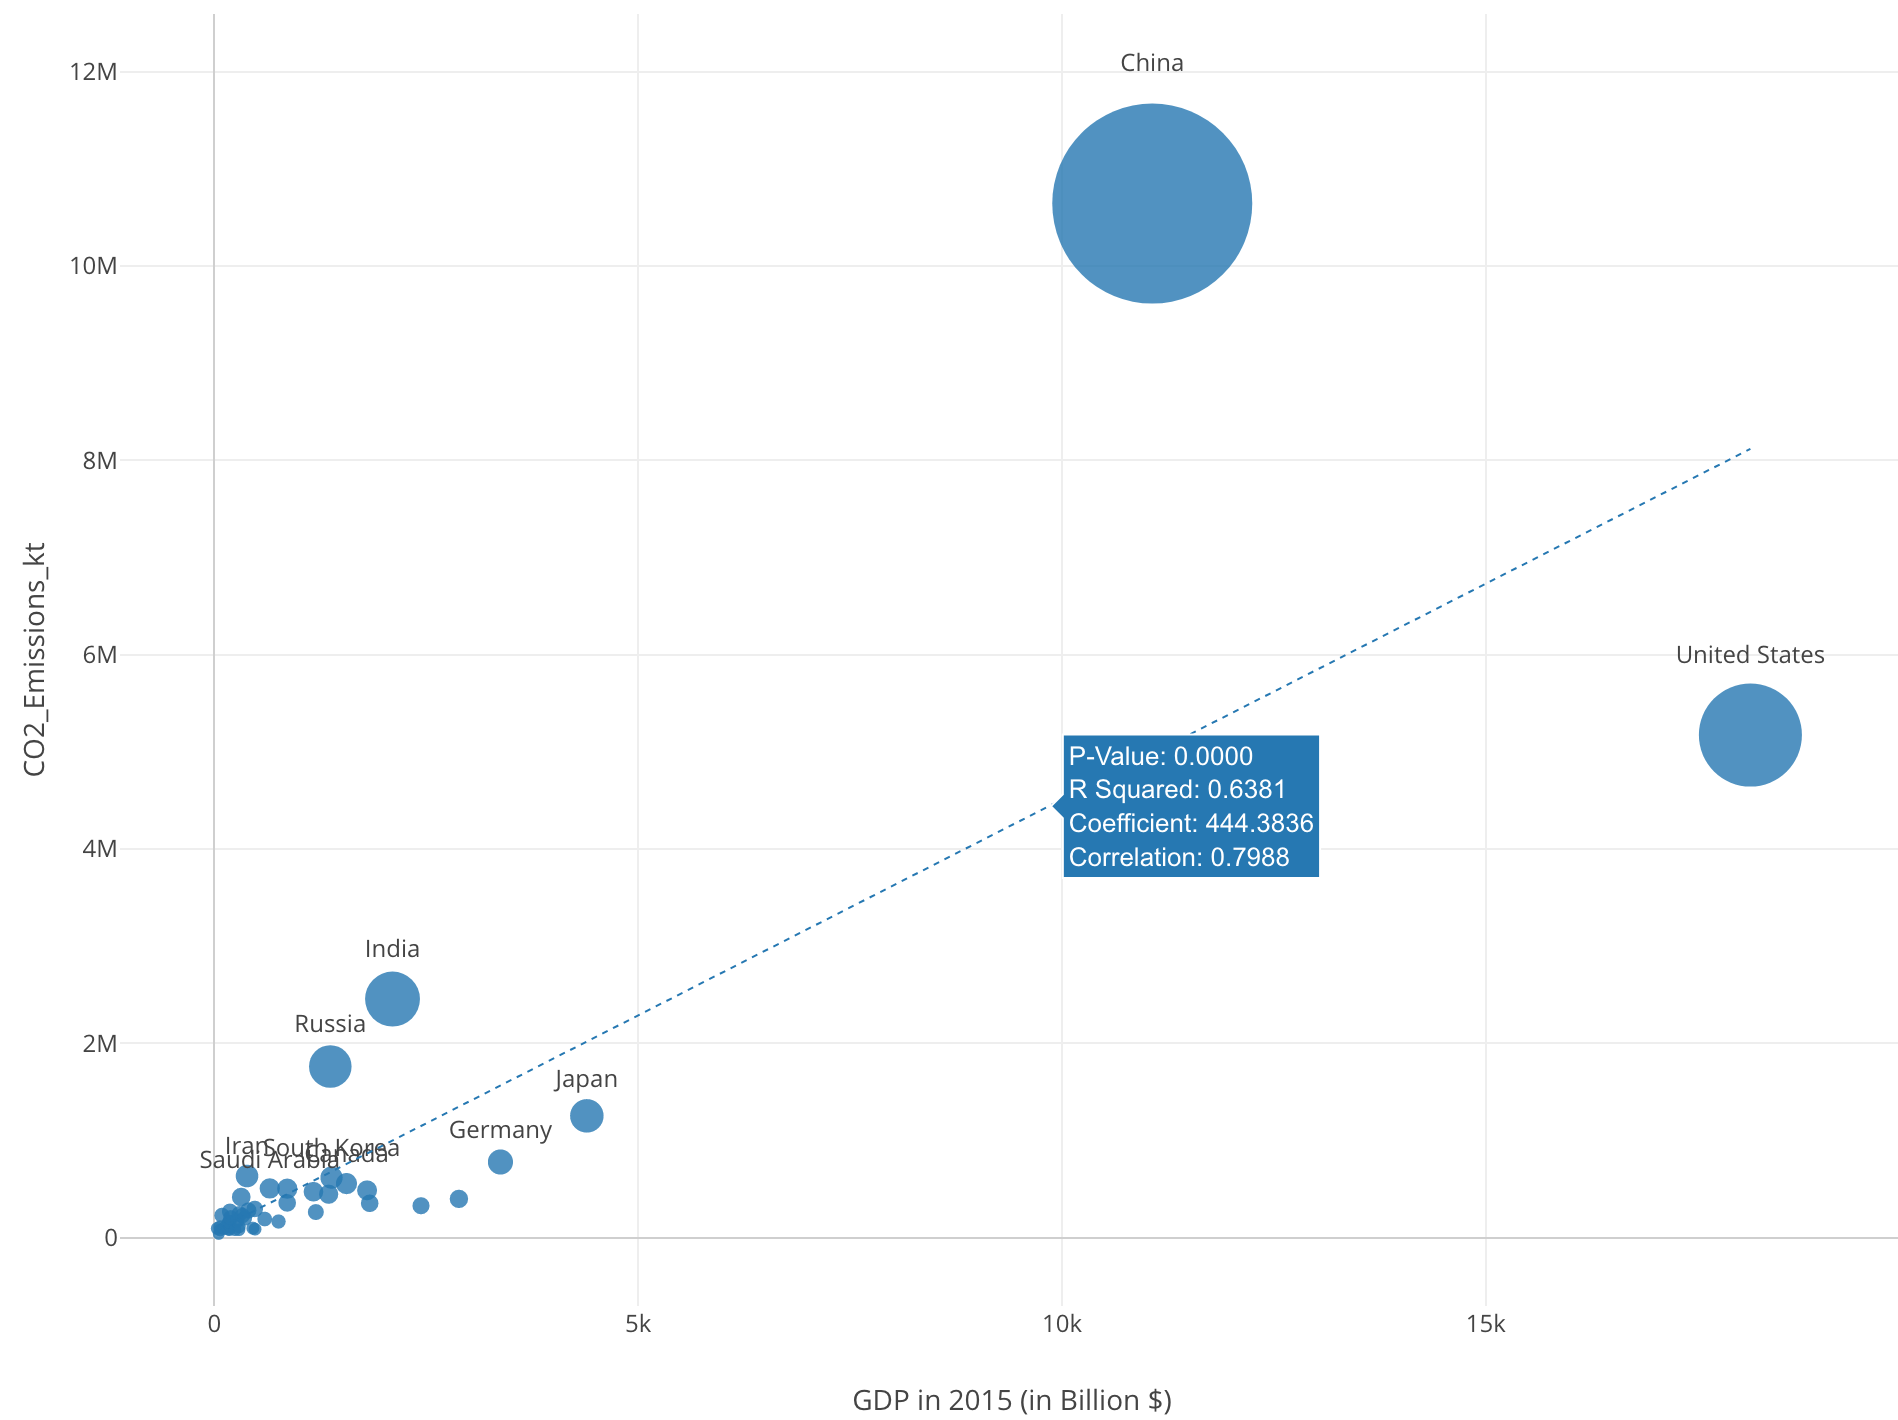
When you place the mouse over the trend line (blue dotted line) you can see some metrics like Correlation, Coefficient (Slope), R-Squared, and P-Value. I’m not going to into the details of these metrics here, but if you are interested I’d suggest you take a look at the following post.
- A Beginner’s Guide to Exploratory Data Analysis with Linear Regression — Part 1 - Link
The one I’m interested in here is Correlation, which is 0.7988 and is not that high.
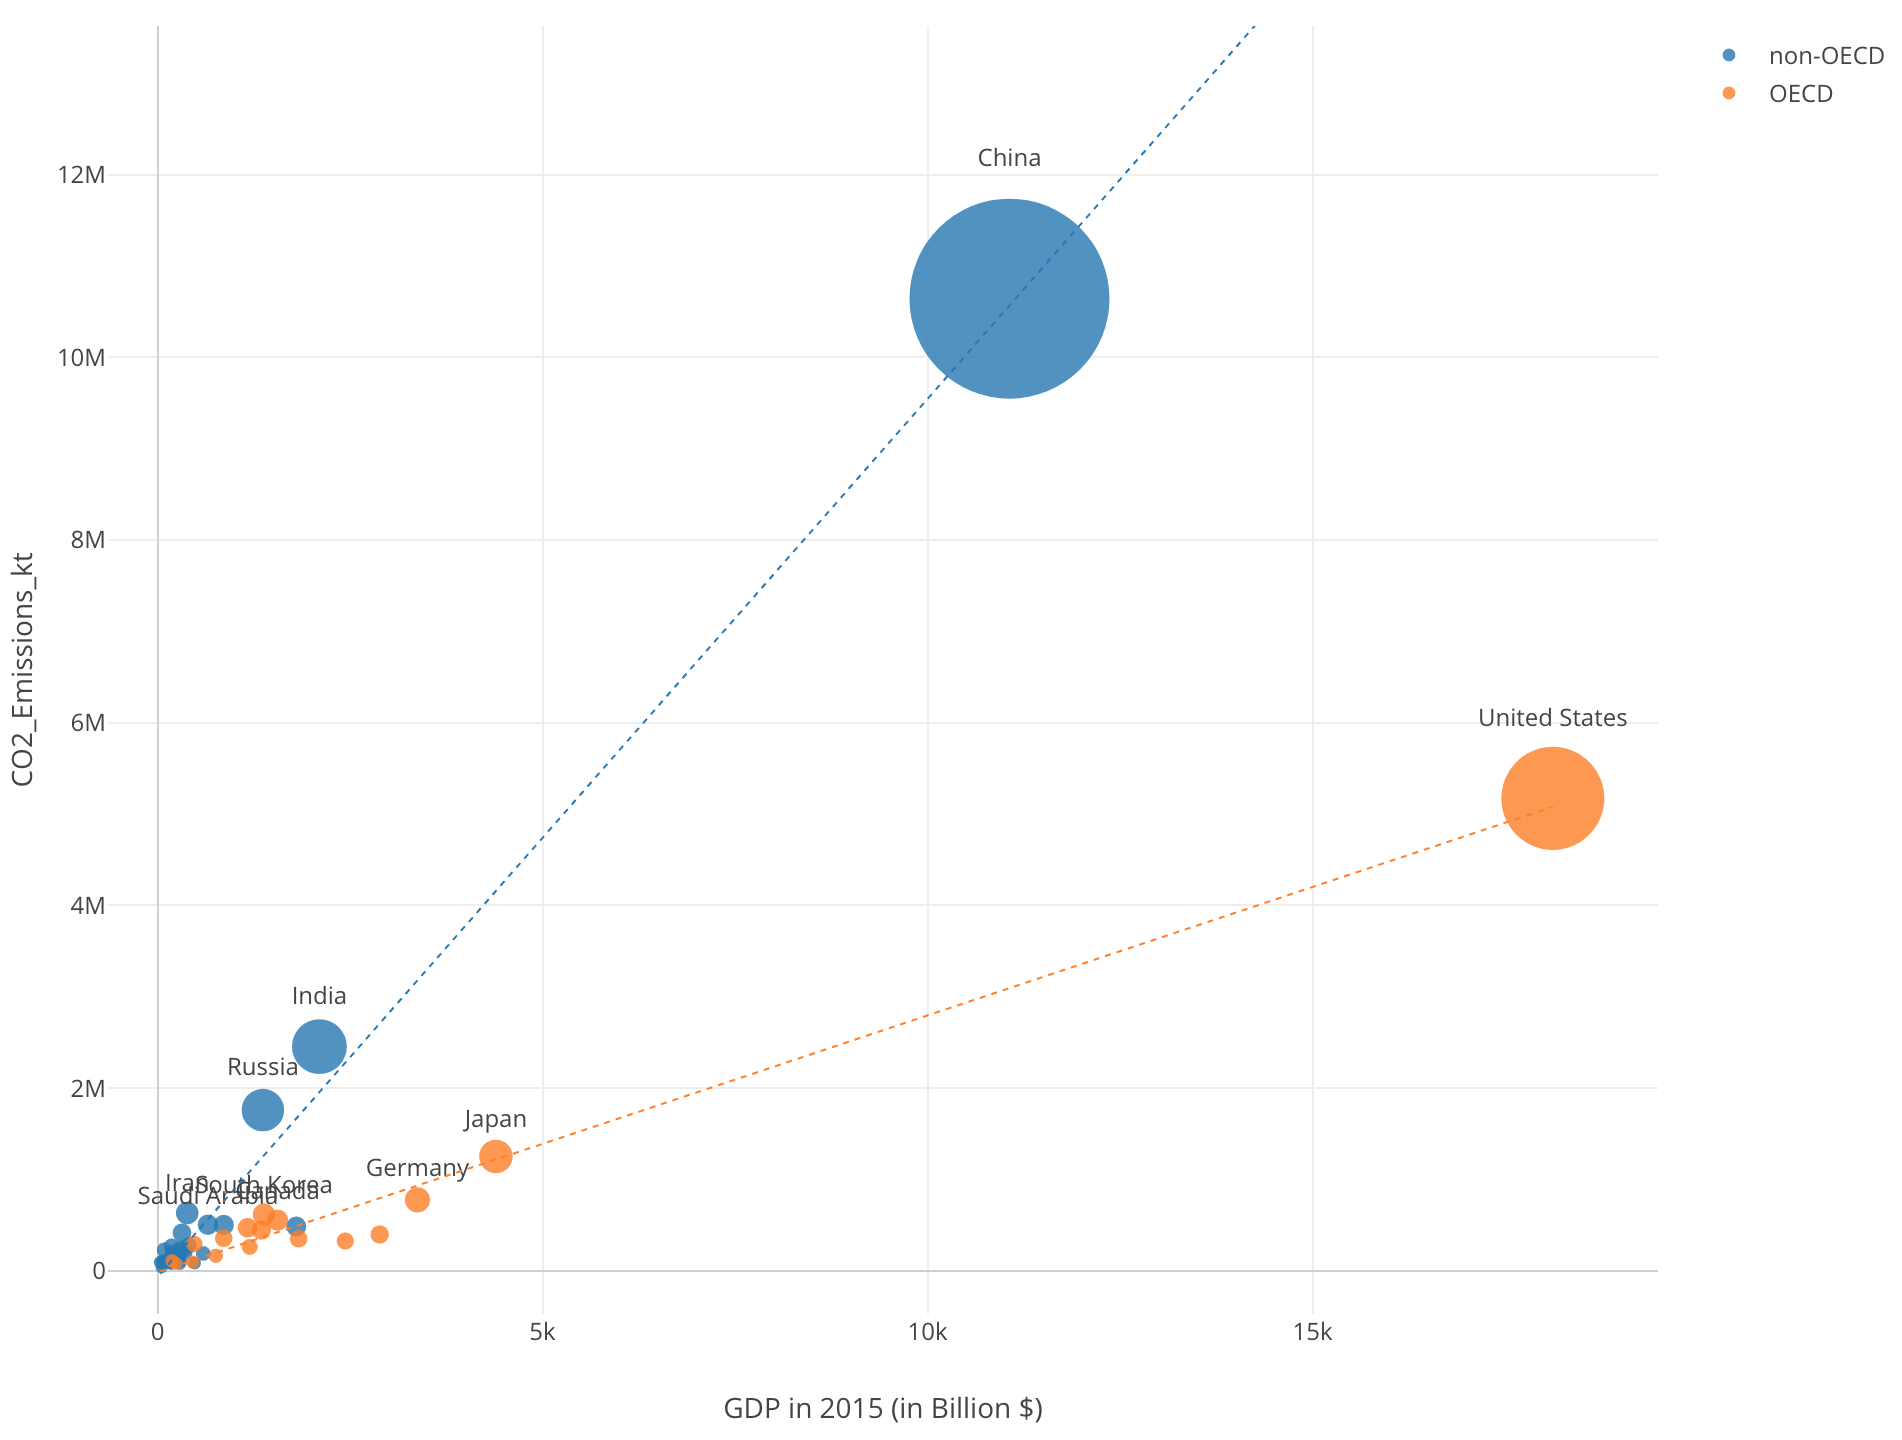
Now, let’s assign the OECD or non-OECD indicator to Color.
The orange circles are the OECD countries and the blue countries are the non-OECD countries.
When you place the mouse over the trend lines you can the Correlation.
This time, it shows 0.99 for both the OECD and the non-OECD countries. These are super high. So there is a highly positive correlation between the GDP and the CO2, just that these two type of countries have two different trends.
I’m showing the top county names.
If I remove China and the United States, it would look something like the below.
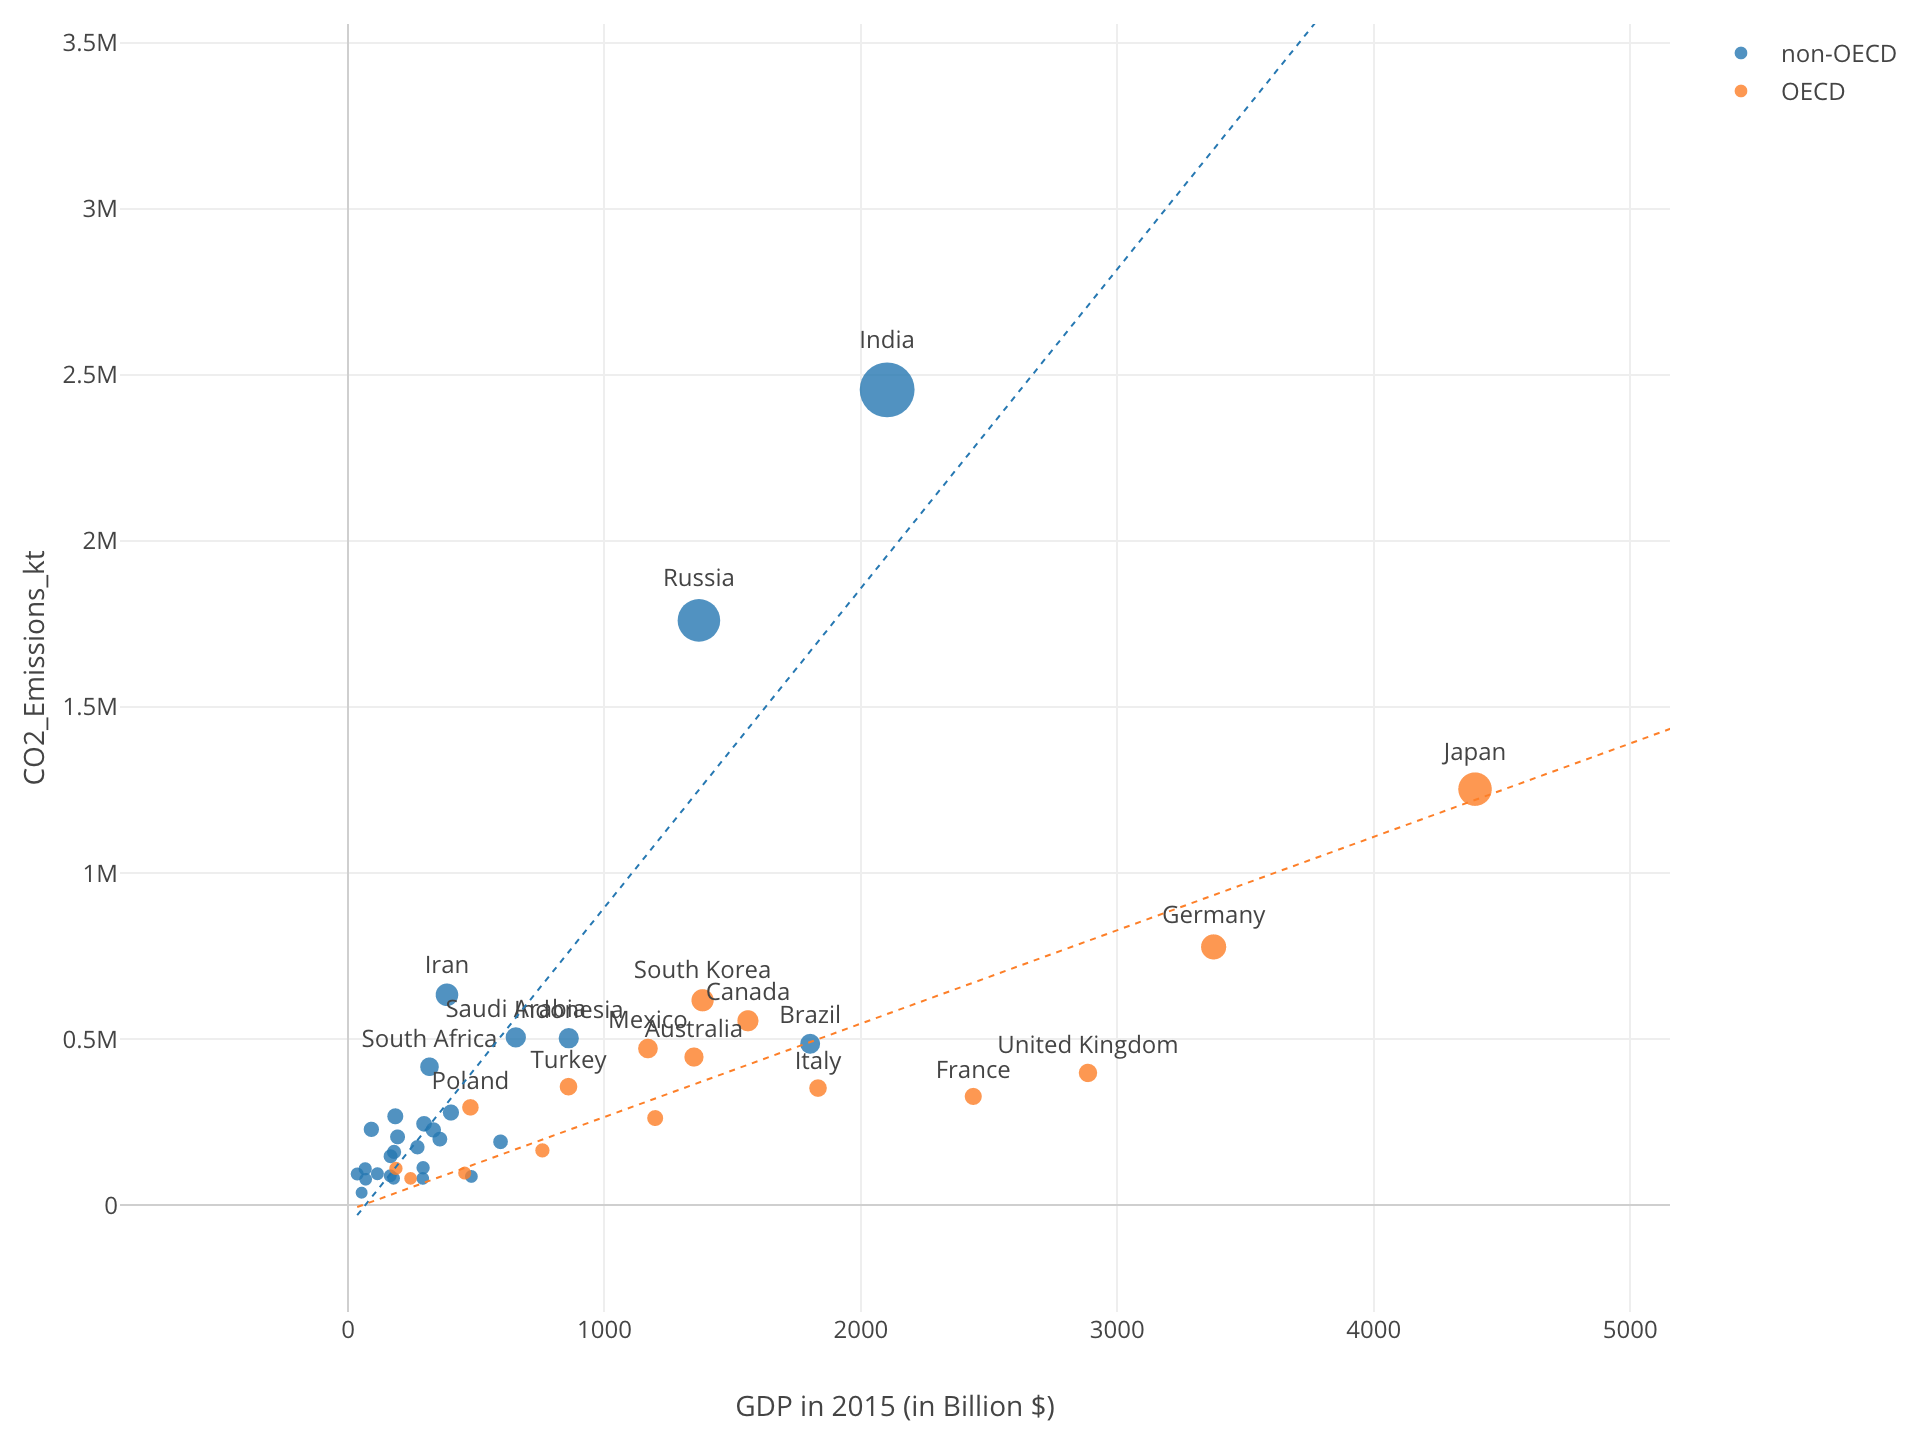
So yes, we all need to work hard to reduce CO2 emissions, but just working hard in the developed countries might not help the worsening the situation much. The real and the growing problem is in the developing countries especially China, India, and Russia.
Data Source:
GDP : World Bank - Link