How to Calculate Confidence Intervals from Aggregated Data.
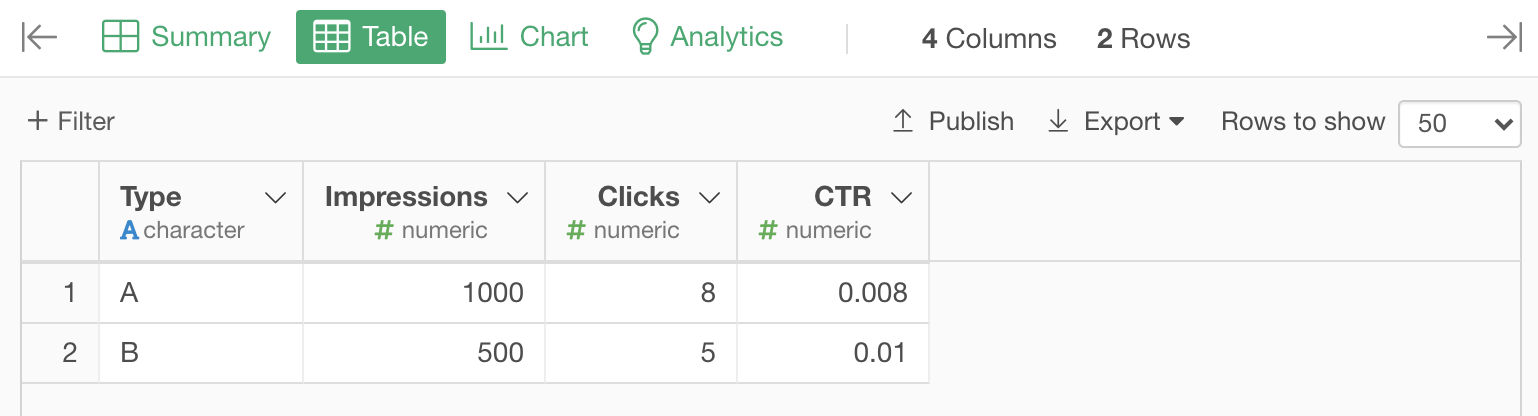
Suppose we have website access data for 2 web pages ("A" and "B"). It has "Impressions", "Clicks", and "CTR" (Click-Through Rates) columns and data is already aggregated like the following.
Calculating 95% Confidence Interval Ranges
Now, we want to calculate 95% confidence intervals of CTR for those web pages. There is a function called "calc_confint_ratio" in Exploratory that can calculate confidence intervals from the ratio of the group and sample (group) size.
calc_confint_ratio(<Ratio of the group>, <Sample Size>)See the function reference for details.
Let's take a look at how to do it in Exploratory.
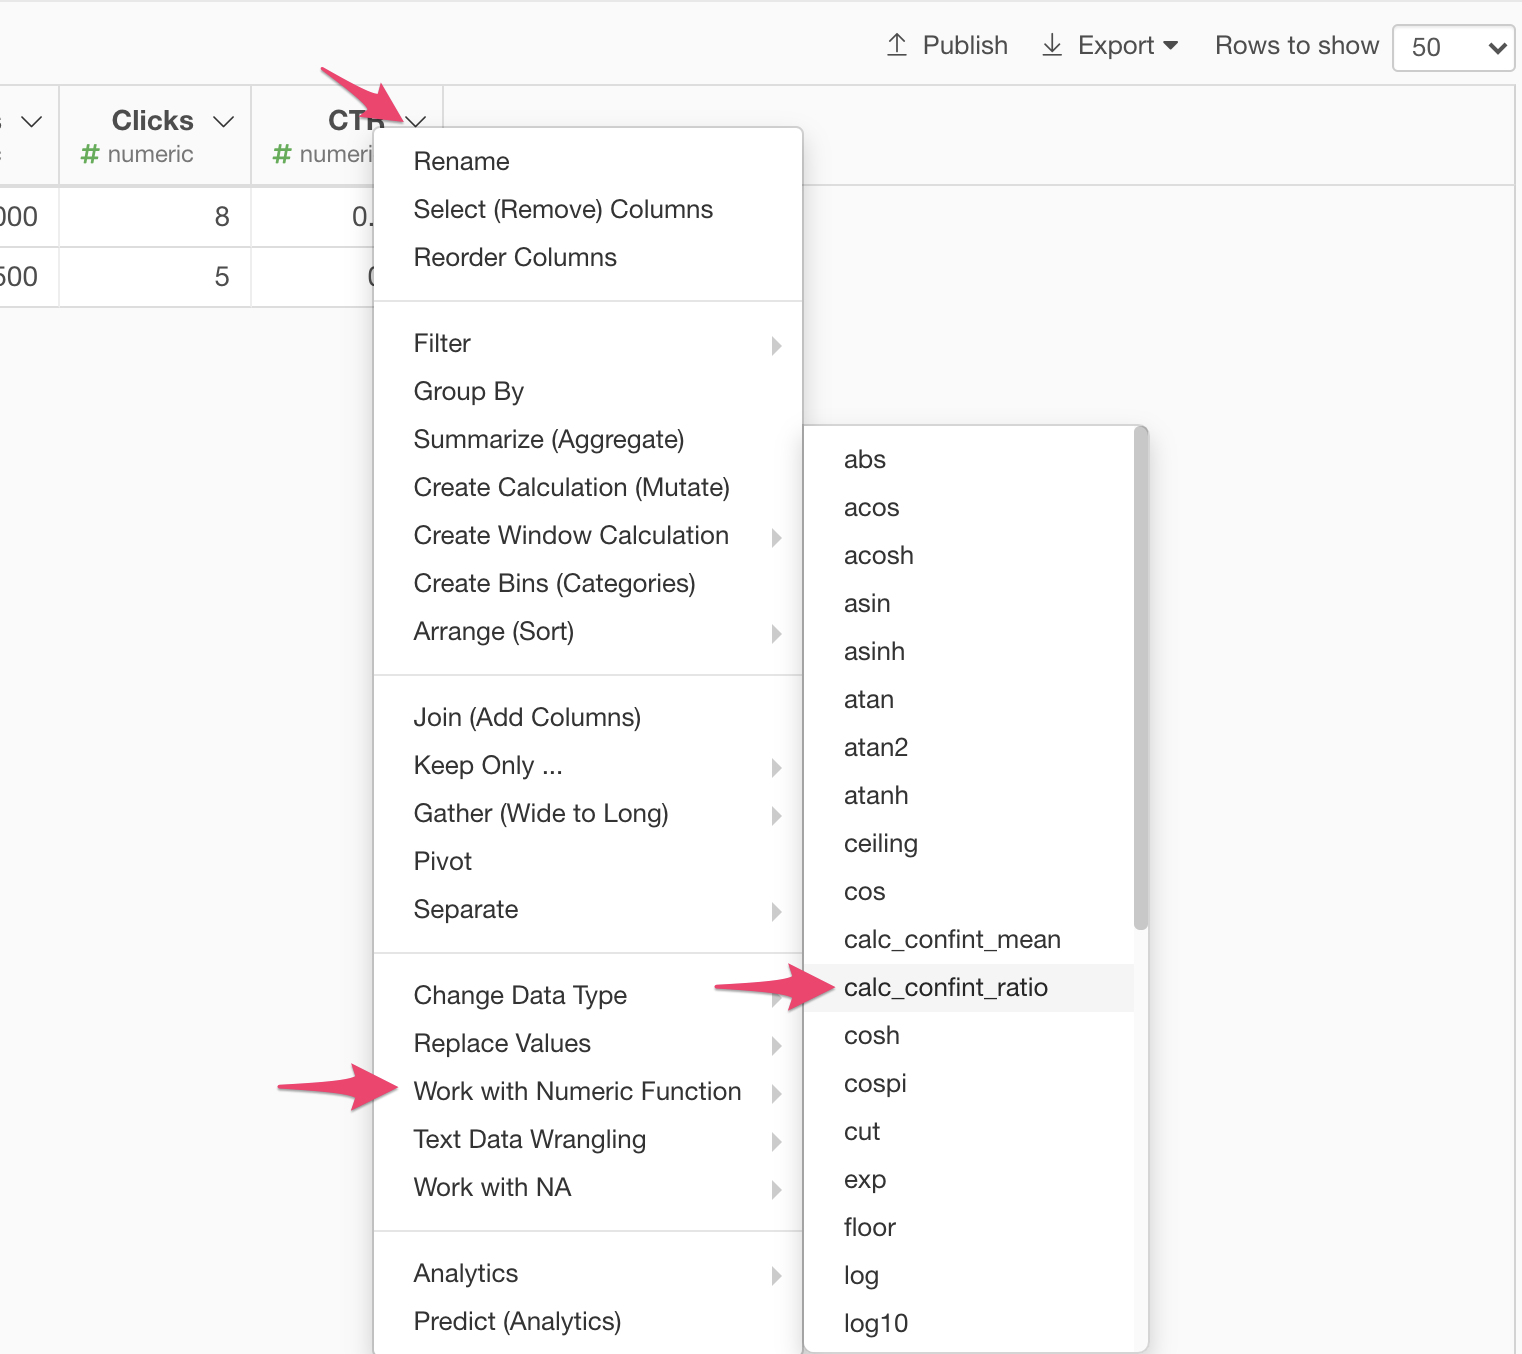
From the column header menu of the "CTR" column, choose "calc_confint_ratio".
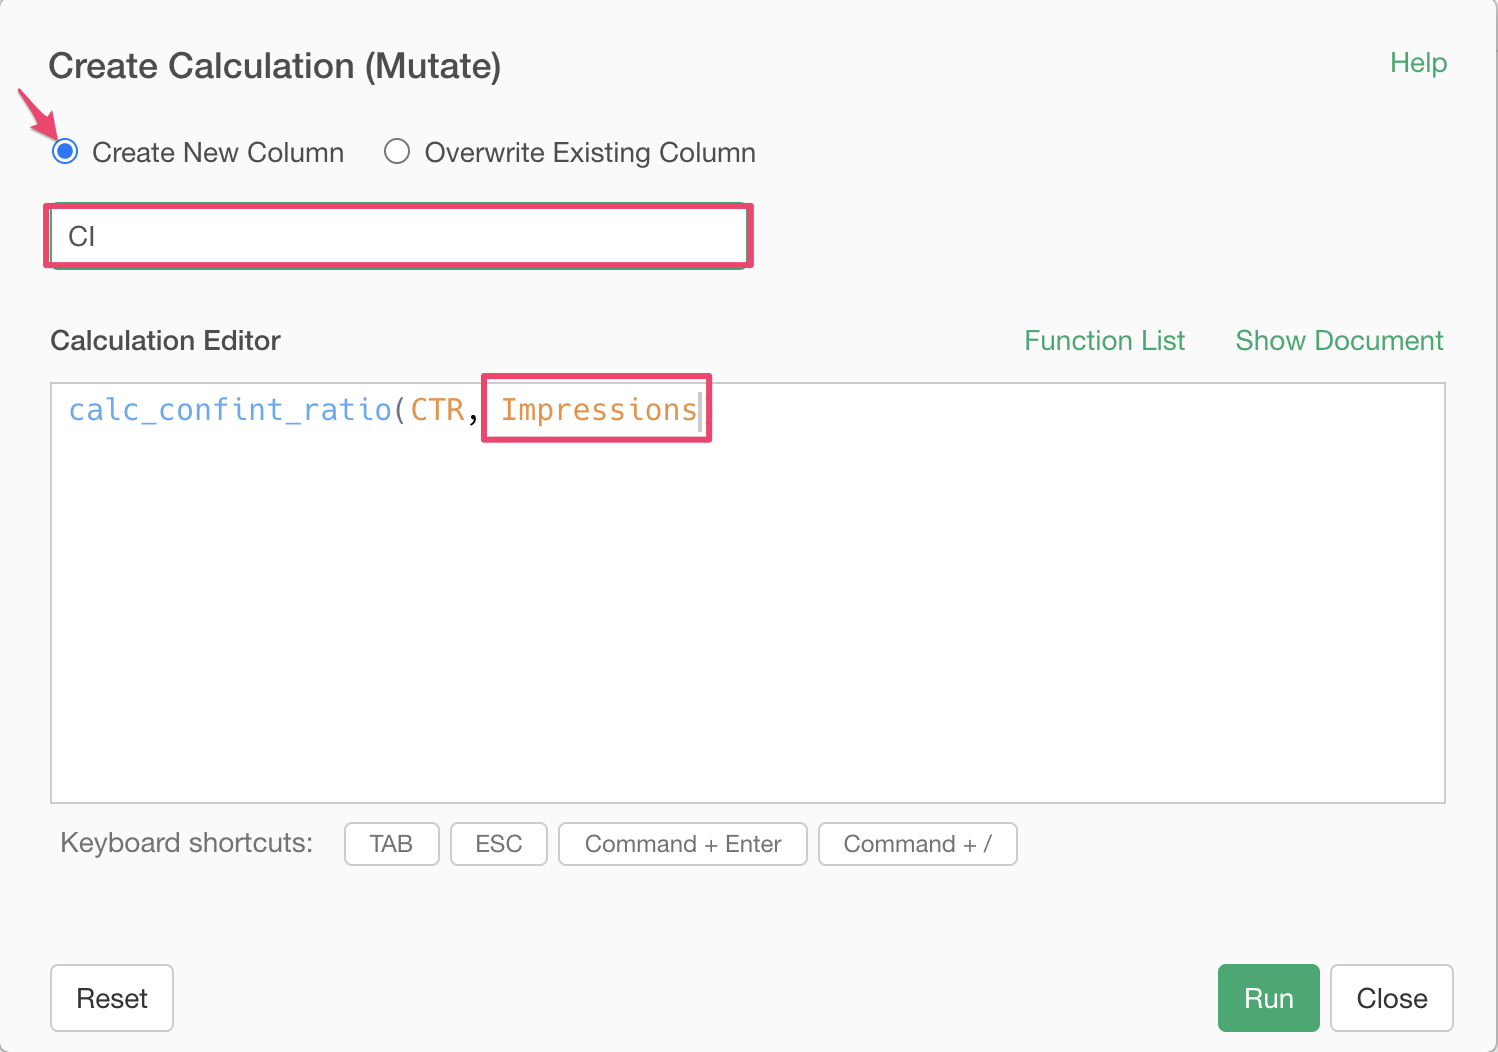
Then it opens up the "Create Calculation" dialog with the "calc_confint_ratio" function in the Calculation Editor. Follow the steps below.
- The function "calc_confint_ratio" requires one more argument for a sample site. Here the sample size is "Impressions", so type in the "Impressions" in the formula.
- Check the "Create New Column" checkbox and type in "CI" for the new column name.
- Click the "Run" button.
Once you click the "Run" button, you will see a new column "CI". This CI column contains 95% confidence interval ranges.
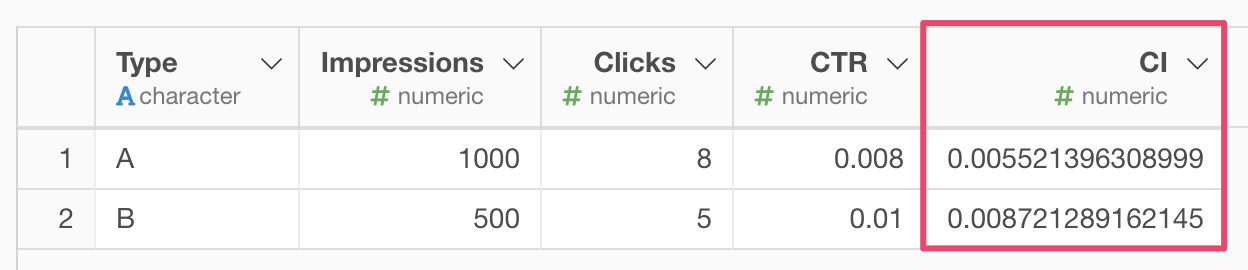
Note that those values are the width of the range. You can calculate the actual 95% confidence interval value ranges of CTR by the following formula.
CTR_upper = CTR + CI
CTR_lower = CTR - CI
Here is how to do it in Exploratory.
From the column header menu of the "CTR" column, choose "Create Calculation (Mutate)".
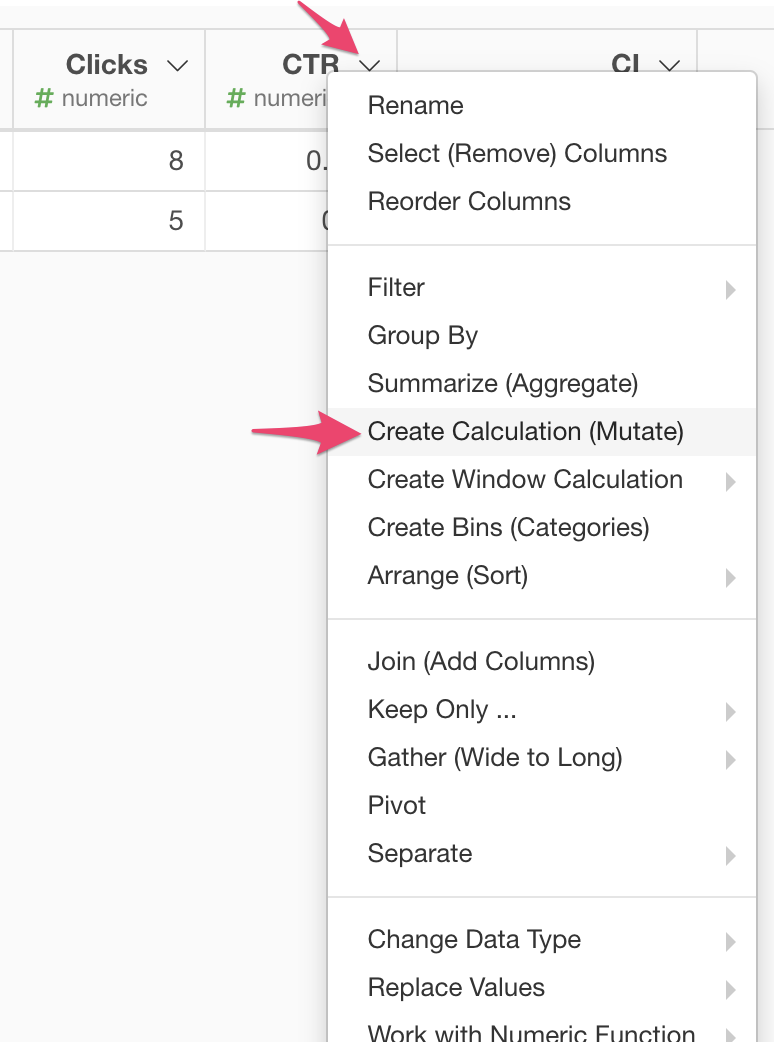
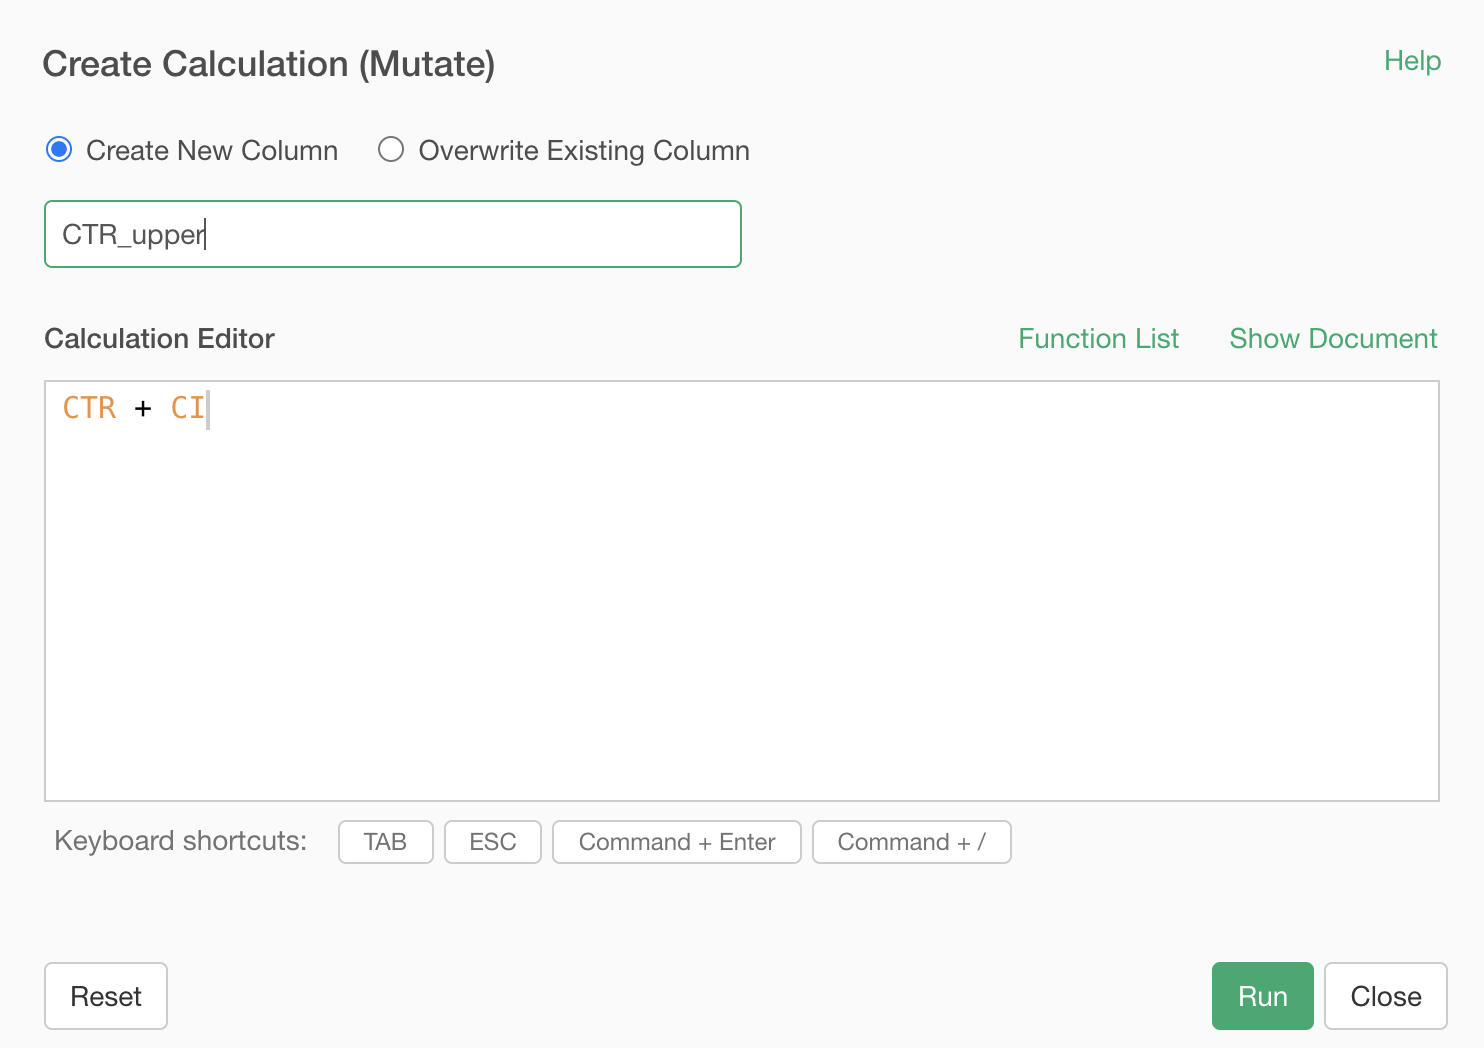
It opens up the "Create Calculation" dialog. Do the following steps.
- Type in "CTR + CI" to complete the formula in Calculation Editor.
- Check the "Create New Column" checkbox and type in "CTR_upper" for the new column name.
- Click the "Run" button.
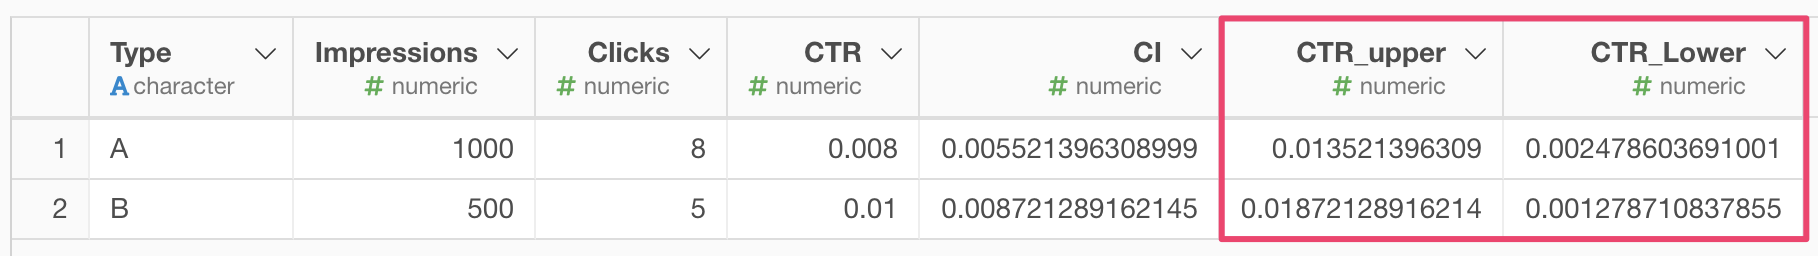
It will create the "CTR_upper" column. Create the "CTR_lower" column in the same way. Now you get the 95% confidence interval value ranges of CTR.
Visualizing Confidence Intervals
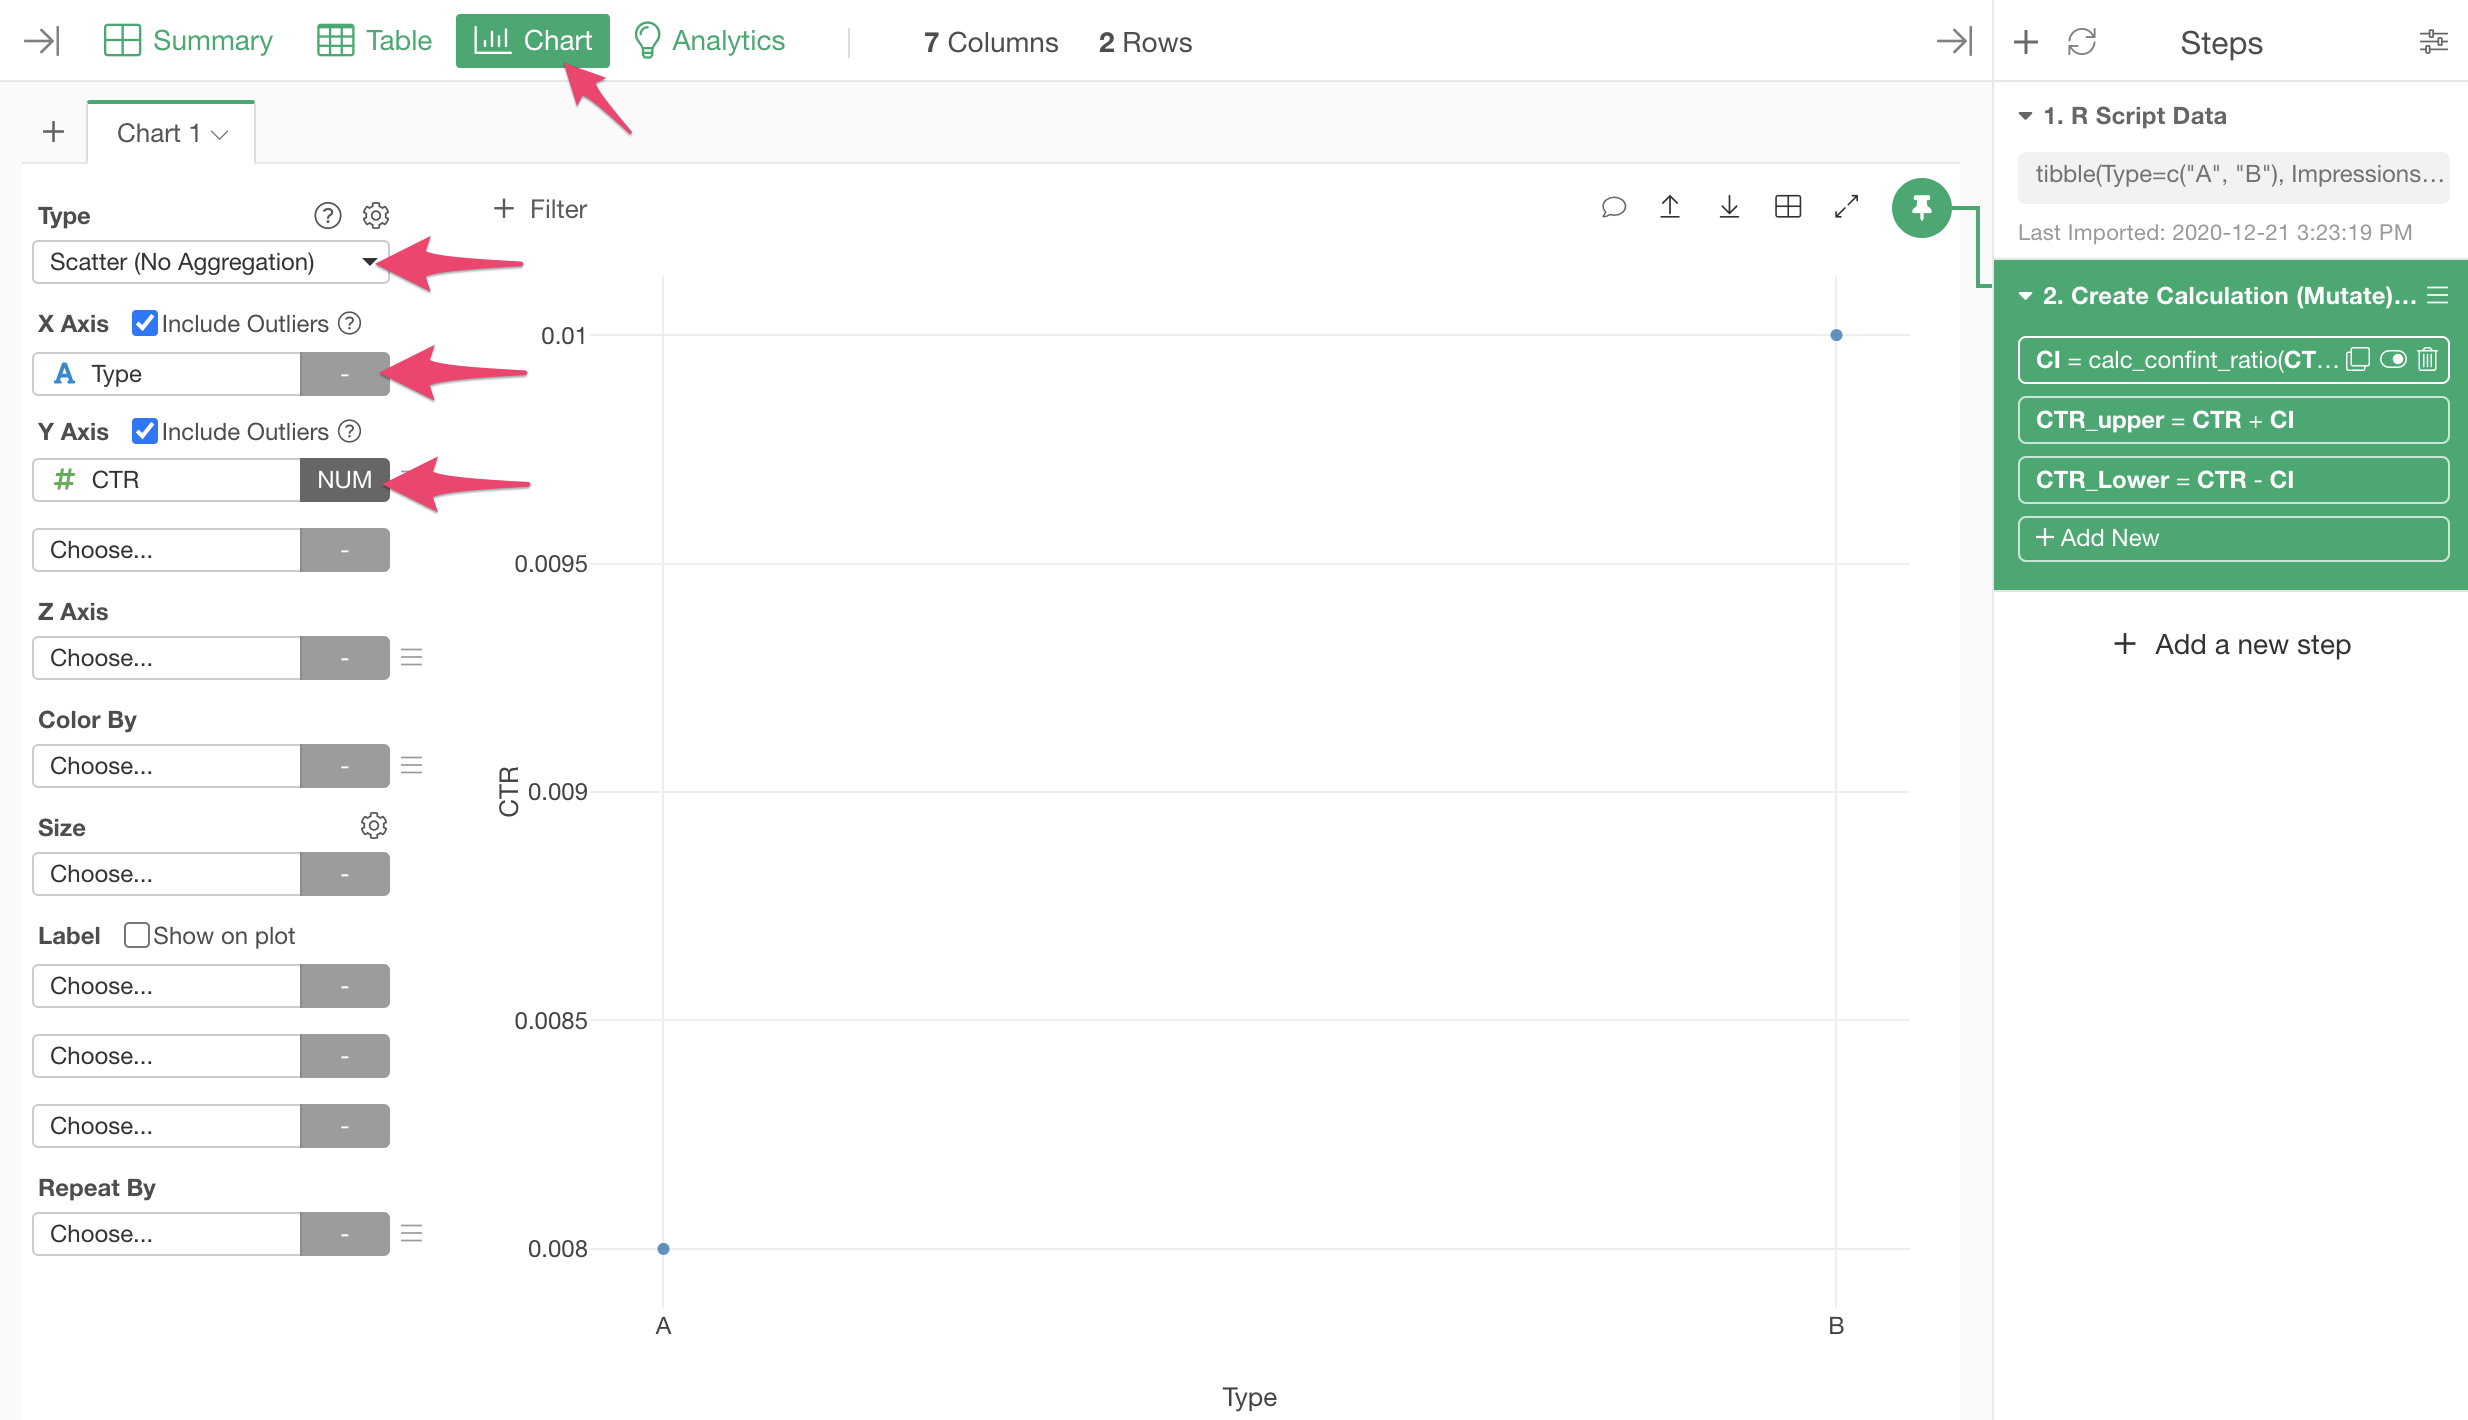
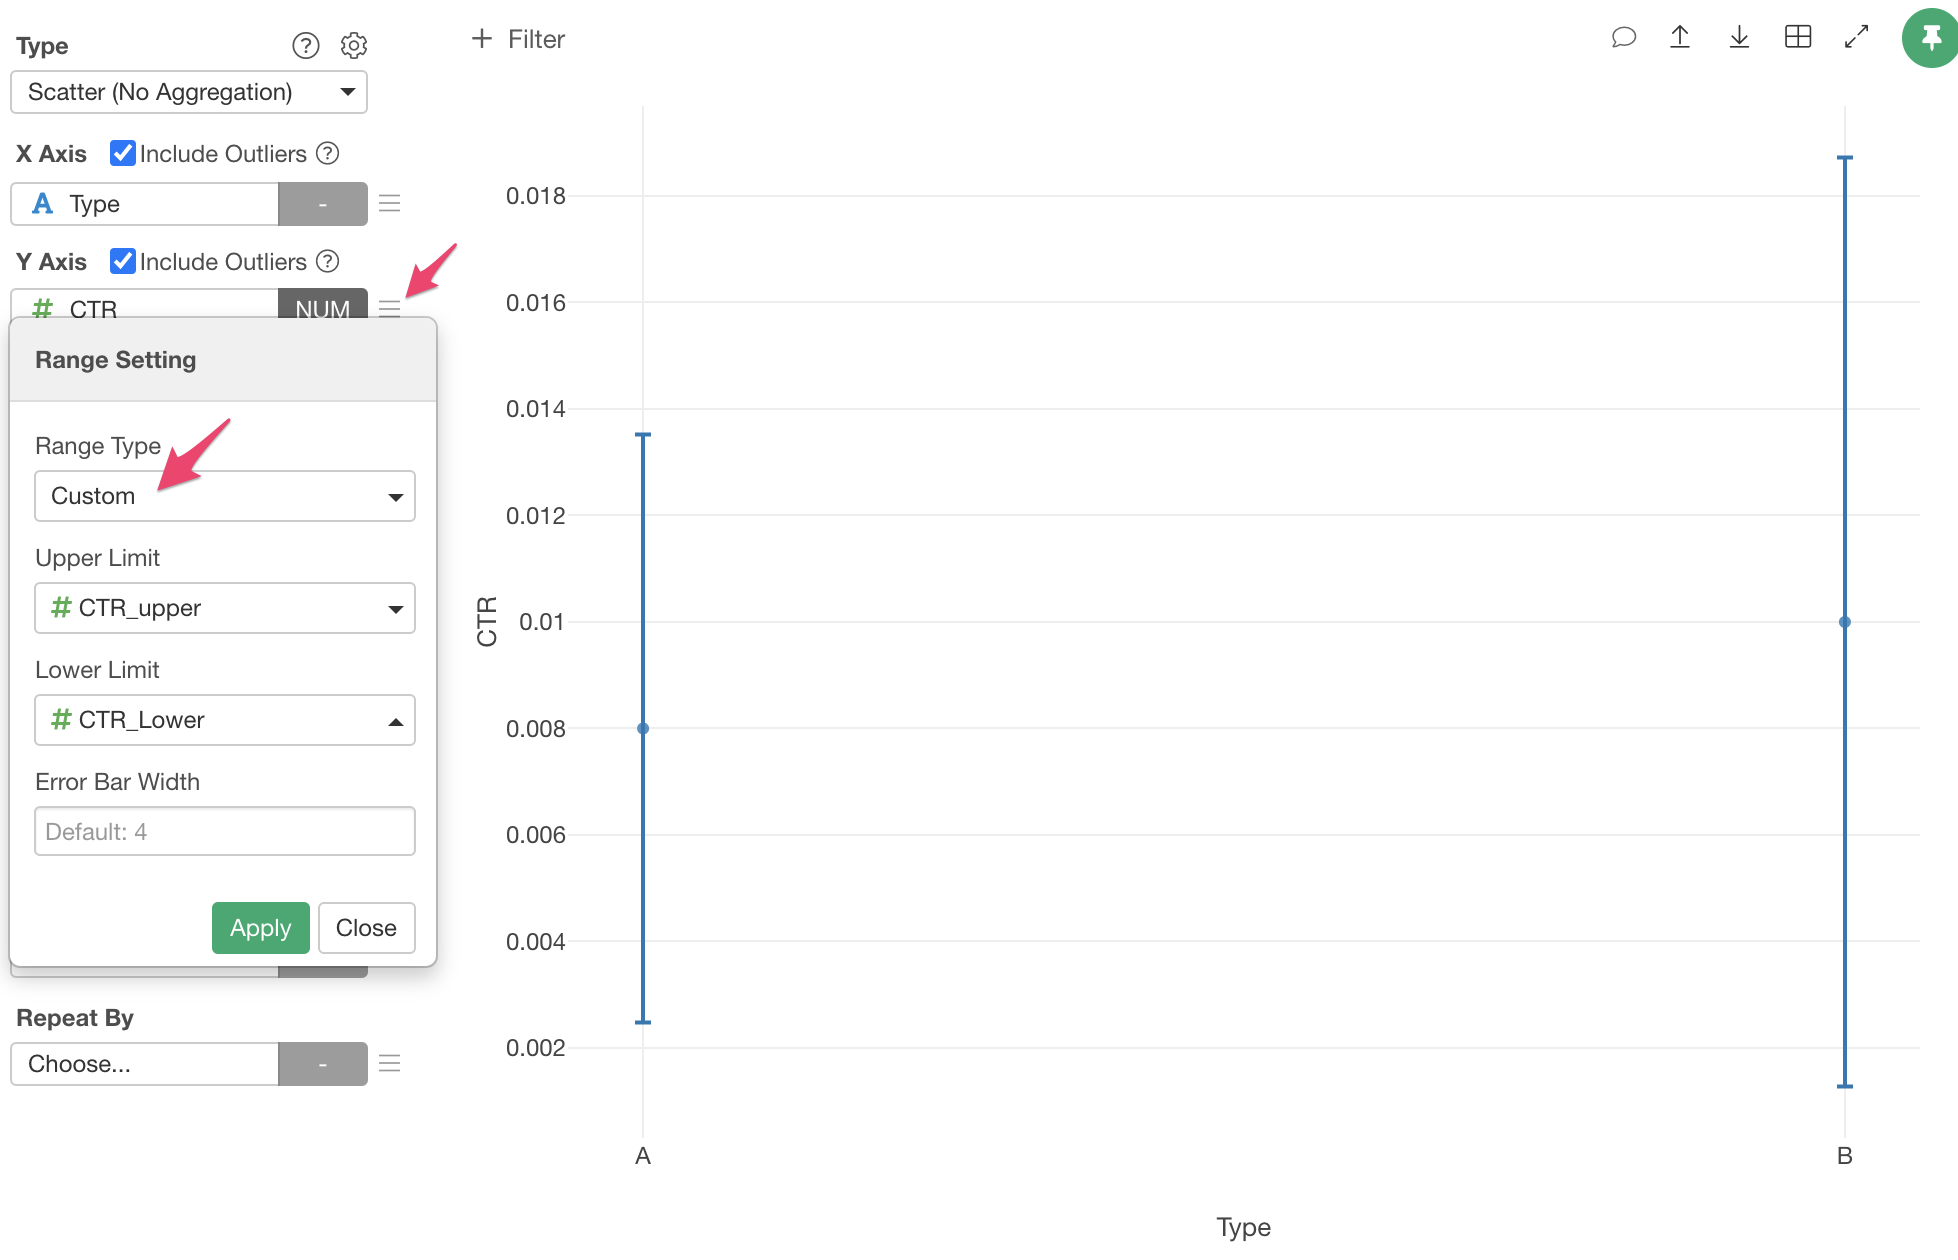
You can visualize CTR values with 95% confidence interval ranges using the "Scatter (No Aggregation)" chart by following the steps below.
- Click "Chart" to open Chart View.
- Choose "Scatter (No Aggregation)" for Type.
- Choose "Type" for X-Axis.
- Choose "CTR" for Y-Axis.
- Choose the "Range" menu from the Y-Axis menu dropdown.
- Choose "Custom" for the Range Type. It will automatically assign "CTR_upper" and "CTR_lower" columns for Upper and Lower Limit.
- Click "Apply".
It will show the CTR values with 95% confidence interval ranges.
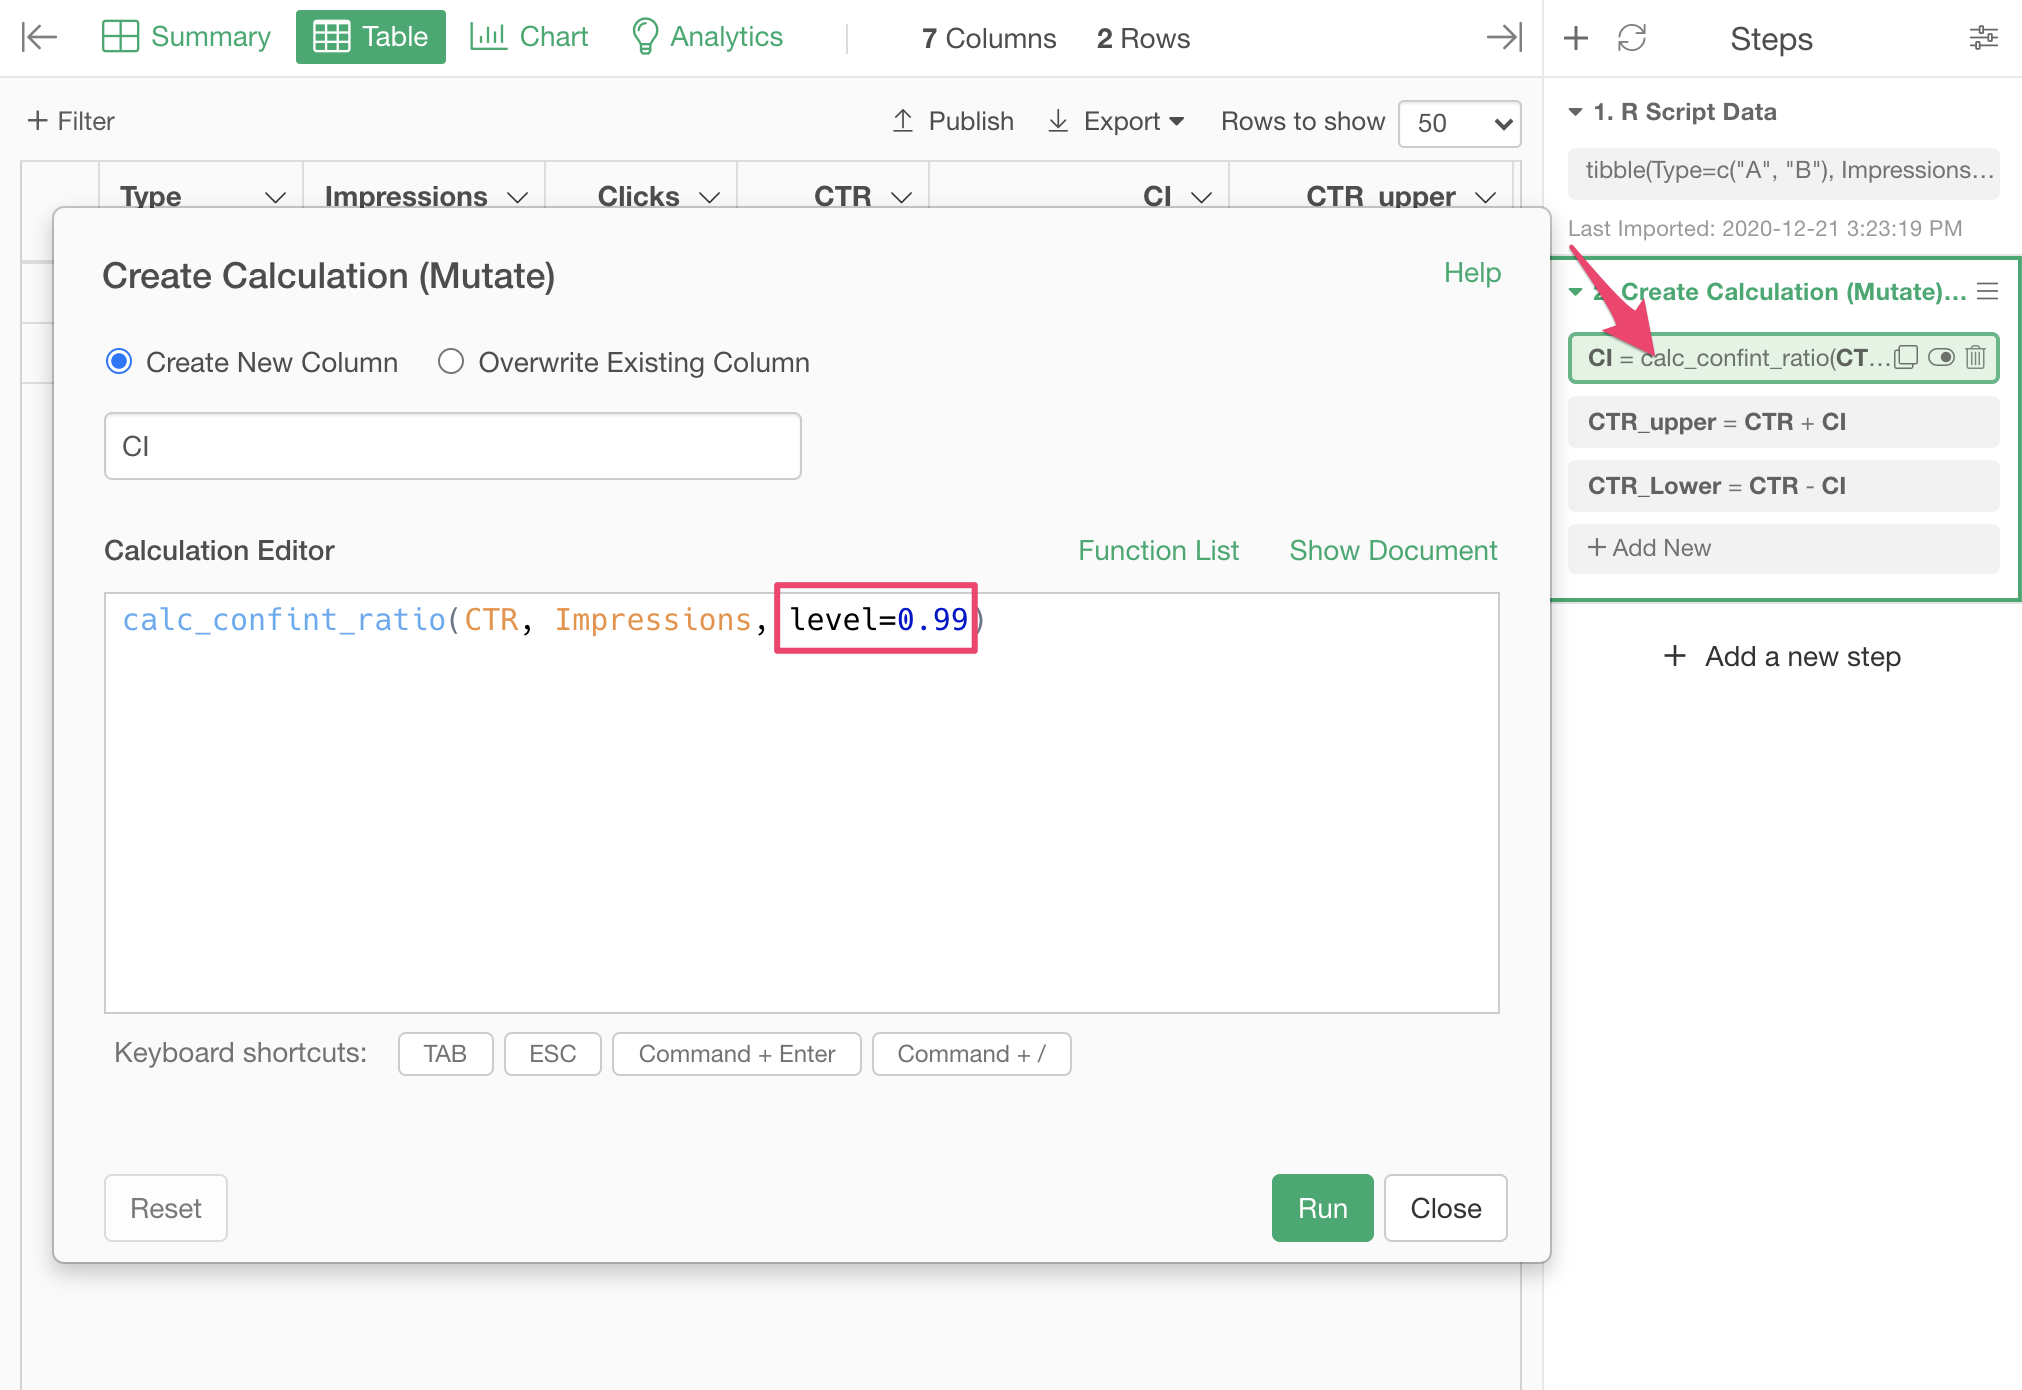
Calculating 99% Confidence Intervals
You can change the percentage of the confidence intervals by setting the "level" option to the "calc_confint_ratio" function. If you don't specify it, "95%" is used by default. You can change it to "99%" for example by the following steps.
- Click the token that we created the "CI" column in the steps.
- Add "level=0.99" option to the calc_confint_ratio function call.
- Click Run.
Calculating Confidence Intervals for Mean Values
We have seen how to calculate confidence intervals for the ratio values. But, what if we want to calculate the confidence intervals for the mean (average) values? There is a function called "calc_confint_mean" that can do the trick.
calc_confint_mean(<Standard Deviation of the group>, <Sample Size>, level=0.95)See the function reference for details.