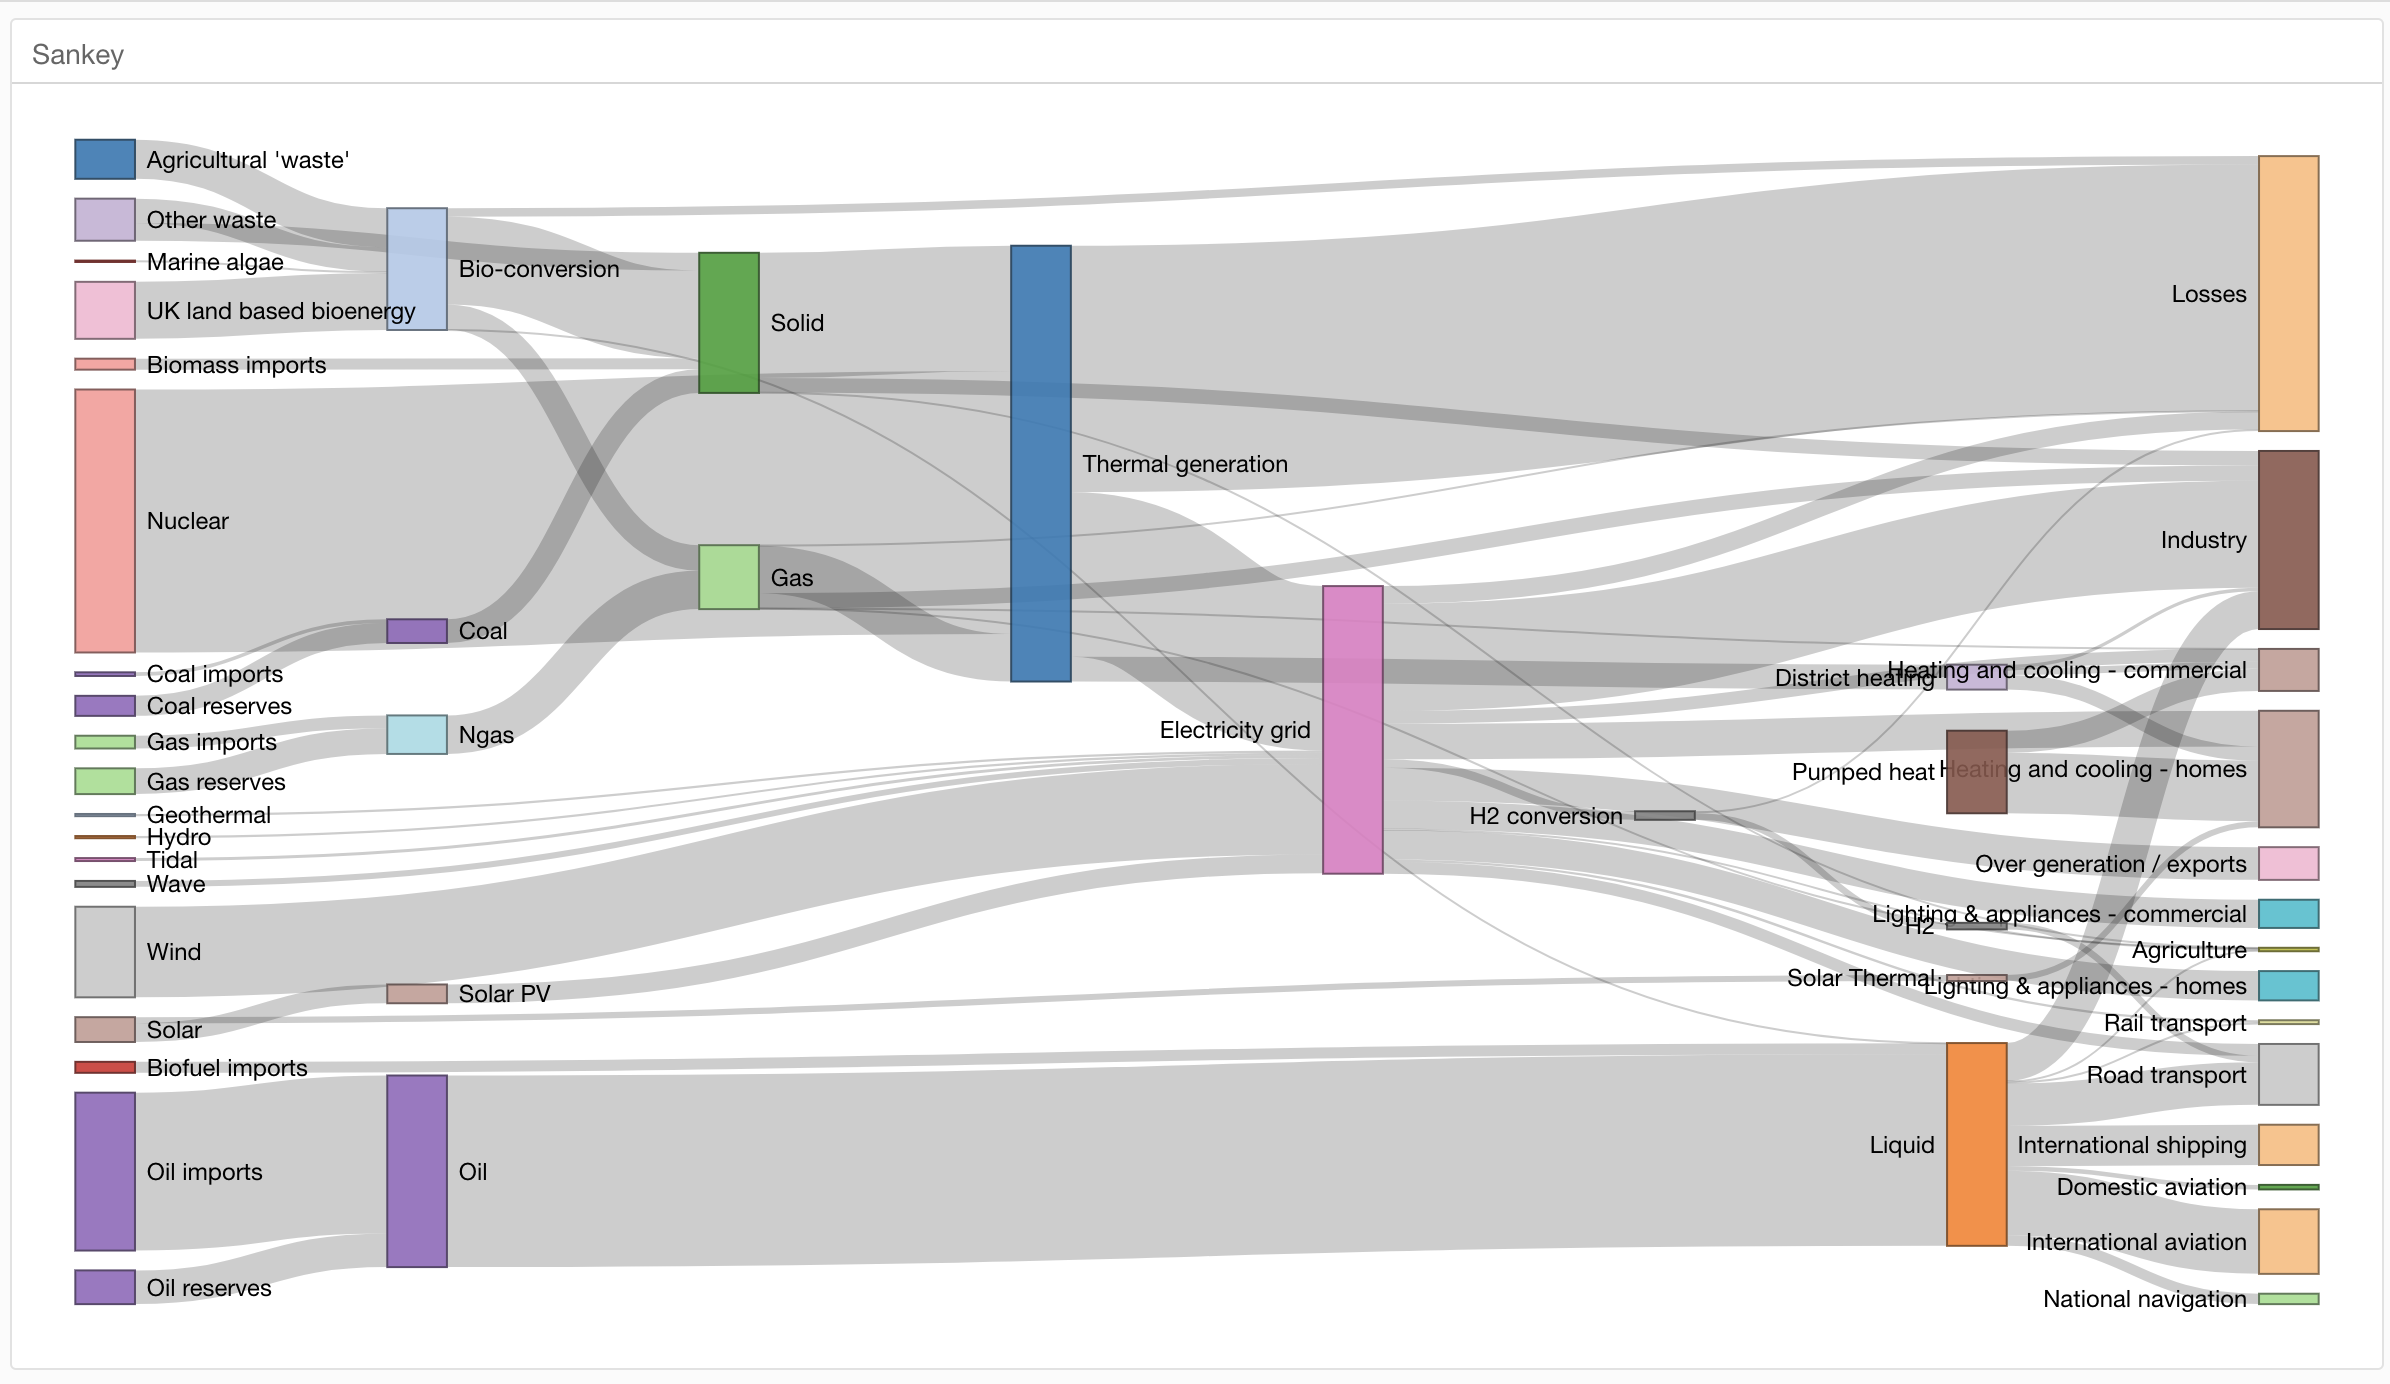
How to Create a Sankey Chart in Exploratory
It describes how to create a Sankey chart in Exploratory using Note/Dashboard.
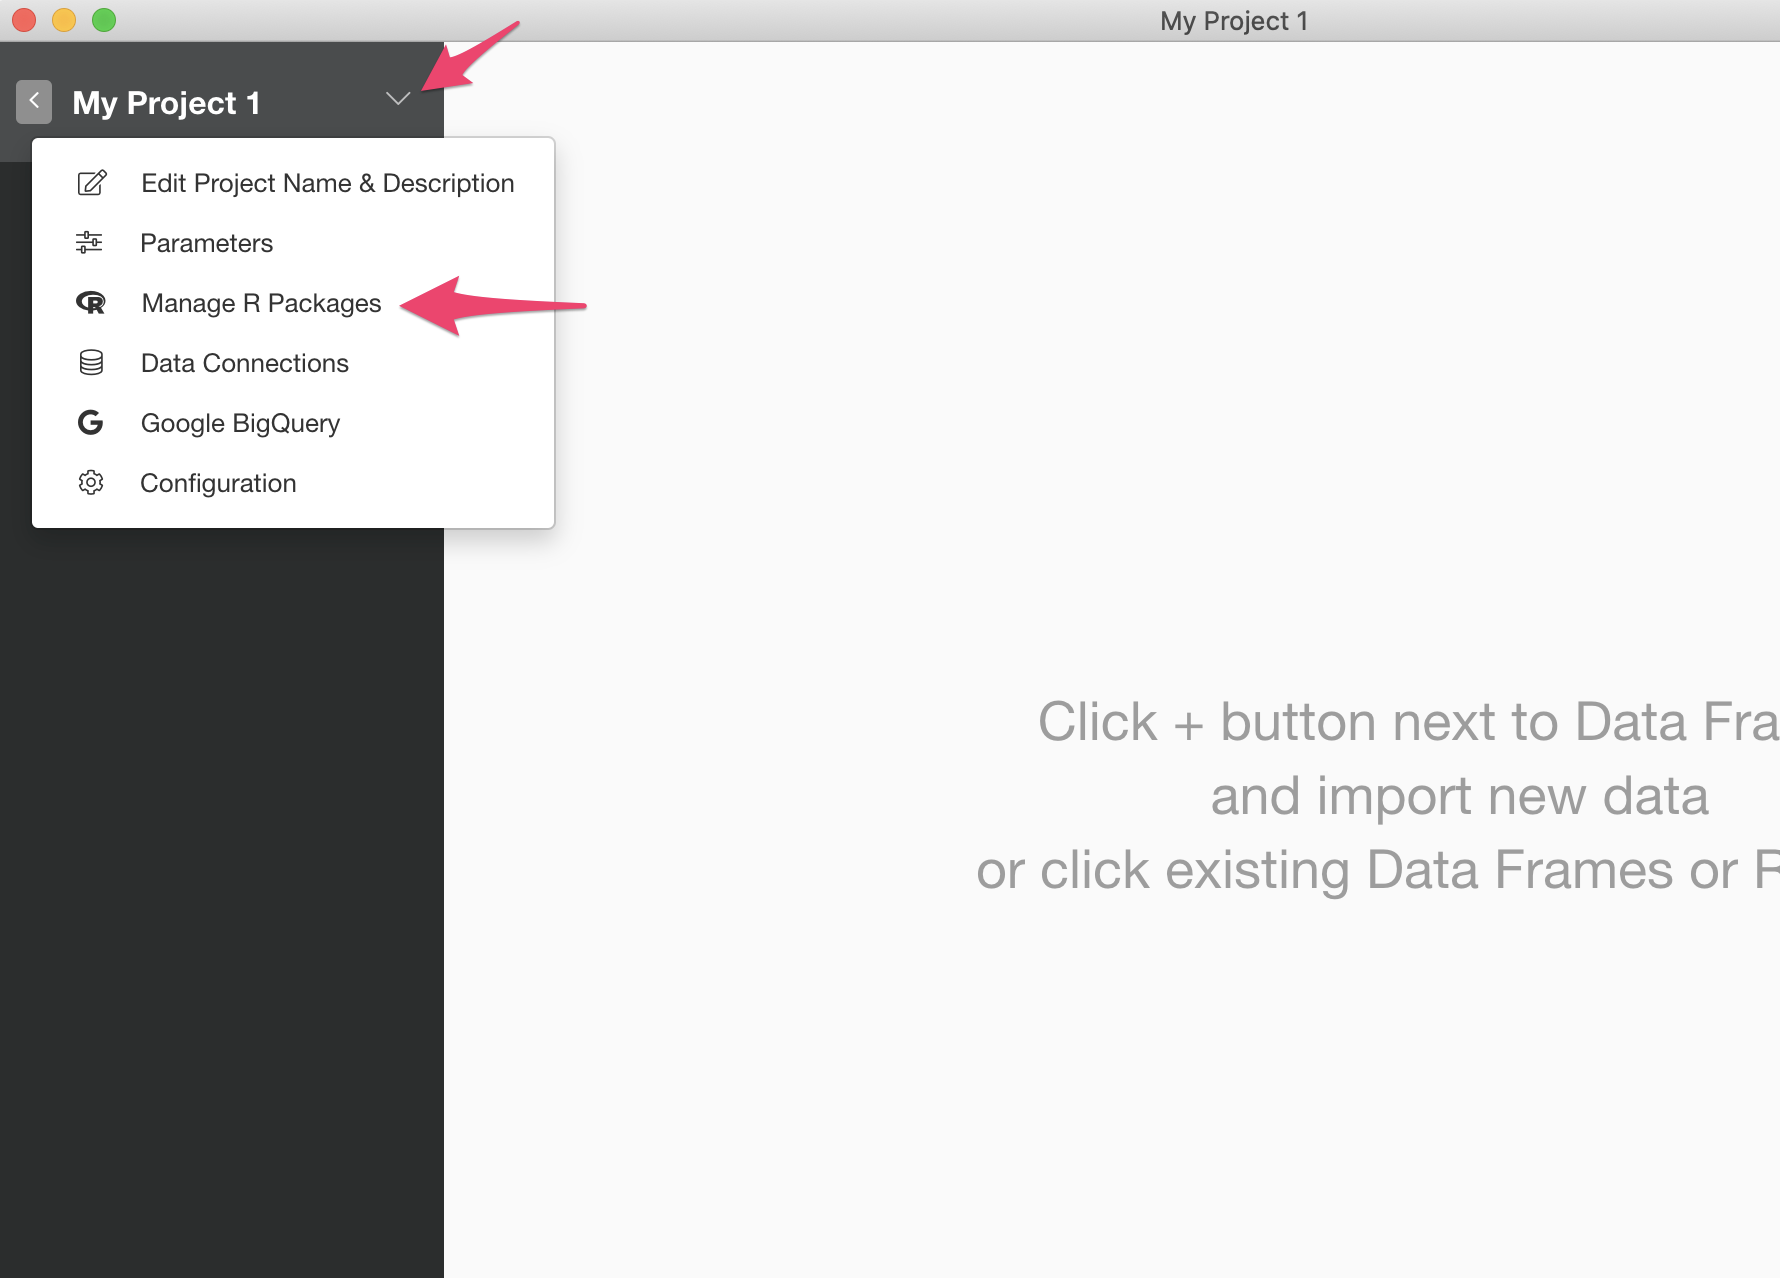
First, you need to install "networkD3" R package into your Exploratory Desktop. Select "Manage R Packages" menu from the project menu.
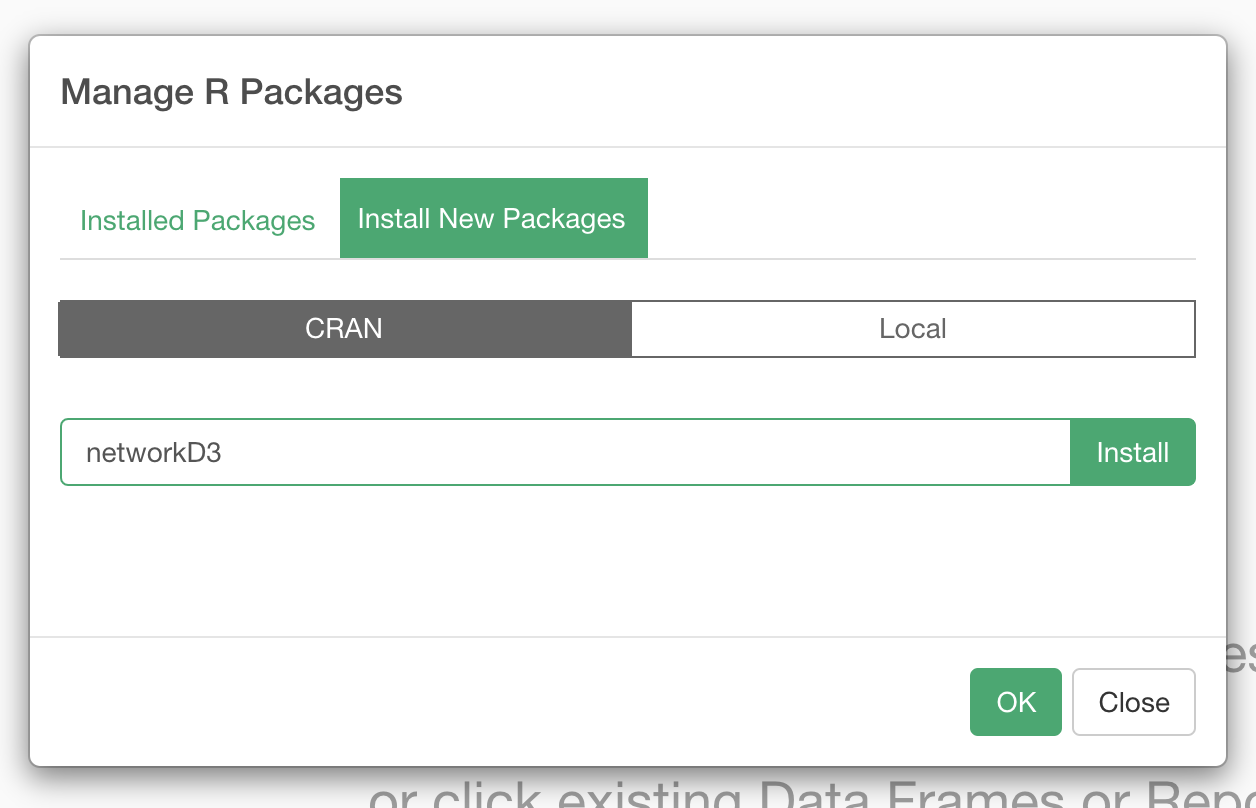
It will open "Manage R Packages" dialog. Click "Install New Packages" tab, type in "networkD3" and hit "Install" button to install the package.
Suppose you already have 2 data frames for the Sankey chart. (I will talk about how to download the sample data as well as the sample Dashboard later.) Open a project, create a new Note and cut and paste the R Markdown code below into your Note.
<script src="libs/d3-4.5.0/d3.min.js"></script>
<script src="libs/sankey-1/sankey.js"></script>
<script src="libs/sankeyNetwork-binding-0.4/sankeyNetwork.js"></script>
```{r}
# Load package
library(networkD3)
# Plot it
sankeyNetwork(Links = Energy_links,
Nodes = Energy_nodes,
Source = "source",
Target = "target",
Value = "value",
NodeID = "name",
units = "TWh",
fontSize = 12,
height = 800,
nodeWidth = 30)
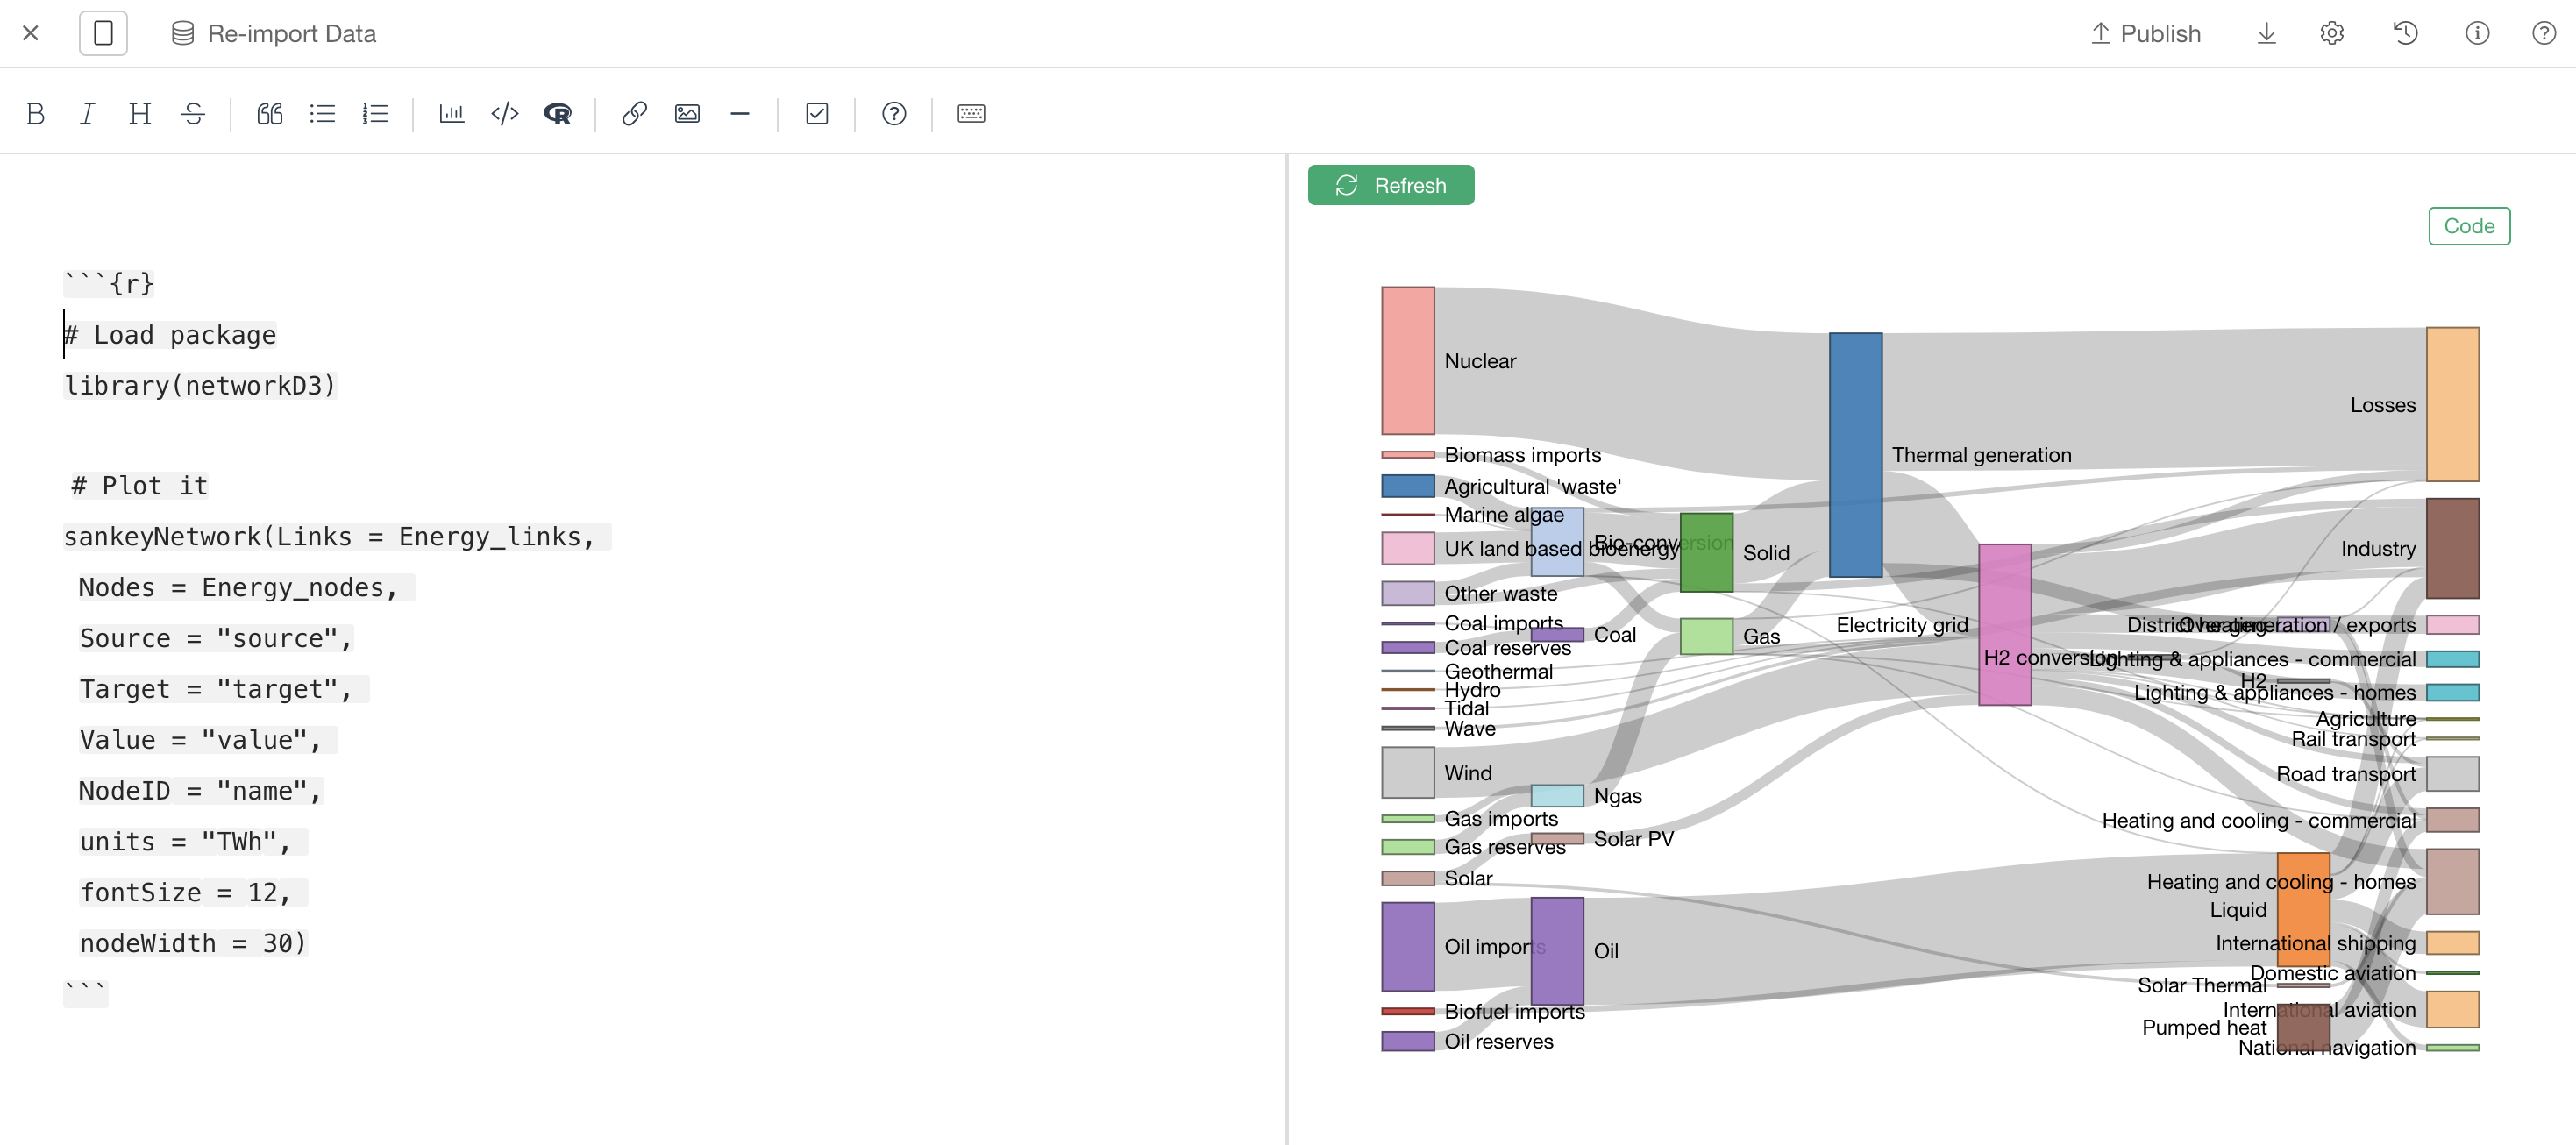
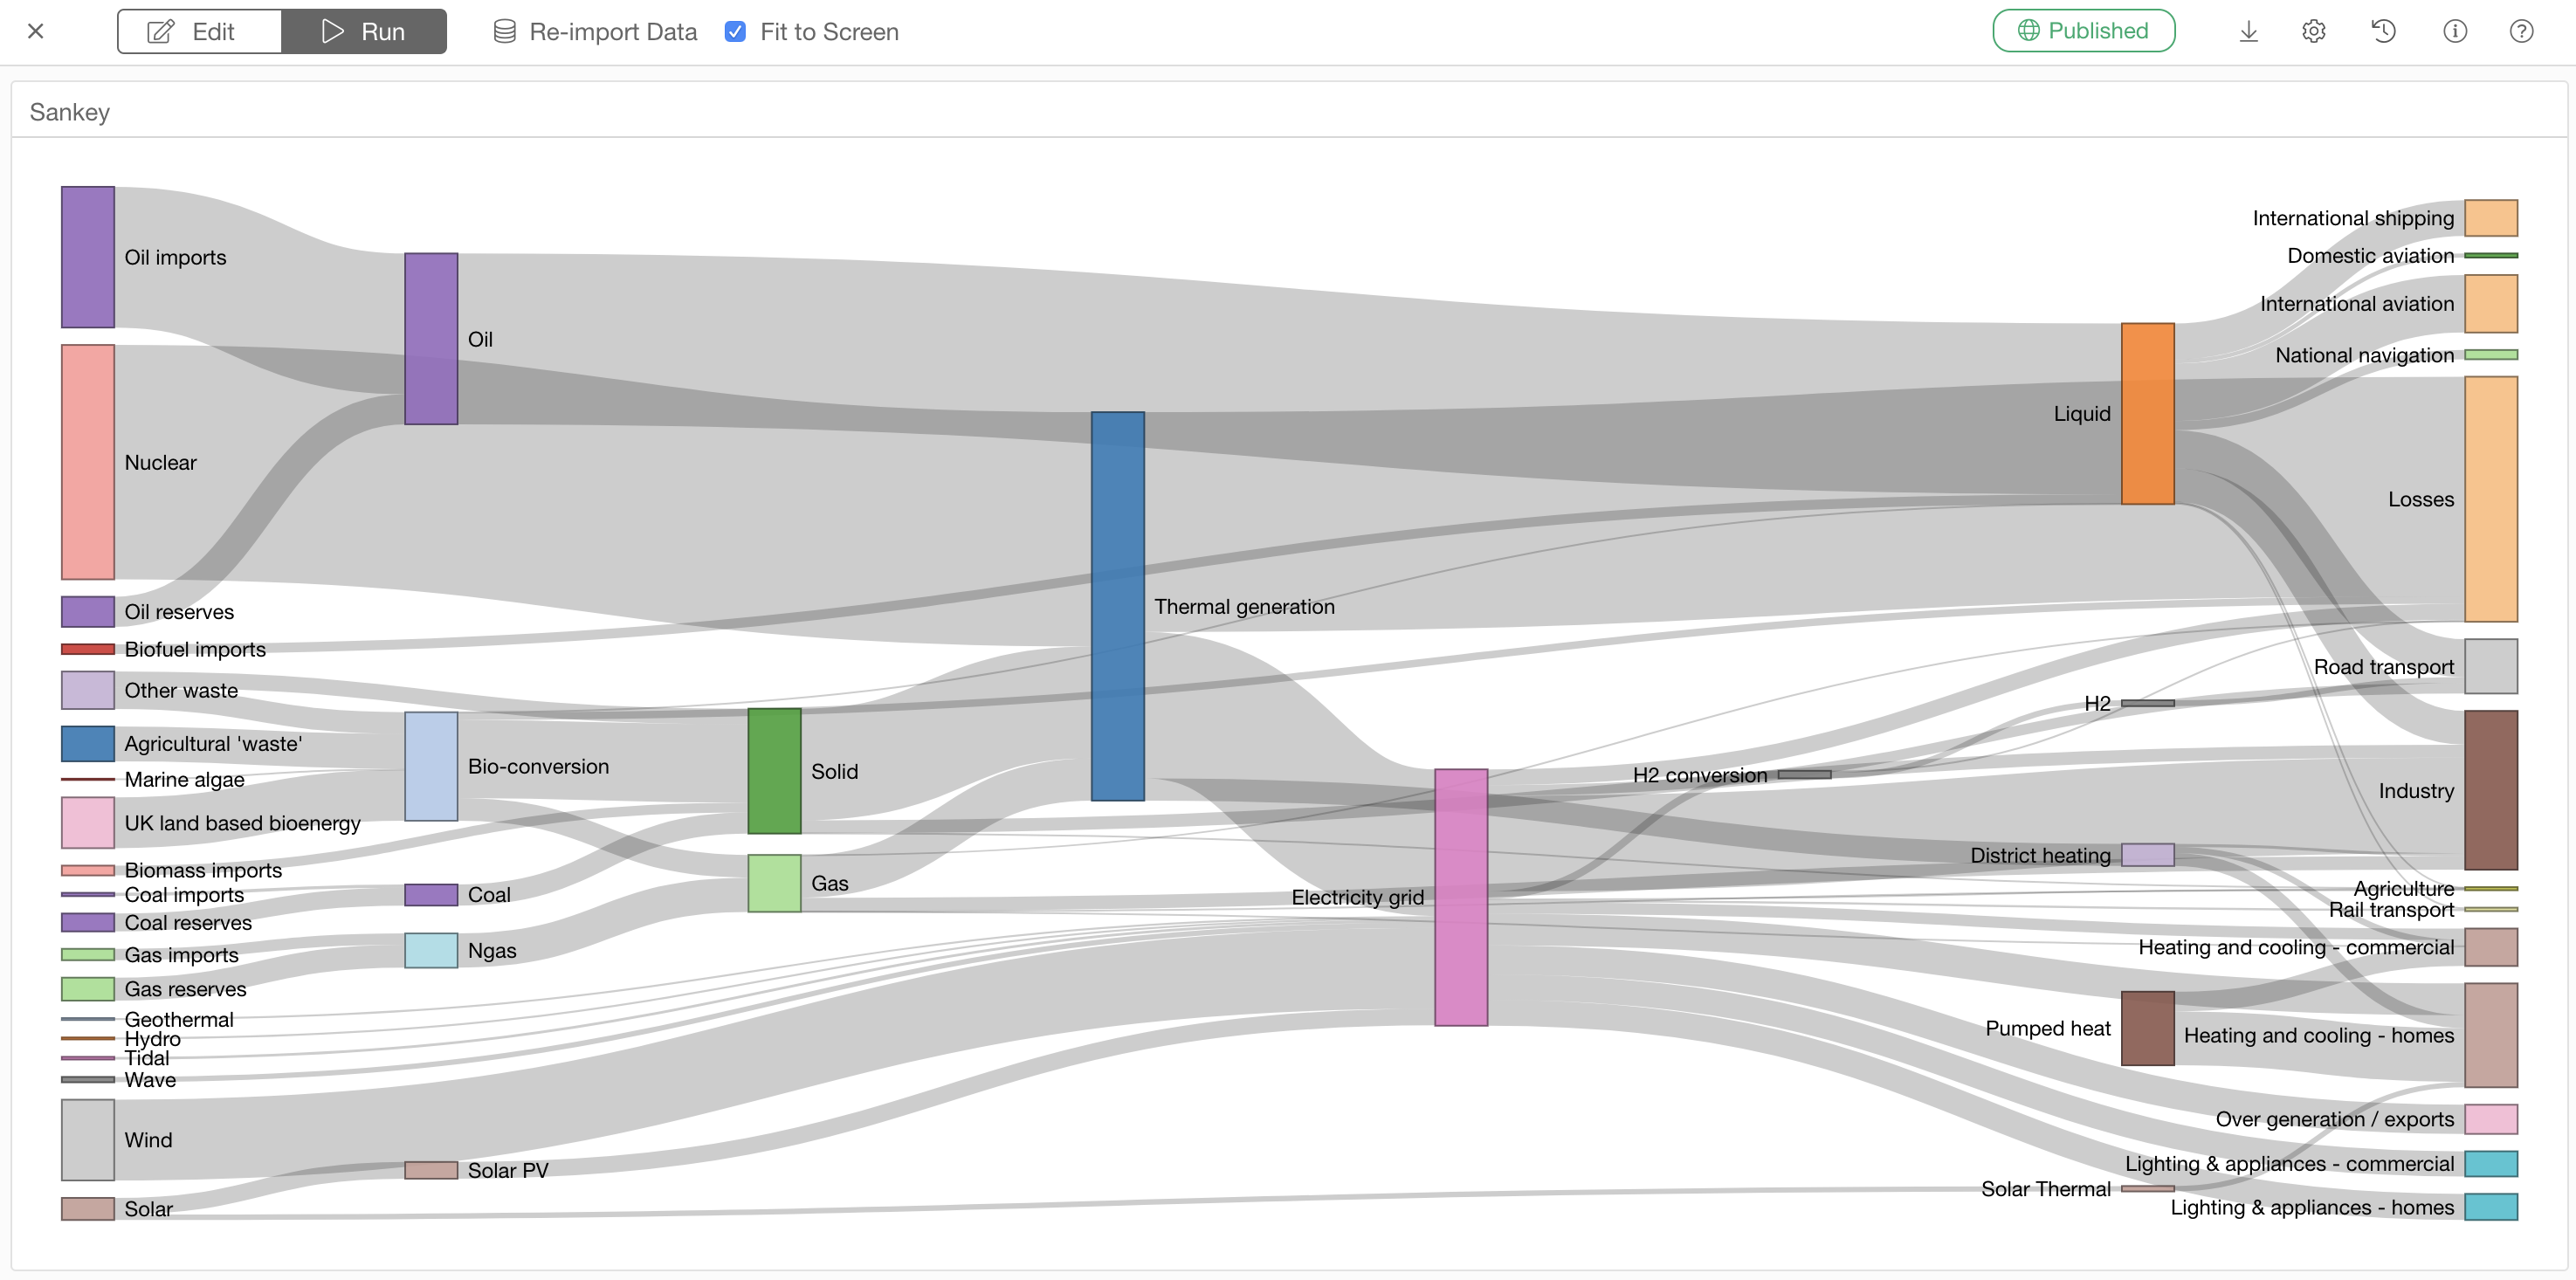
```Click the refresh button to run the Note. You will see the Sankey chart in the preview screen on the right hand side.
If you want to add it to a Dashboard, add a new text panel in your Dashboard and add the same R Markdown code into the "Text" field of the text panel.

Click "Run" button at the top to see the output.
You can look at the live Dashbaord example in here. You can also download the EDF file that contains the data and dashboard from that page. If you are interested in, please download the EDF, import it into your Exploratory and try it. Enjoy!
Tips
- You can adjust the height by changing the "height" parameter.
- If you want to create those data frames by yourself, you have to make sure that the values in the source and target columns of the data frame corresponding to Energy_Links and the rows existing in the data frame corresponding to Energy_Edge should match. Please check out those two data frames that come with the EDF.