How to Make a Big Hit App
Source Data: Google Playstore Rate & Review Data
Data Preparation
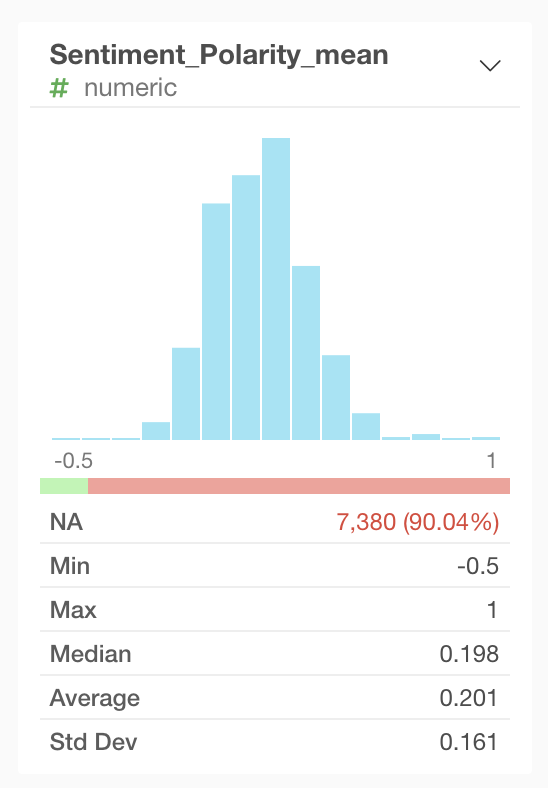
At the first look of the data on Exploratory, I found that there were review data with the sentiment information and looked interesting. So what I did first was to calculate the average of those sentiment related values for each App.
After calculating the average of sentiment related values by “group by” and “summarize” operations, I found that not all of the Apps have the review/sentiment information.
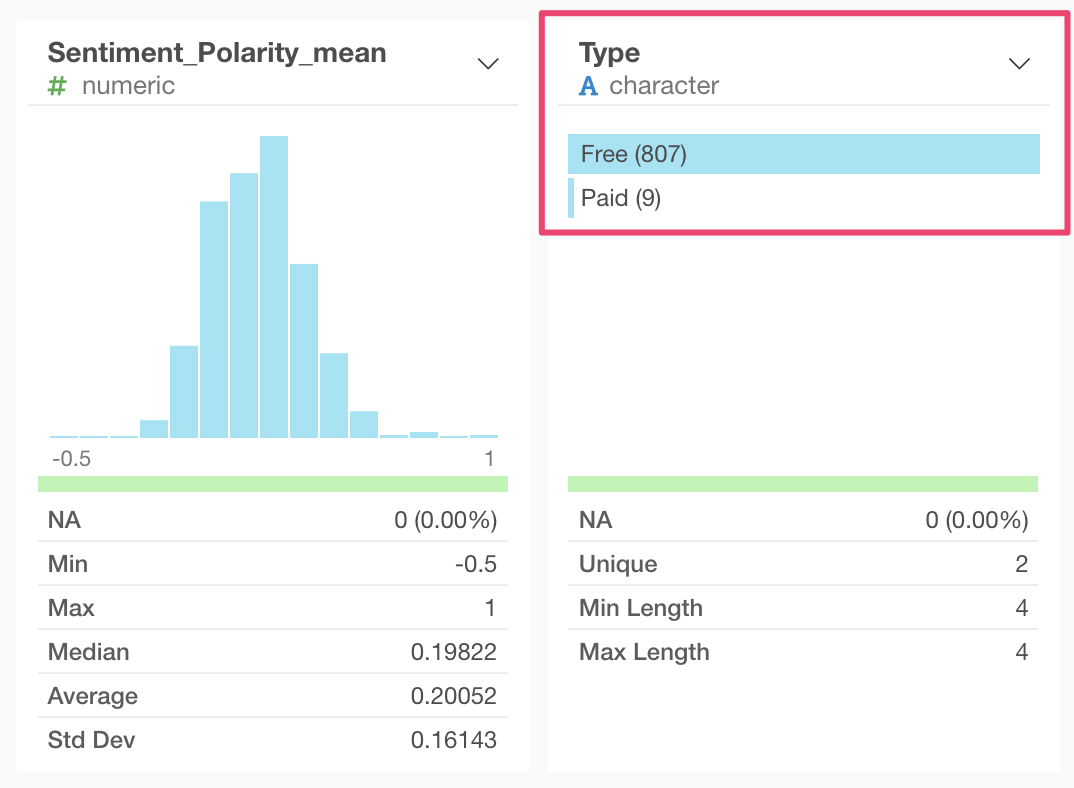
I filtered NAs because the sentiment was my interest. After filtering the data, I found that there were only 9 Paid Apps, and the rest of them were Free. I thought the trend should be different between Free and Paid Apps, so here, I filtered those 9 Paid Apps to focus on Free Apps.
I extracted the number from the Installs. I wanted to see the distribution in detail so I clicked the chart icon to see it in the chart view.
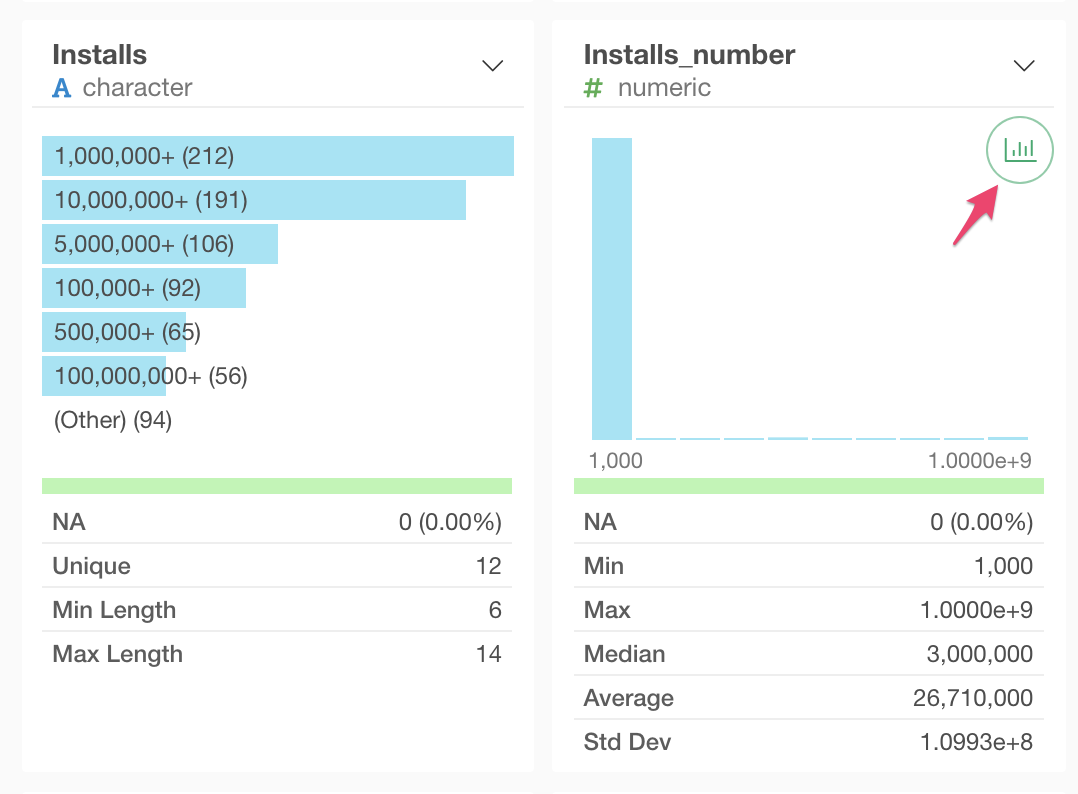
If I set the bucket to 50, then the chart looked like following.
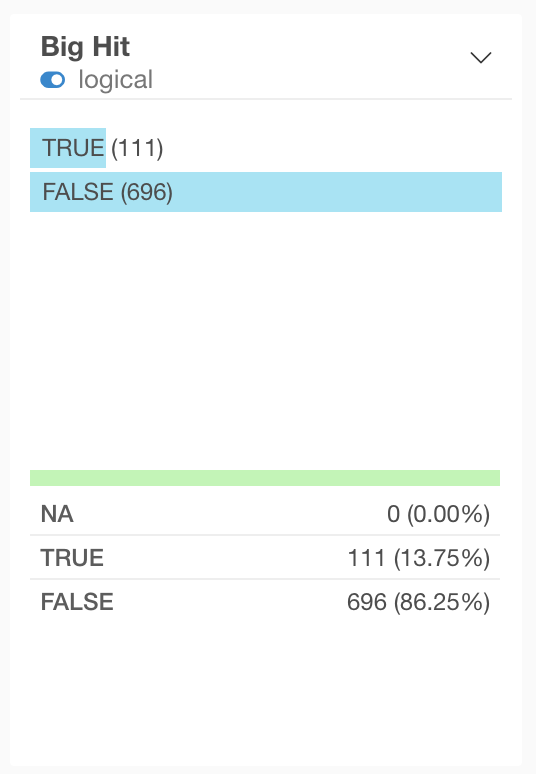
I separated the Apps into 2 groups, “Big Hit” or not by making the very left, tall bar as “Not Big Hit”, and the rest of bars as “Big Hit”.
Analysis
What I want to know, and probably everybody wants to know is how to make a big hit. So the first thing that I did was running the Logistic Regression against the “Big Hit” column. I used the SMOTE option because I knew the data was biased.
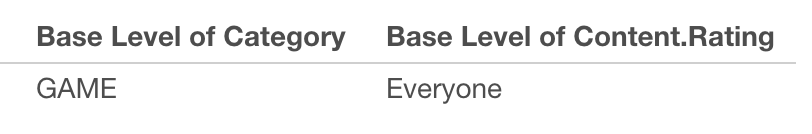
It shows the higher rating is the key for the Big Hit Apps. This is reasonable. Also, Apps with “17+” or “teen” Content Rating have a positive impact than “everyone” Content Rating (because the base level of Content Rating is “everyone”, see the base levels below).
If you look at the categories, many categories have negative impacts. The base level of Category is “GAME”, so “GAME” probably the best pick for the Big Hit.
The most interesting thing is, the average of the Sentiment Polarity has a negative impact on the Big Hit. The Sentiment Polarity value becomes positive if the review sentiment is positive, and negative if the sentiment is negative. So this means, you have less chance of winning a Big Hit if your App has more positive sentiment reviews. Very interesting.
Check with Charts
The next thing I did was to confirm the Logistic Regression results.
This is the Big Hit Ratio by Ratings. You need a higher rating for sure. The interesting thing is there is no Big Hit in the highest bucket. The rating should be good, but it shouldn’t be too good.
This is by Category. As I expected, GAME has the highest Big Hit App ratio.
This is by Content Rating. You should target “Teen” if you want a Big Hit.
And this is by the Sentiment Polarity. I split values into equal-length buckets. It shows an interesting result. Big Hit Apps are in either the highest bucket or lower buckets.
Ok, ok, tell me the success formula!
The last thing I did was running the Decision Tree Algorithm to see the decision rules. I used SMOTE too here to adjust the imbalanced data. The bottom right circle has 18% of the whole data and 80% of its data is TRUE, so we should shoot that.
So the rules are,
- Pick the right category. “GAME” probably the best.
- Rating should be greater than or equal to 4.1.
- Sentiment Polarity average should be less than 0.12.
Please invite me a party if you read this and win a Big Hit :)