How to Use Custom Calculation in Pivot Table and Chart
Overview
In Exploratory, there are a couple of places you can use your own Custom Calculation for summarizing data.
- Charts that do the aggregation such as;
- Pivot Table: Value
- Summarize Table: Value
- Bar: Y-Axis
- Line: Y-Axis
- Area: Y-Axis
- Pie: Value
- Scatter(with Aggregation): X-Axis, Y-Axis, Color, Size
- Error Bar: Y-Axis
- Map (Standard): Color, Size
- Map (Extension): Color
- Map (Long/Lat): Color, Size
- Heatmap: Color
- Contour: Color
- Number: Value
- Summarize dialog
This note explains how to use the Custom Calculation.
How to Use in Chart
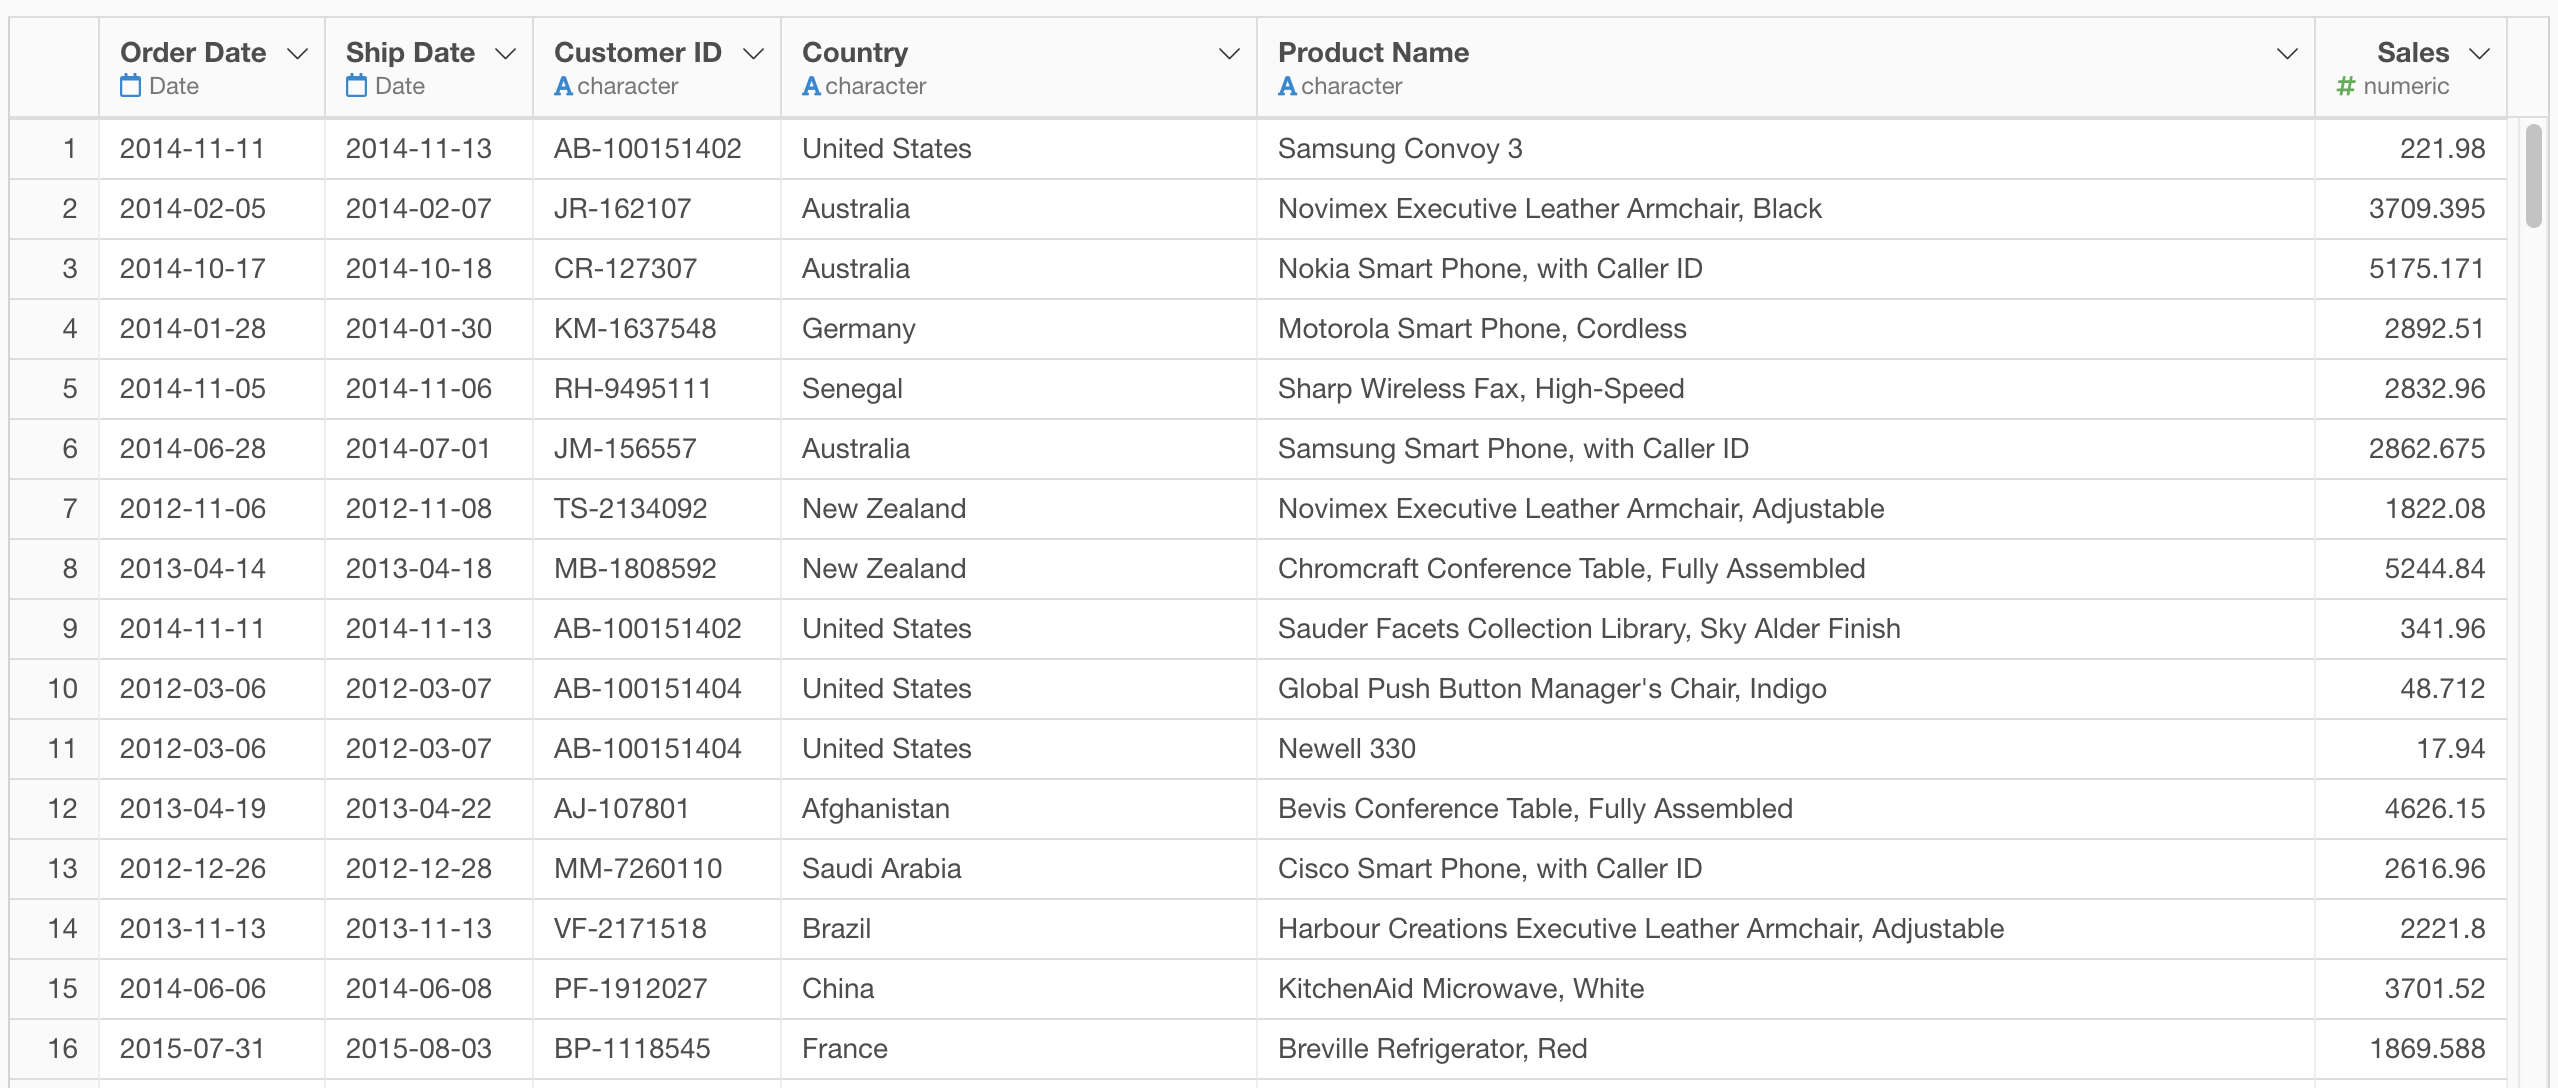
Suppose you have Sales data. Each row represents an order including a country, sales amount, and other information.
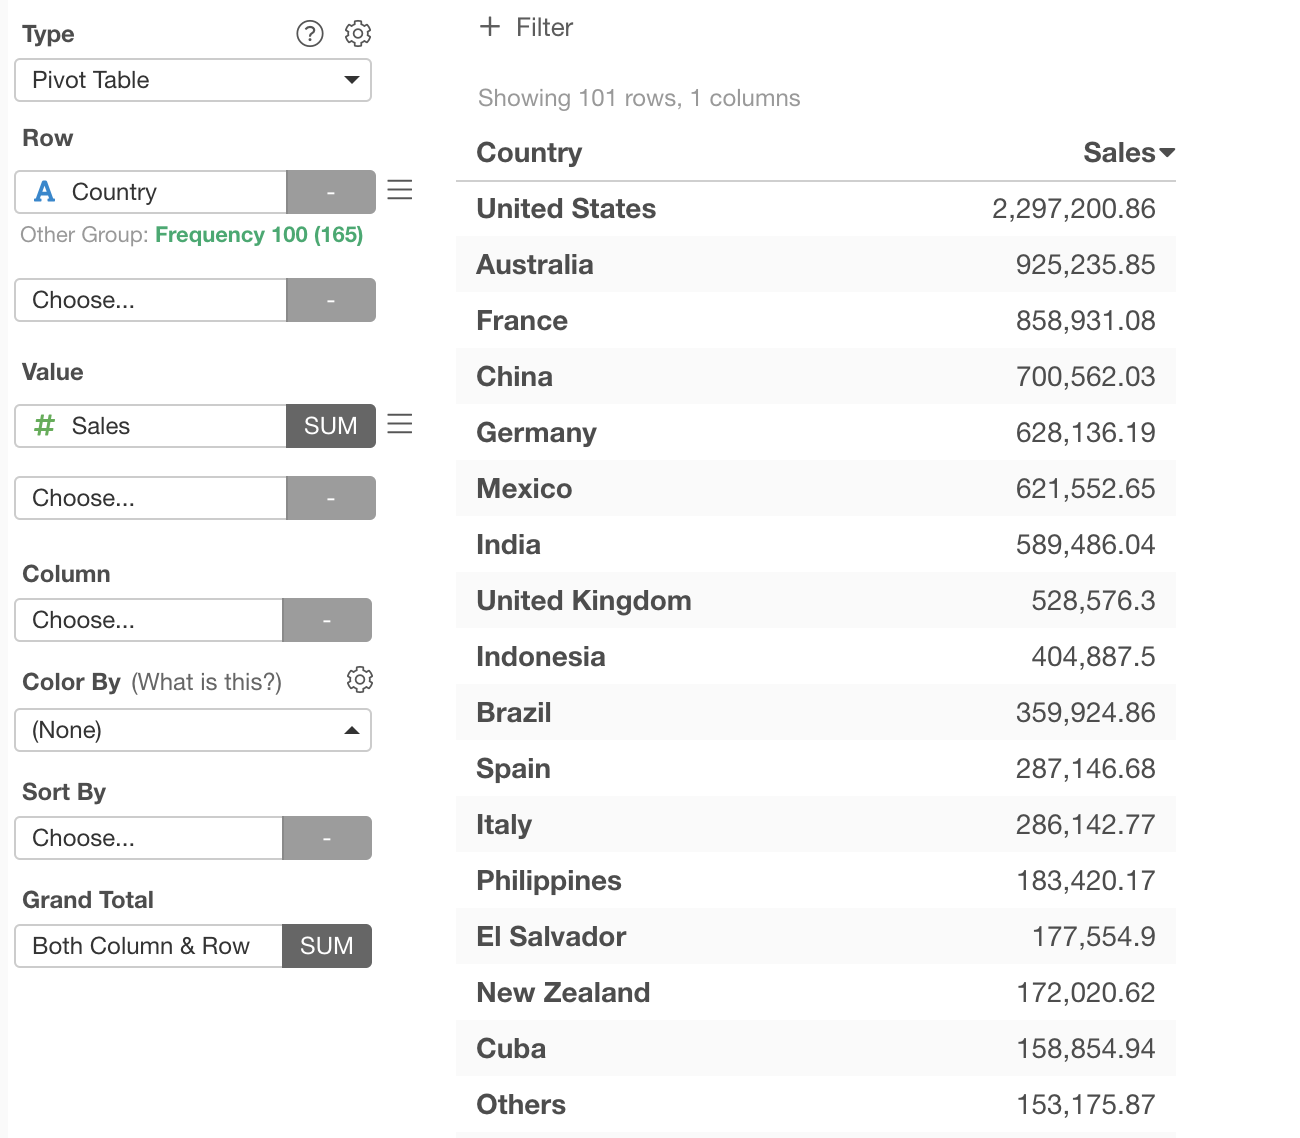
You can use a Pivot Table to show the total sales amount for each country like the following.
Now, you noticed that all the sales values contain a 10% sales tax, and you want to show total sales without the sales tax. You can use the Custom Calculation feature to do that. Here is how.
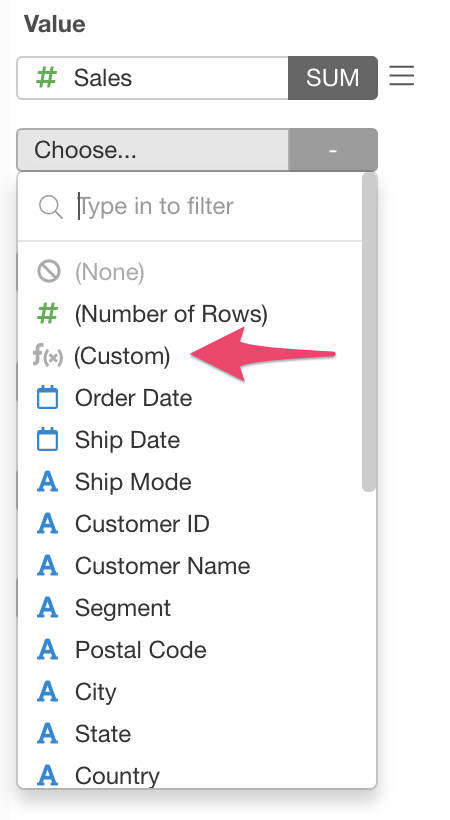
First, at Value, click the 2nd column to open the dropdown menu and choose "(Custom)".
Then, it will open the Custom Calculation dialog. You can add your own R expression in the Expression field. Here, we want total sales amount without a 10% tax, so what we can do is, to sum up all the sales values, then divide it by 110% (1.1). The R expression will look like;
sum(Sales) / 1.1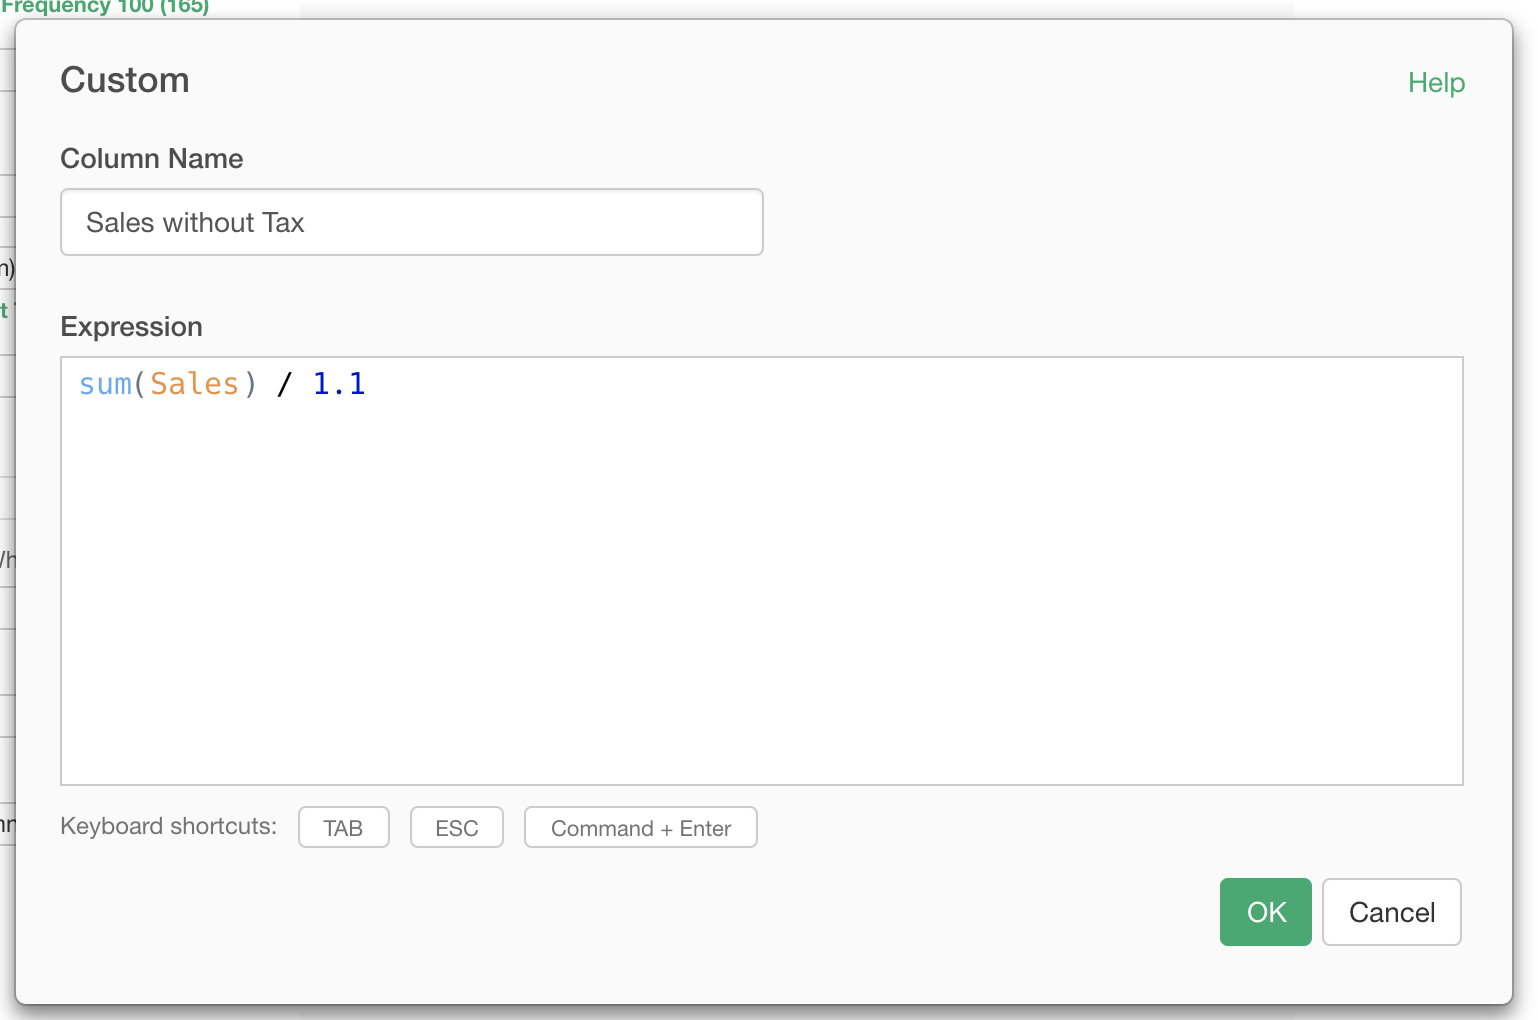
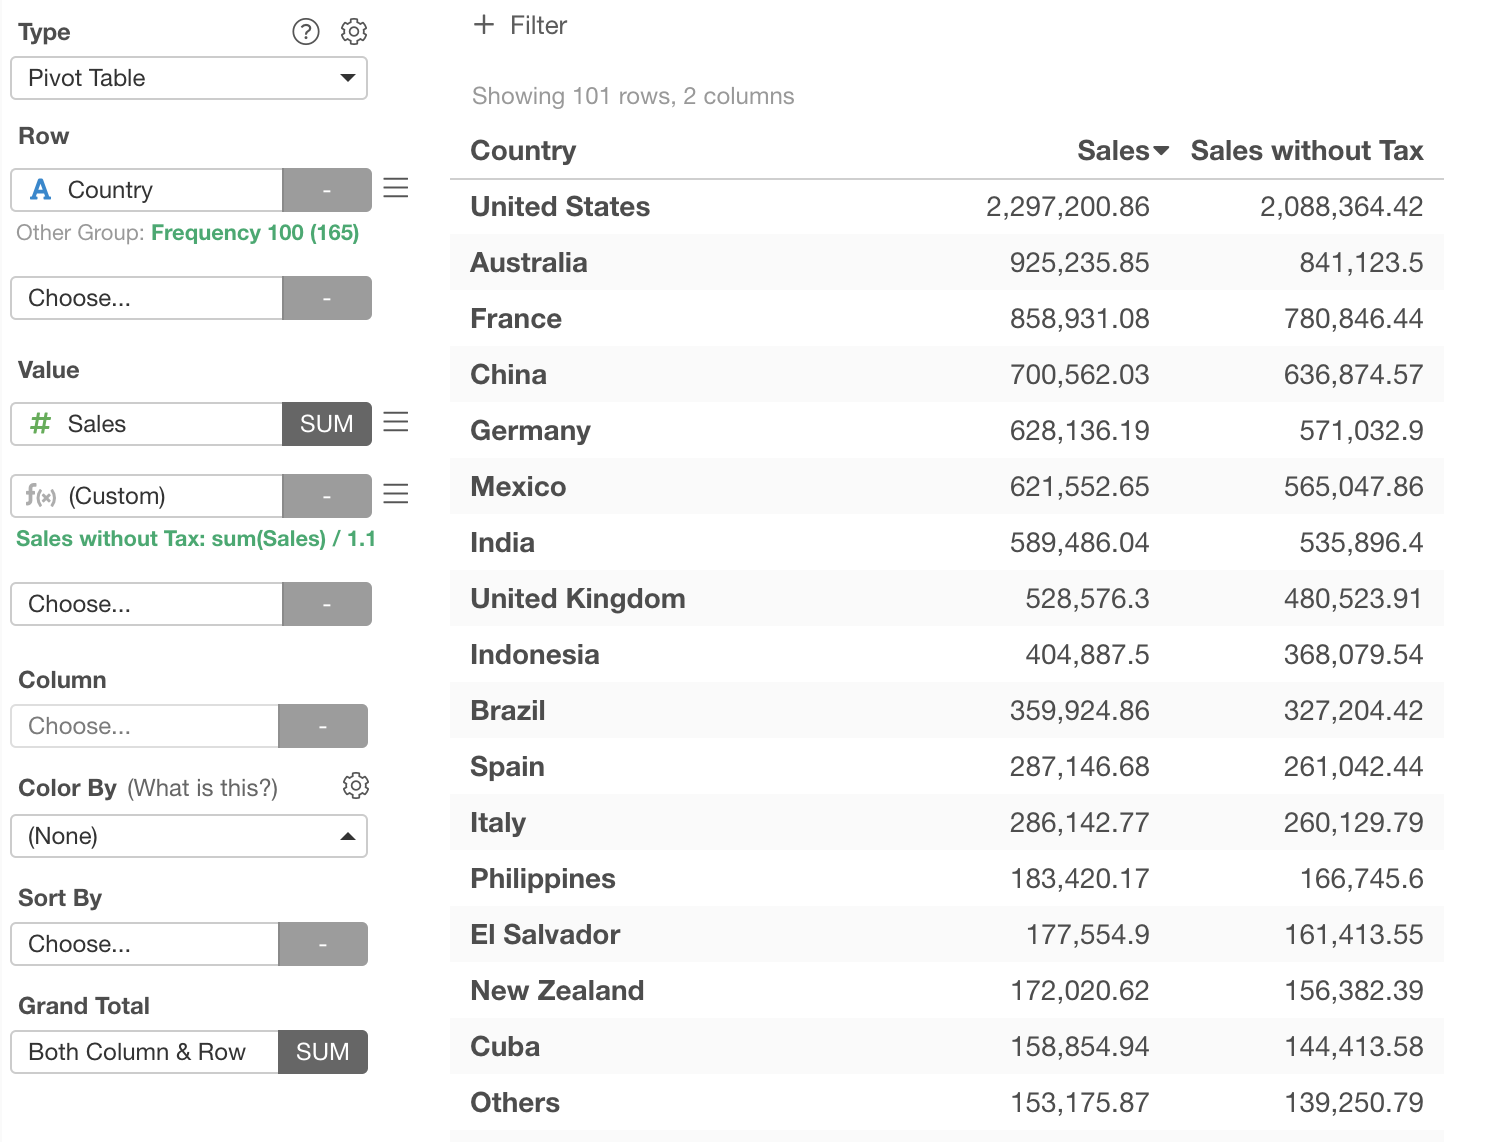
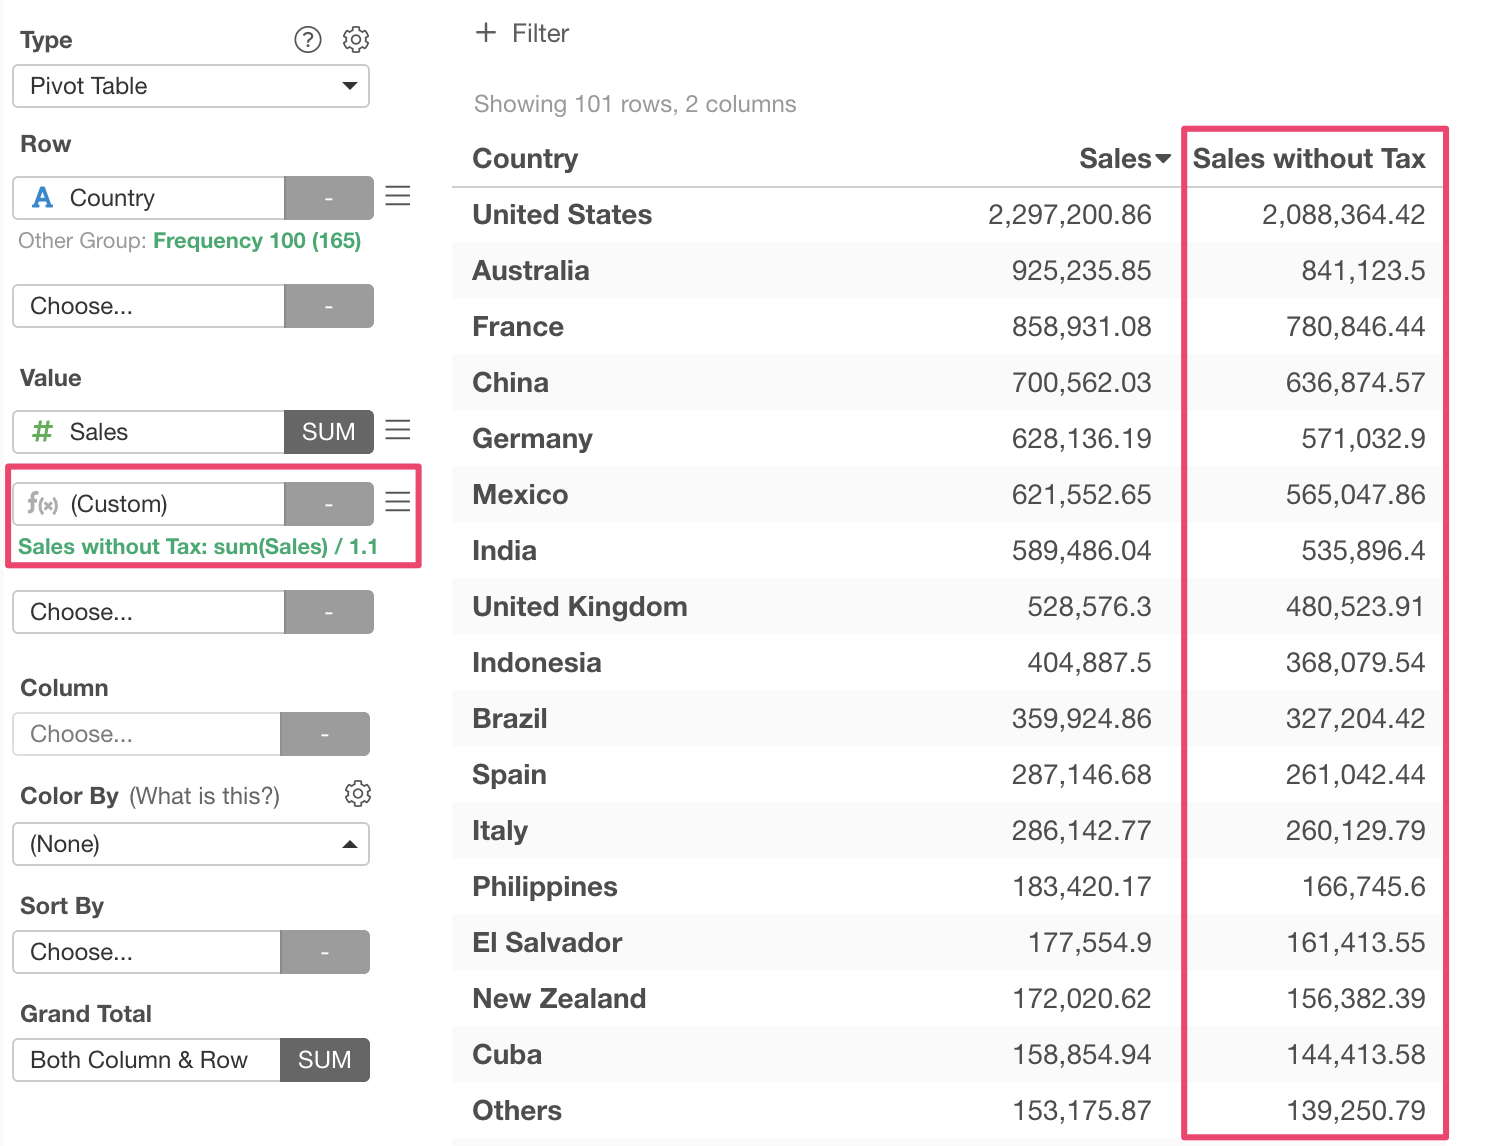
Once you are done with your expression, click the ok button to apply. Then, you will see a new column in Pivot Table showing the total sales amount without a 10% sales tax.
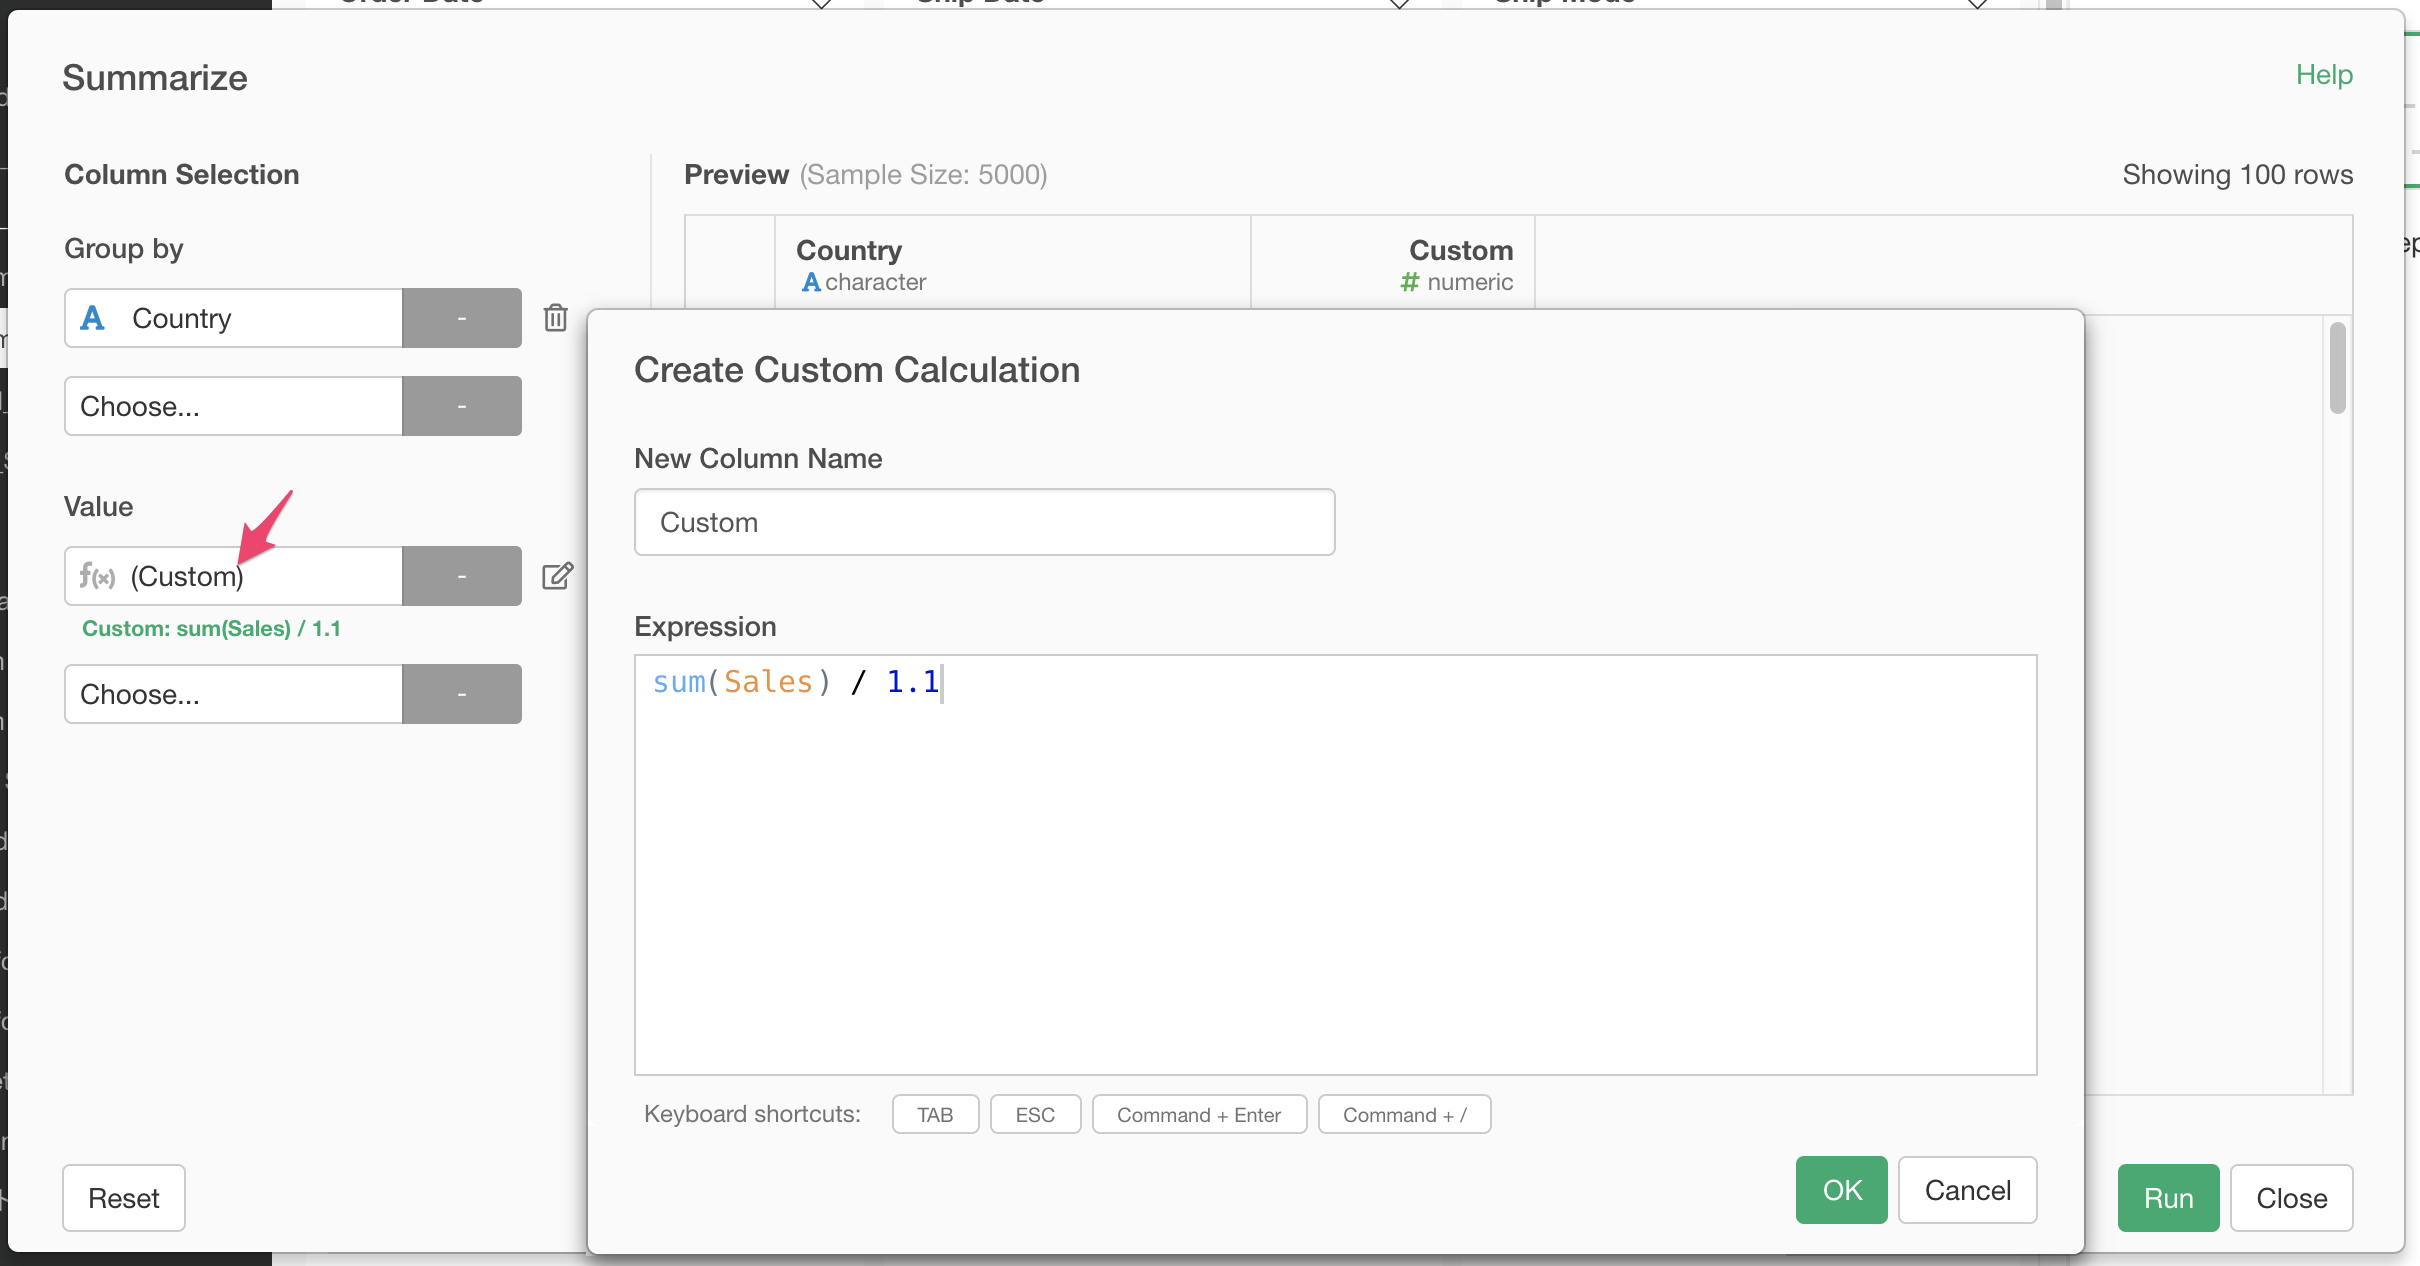
How to Use in Summarize Dialog
In the Summarize dialog, you can choose "(Custom)" at Value to create a Custom Calculation. It will open up the Custom Calculation dialog.
The usage of the Custom Calculation dialog is the same as the one in Chart explained above.
Important Rules
Note that there are 2 important rules here.
- If you refer to a column, it contains a list of values.
- The whole expression should return a single, summarized value, not a list of values.
For example, if you have an expression like the following.
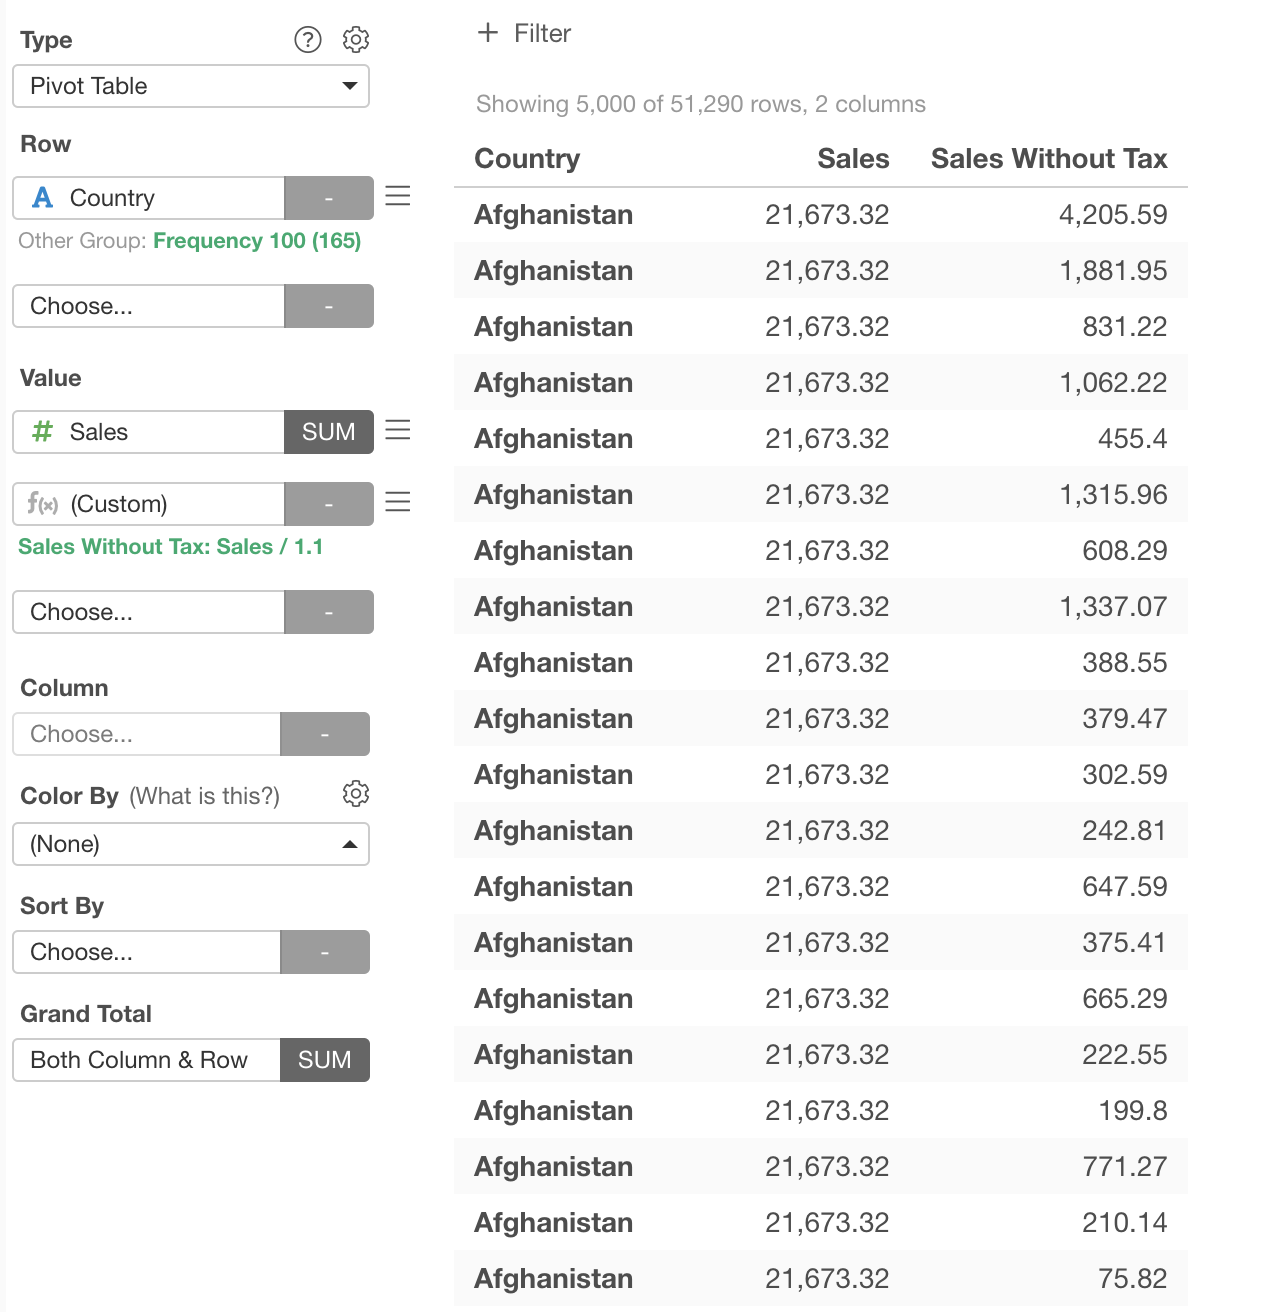
Sales / 1.1The "Sales" is a column that contains a list of sales values for each order, so, it returns a list of sales values before a 10% tax was applied.
Even though the syntax itself is valid, it will show both summarized and non-summarized values in the result and it is easy to get misunderstood by other people. If you are new to Custom Calculation, I recommend following the rules above.
How to Refer "(Number of Rows)"
You can use n() R function to refer the number of rows in the Custom Calculation. For example, if you want to calculate the average of the profit by the sum of (Sales - Marketing) divided by the number of orders (number of rows), the definition of the Custom Calculation looks like the following.
sum(Sales - Marketing) / n()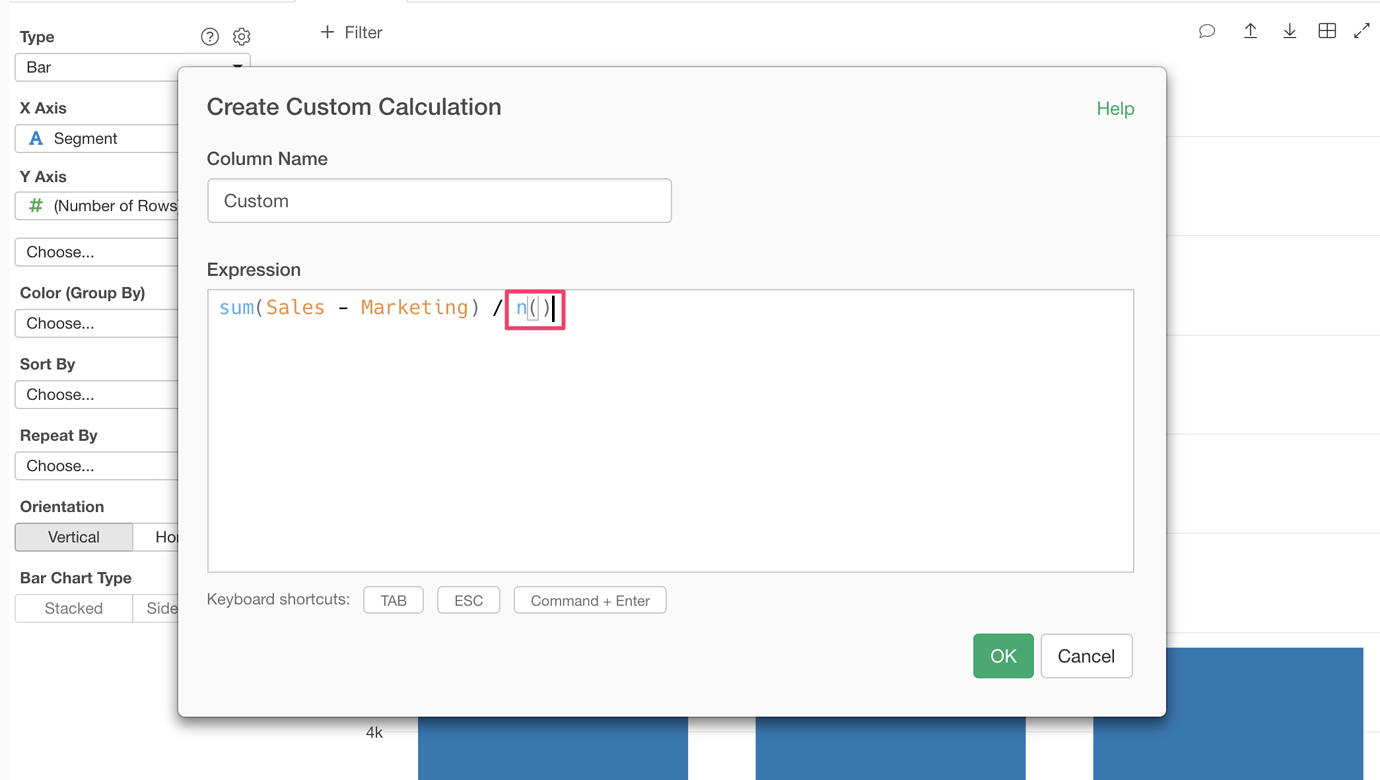
List of Popular Functions
Here is a list of popular functions that you can use in the Custom Calculation.
Note that the word inside the braces such as "Sales" of "sum(Sales)" is a column name. You can add the actual column name that you want to use.
| Function | Description | Example |
|---|---|---|
| sum | Calculates the sum of values | sum(Sales) |
| mean | Calculate the average of values | mean(Sales) |
| max | Returns the largest value | max(Sales) |
| median | Returns the median value | median(Sales) |
| min | Returns the smallest value | min(Sales) |
| first | Returns the 1st value | first(Sales) |
| last | Returns the last value | last(Sales) |
| mode | Returns the most frequent value | mode(Sales) |
| n | Returns the number of rows | n() |
| n_distinct | Returns the number of unique values | n_distinct(User_Id) |